Article

Genetic Background Underlying 5-HT1A Receptor Functioning Affects the Response to Fluoxetine

by
Elena M. Kondaurova
*,†,
Alexander Ya. Rodnyy
,
Tatiana V. Ilchibaeva
,
Anton S. Tsybko
,
Dmitry V. Eremin
,
Yegor V. Antonov
,
Nina K. Popova
and
Vladimir S. Naumenko
Department of Behavioral Neurogenomics, Institute of Cytology and Genetics, Siberian Division, Russian Academy of Sciences, Novosibirsk 630090, Russia
*
Author to whom correspondence should be addressed.
Authors equally contributed to this work.
Int. J. Mol. Sci. 2020, 21(22), 8784; https://0-doi-org.brum.beds.ac.uk/10.3390/ijms21228784
Submission received: 30 October 2020 / Revised: 17 November 2020 / Accepted: 18 November 2020 / Published: 20 November 2020
(This article belongs to the Special Issue Brain Neurotransmitters in Genetic Control of Behavior)

Abstract

:
The influence of genetic background on sensitivity to drugs represents a topical problem of personalized medicine. Here, we investigated the effect of chronic (20 mg/kg, 14 days, i.p.) antidepressant fluoxetine treatment on recombinant B6-M76C mice, differed from control B6-M76B mice by CBA-derived 102.73–110.56 Mbp fragment of chromosome 13 and characterized by altered sensitivity of 5-HT1A receptors to chronic 8-OH-DPAT administration and higher 5-HT1A receptor mRNA levels in the frontal cortex and hippocampus. Significant changes in the effects of fluoxetine treatment on behavior and brain 5-HT system in recombinant B6-M76C mice were revealed. In contrast to B6-M76B mice, in B6-M76C mice, fluoxetine produced pro-depressive effects, assessed in a forced swim test. Fluoxetine decreased 5-HT1A receptor mRNA levels in the cortex and hippocampus, reduced 5-HT1A receptor protein levels and increased receptor silencer Freud-1 protein levels in the hippocampus of B6-M76C mice. Fluoxetine increased mRNA levels of the gene encoding key enzyme for 5-HT synthesis in the brain, tryptophan hydroxylase-2, but decreased tryptophan hydroxylase-2 protein levels in the midbrain of B6-M76B mice. These changes were accompanied by increased expression of the 5-HT transporter gene. Fluoxetine reduced 5-HT and 5-HIAA levels in cortex, hippocampus and midbrain of B6-M76B and in cortex and midbrain of B6-M76C; mice. These data demonstrate that changes in genetic background may have a dramatic effect on sensitivity to classic antidepressants from the Selective Serotonin Reuptake Inhibitors family. Additionally, the results provide new evidence confirming our idea on the disrupted functioning of 5-HT1A autoreceptors in the brains of B6-M76C mice, suggesting these mice as a model of antidepressant resistance.

1. Introduction

Depression is the one of the most common human mental disorders, significantly reducing the quality of life. Depression ranks second after cardiovascular diseases in terms of the number of days of a patient’s disability. However, despite the huge number of research studies being performed, the mechanisms and pathogenesis of depressive disorders are still far from having a complete understanding.
Many hypotheses on the mechanisms of depression indicate the key role of the brain serotonin (5-HT) system [1,2,3]. Classical clinically used antidepressants from the Selective Serotonin Reuptake Inhibitors (SSRIs) group are aimed at blockade of the serotonin transporter (5-HTT), which performs reuptake of the neurotransmitter from the synaptic cleft back into the presynaptic terminal. However, a significant percentage of depressive patients are resistant to this class of drugs, suggesting the role of individual genetic features. In addition, for the effective correction of depressive behavior, classical antidepressants must be utilized chronically. A number of studies indicate the implication of the serotonin 5-HT1A receptor in the positive effect of chronically administered SSRIs [4]. These 5-HT1A receptors could be localized both pre- and postsynaptically. Receptor function is strongly dependent on localization: in the raphe nuclei of the midbrain, it acts as a presynaptic somatodendritic autoreceptor, inhibiting neuronal activity and 5-HT secretion into the synaptic cleft, whereas the postsynaptic 5-HT1A receptor mediates 5-HT action on neurons. There are many data demonstrating the involvement of 5-HT1A receptors in the mechanisms of depression [5,6,7,8,9,10], depressive psychosis [11] and suicidal behavior [12,13,14]. There is some evidence indicating the role of presynaptic 5-HT1A receptors in the mechanism of antidepressant drug action [10,15,16]. An increased density of presynaptic 5-HT1A receptors was observed in depressed patients and suicidal victims [14,17]. The combination of 5-HT1A autoreceptor antagonists with classical antidepressants has been proposed to be more effective for depression treatment [18]. Preclinical data also show that activation of postsynaptic 5-HT1A receptors is important for the antidepressant effect of 5-HT1A receptor agonists [19]. Selective overexpression of postsynaptic 5-HT1A receptors is associated with a clear-cut antidepressant response to the SSRI citalopram [20].
In 2000, in the promoter of the 5-HT1A receptor gene, a binding site (dual repressor element-(DRE-element)) for a selective repressor suppressing the receptor gene expression was revealed [21]. Later, the transcriptional factor Cc2d1a/Freud-1 which binds to this DRE-element was identified [22]. It was shown that the removal of the promoter fragment containing the DRE-element results in a considerable increase in 5-HT1A receptor gene expression. On the contrary, overexpression of Cc2d1a/Freud-1 suppresses 5-HT1A receptor gene expression and reduces the level of the 5-HT1A receptor protein. Cc2d1a/Freud-1 mRNA was found in the midbrain raphe nuclei, hippocampus, frontal cortex and hypothalamus. Freud-1 protein was shown to be co-localized with the 5-HT1A receptor [22]. There are several studies suggesting Freud-1 involvement in the development of psychopathologies [23,24]. On the other hand, the functional state of 5-HT1A receptors can be modified by other serotonin receptors. For example, 5-HT2A receptors can form heterodimers with a 5-HT1A receptor [25], affecting its functioning [26,27]. The 5-HT7 receptor is also able to form heterodimers with 5-HT1A receptors, significantly changing the function of the latter [16,28].
Accumulating evidence suggests that different genetic backgrounds can affect the function of the same genes differently, resulting in alterations in responses to drug treatment [29]. The investigation of gene networks’ influence on response to drug treatment is an important problem of modern neuroscience. Mice created by a small genome fragment transfer represent promising models for studying the effects of genetic modification on molecular mechanisms of behavior and responses to drug treatment. Recently, we created recombinant B6.CBA-D13Mit76C (B6-M76C) and B6.CBA-D13Mit76B (B6-M76B) mouse lines on the C57Bl/6 genetic background [30,31]. The B6-M76C mice were differed by 5-HT1A receptor sensitivity to chronic activation with 5-HT1A receptor agonist 8-OH-DPAT, which allowed us to assume that B6-M76C mice have a genetically defined reduced sensitivity of presynaptic 5-HT1A receptor [31] and that these changes in genetic background can modulate the response to 5-HT1A-related antidepressants from the SSRIs family.
Here, to further confirm this idea, we studied the effects of chronic treatment with the classical SSRI antidepressant fluoxetine on (i) behavior in the open field and forced swim tests; (ii) mRNA and protein levels for Freud-1, 5-HT1A, 5-HT2A and 5-HT7 receptors as well as TPH-2, MAOA and 5-HTT and (iii) 5-HT and 5-HIAA levels and 5-HIAA/5-HT ratio in the brain structures (frontal cortex, hippocampus, hypothalamus and midbrain) of B6-M76B and B6-M76C mouse lines.

2. Results

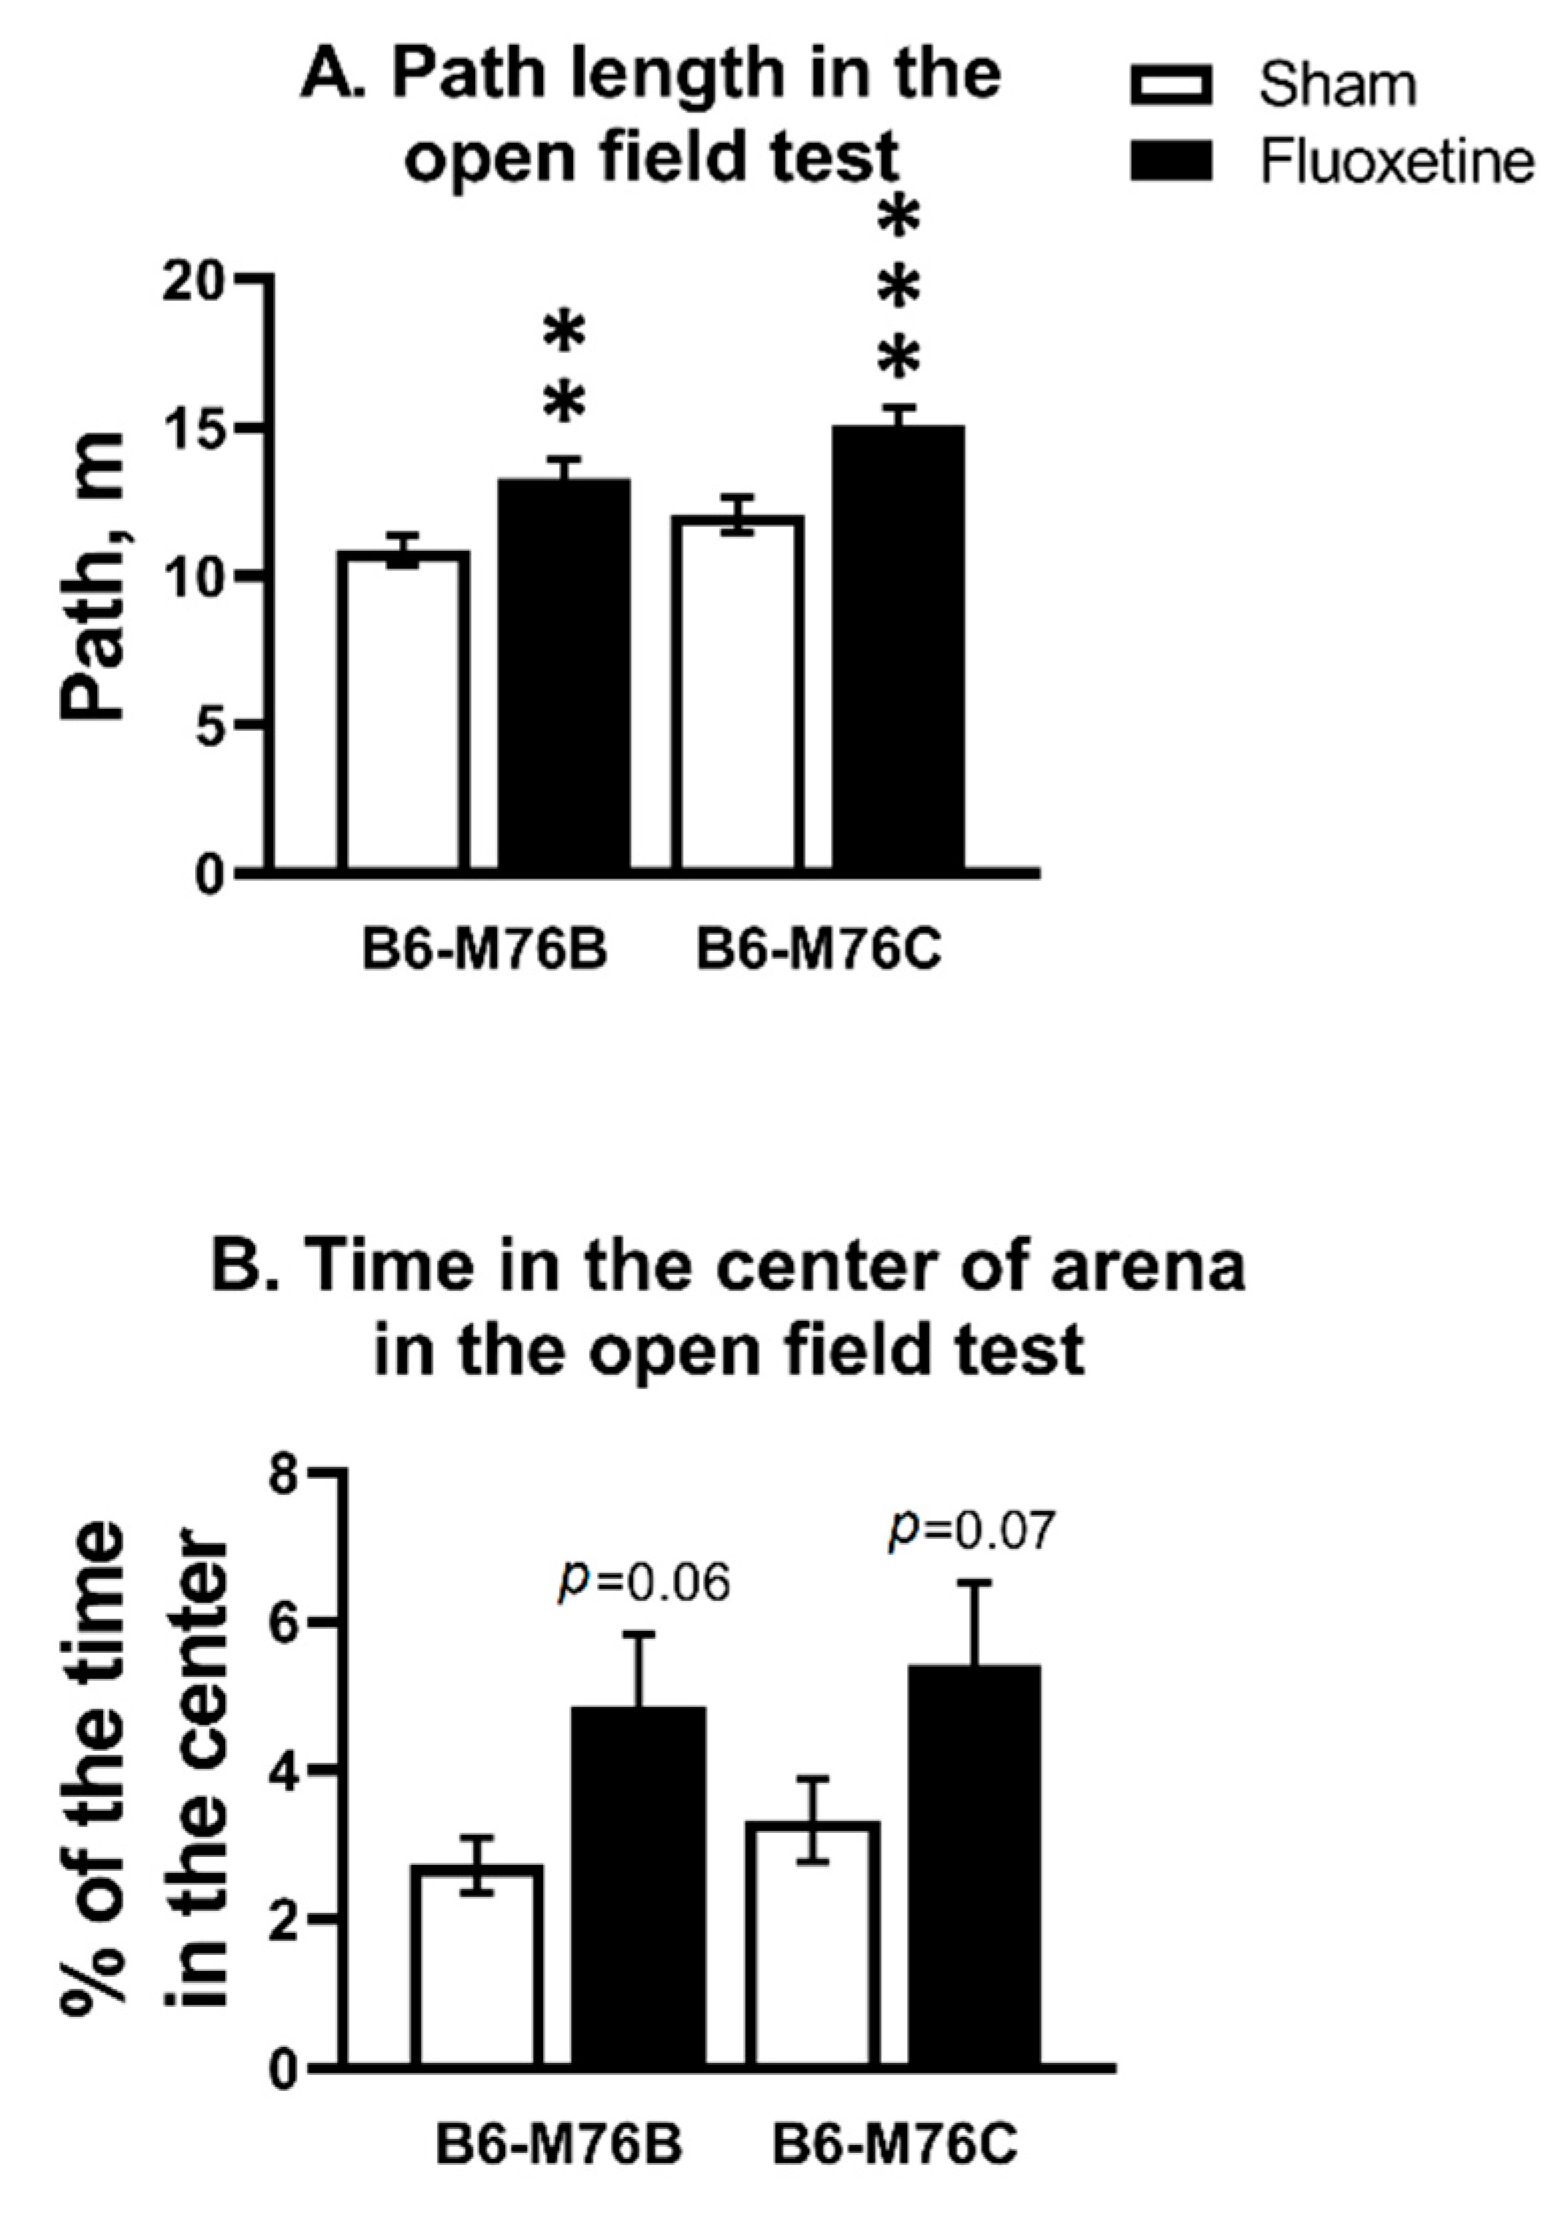
2.1. Open Field Test (OF)

Chronic fluoxetine treatment increased the path length in both B6-M76C and B6-M76B mice compared with correspondent control groups (F1.58 = 22.34, p < 0.001 for effect of fluoxetine; F1.58 = 6.71, p < 0.05 for effect of genotype) (Figure 1A). For time spent in the center of the arena, two-way analysis revealed an effect of fluoxetine (F1.58 = 7.04, p < 0.05), but post hoc analysis showed only a tendency for both B6-M76C and B6-M76B mice compared with the corresponding control groups (Figure 1B).

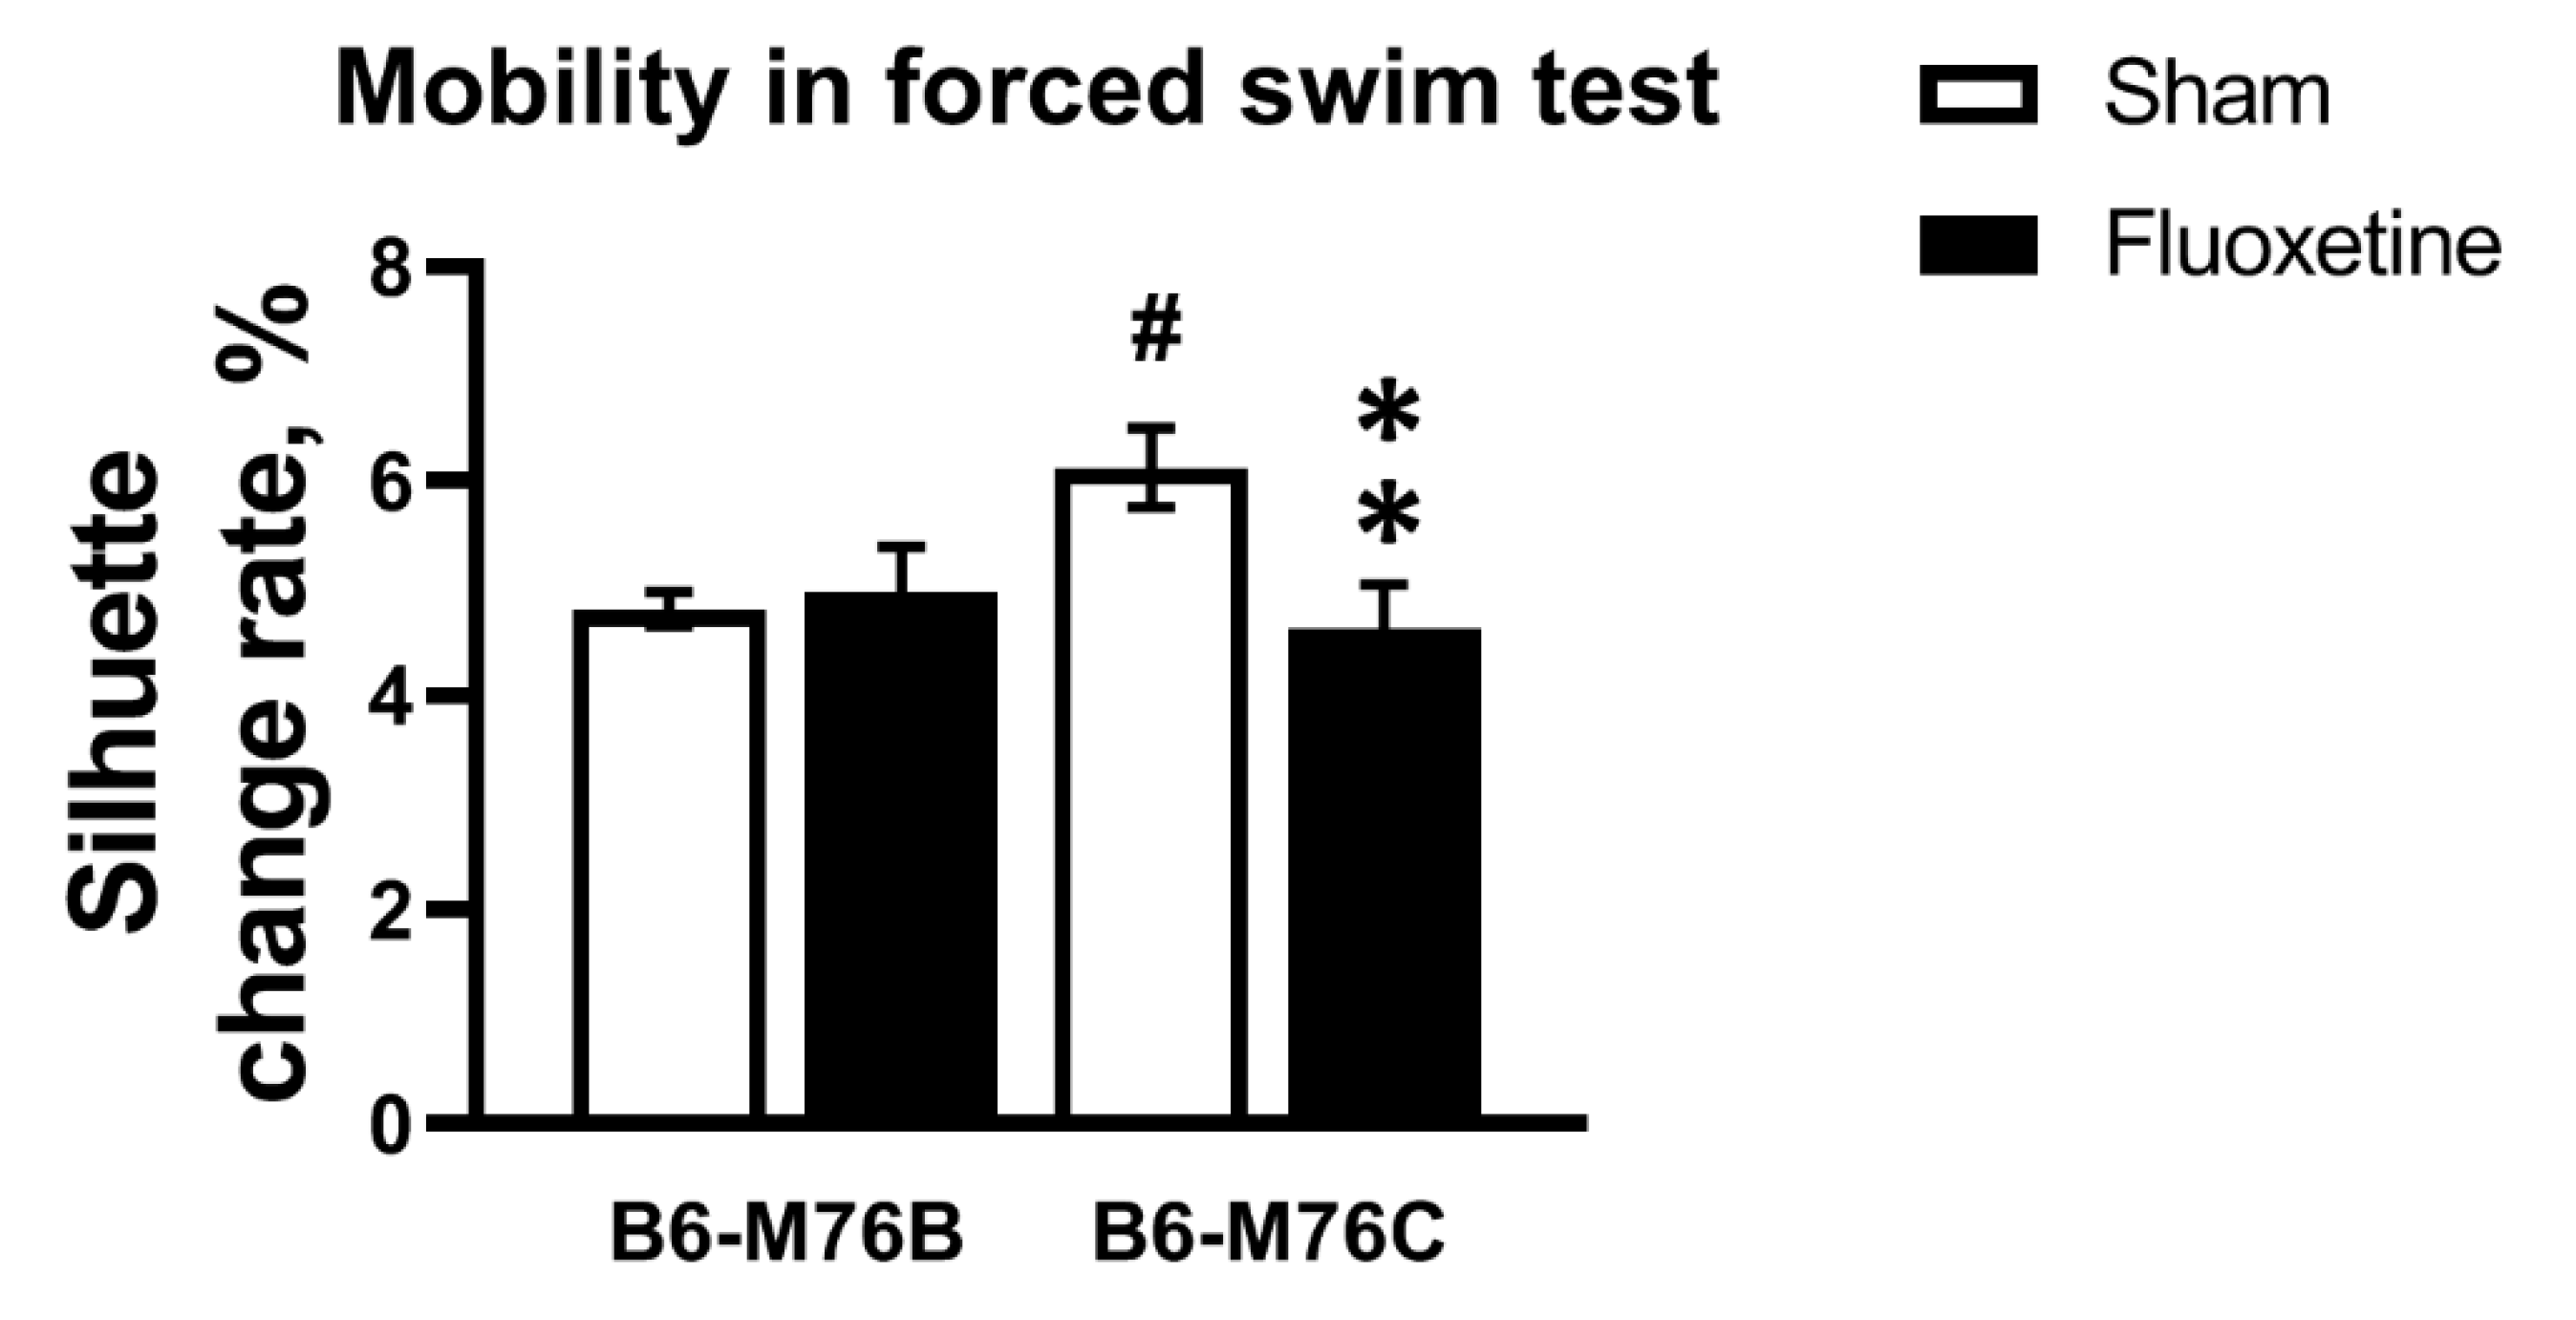
2.2. Forced Swim Test

Chronic fluoxetine treatment led to decrease in mobility only in the B6-M76C mice (F1.49 = 5.71, p < 0.05 for effect of genotype x fluoxetine interaction; for effect of fluoxetine F1.49 = 3.59, p = 0.06 was at tendency level; however, post hoc analysis revealed significant differences in mobility, p < 0.05) (Figure 2). The B6-M76C mice demonstrated higher mobility compared with the B6-M76B mice (post hoc analysis p < 0.05) (Figure 2). Thus, despite an increase in locomotor activity, chronic treatment with fluoxetine resulted in enhancement of depressive-like behavior in B6-M76C mice, reflected in reduced mobility in the forced swim test.

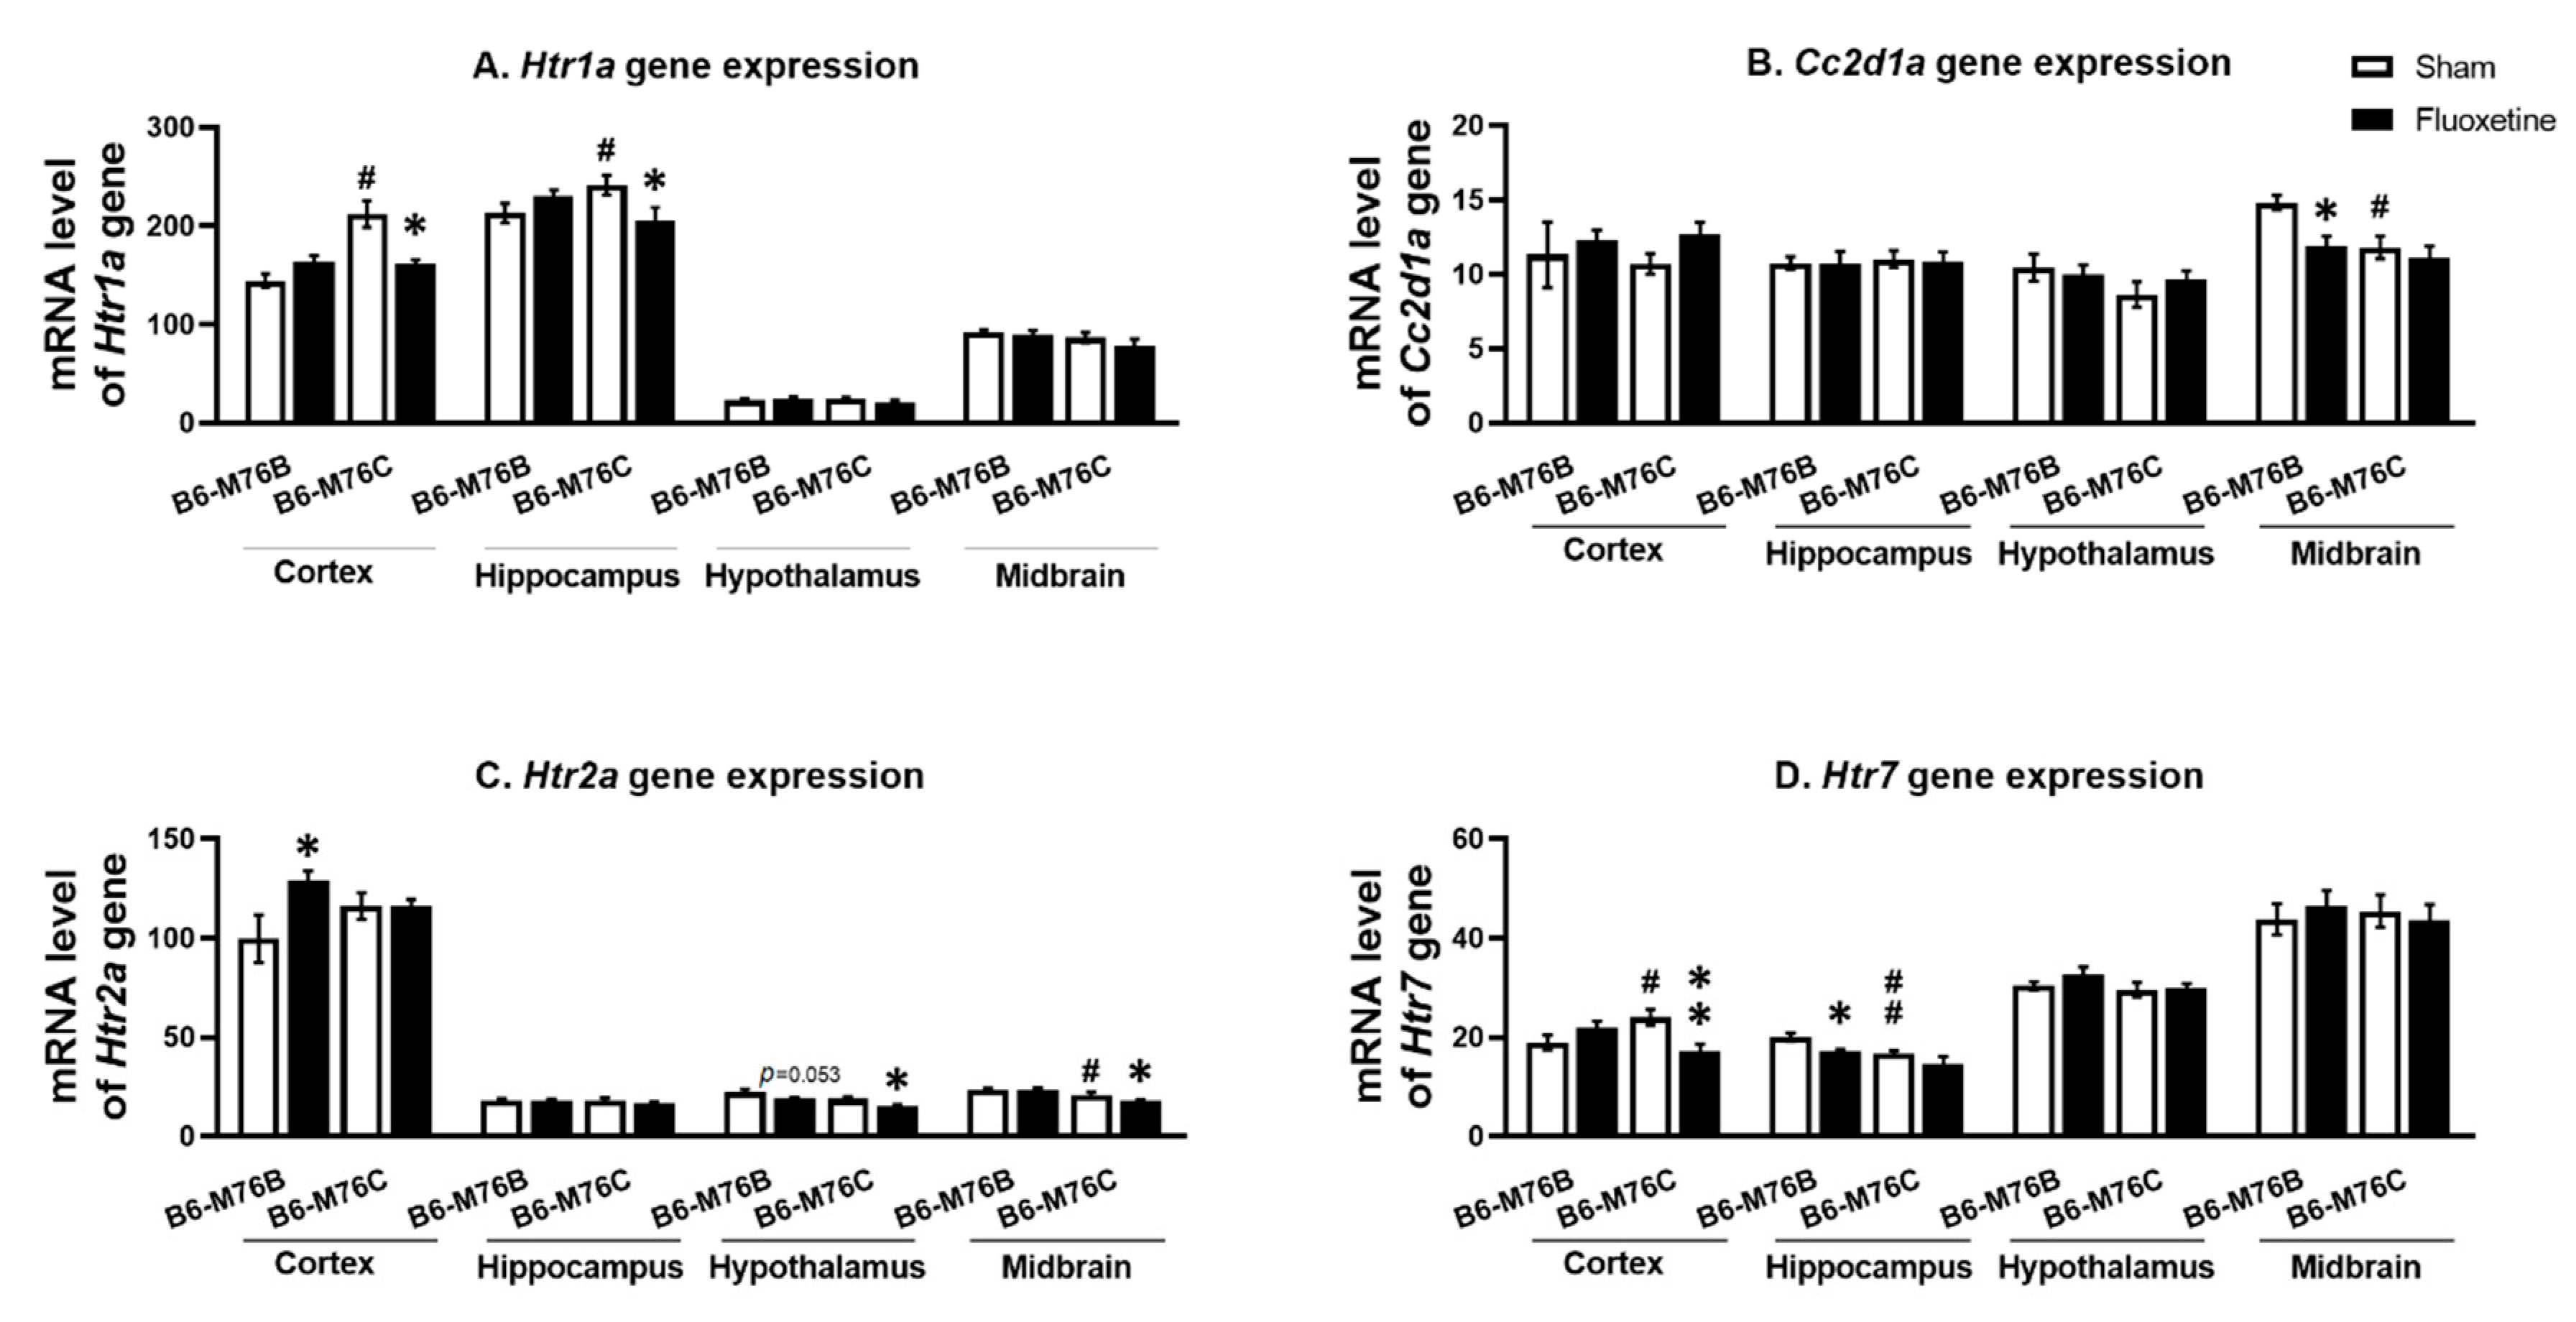
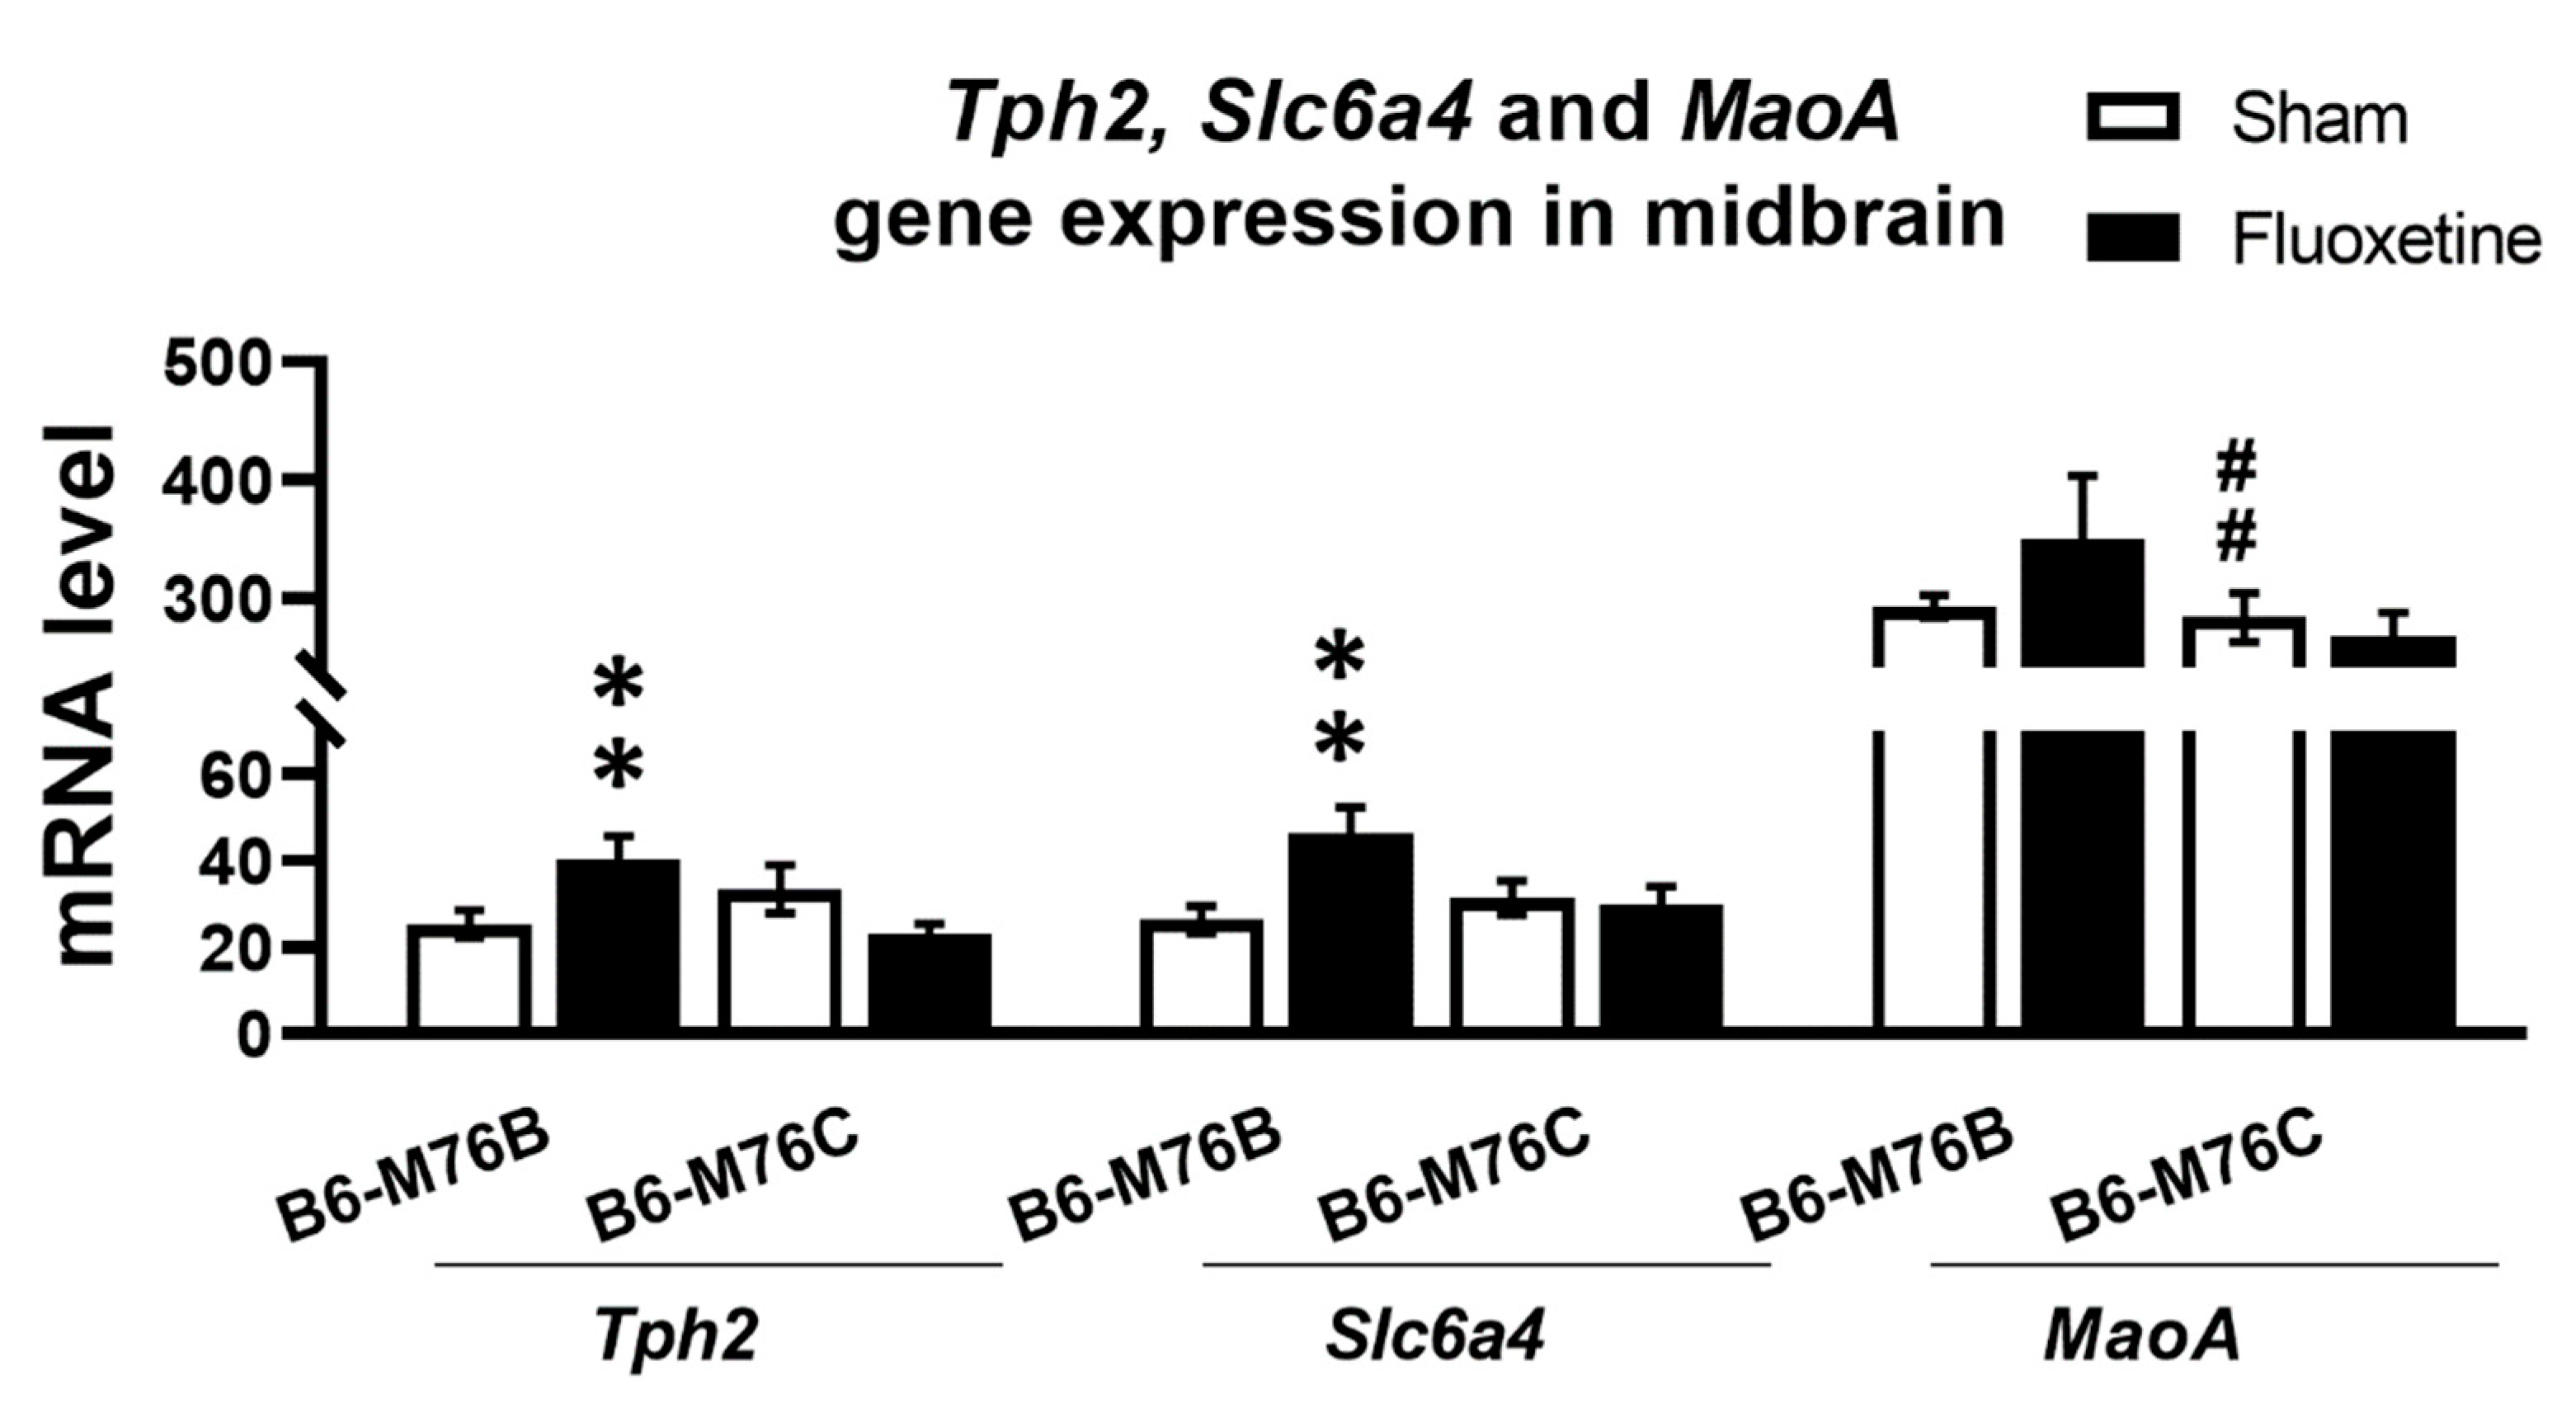
2.3. Expression of Genes
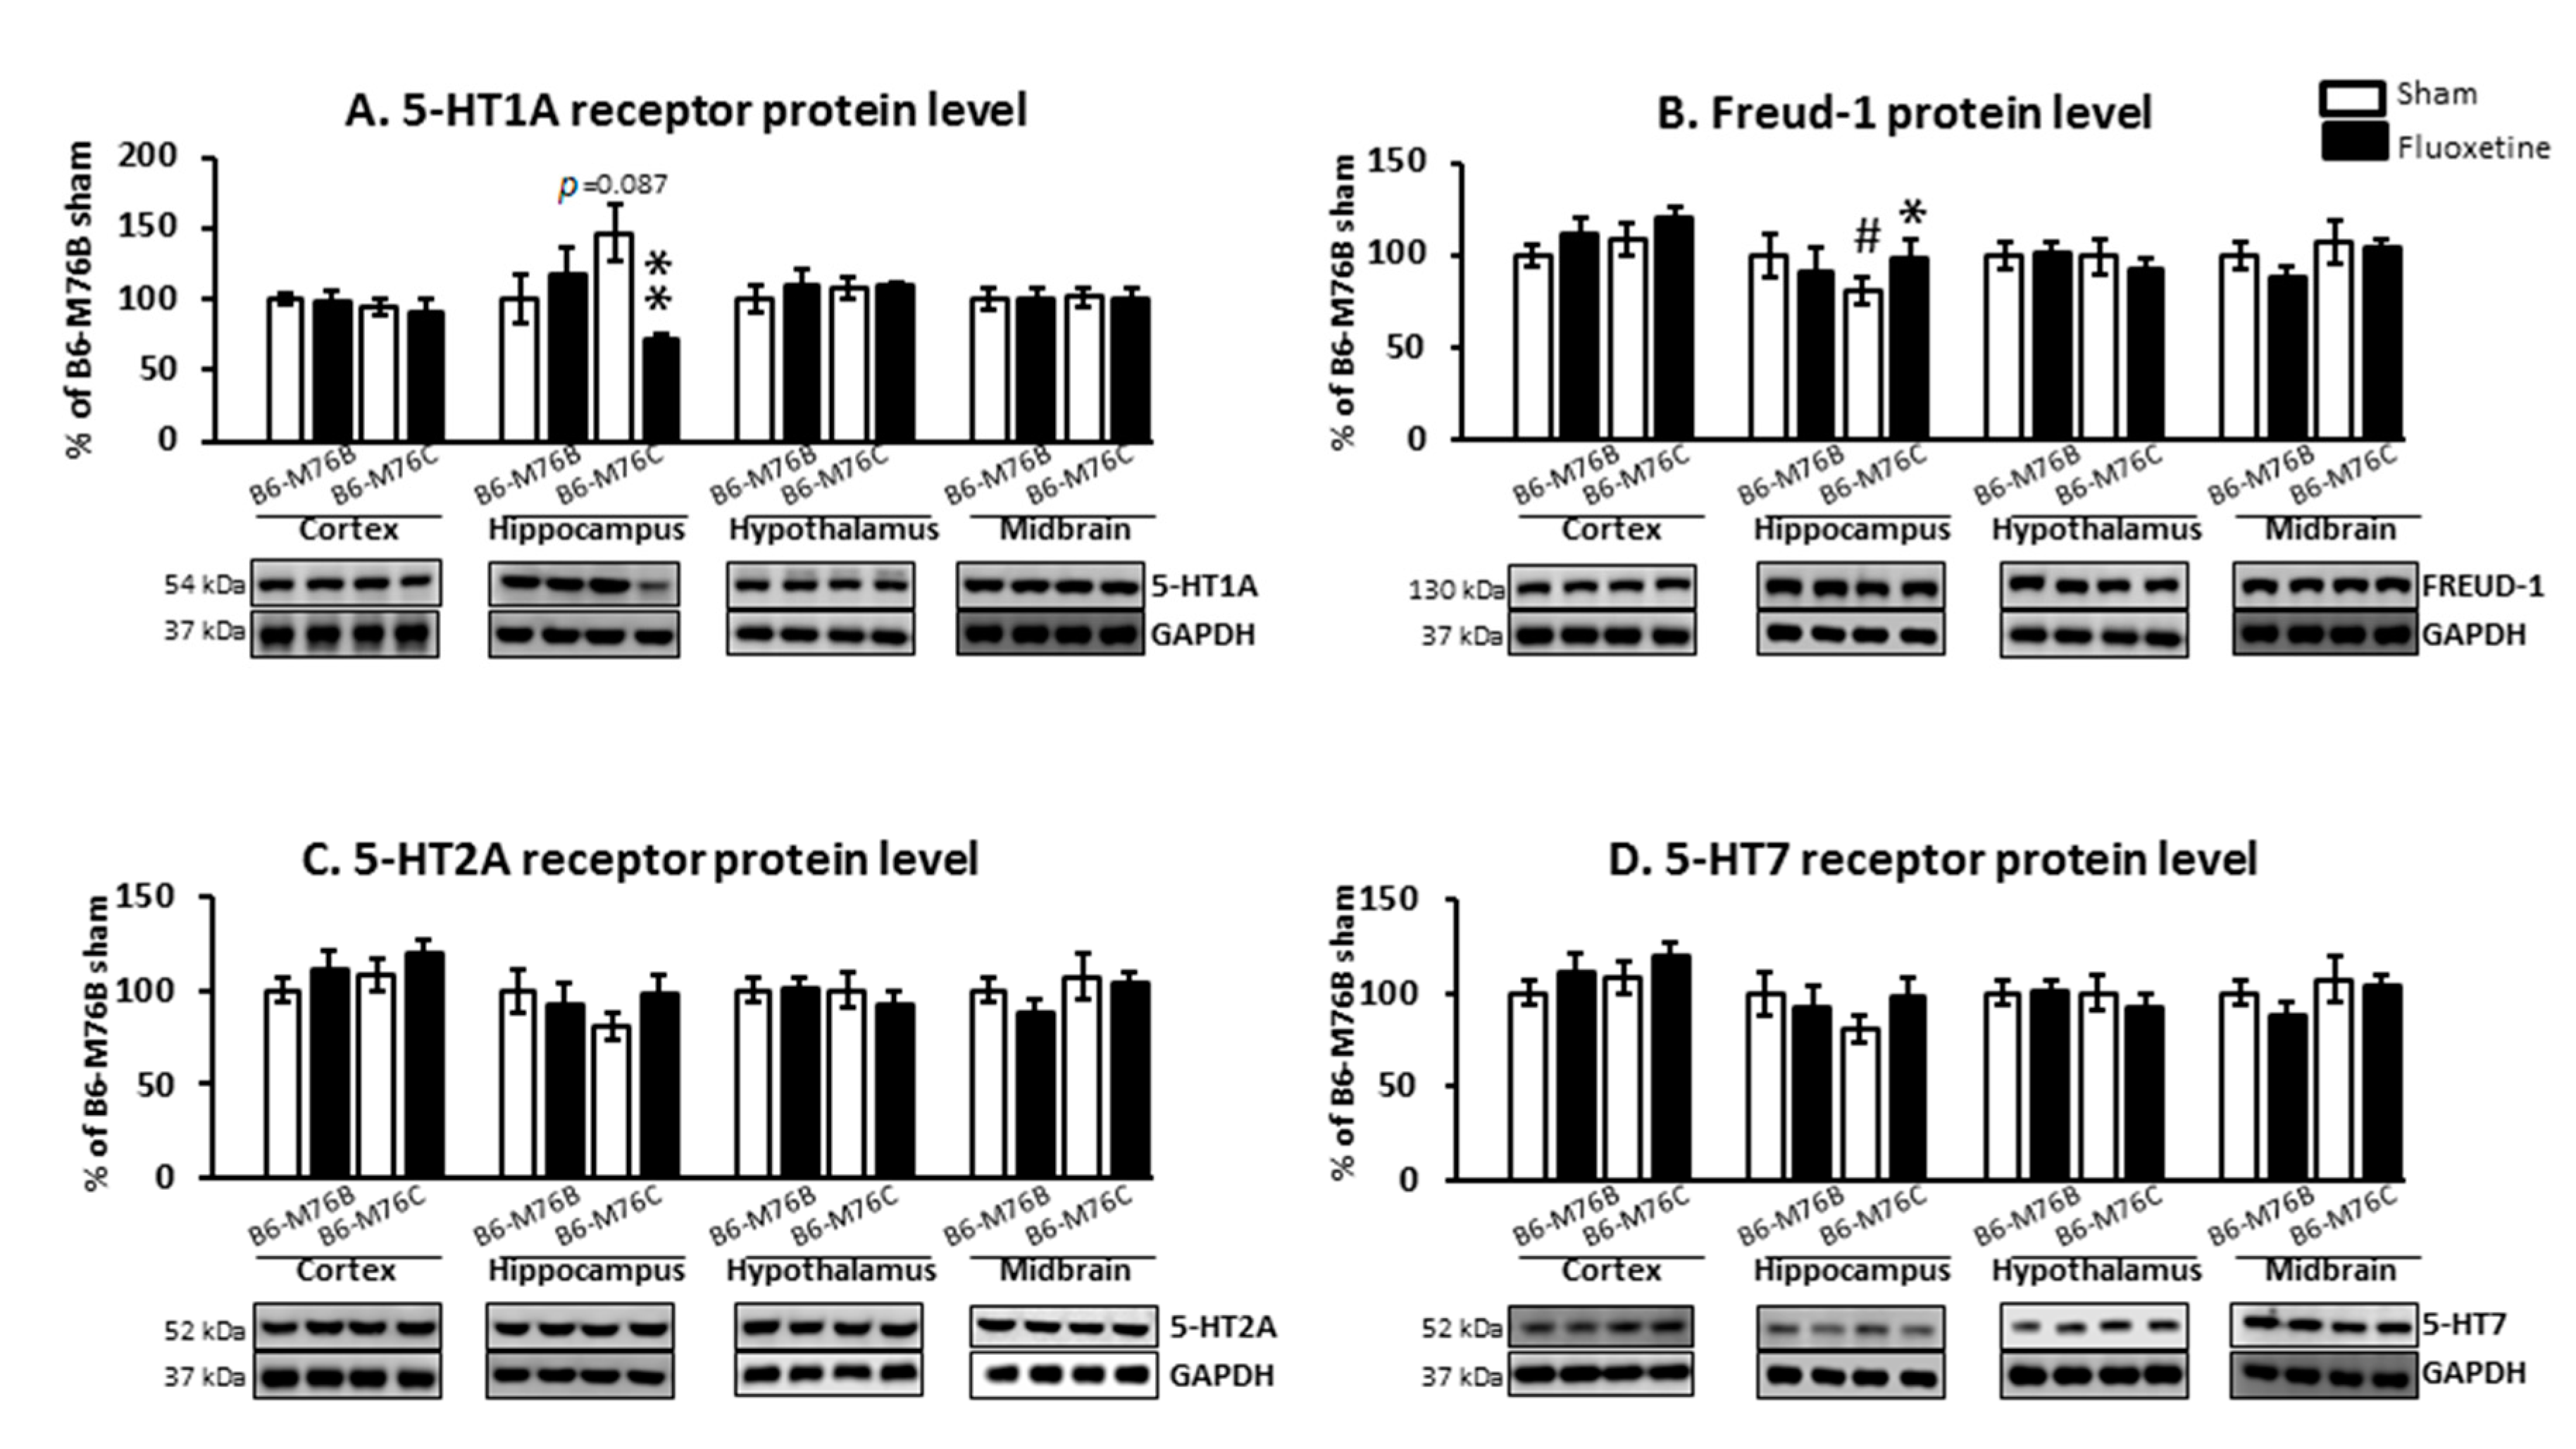
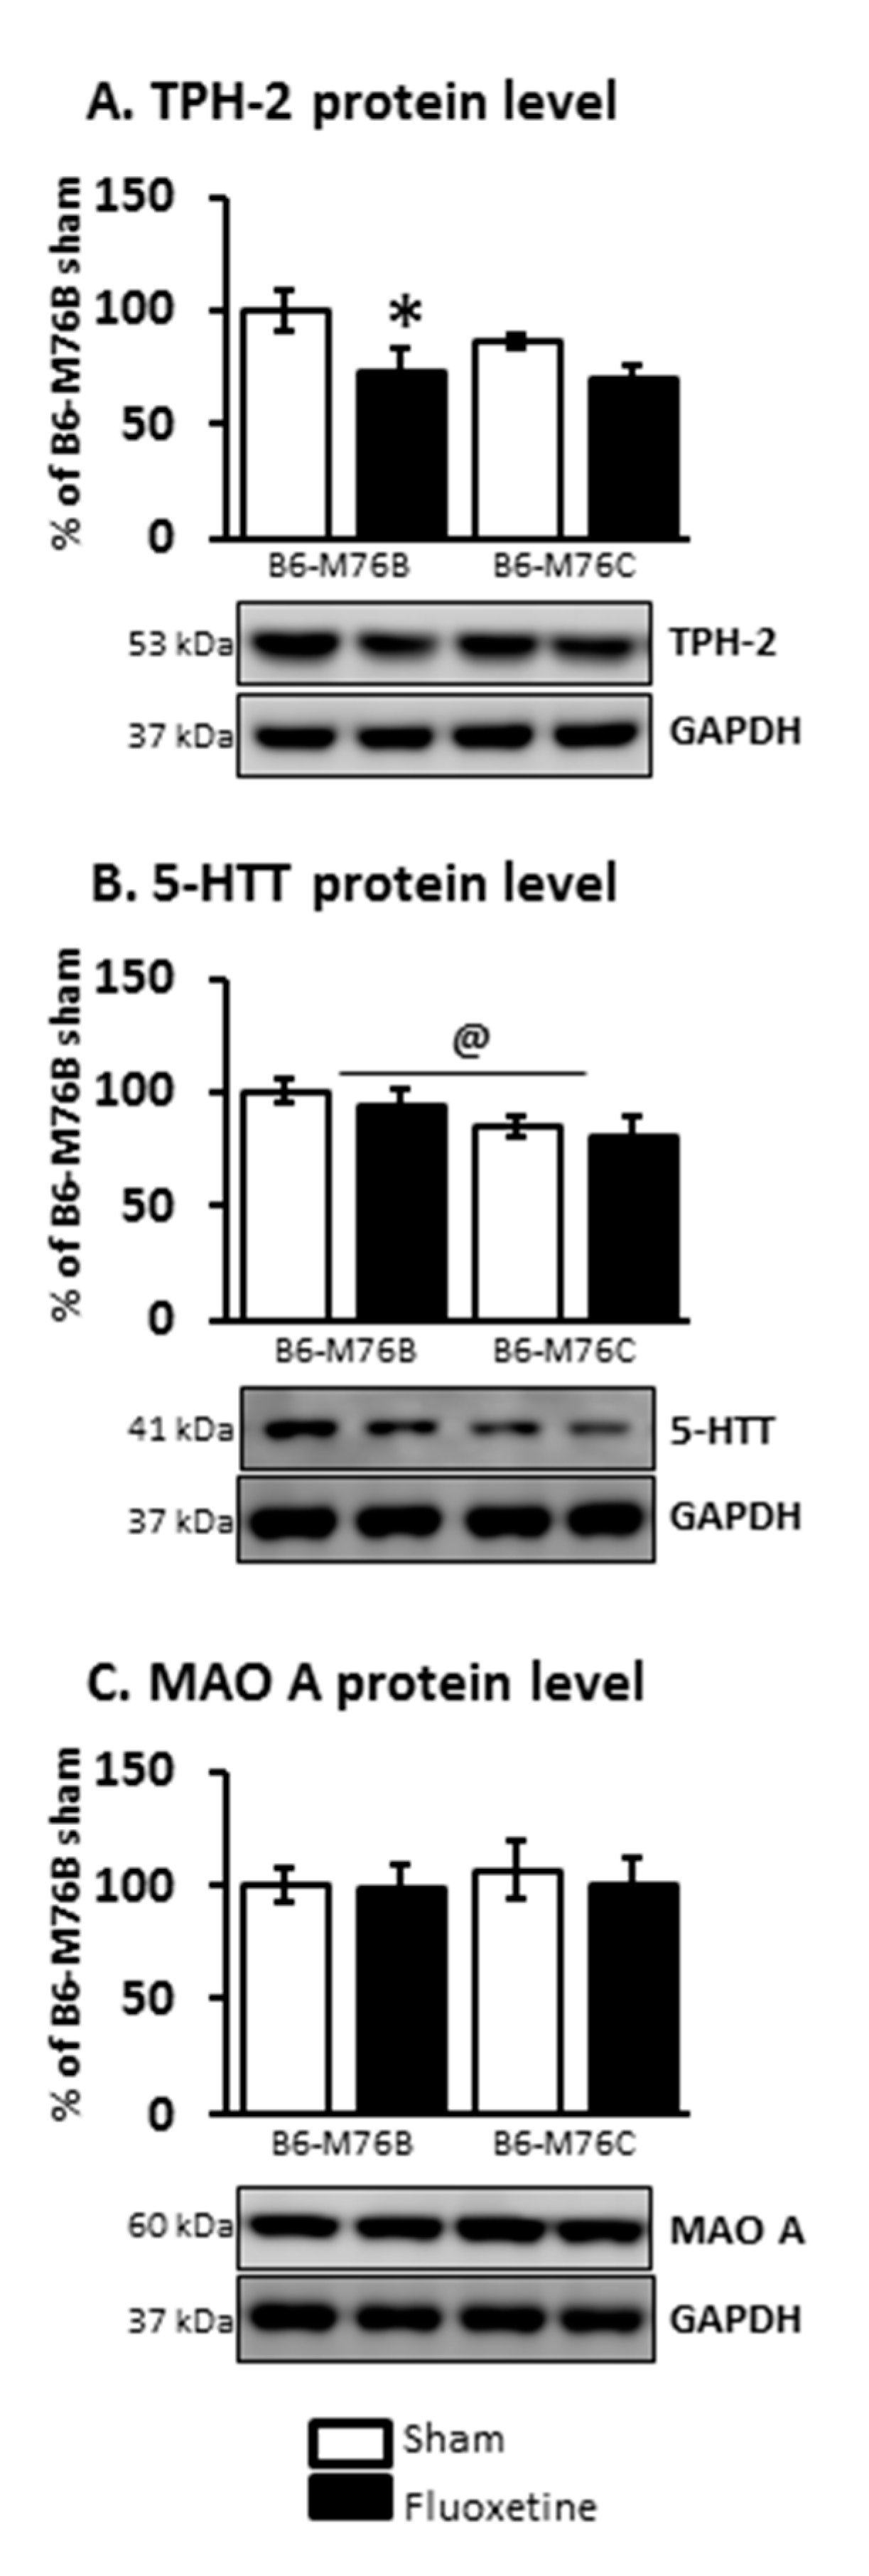
The B6-M76C mice demonstrated higher levels of Htr1a gene mRNA in the frontal cortex (p < 0.05) and hippocampus (p < 0.05) compared with the B6-M76B mice. Fluoxetine decreased Htr1a gene mRNA levels in B6-M76C mouse frontal cortex (F1.25 = 12.64, p < 0.001 for effect of genotype; F1,25 = 10.18, p < 0.05 for the effect of genotype x drug interaction) and in the hippocampus (F1,28 = 6.99, p < 0.05 for effect of genotype x fluoxetine interaction). At the same time, chronic fluoxetine treatment failed to affect Htr1a gene expression in the midbrain and hypothalamus of both investigated mouse lines (Figure 3A).
It was found that the Cc2d1a gene mRNA level was lower in the B6-M76C mice from the control group compared with those for the B6-M76B mice (F1.27 = 7.93, p < 0.001 for effect of genotype) in the midbrain. Interestingly, chronic fluoxetine treatment decreased the mRNA level of Cc2d1a gene in the B6-M76B mice compared with the control group (F1.27 = 4.47, p < 0.05 for effect of fluoxetine) in the midbrain. However, in the frontal cortex, hippocampus and hypothalamus, we did not find any effect of chronic fluoxetine treatment on the Cc2d1a gene mRNA level (Figure 3B).
Two-way ANOVA demonstrated the effect of the genotype (F1.20 = 9.2, p < 0.01) and the drug (F1.20 = 9.4, p < 0.001) on the Htr2a mRNA level in the hypothalamus. Post hoc analysis showed a significant (p < 0.05) decrease in 5 Htr2a gene expression in hypothalamus of B6-M76C mice after chronic fluoxetine treatment (Figure 3C). At the same time, a fluoxetine-induced reduction in the Htr2a mRNA level in hypothalamus of B6-M76B mice was below the significance threshold (p = 0.053), whereas the mRNA baseline level in hypothalamus of B6-M76C mice was not significantly decreased compared to the B6-M76B mice (p = 0.062). Furthermore, the effect of the genotype (F1.27 = 22.1, p < 0.001) on the Htr2a mRNA level was observed in the midbrain. Chronic fluoxetine treatment led to a significant reduction (p < 0.05) in the Htr2a gene expression in the midbrain of B6-M76C mice. Additionally, B6-M76C mice from the control group demonstrated reduced (p < 0.05) midbrain Htr2a mRNA levels compared to control B6-M76B mice. Alterations of Htr2a gene expression in the frontal cortex caused by chronic fluoxetine treatment were at tendency levels (F1.22 = 3.7, p = 0.07 for the effect of the drug and F1.22 = 3.6, p = 0.07 for the effect of genotype x drug interaction) and post hoc analysis showed a significant (p < 0.05) increase in Htr2a gene expression in the B6-M76B mice after chronic fluoxetine treatment. No difference in Htr2a gene mRNA levels was found in the hippocampus of investigated animals either (Figure 3C).
B6-M76C mice demonstrated higher Htr7 mRNA levels compared to the control B6-M76B mice (p < 0.05). Chronic fluoxetine treatment led to a decrease in the Htr7 gene mRNA level in the frontal cortex of B6-M76C mice (F1.26 = 9.9, p < 0.01 for effect of genotype and drug interaction). At the same time, fluoxetine reduced the Htr7 gene mRNA level in the hippocampus of B6-M76B mice (p < 0.01). The two-way ANOVA revealed the effect of genotype (F1.27 = 9.7, p < 0.01) and drug (F1.27 = 7.3, p < 0.05). Chronic fluoxetine treatment failed to affect Htr7 mRNA levels in the midbrain and hypothalamus (Figure 3D).
Chronic fluoxetine treatment resulted in significantly (p < 0.01) increased expression of gene encoding key enzyme for 5-HT synthesis in the brain–tryptophan hydroxylase-2 in the midbrain of B6-M76B mice (Figure 4). Two-way ANOVA showed the effect of genotype x drug interaction (F1.25 = 11.1, p < 0.01) for the Tph2 mRNA level in midbrain. A similar fluoxetine-induced increase was observed in B6-M76B mice for the expression of gene encoding 5-HT transporter realizing 5-HT reuptake from synaptic cleft (Slc6a4) (Figure 4). Two-way ANOVA revealed the effect of genotype x drug interaction (F1.29 = 5.5, p < 0.05) for the Slc6a4 mRNA level in the midbrain. Post hoc analysis showed significant (p < 0.01) increase in Slc6a4 gene expression in B6-M76B mice after chronic fluoxetine treatment. At the same time, fluoxetine treatment failed to affect the expression of the gene encoding the main enzyme for 5-HT degradation–monoamine oxidase A (Maoa) (Figure 4). However, B6-M76B mice from the control group demonstrated significantly higher (p < 0.01) expression of the Maoa gene compared to that in the B6-M76C mice (F1.24 = 19.1, p < 0.001 for the effect of genotype) (Figure 4).

2.4. Protein Levels

Chronic fluoxetine treatment led to considerable changes in 5-HT1A receptor protein level. Two-way ANOVA showed the effect of genotype x drug interaction (F1.18 = 6.9, p < 0.05) for the 5-HT1A receptor protein level in the hippocampus (Figure 5A). A post hoc analysis demonstrated that chronic fluoxetine administration resulted in a reduction in the 5-HT1A receptor protein level in the hippocampus of B6-M76C mice (p < 0.01). Fluoxetine treatment failed to affect 5-HT1A receptor expression in other investigated brain structures. Interestingly, the post hoc analysis also revealed increased 5-HT1A receptor protein levels in the hippocampus of B6-M76C mice from the control group compared to control B6-M76B mice, although this difference was below the significance threshold (p = 0.087) (Figure 5A).
It is noteworthy that chronic fluoxetine treatment resulted in an increase (p < 0.05) in the protein level of 5-HT1A receptor silencer Freud-1 in the hippocampus of B6-M76C mice but not B6-M76B mice. The two-way ANOVA showed the effect of genotype x drug interaction (F1.15 = 6.9, p < 0.05) for Freud-1 protein level in the hippocampus of B6-M76C mice (Figure 5B). Furthermore, B6-M76C mice from the control group demonstrated decreased Freud-1 expression (p < 0.05) in the hippocampus compared to that from control B6-M76B mice. No changes in Freud-1 expression were observed in other studied brain structures. Thus, in the hippocampus of B6-M76C mice, Freud-1 seems to play an important role in the regulation of 5-HT1A receptor gene transcription. Moreover, in this brain structure Freud-1 is involved in the 5-HT1A receptor gene response to chronic treatment with fluoxetine: Freud-1 protein increase was accompanied by reduction in 5-HT1A receptor mRNA level.
Chronic fluoxetine administration did not affect 5-HT2A and 5-HT7 receptors protein levels in all investigated brain structures. Control B6-M76C mice did not differ from control B6-M76B mice in the expression of these receptors (Figure 5C,D).
At the same time, the two-way ANOVA demonstrated the effect of the drug on TPH-2 protein level in the midbrain (F1.21 = 6.8, p < 0.05). Fluoxetine treatment resulted in a considerable decrease (p < 0.05) in the expression of this key enzyme for 5-HT biosynthesis in the brains of B6-M76B mice (Figure 6). The two-way ANOVA also showed the effect of genotype on 5-HTT protein level in the midbrain (F1.16 = 4.8, p < 0.05). However, the post hoc analysis retrieved no significant changes in 5-HTT expression. Chronic fluoxetine treatment failed to affect the MAO A protein level in the midbrain of both investigated mouse lines as well (Figure 6).

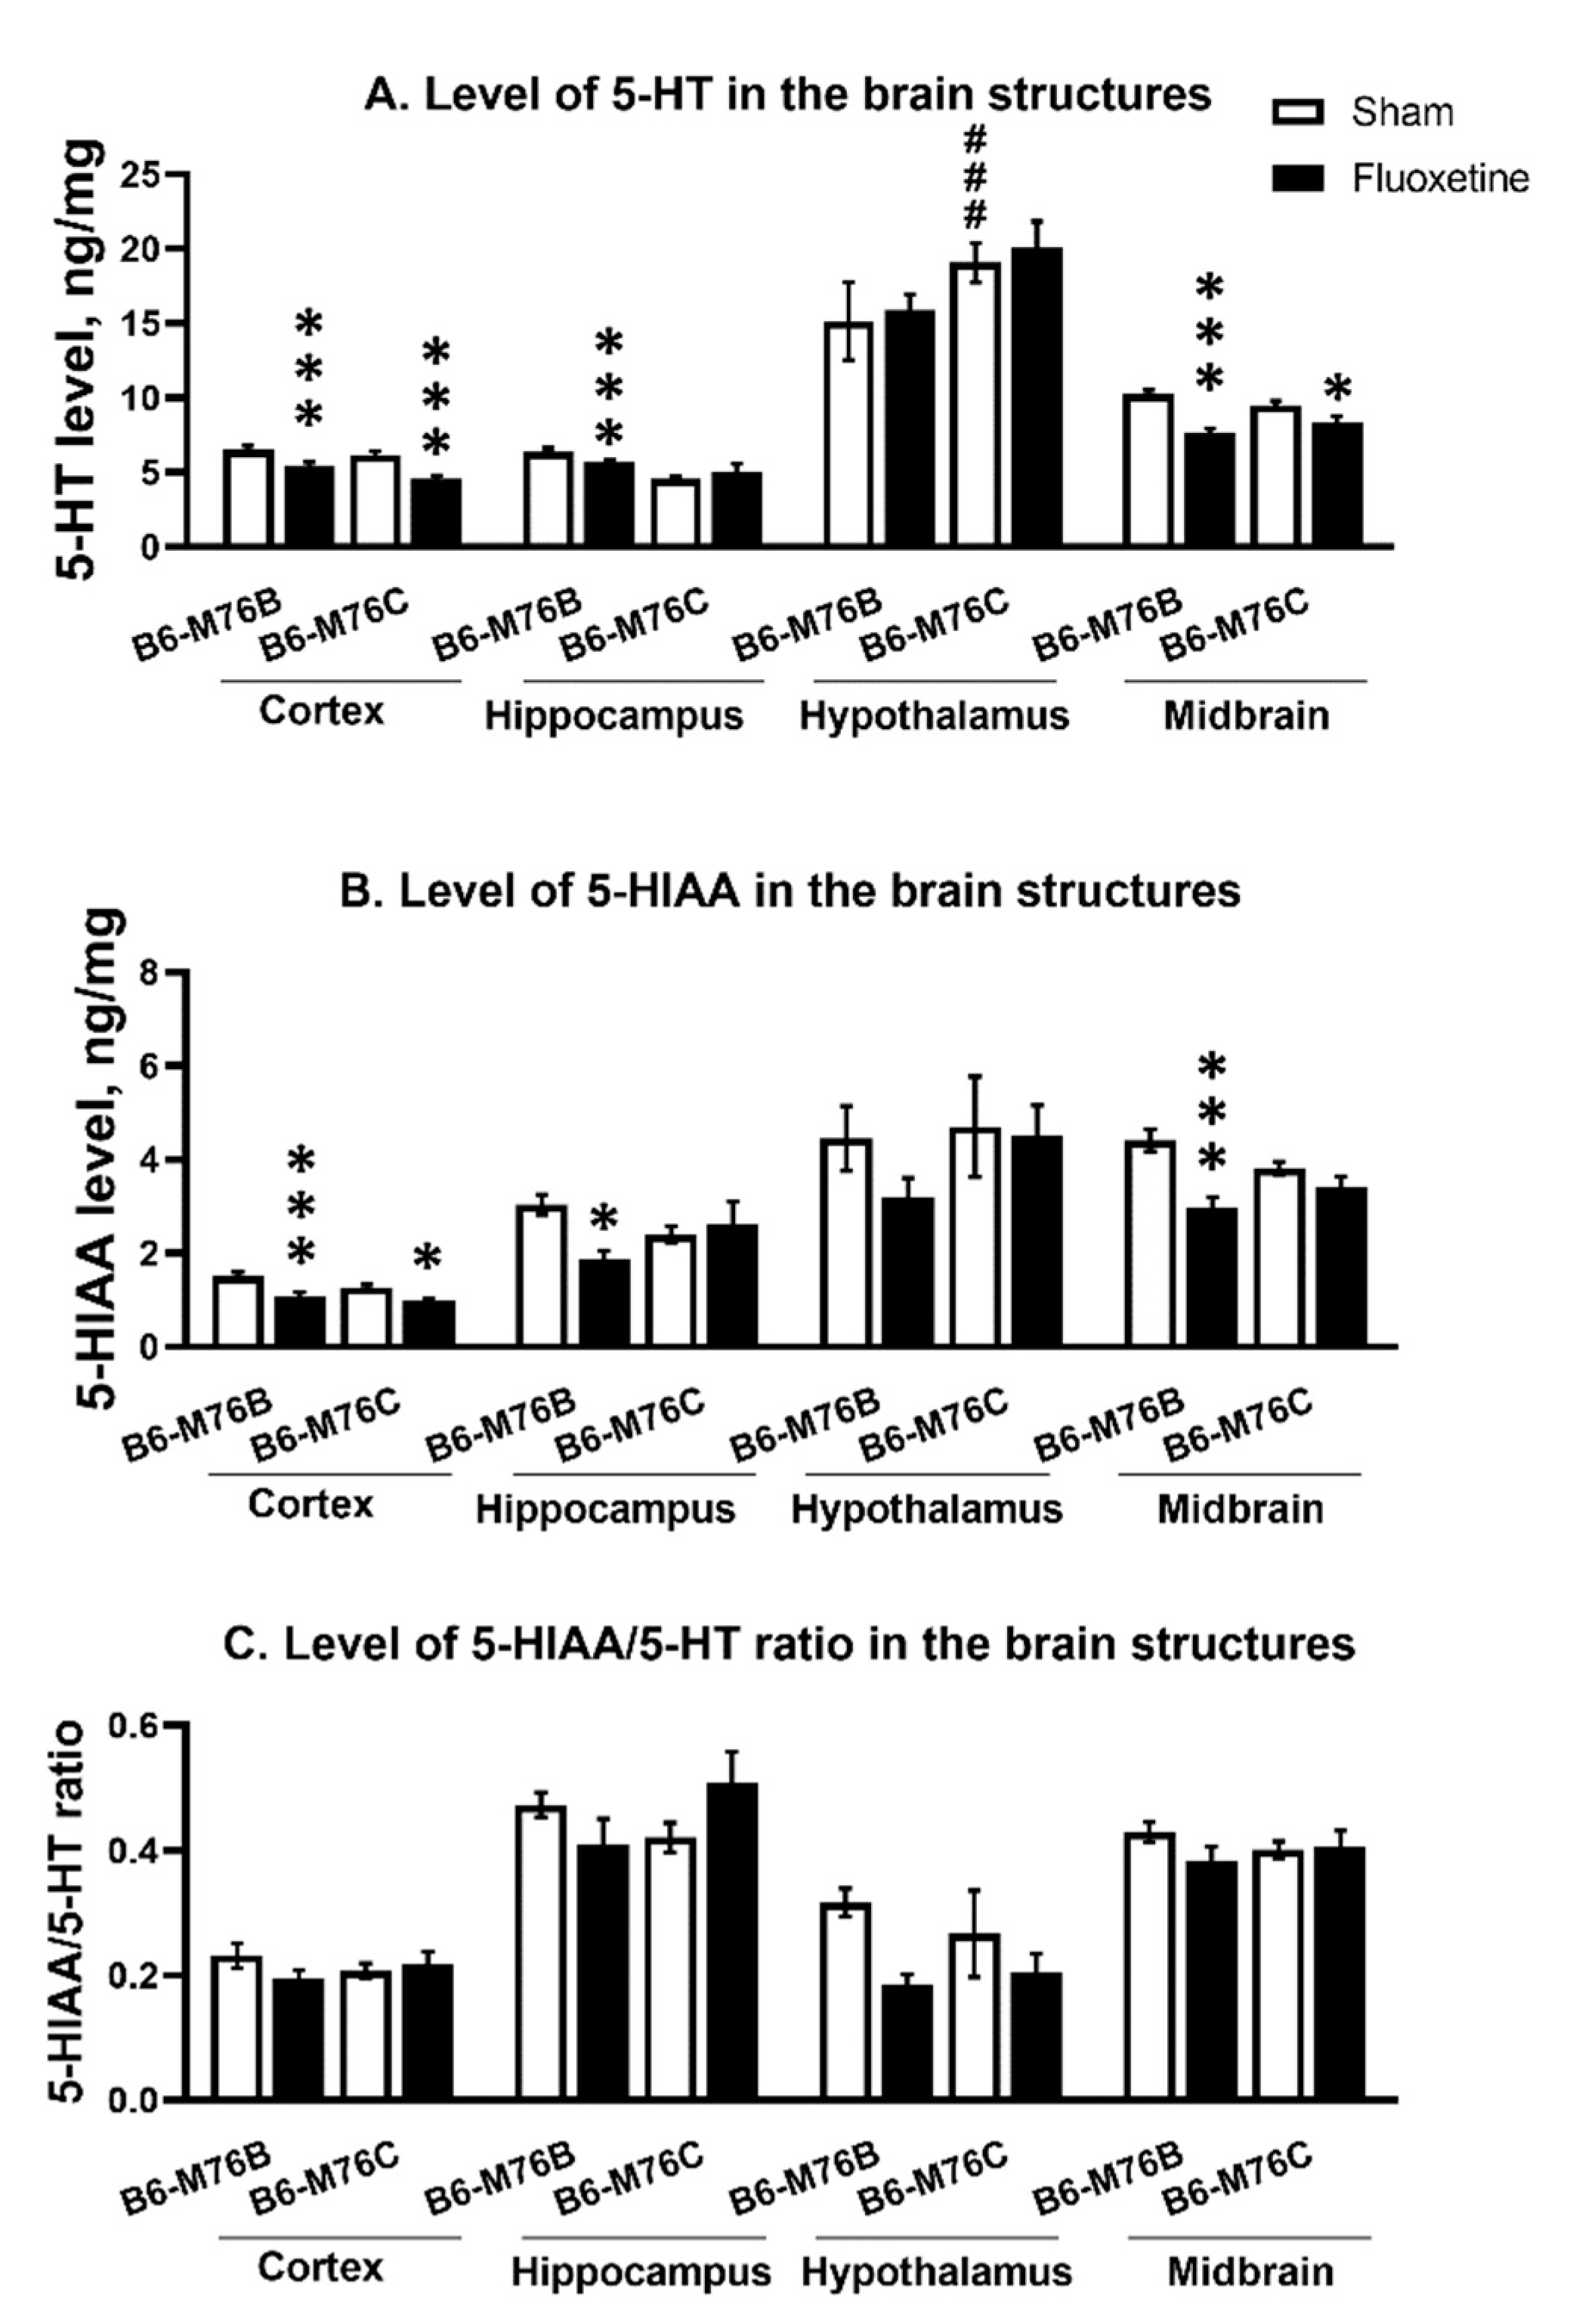
2.5. The Levels of 5-HT, 5-HIAA and 5-HIAA/5-HT Ratio

Chronic fluoxetine administration led to a reduction in the 5-HT level in the frontal cortex and midbrain of both mouse lines compared with control groups (F1.24 = 28.65, p < 0.001 for effect of the drug in frontal cortex and F1,23 = 36.52, p < 0.001 for midbrain). At the same time, fluoxetine treatment resulted in a decrease in 5-HT level in the hippocampus only in B6-M76B mice (F1.24 = 14.50, p < 0.001 for effect of fluoxetine). In hypothalamus, fluoxetine did not affect 5-HT levels in both lines; however, the level of neurotransmitters was higher in B6-M76C mice from the control group compared to that for the B6-M76B control animals (F1.23 = 12.66, p < 0.01 for effect of genotype) (Figure 7A).
Fluoxetine administration reduced 5-HIAA in frontal cortex of both lines compared with the control groups (F1.24 = 17.96 p < 0.001 for effect of fluoxetine). At the same time, chronic antidepressant treatment decreased 5-HIAA levels in the hippocampus and midbrain only in B6-M76B mice (F1.24 = 5.33, p < 0.05 for effect of fluoxetine in hippocampus and F1.23 = 18.40, p < 0.001 for midbrain). In the hypothalamus, fluoxetine failed to affect 5-HIAA levels in both lines (Figure 7B).
The 5-HIAA/5-HT ratio reflecting 5-HT turnover was not altered followed chronic fluoxetine treatment in all investigated structures of both mouse lines (Figure 7C).

3. Discussion

Recombinant B6-M76C mice differed from control B6-M76B mice only by CBA-derived 102.73–110.56 Mbp fragment of chromosome 13 on identical genetic backgrounds demonstrated paradoxical pro-depressive responses to chronic treatment with the classical SSRI fluoxetine (Table 1). The obtained results show that small changes in genetic background in B6-M76C mice lead to dramatic alteration of the behavioral response to the classic antidepressant fluoxetine. Fluoxetine treatment failed to produce an antidepressive effect in B6-M76B mice. Taking into account that B6-M76B mice carry a C57BL/6 genetic background, our data are in general agreement with other studies that have reported marked strain and genotype dependence in response to SSRIs in a forced swim test [32,33,34,35,36].
Recently, we found that the changes in genetic background of B6-M76C mice altered the sensitivity of 5-HT1A receptors to chronic activation with 5-HT1A receptors agonist 8-OH-DPAT, which allowed us to suggest the altered sensitivity of presynaptic 5-HT1A receptors in these animals [31]. The results of the current study allow us to suggest that fluoxetine led to the activation rather than desensitization of presynaptic 5-HT1A receptors in B6-M76C mice after two weeks of exposure. This inhibits the brain’s 5-HT system functional activity and, hence, produces a pro-depressive effect. Similar pro-depressive effects are sometimes observed in humans, especially in the first few weeks after starting treatment [37].
Although fluoxetine decreased the brain 5-HT and 5-HIAA levels (Table 1), it failed to affect the 5-HIAA/5-HT ratio, reflecting 5-HT turnover in both investigated mouse lines. One could suggest that the decrease in total 5-HT and 5-HIAA levels reflects a “normal” response to chronic SSRI treatment in B6-M76B mice. In this regard, the unchanged 5-HT and 5-HIAA levels in the hippocampus of B6-M76C mice could reflect the incorrect response of B6-M76C mice to chronic fluoxetine treatment.
Our data on the absence of fluoxetine effect on 5-HT turnover are mainly in line with the literature, showing an initial increase in 5-HT levels and a return to baseline or even lower levels after prolonged SSRI treatment [38,39,40]. In mice expressing the mutation in Tph2 gene (R439H Tph2 KI), chronic treatment with fluoxetine resulted in a dramatic depletion of 5-HT while having little effect on the wild-type control [41]. However, in albino mice, the 5-HIAA/5-HT ratio was significantly elevated after 2–3 weeks of fluoxetine treatment [42]. The mentioned results indicate that the changes in levels of 5-HT, 5-HIAA and 5-HIAA/5-HT in the brains of mice in response to fluoxetine treatment can vary greatly depending on their genetic background.
We revealed significant differences in response of 5-HT elements to chronic fluoxetine treatment between investigated mouse lines (Table 1). Chronic fluoxetine treatment altered the expression of the key regulator [4] of brain 5-HT system functional activity—5-HT1A receptor. Fluoxetine produced a decrease in hippocampal 5-HT1A receptor gene expression in B6-M76C mice, accompanied by a reduction in 5-HT1A receptor protein level in this brain structure. In the frontal cortex, fluoxetine induced a decrease in Htr1a mRNA levels that was not coupled with corresponding changes in receptor protein levels. It is interesting to note that fluoxetine affected 5-HT1A receptors only in B6-M76C mice and not in B6-M76B mice. Furthermore, it is noteworthy that chronic SSRI application affected hippocampal and cortical but not midbrain 5-HT1A receptors. Given a predominant localization of presynaptic 5-HT1A receptors in midbrain raphe nuclei area and postsynaptic 5-HT1A receptors in other brain structures, especially the hippocampus, where the highest expression of 5-HT1A receptors is observed [43], these data indicate the reduced sensitivity of presynaptic and increased sensitivity of postsynaptic 5-HT1A receptors in B6-M76C mice. Additionally, the higher Htr1a mRNA levels in the frontal cortex and hippocampus of B6-M76C mice compared to B6-M76B mice indirectly confirms the suggestion of increased sensitivity of postsynaptic 5-HT1A receptors in B6-M76C mice as well.
Importantly, the chronic fluoxetine treatment-induced decrease in hippocampal 5-HT1A receptor expression in B6-M76C mice indicates a reduction in 5-HT neurotransmission. This 5-HT1A receptor decrease may explain the pro-depressive effect induced by chronic application of fluoxetine.
Chronic fluoxetine treatment resulted in reduction in Cc2d1a gene mRNA level in B6-M76B mice in the midbrain. However, these changes were not accompanied by alterations in Freud-1 protein levels. At the same time, fluoxetine increased the protein level for 5-HT1A receptor silencer Freud-1 in the hippocampus of B6-M76C mice. This result, taken together with fluoxetine-induced reduction in the Htr1a mRNA level in the hippocampus of B6-M76C mice as well as with the data on decreased Freud-1 expression in the hippocampus of B6-M76C mice from control group, is in agreement with the important role of Freud-1 in the regulation of 5-HT1A receptor gene expression [22]. These results indicate that Freud-1-mediated transcriptional regulation of hippocampal 5-HT1A receptor gene seems to play an important role in the response of B6-M76C mice to chronic fluoxetine treatment.
It is well known that the functional state of 5-HT1A receptors is under the control of other serotonin receptors—for example, 5-HT2A and 5-HT7 [16,25,26,27,28]. Chronic fluoxetine treatment produced significant changes in Htr2a and Htr7 mRNA levels. However, these alterations were not accompanied by changes in 5-HT2A and 5-HT7 receptor protein levels, which hampers the understanding of these receptors’ role in the 5-HT1A receptor response to chronic SSRI application.
Fluoxetine considerably affects expression of the key enzyme for 5-HT biosynthesis in the brain TPH-2 in B6-M76B mice only. Interestingly, fluoxetine treatment resulted in an increase in Tph2 gene mRNA level accompanied by a reduction in TPH-2 protein level in the midbrain of B6-M76B mice (Table 1). The latter seems to reflect compensatory mechanisms directed to diminish the fluoxetine-induced effect of 5-HTT blockade on the 5-HT system. Likely, similarly directed compensatory mechanisms explain the increase in Slc6a4/5-HTT gene expression in B6-M76B mice followed by chronic 5-HTT blockade. However, these changes were not coupled to 5-HTT protein level alterations. Nevertheless, in B6-M76C mice with altered sensitivity of 5-HT1A receptors, chronic fluoxetine treatment failed to affect key enzymes for 5-HT synthesis and catabolism as well as 5-HT transporter, which also indicate a reduced response to chronic fluoxetine treatment.
Thus, individual differences in genetic background may result in reduced sensitivity or even an inversed response to a classic antidepressant from the SSRI family fluoxetine, which is known to be widely utilized in clinics. Our data draw attention to the 5-HT1A autoreceptor as a hotspot in the mechanisms of antidepressant resistance. Moreover, B6-M76C mice demonstrating a pro-depressive response to chronic treatment with fluoxetine seem to represent a model for investigation of mechanisms underlying antidepressant resistance.

4. Materials and Methods

4.1. Animals

Adult (10–12 weeks old) male mice of B6-M76C and B6-M76B lines [31] were used. The animals (about 25 g) were housed under standard conditions (20–22 °C, food and water ad libitum, 12 h light/dark cycle) in groups of 7–8 per cage (40 cm × 25 cm × 15 cm). The mice were isolated into individual cages two days before behavioral tests to remove the group effect. The breeding of B6-M76C and B6-M76B lines was conducted in the Center for Genetic Resources of Laboratory Animals at Institute of Cytology and Genetics, Siberian Division, Russian Academy of Sciences (ICG SB RAS), supported by the Ministry of Education and Science of Russia (unique identifier of the project, RFMEFI62117 × 0015).
All experimental procedures were in compliance with the Guide for the Care and Use of Laboratory Animals, Eighth Edition, Committee for the Update of the Guide for the Care and Use of Laboratory Animals; National Research Council © 2020 National Academy of Sciences (USA) for animal experiments and the trial was approved by the ICG SB RAS ethics committee and registered in ICG SB RAS (Protocol No. 34, 15.06.2016).

4.2. Drug

The classical Selective Serotonin Reuptake Inhibitor fluoxetine (Biokom, Stavropol, Russia) was dissolved in saline and administered intraperitoneally (i.p.) in a dose of 20 mg/kg.

4.3. Design of the Experiment

The effects of chronic fluoxetine treatment were assessed after 14 days of daily i.p injections. We used thirty B6-M76C mice and thirty-two B6-M76B mice. Mice of each line were divided into two equal groups (n = 15–17 per group)—a control group and an experimental group (fluoxetine). Control mice were treated with the same volume of saline. Their behavior was ad libitum tested through open field (OF) and forced swim tests (FST) the next day after the last fluoxetine dose to avoid acute administration effects.

4.4. Open Field Test

The OF test was carried out in a circle arena (40 cm in diameter) surrounded by a white plastic wall (25 cm high) and illuminated through the mat and semi-transparent floor with two halogen lamps of 12 W each placed 40 cm under the floor [44]. The mouse was placed near the wall and its movements were tracked for 5 min with a digital camera (Sony, Tokyo, Japan). The area was carefully cleaned after each test. The video stream from the camera was analyzed frame by frame using the original EthoStudio software [45]. The horizontal locomotor activity (distance run) and time in the center were measured automatically.

4.5. Forced Swim Test

Mice were placed in a clear glass box (30 × 30 × 30 cm) filled with water at a temperature of 25 °C. Mouse mobility was measured during 4 min (after 2 min adaptation) by the EthoStudio program. The program measured the rate of change in the silhouette of an animal, which was determined as the number of animal-associated pixels changed between two adjacent frames [46]. For the behavioral tests (OF test and FST), 62 animals were used.

4.6. Brain Structures Isolation

Two days after behavioral testing, animals were decapitated and the brain structures (frontal cortex, hippocampus, midbrain and hypothalamus) were isolated on ice, frozen in liquid nitrogen and stored at −80 °C until following procedures.

4.7. Tissue Extraction for Isolation Total mRNA and for HPLC

The brain structures were homogenized in the Potter-Elvehjem homogenizer in 200 µL 50 mM Tris HCl, pH 7.6 (4 °C). Then, 150 μL aliquot was used for total RNA extraction with Trizol and 50 μL aliquot was mixed with 0.6 M HClO4 for HPLC (see below). For the experiment, 28 animals were used.

4.8. Real-Time PCR

Total RNA was isolated with Trizol reagent (Thermoscientific, Waltham, MA, USA) and 1 µg of the mRNA was used for cDNA synthesis with a random hexanucleotide primer. The number of copies of Htr1a, Htr2a, Htr7, Slc6a4 (gene coding 5-HTT), Tph2, Maoa and Cc2d1a genes’ cDNA was estimated using SYBR Green (Synergy Bands, Inc.®, New York, NY, USA) real-time quantitative PCR with selective primers (Table 2). We used 50, 100, 200, 400, 800, 1600, 3200 and 6400 copies of genomic DNA as external standards for all studied genes. The mRNA levels were presented as the number of its cDNA copies with respect to 100 copies of Polr2a cDNA [47,48,49].

4.9. HPLC Protocol

For HPLC, 50 μL aliquot was mixed with 0.6 M HClO4 (Sigma–Aldrich, St. Louis, MO, USA) containing 200 ng/mL isoproterenol (Sigma Aldrich, St. Louis, MO, USA) as an internal standard. Homogenate was centrifuged at 12,000× g for 15 min at 4 °C for protein precipitation. The supernatants were diluted two times with ultrapure water and filtered using a centrifuge tube with 0.22 µm cellulose acetate filter (Spin-X®, Mooresville, NC, USA). The pellet was stored at −20 °C until protein quantitation by the Bradford method. Twenty microliters of the filtered supernatant were injected into the loop of the HPLC system.
The levels of 5-HT and 5-HIAA were analyzed in the brain structures using HPLC as it was described earlier [50].
The temperature of the column was stabilized at 40 °C. The amounts (ng) of substances were calculated relative to the internal standard. The contents of substances were expressed in ng/mg of protein (assayed by Bradford).

4.10. Western blot

The protein levels were estimated as described earlier [50]. The used primary antibodies are presented in Table 3. Quantification of protein bands was performed by ImageStudio (LI-COR, Lincoln, NE, USA). Target protein levels were normalized to GAPDH chemiluminescence relative units, represented as the percentage of sham B6-M76B animals. For the experiment, 27 animals were used.

4.11. Statistical Analysis

All values were presented as means ± SEM and compared with a two-way factorial ANOVA with genotype (B6-M76B vs. B6-M76C) and fluoxetine (sham vs. fluoxetine) as between factors followed by Fisher’s post hoc analysis. Outliers were determined using the Dickson parameter and excluded from the analysis [51]. Statistical significance was set at p < 0.05.

Author Contributions

Conceptualization, V.S.N. and E.M.K.; methodology, T.V.I., Y.V.A.; validation, V.S.N., E.M.K and A.Y.R.; formal analysis T.V.I., A.S.T., and A.Y.R.; investigation, A.Y.R. and D.V.E.; resources, V.S.N; data curation, V.S.N.; writing—original draft preparation, V.S.N. and E.M.K., writing—review and editing, N.K.P.; visualization, T.V.I.; supervision, N.K.P.; project administration, E.M.K.; funding acquisition, E.M.K. All authors have read and agreed to the published version of the manuscript.

Funding

This research was supported by the Russian Science Foundation (grant No. 19-15-00027).

Acknowledgments

The cost of animal maintenance was supported by the basic research project #0324-2019-0041-C-01.

Conflicts of Interest

The authors declare no conflict of interest.

References

  1. Duman, R.S.; Heninger, G.R.; Nestler, E.J. A Molecular and Cellular Theory of Depression. Arch. Gen. Psychiatry 1997, 54, 597–606. [Google Scholar] [CrossRef] [PubMed]
  2. Harro, J.; Oreland, L. Depression as a spreading neuronal adjustment disorder. Eur. Neuropsychopharmacol. 1996, 6, 207–223. [Google Scholar] [CrossRef]
  3. Jans, L.A.W.; Riedel, W.J.; Markus, C.R.; Blokland, A. Serotonergic vulnerability and depression: Assumptions, experimental evidence and implications. Mol. Psychiatry 2006, 12, 522–543. [Google Scholar] [CrossRef]
  4. Popova, N.K.; Naumenko, V.S. 5-HT1A receptor as a key player in the brain 5-HT system. Rev. Neurosci. 2013, 24, 1–14. [Google Scholar] [CrossRef]
  5. Albert, P.R.; Le François, B.; Millar, A.M. Transcriptional dysregulation of 5-HT1A autoreceptors in mental illness. Mol. Brain 2011, 4, 21. [Google Scholar] [CrossRef] [PubMed] [Green Version]
  6. Fuller, R.W. Role of serotonin in therapy of depression and related disorders. J. Clin. Psychiatry 1991, 52, 52–57. [Google Scholar]
  7. Heisler, L.K.; Chu, H.-M.; Brennan, T.J.; Danao, J.A.; Bajwa, P.; Parsons, L.H.; Tecott, L.H. Elevated anxiety and antidepressant-like responses in serotonin 5-HT1A receptor mutant mice. Proc. Natl. Acad. Sci. USA 1998, 95, 15049–15054. [Google Scholar] [CrossRef] [Green Version]
  8. Overstreet, D.H.; Commissaris, R.C.; De La Garza, R.; File, S.E.; Knapp, D.J.; Seiden, L.S. Involvement of 5-HT 1A Receptors in Animal Tests of Anxiety and Depression: Evidence from Genetic Models. Stress 2003, 6, 101–110. [Google Scholar] [CrossRef]
  9. Ramboz, S.; Oosting, R.; Amara, D.A.; Kung, H.F.; Blier, P.; Mendelsohn, M.; Mann, J.J.; Brunner, D.; Hen, R. Serotonin receptor 1A knockout: An animal model of anxiety-related disorder. Proc. Natl. Acad. Sci. USA 1998, 95, 14476–14481. [Google Scholar] [CrossRef] [Green Version]
  10. Richardson-Jones, J.W.; Craige, C.P.; Guiard, B.P.; Stephen, A.; Metzger, K.L.; Kung, H.F.; Gardier, A.M.; Dranovsky, A.; David, D.J.; Beck, S.G.; et al. 5-HT1A Autoreceptor Levels Determine Vulnerability to Stress and Response to Antidepressants. Neuron 2010, 65, 40–52. [Google Scholar] [CrossRef] [Green Version]
  11. Maes, M.; Meltzer, H.Y. The serotonin hypothesis of major depression. In Psychopharmacology. The Fourth Generation of Progress Bloom; Bloom, F.E., Kupfer, D.J., Bunney, B.S., Ciaranello, R.D., Davis, K.L., Koob, G.F., Meltzer, H.Y., Schuster, C.R., Shader, R.I., Watson, S.J., Eds.; Raven Press: New York, NY, USA, 1995; pp. 933–944. [Google Scholar]
  12. Arango, V.; Underwood, M.D.; Boldrini, M.; Tamir, H.; Kassir, S.A.; Hsiung, S.-C.; Chen, J.J.-X.; Mann, J.J. Serotonin 1A Receptors, Serotonin Transporter Binding and Serotonin Transporter mRNA Expression in the Brainstem of Depressed Suicide Victims. Neuropsychopharmacology 2001, 25, 892–903. [Google Scholar] [CrossRef] [Green Version]
  13. Lowther, S.; De Paermentier, F.; Cheetham, S.C.; Crompton, M.; Katona, C.L.; Horton, R.W. 5-HT1A Receptor binding sites in post-mortem brain samples from depressed suicides and controls. J. Affect. Disord. 1997, 42, 199–207. [Google Scholar] [CrossRef]
  14. Stockmeier, C.A.; Shapiro, L.A.; Dilley, G.E.; Kolli, T.N.; Friedman, L.; Rajkowska, G. Increase in Serotonin-1A Autoreceptors in the Midbrain of Suicide Victims with Major Depression—Postmortem Evidence for Decreased Serotonin Activity. J. Neurosci. 1998, 18, 7394–7401. [Google Scholar] [CrossRef] [PubMed] [Green Version]
  15. Albert, P.R.; Lemonde, S. 5-HT1A Receptors, Gene Repression, and Depression: Guilt by Association. Neuroscience 2004, 10, 575–593. [Google Scholar] [CrossRef] [PubMed]
  16. Naumenko, V.S.; Popova, N.K.; LaCivita, E.; Leopoldo, M.; Ponimaskin, E. Interplay between Serotonin 5-HT1Aand 5-HT7Receptors in Depressive Disorders. CNS Neurosci. Ther. 2014, 20, 582–590. [Google Scholar] [CrossRef]
  17. Boldrini, M.; Underwood, M.D.; Mann, J.J.; Arango, V. Serotonin-1A autoreceptor binding in the dorsal raphe nucleus of depressed suicides. J. Psychiatr. Res. 2008, 42, 433–442. [Google Scholar] [CrossRef] [Green Version]
  18. Zhang, H.; Wang, W.; Jiang, Z.-Z.; Shang, J.; Zhang, L. Differential involvement of 5-HT1A and 5-HT1B/1D receptors in human interferon-alpha-induced immobility in the mouse forced swimming test. Arzneimittelforschung 2011, 60, 109–115. [Google Scholar] [CrossRef]
  19. Blier, P.; Ward, N.M. Is there a role for 5-HT1A agonists in the treatment of depression? Biol. Psychiatry 2003, 53, 193–203. [Google Scholar] [CrossRef]
  20. Günther, L.; Rothe, J.; Rex, A.; Voigt, J.-P.; Millan, M.J.; Fink, H.; Gilbert, S. 5-HT1A-receptor over-expressing mice: Genotype and sex dependent responses to antidepressants in the forced swim-test. Neuropharmacology 2011, 61, 433–441. [Google Scholar] [CrossRef] [Green Version]
  21. Ou, X.-M.; Jafar-Nejad, H.; Storring, J.M.; Meng, J.-H.; Lemonde, S.; Albert, P.R. Novel Dual Repressor Elements for Neuronal Cell-specific Transcription of the Rat 5-HT1A Receptor Gene. J. Biol. Chem. 2000, 275, 8161–8168. [Google Scholar] [CrossRef] [Green Version]
  22. Ou, X.-M.; Lemonde, S.; Jafar-Nejad, H.; Bown, C.D.; Goto, A.; Rogaeva, A.; Albert, P.R. Freud-1: A Neuronal Calcium-Regulated Repressor of the 5-HT1A Receptor Gene. J. Neurosci. 2003, 23, 7415–7425. [Google Scholar] [CrossRef] [PubMed] [Green Version]
  23. Rogaeva, A.; Albert, P.R. The mental retardation gene CC2D1A/Freud-1 encodes a long isoform that binds conserved DNA elements to repress gene transcription. Eur. J. Neurosci. 2007, 26, 965–974. [Google Scholar] [CrossRef] [PubMed]
  24. Rogaeva, A.; Galaraga, K.; Albert, P.R. The Freud-1/CC2D1A family: Transcriptional regulators implicated in mental retardation. J. Neurosci. Res. 2007, 85, 2833–2838. [Google Scholar] [CrossRef] [PubMed]
  25. Fuxe, K.; Narváez, M.; Ambrogini, P.; Ferraro, L.; Brito, I.; Romero-Fernández, W.; Talavera, Y.; Flores-Burgess, A.; Millón, C.; Gago, B.; et al. Receptor–Receptor Interactions in Multiple 5-HT1A Heteroreceptor Complexes in Raphe-Hippocampal 5-HT Transmission and Their Relevance for Depression and Its Treatment. Molecules 2018, 23, 1341. [Google Scholar] [CrossRef] [Green Version]
  26. Naumenko, V.S.; Bazovkina, D.V.; Kondaurova, E.M. On the Functional Cross-Talk between Brain 5-HT1A and 5-HT2A Receptors. Zhurnal Vyss. Nervn. Deiatelnosti Im. I P Pavlov. 2015, 65, 240–247. [Google Scholar]
  27. Naumenko, V.S.; Bazovkina, D.V.; Kondaurova, E.M.; Zubkov, E.A.; Kulikov, A.V. The role of 5-HT2Areceptor and 5-HT2A/5-HT1Areceptor interaction in the suppression of catalepsy. Genes Brain Behav. 2010, 9, 519–524. [Google Scholar] [CrossRef]
  28. Renner, U.; Zeug, A.; Woehler, A.; Niebert, M.; Dityatev, A.; Dityateva, G.; Gorinski, N.; Guseva, D.; Abdel-Galil, D.; Döring, F.; et al. Heterodimerization of serotonin receptors 5-HT1A and 5-HT7 differentially regulates receptor signalling and trafficking. J. Cell Sci. 2012, 125, 2486–2499. [Google Scholar] [CrossRef] [Green Version]
  29. Abbott, A. With your genes? Take one of these, three times a day. Nat. Cell Biol. 2003, 425, 760–762. [Google Scholar] [CrossRef]
  30. Kondaurova, E.M.; Bazovkina, D.V.; Kulikov, A.V. Study of the association between catalepsy, anxiety, aggression and depressive-like behavior in congenic mice. Ross. Fiziol. Zhurnal Im. I.M. Sechenova 2010, 96, 464–471. [Google Scholar]
  31. Kulikova, E.A.; V.Bazovkina, D.; A.Kulov, A.; S.Tsybko, A.; V.Fursenko, D.; V.Kulikov, A.; S.Naumenko, V.; Ponimaskin, E.; M.Kondaurova, E. Alterations in pharmacological and behavioural responses in recombinant mouse line with an increased predisposition to catalepsy: Role of the 5-HT1Areceptor. Br. J. Pharmacol. 2016, 173, 2147–2161. [Google Scholar] [CrossRef]
  32. Lucki, I.; Dalvi, A.; Mayorga, A.J. Sensitivity to the effects of pharmacologically selective antidepressants in different strains of mice. Psychopharmacology 2001, 155, 315–322. [Google Scholar] [CrossRef] [PubMed]
  33. David, D.J.P.; Bourin, M.; Jego, G.; Przybylski, C.; Jolliet, P.; Gardier, A.M. Effects of acute treatment with paroxetine, citalopram and venlafaxine in vivo on noradrenaline and serotonin outflow: A microdialysis study in Swiss mice. Br. J. Pharmacol. 2003, 140, 1128–1136. [Google Scholar] [CrossRef] [PubMed] [Green Version]
  34. Cervo, L.; Canetta, A.; Calcagno, E.; Burbassi, S.; Sacchetti, G.; Caccia, S.; Fracasso, C.; Albani, D.; Forloni, G.; Invernizzi, R.W. Genotype-Dependent Activity of Tryptophan Hydroxylase-2 Determines the Response to Citalopram in a Mouse Model of Depression. J. Neurosci. 2005, 25, 8165–8172. [Google Scholar] [CrossRef] [PubMed]
  35. Guzzetti, S.; Calcagno, E.; Canetta, A.; Sacchetti, G.; Fracasso, C.; Caccia, S.; Cervo, L.; Invernizzi, R.W. Strain differences in paroxetine-induced reduction of immobility time in the forced swimming test in mice: Role of serotonin. Eur. J. Pharmacol. 2008, 594, 117–124. [Google Scholar] [CrossRef]
  36. Kulikov, A.V.; Tikhonova, M.A.; Osipova, D.V.; Kulikov, V.A.; Popova, N.K. Association between tryptophan hydroxylase-2 genotype and the antidepressant effect of citalopram and paroxetine on immobility time in the forced swim test in mice. Pharmacol. Biochem. Behav. 2011, 99, 683–687. [Google Scholar] [CrossRef]
  37. Trivedi, J.K.; Tripathi, A.; Nischal, A.; Nischal, A. Suicide and antidepressants: What current evidence indicates. Mens Sana Monogr. 2012, 10, 33–44. [Google Scholar] [CrossRef] [Green Version]
  38. Bianchi, M.; Moser, C.; Lazzarini, C.; Vecchiato, E.; Crespi, F. Forced swimming test and fluoxetine treatment: In vivo evidence that peripheral 5-HT in rat platelet-rich plasma mirrors cerebral extracellular 5-HT levels, whilst 5-HT in isolated platelets mirrors neuronal 5-HT changes. Exp. Brain Res. 2002, 143, 191–197. [Google Scholar] [CrossRef]
  39. Caccia, S.; Anelli, M.; Codegoni, A.M.; Fracasso, C.; Garattini, S. The effects of single and repeated anorectic doses of 5-hydroxytryptamine uptake inhibitors on indole levels in rat brain. Br. J. Pharmacol. 1993, 110, 355–359. [Google Scholar] [CrossRef] [Green Version]
  40. Popa, D.; Cerdan, J.; Reperant, C.; Guiard, B.P.; Guilloux, J.-P.; David, D.J.; Gardier, A.M. A longitudinal study of 5-HT outflow during chronic fluoxetine treatment using a new technique of chronic microdialysis in a highly emotional mouse strain. Eur. J. Pharmacol. 2010, 628, 83–90. [Google Scholar] [CrossRef]
  41. Siesser, W.B.; Sachs, B.D.; Ramsey, A.J.; Sotnikova, T.D.; Beaulieu, J.-M.; Zhang, X.; Caron, M.G.; Gainetdinov, R.R. Chronic SSRI Treatment Exacerbates Serotonin Deficiency in HumanizedTph2Mutant Mice. ACS Chem. Neurosci. 2012, 4, 84–88. [Google Scholar] [CrossRef] [Green Version]
  42. Stenfors, C.; Ross, S.B. Evidence for involvement of 5-hydroxytryptamine1B autoreceptors in the enhancement of serotonin turnover in the mouse brain following repeated treatment with fluoxetine. Life Sci. 2002, 71, 2867–2880. [Google Scholar] [CrossRef]
  43. Barnes, N.M.; Sharp, T. A review of central 5-HT receptors and their function. Neuropharmacology 1999, 38, 1083–1152. [Google Scholar] [CrossRef]
  44. Kulikov, A.V.; Tikhonova, M.A.; Kulikov, V.A. Automated measurement of spatial preference in the open field test with transmitted lighting. J. Neurosci. Methods 2008, 170, 345–351. [Google Scholar] [CrossRef] [PubMed]
  45. Khotskin, N.V.; Plyusnina, A.V.; Kulikova, E.A.; Bazhenova, E.Y.; Fursenko, D.V.; Sorokin, I.E.; Kolotygin, I.; Mormede, P.; Terenina, E.E.; Shevelev, O.B.; et al. On association of the lethal yellow (A) mutation in the agouti gene with the alterations in mouse brain and behavior. Behav. Brain Res. 2019, 359, 446–456. [Google Scholar] [CrossRef] [PubMed]
  46. Kulikov, A.V.; Morozova, M.V.; Kulikov, V.A.; Kirichuk, V.S.; Popova, N.K. Automated analysis of antidepressants’ effect in the forced swim test. J. Neurosci. Methods 2010, 191, 26–31. [Google Scholar] [CrossRef]
  47. Kulikov, A.V.; Naumenko, V.S.; Voronova, I.P.; Tikhonova, M.A.; Popova, N.K. Quantitative RT-PCR assay of 5-HT1A and 5-HT2A serotonin receptor mRNAs using genomic DNA as an external standard. J. Neurosci. Methods 2005, 141, 97–101. [Google Scholar] [CrossRef] [PubMed]
  48. Naumenko, V.S.; Kulikov, A.V. Quantitative assay of 5-HT1A receptor gene expression in the brain. Mol. Biol. 2006, 40, 30–36. [Google Scholar] [CrossRef]
  49. Naumenko, V.S.; Osipova, D.V.; Kostina, E.V.; Kulikov, A.V. Utilization of a two-standard system in real-time PCR for quantification of gene expression in the brain. J. Neurosci. Methods 2008, 170, 197–203. [Google Scholar] [CrossRef]
  50. Popova, N.K.; Ilchibaeva, T.V.; Antonov, E.V.; Pershina, A.V.; Bazovkina, D.V.; Naumenko, V.S. On the interaction between BDNF and serotonin systems: The effects of long-term ethanol consumption in mice. Alcohol 2020, 87, 1–15. [Google Scholar] [CrossRef]
  51. Dixon, W.J. Processing Data for Outliers. Biometrics 1953, 9, 74. [Google Scholar] [CrossRef]
Figure 1. Effect of chronic fluoxetine administration on path length (A) and time in the center of arena (B) in the open field test. n ≥ 15 for each group. All values are presented as mean ± SEM. ** p < 0.01, *** p < 0.001 compared to control mice of the same line.
Ijms 21 08784 g001
Figure 2. Effect of chronic fluoxetine administration on mobility (estimated as silhouette change rate) in a forced swim test. n ≥ 15 for each group. All values are presented as mean ± SEM. ** p < 0.01 compared to control mice of the same line, # p < 0.05 compared to control B6-M76B mice.
Ijms 21 08784 g002
Figure 3. Htr1a (A), Htr2a (C) and Htr7 (D) receptor and Cc2d1a (B) genes expression in the brain structures of control and chronically-treated-with-fluoxetine B6-M76C and B6-M76B mice. Gene expression is presented as the number of complementary DNA (cDNA) copies with respect to 100 cDNA copies of rPol2a, n ≥ 8 for each group. All values are presented as mean ± SEM. * p < 0.05, ** p < 0.01 compared to control mice of the same line, # p < 0.05, ## p < 0.01 compared to control B6-M76B mice.
Ijms 21 08784 g003
Figure 4. Tph2, Slc6a4 and Maoa genes expression in the midbrain of control and chronically-treated-with-fluoxetine B6-M76C and B6-M76B mice. Gene expression is presented as the number of cDNA copies with respect to 100 cDNA copies of rPol2a, n ≥ 8 for each group. All values are presented as mean ± SEM. ** p < 0.01 compared to control mice of the same line, ## p < 0.01 compared to control B6-M76B mice.
Ijms 21 08784 g004
Figure 5. Protein 5-HT1A (A), 5-HT2A (C), 5-HT7 (D) and Freud-1 (B) levels in the brain structures of control and chronically-treated-with-fluoxetine B6-M76C and B6-M76B mice. Protein levels were assessed in chemiluminescence relative units and normalized to Glyceraldehyde 3-phosphate dehydrogenase (GAPDH) chemiluminescence relative units. n = 7 for each group. All values are presented as mean ± SEM. * p < 0.05, ** p < 0.01 compared to control mice of the same line, # p < 0.05 compared to control B6-M76B mice.
Ijms 21 08784 g005
Figure 6. TPH-2 (A), 5-HTT (B) and MAO A (C) protein levels in the brain structures of control and chronically-treated-with-fluoxetine B6-M76C and B6-M76B mice. Protein levels were assessed in chemiluminescence relative units and normalized to GAPDH chemiluminescence relative units. n = 7 for each group. All values are presented as mean ± SEM. * p < 0.05 compared to control mice of the same line, @ p < 0.05 as effect of genotype.
Ijms 21 08784 g006
Figure 7. Level of 5-HT (A) 5-HIAA levels (B) and 5HIAA/5-HT ratio (C) in the brain structures of control and chronically-treated-with-fluoxetine B6-M76C and B6-M76B mice. Levels of 5-HT and 5-HIAA are presented in ng/mg, n ≥ 8 for each group. All values are presented as mean ± SEM. *** p < 0.001; * p < 0.05 compared to control mice of the same line; ### p < 0.001 compared to control B6-M76B.
Ijms 21 08784 g007
Table 1. Summary of the obtained results.
B6-M76B CFT Group
Compared to Sham
B6-M76C CFT Group
Compared to Sham
Open field testPath length
Time in center==
Forced swim testMobility=
5-HT1A mRNA/ProteinFrontal cortex=/=↓/=
Hippocampus=/=↓/↓
Freud-1 mRNA/ProteinHippocampus=/==/↑
Midbrain↓/==/=
5-HT2A mRNA/ProteinFrontal cortex↑/==/=
Hypothalamus↓/=↓/=
Midbrain=/=↓/=
5-HT7 mRNA/ProteinFrontal cortex=/=↓/=
Hippocampus↓/==/=
TPH2 mRNA/ProteinMidbrain↑/↓=/=
5-HTT mRNA/ProteinMidbrain↑/==/=
MAO A mRNA/ProteinMidbrain=/==/=
5-HTT levelFrontal cortex
Hippocampus=
Hypothalamus==
Midbrain
5-HIAA levelFrontal cortex
Hippocampus=
Hypothalamus==
Midbrain=
↓—decrease, ↑—increase, = not changed.
Table 2. The primer sequences, annealing temperatures and PCR product lengths.
GeneSequenceAnnealing Temperature, °CProduct Length, bp
Htr1aF 5′-ctgtgacctgtttatcgccctg-3′
R 5′-gtagtctatagggtcggtgattgc-3′
62200
Htr2aF 5′-agaagccaccttgtgtgtga-3′
R 5′-ttgctcattgctgatggact-3′
61169
Htr7F5′-ggctacacgatctactccaccg-3′
R5′-cgcacactcttccacctccttc-3′
65198
Tph2F 5′-cattcctcgcacaattccagtcg-3′
R 5′- cttgacatattcaactagacgctc -3′
61239
Slc6a4F 5′-cgctctactacctcatctcctcc-3′
R 5′- gtcctgggcgaagtagttgg -3′
63101
MaoaF 5′-aatgaggatgttaaatgggtagatgttggt-3′
R 5′-cttgacatattcaactagacgctc-3′
61138
Cc2d1aF 5′-gcaaagccgggcaacatcatc-3′
R 5′-tagcagaggtgggtgtagtgg-3′
60181
rPol2F 5′-tgtgacaactccatacaatgc-3′
R 5′-ctctcttagtgaatttgcgtact-3′
60194
Table 3. List of antibodies used and immunodetection conditions.
Antibodies, ManufacturerBreedingIncubation Time, Conditions
Rabbit polyclonal primary antibodies to 5-HT1A protein, Abcam, United Kingdom, ab856151:1000 in 5% milk powder with Tris-Buffered Saline with Tween 20 (TBST)Night at 4 °C
Rabbit polyclonal primary antibodies to 5-HT2A protein, Novus Biologicals, USA, Novus NBP1-491721:250 in 5% milk powder with TBSTNight at 4 °C
Rabbit monoclonal primary antibodies to 5-HT7 protein, Abcam, United Kingdom, ab1288921:500 in 5% milk powder with TBSTNight at 4 °C
Rabbit monoclonal primary antibodies to Freud-1 protein, Abcam, United Kingdom, ab1914721:2000 in 5% milk powder with TBSTNight at 4 °C
Rabbit polyclonal primary antibodies to TPH-2 protein, Abcam, United Kingdom, ab1118281:1000 in 5% milk powder with TBSTNight at 4 °C
Rabbit polyclonal primary antibodies to 5-HTT protein, US Biological Life Sciences, 3036141:1000 in 5% milk powder with TBSTNight at 4 °C
Rabbit monoclonal primary antibodies to MAOA protein, Abcam, United Kingdom, ab1267511:250 in 5% milk powder with TBSTNight at 4 °C
Rabbit polyclonal primary antibodies to GAPDH protein, conjugated to horseradish peroxidase, Santa Cruz, USA, sc-257781:500 in 5% milk powder with TBST2 h at Room Temperature
Secondary goat antibodies against rabbit immunoglobulins conjugated to horseradish peroxidase, Invitrogen, USA, G-212341:10,000 in 5% milk powder with TBST1 h at Room Temperature
Publisher’s Note: MDPI stays neutral with regard to jurisdictional claims in published maps and institutional affiliations.

