Adipose Tissue and Brain Metabolic Responses to Western Diet—Is There a Similarity between the Two?

 , ,
, ,
Abstract
:
1. Introduction
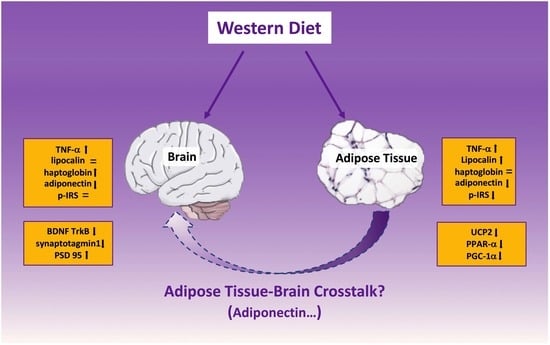
2. Results
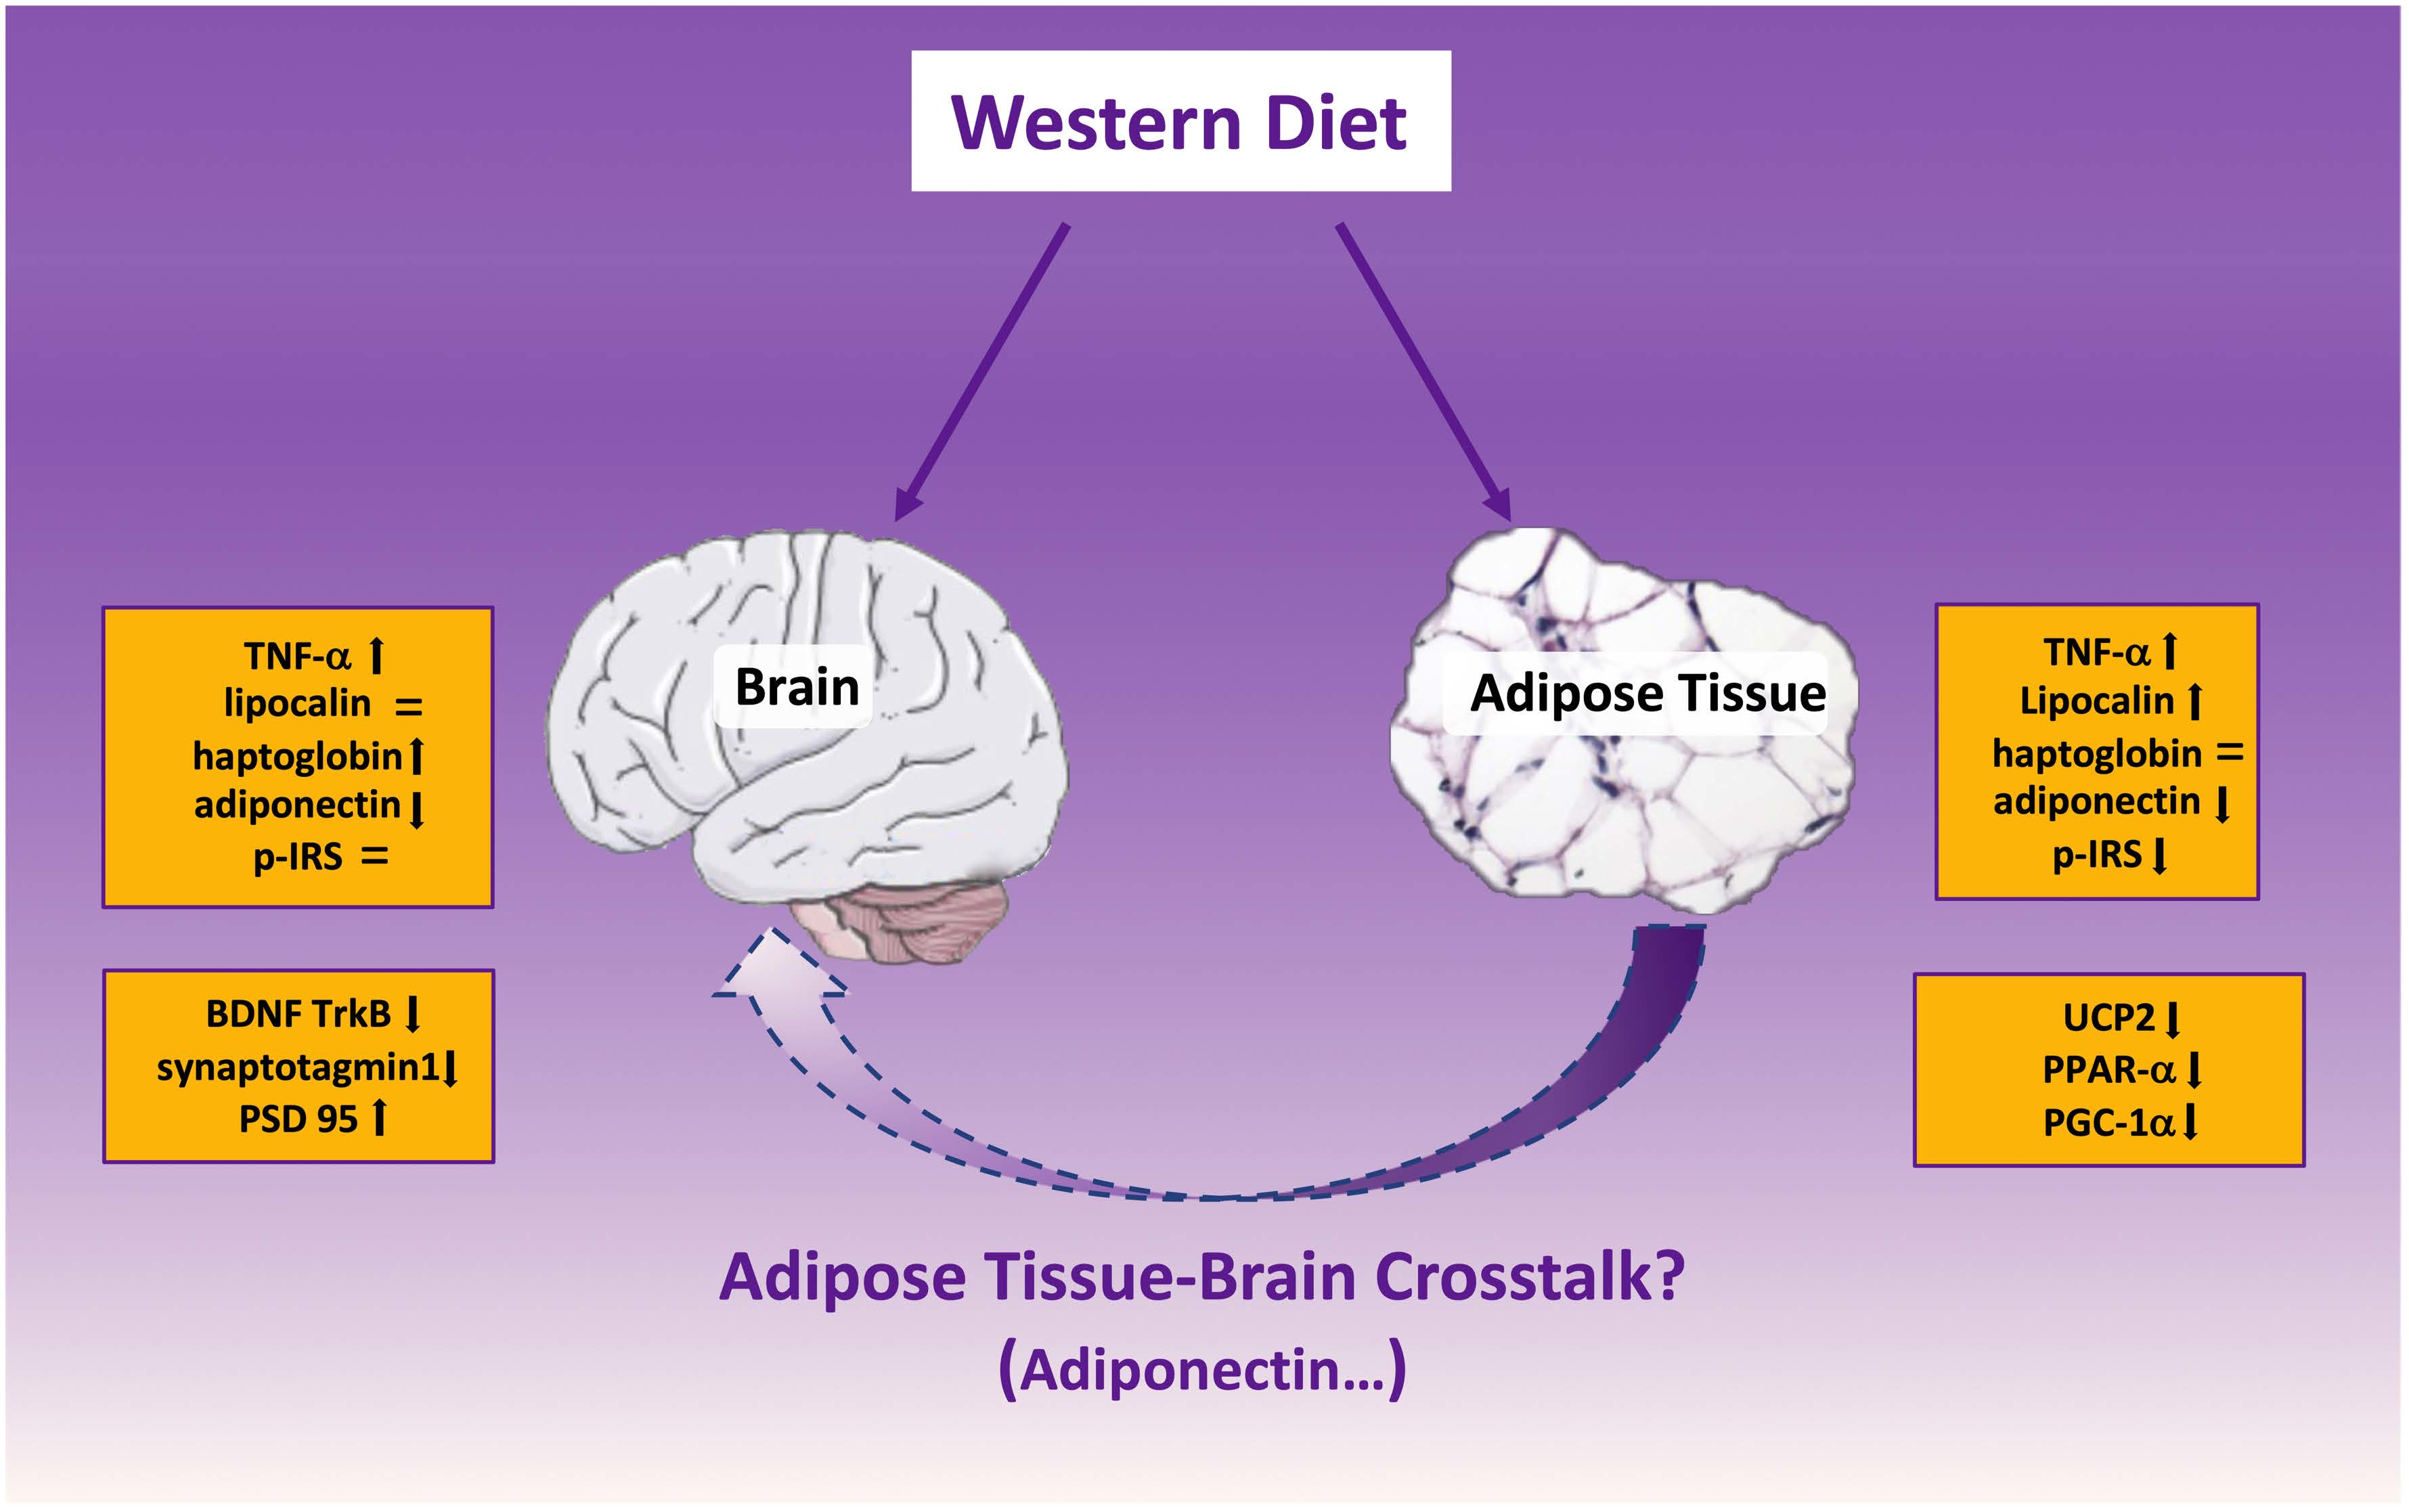
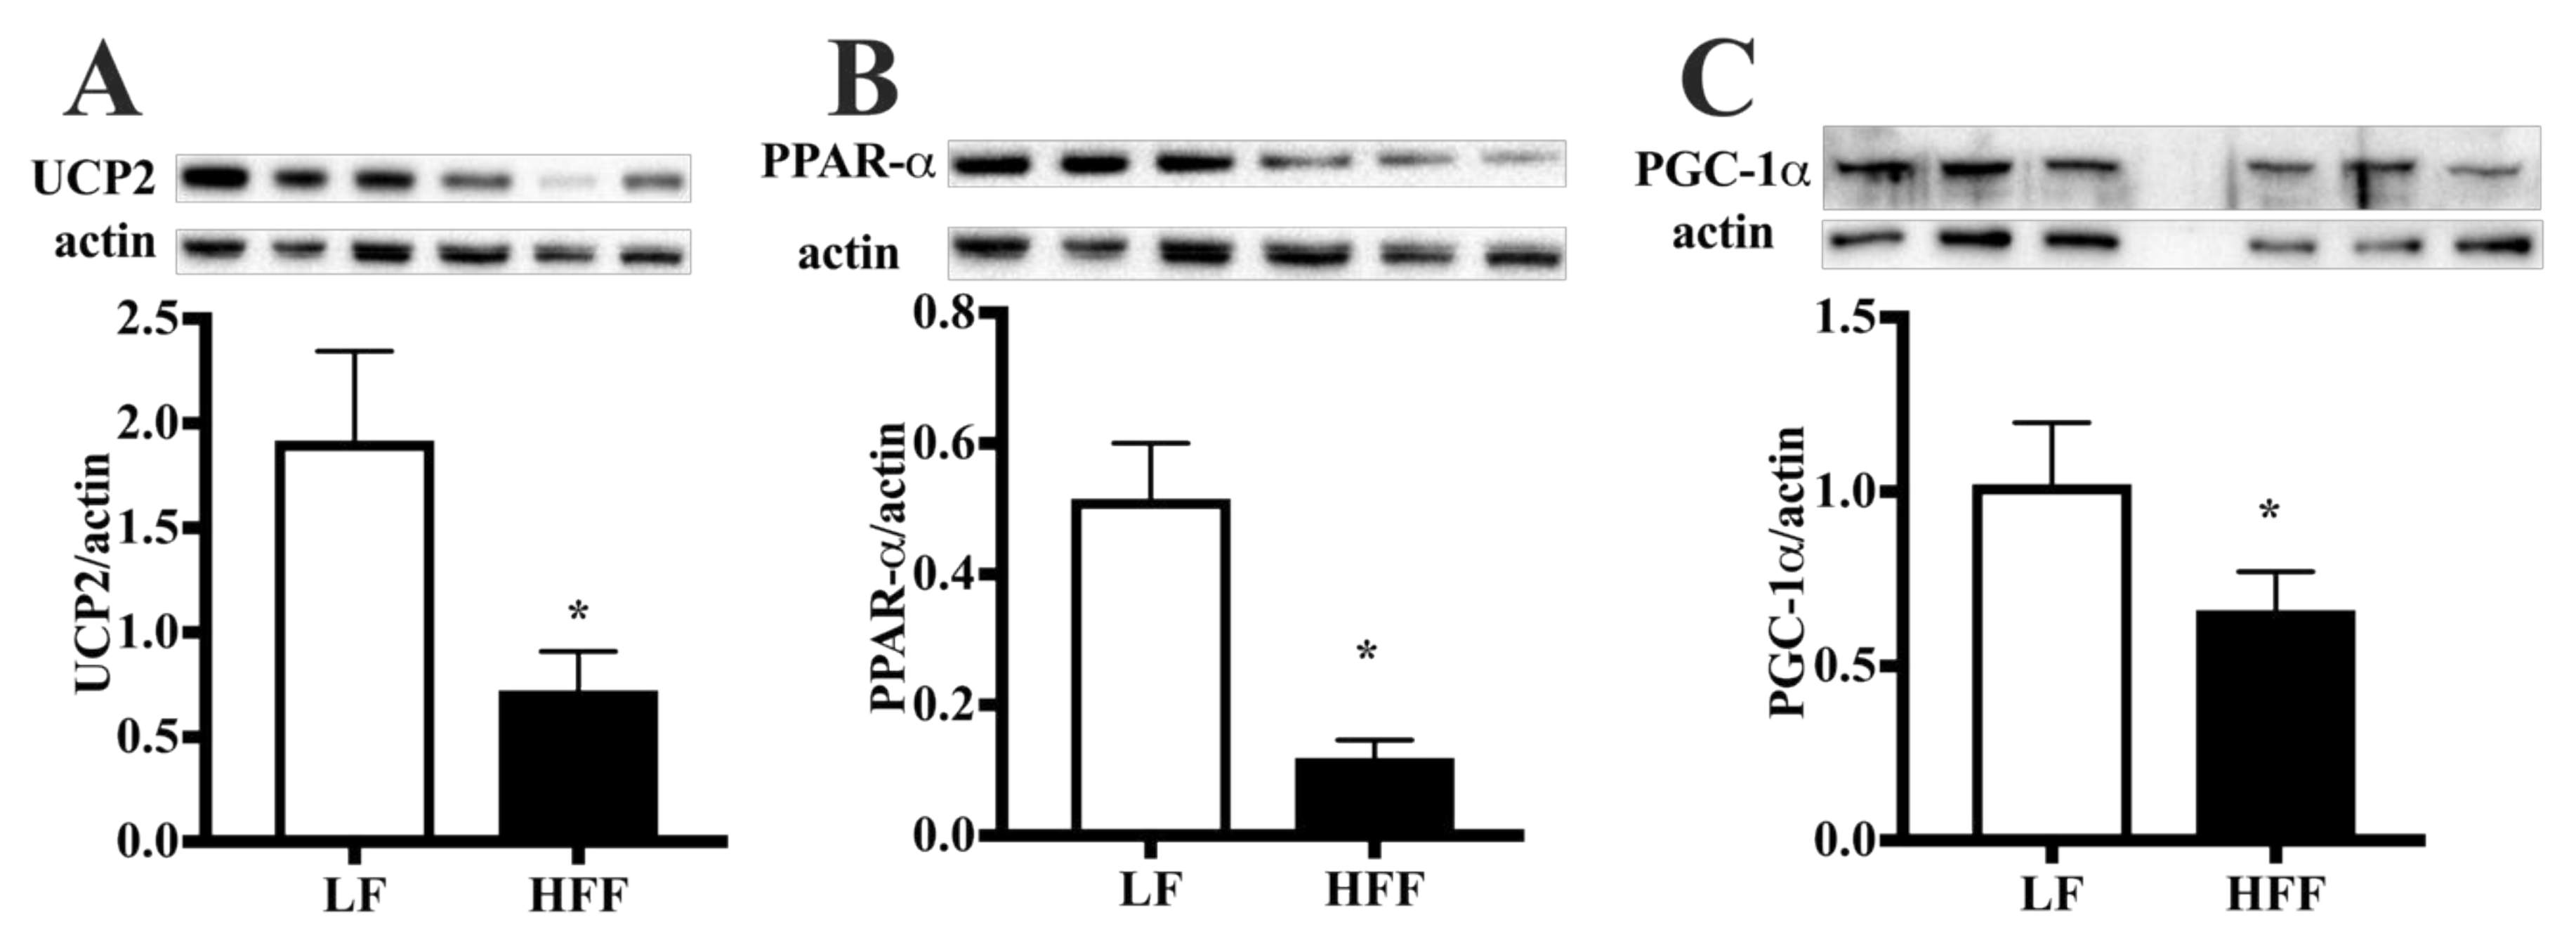
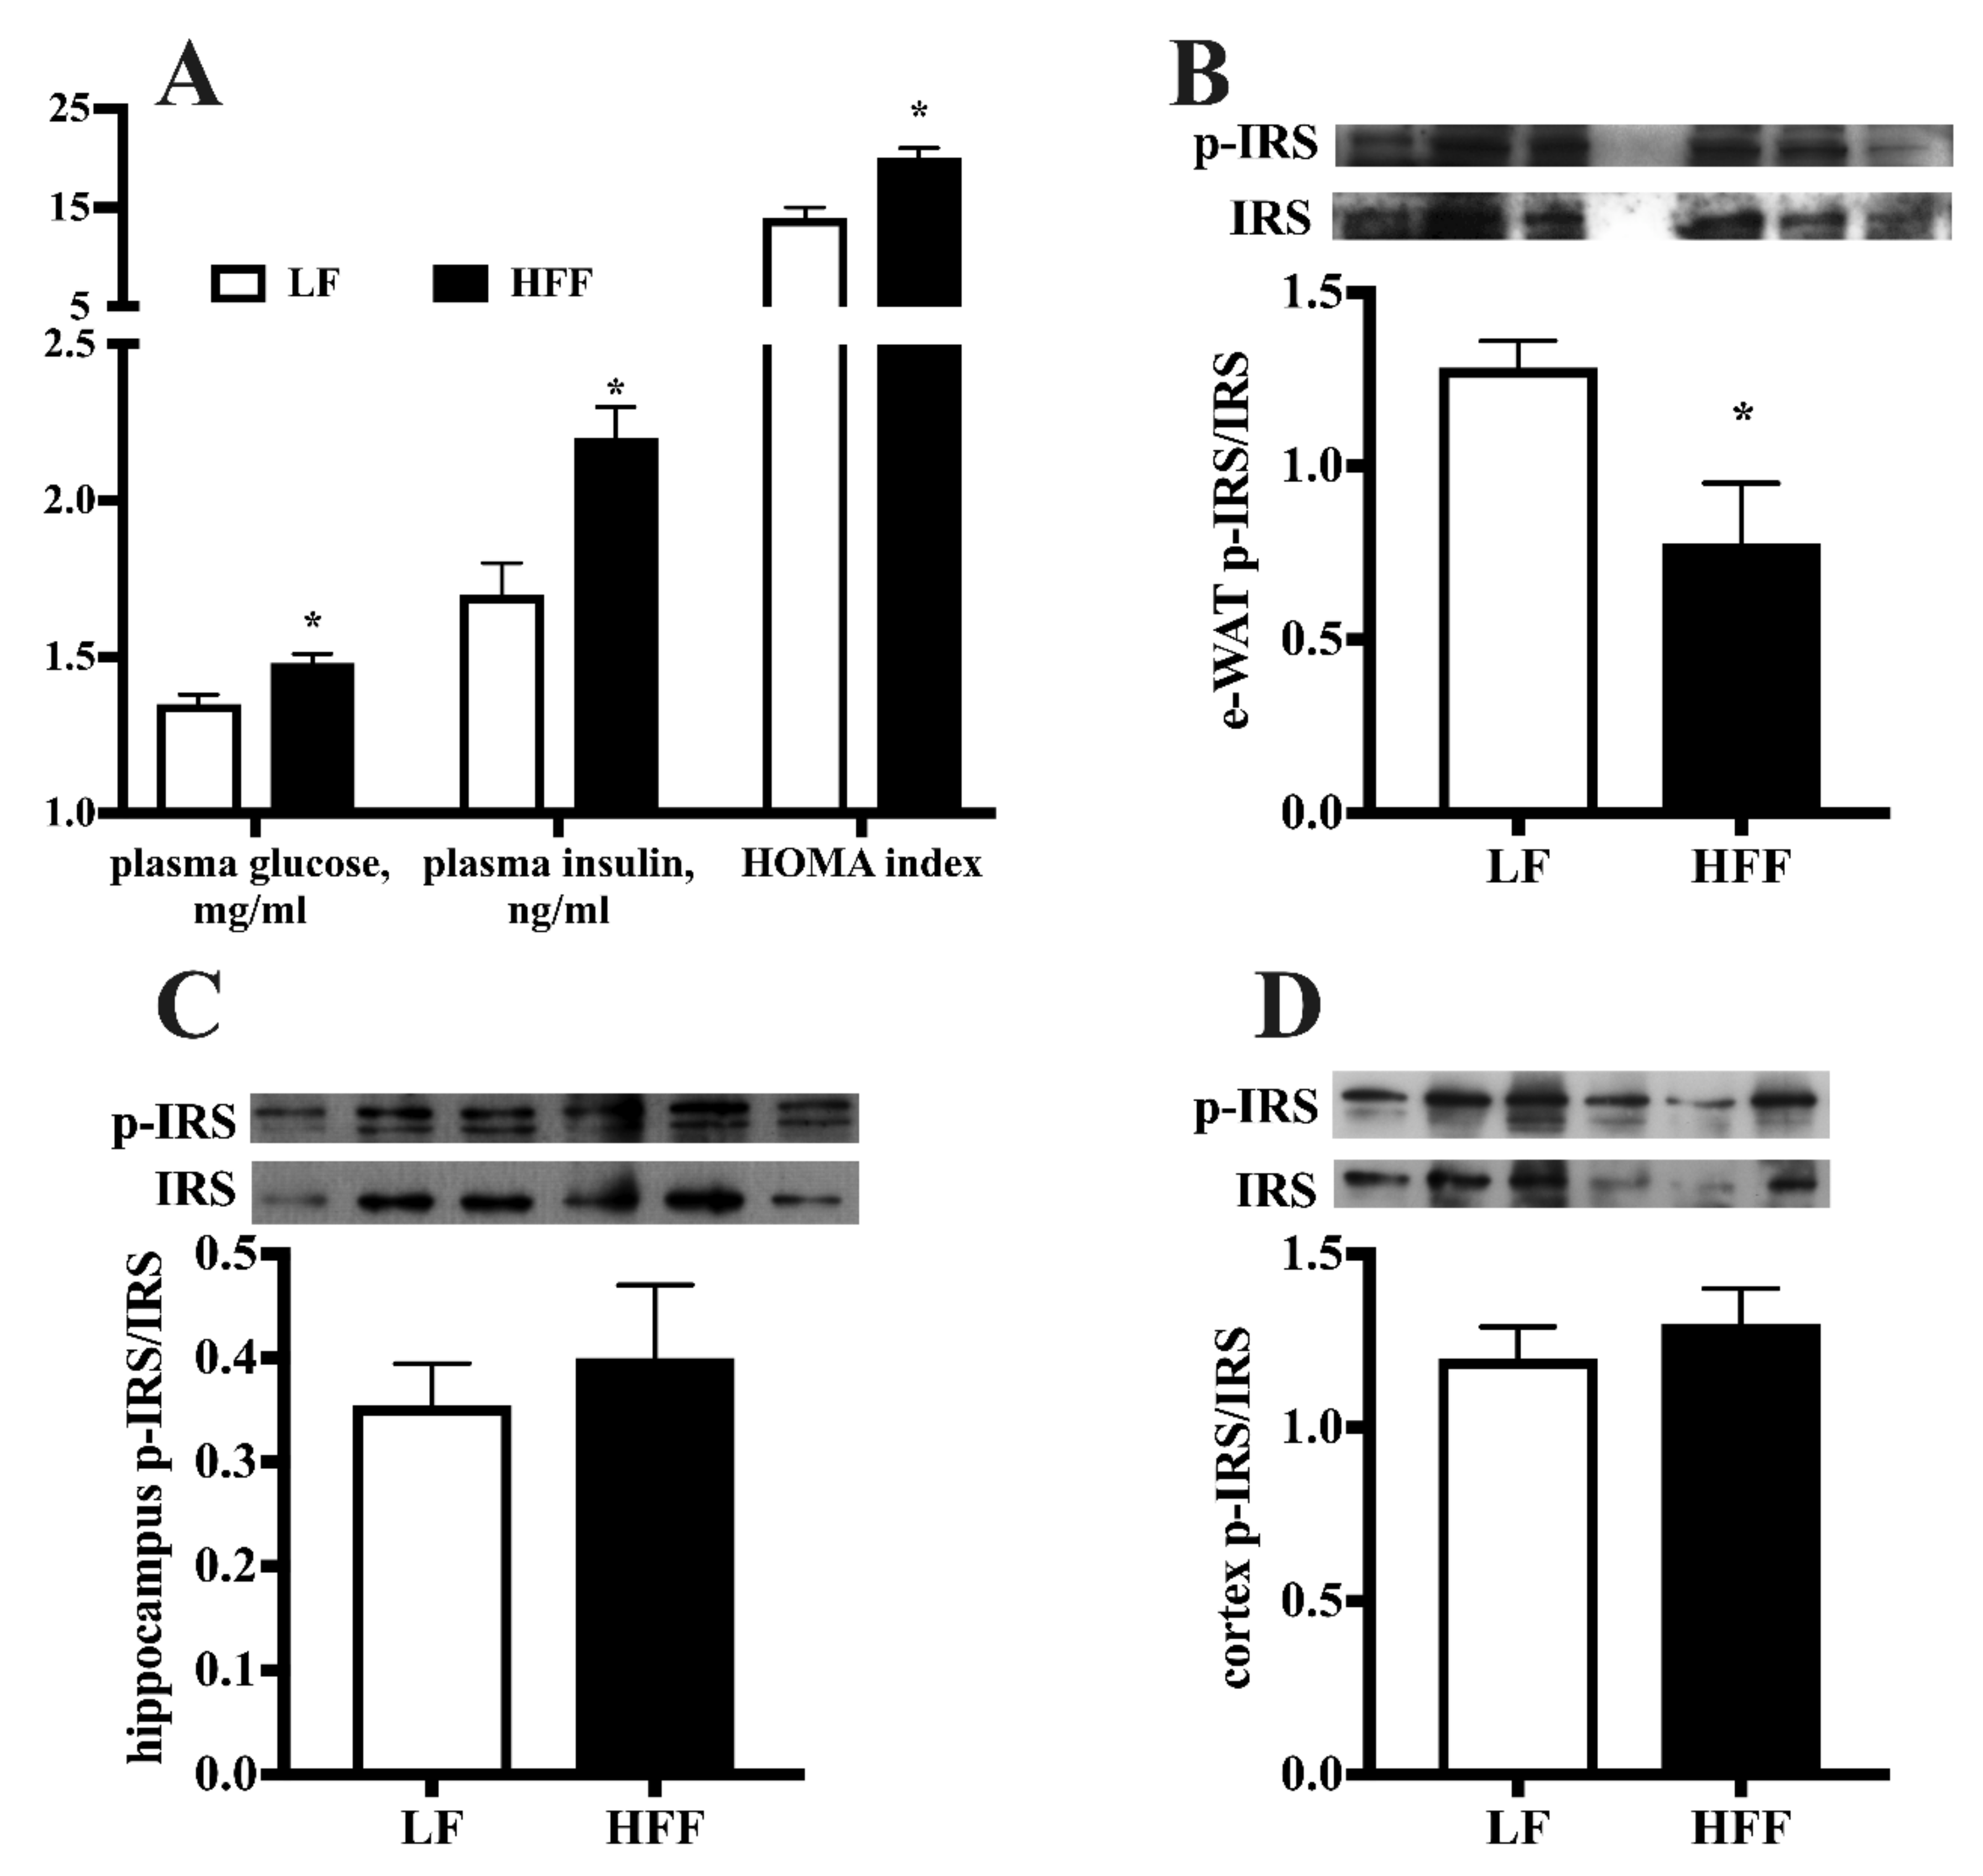
2.1. Metabolic Characterization
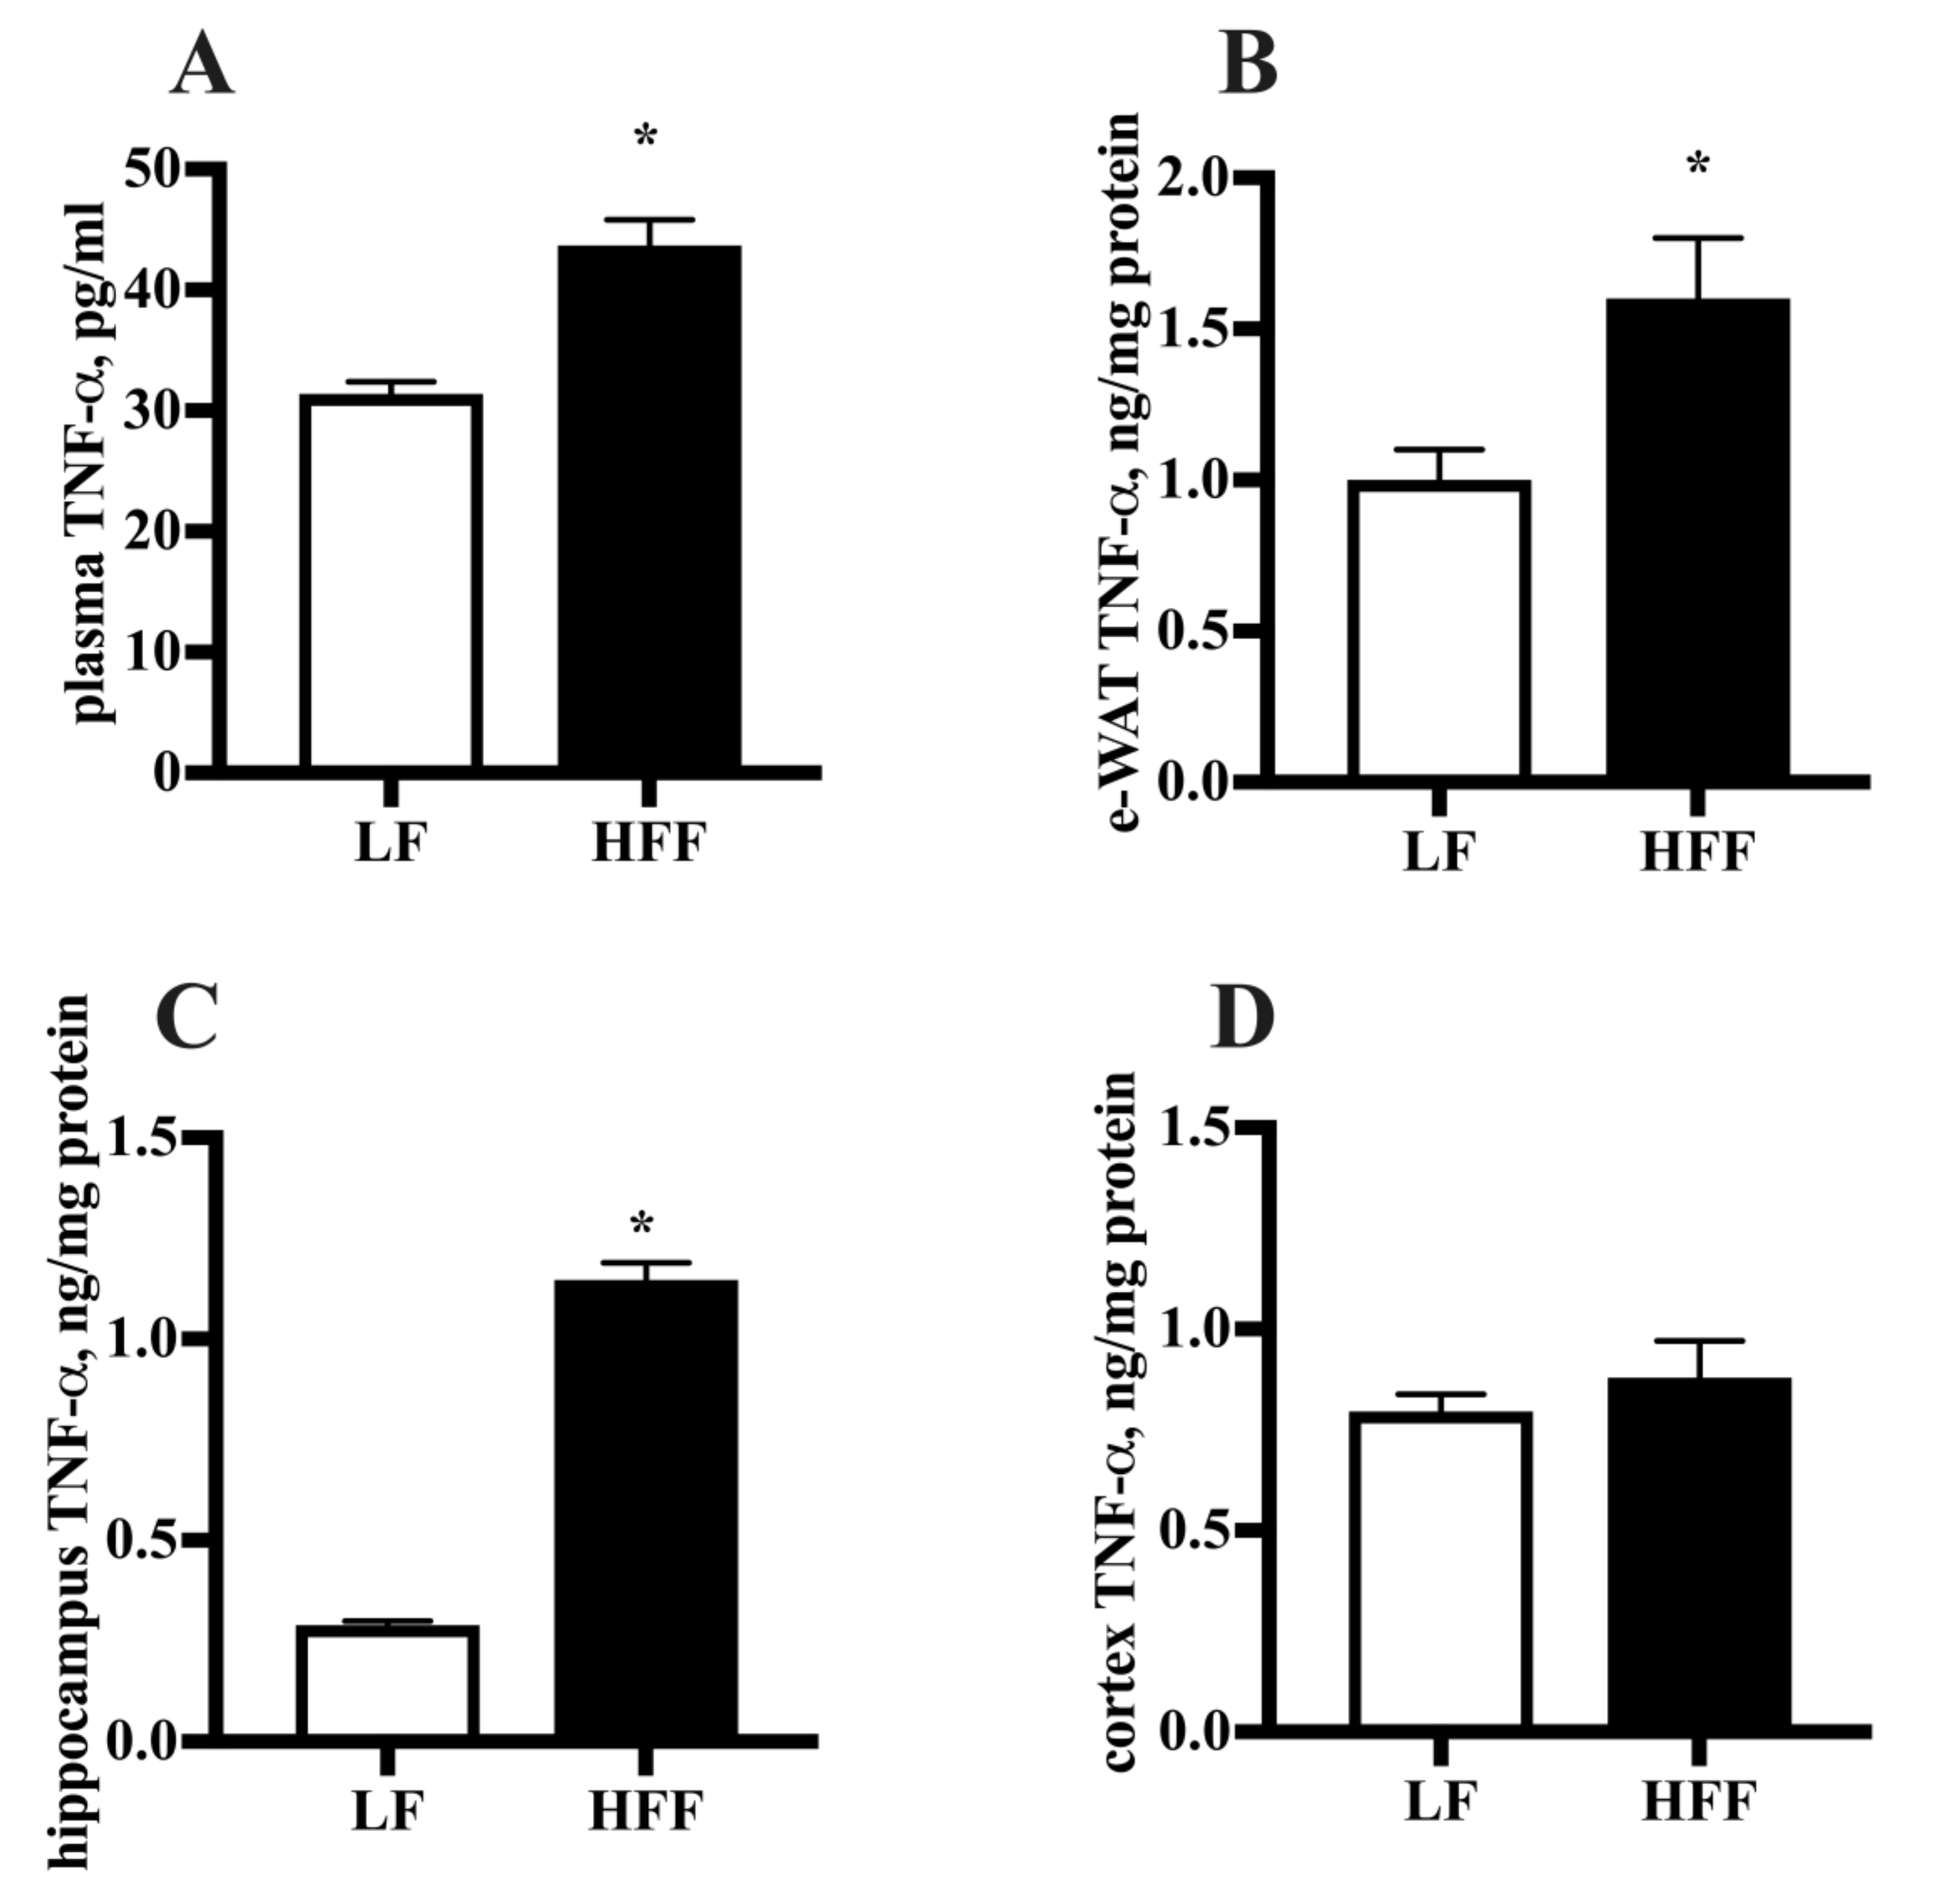
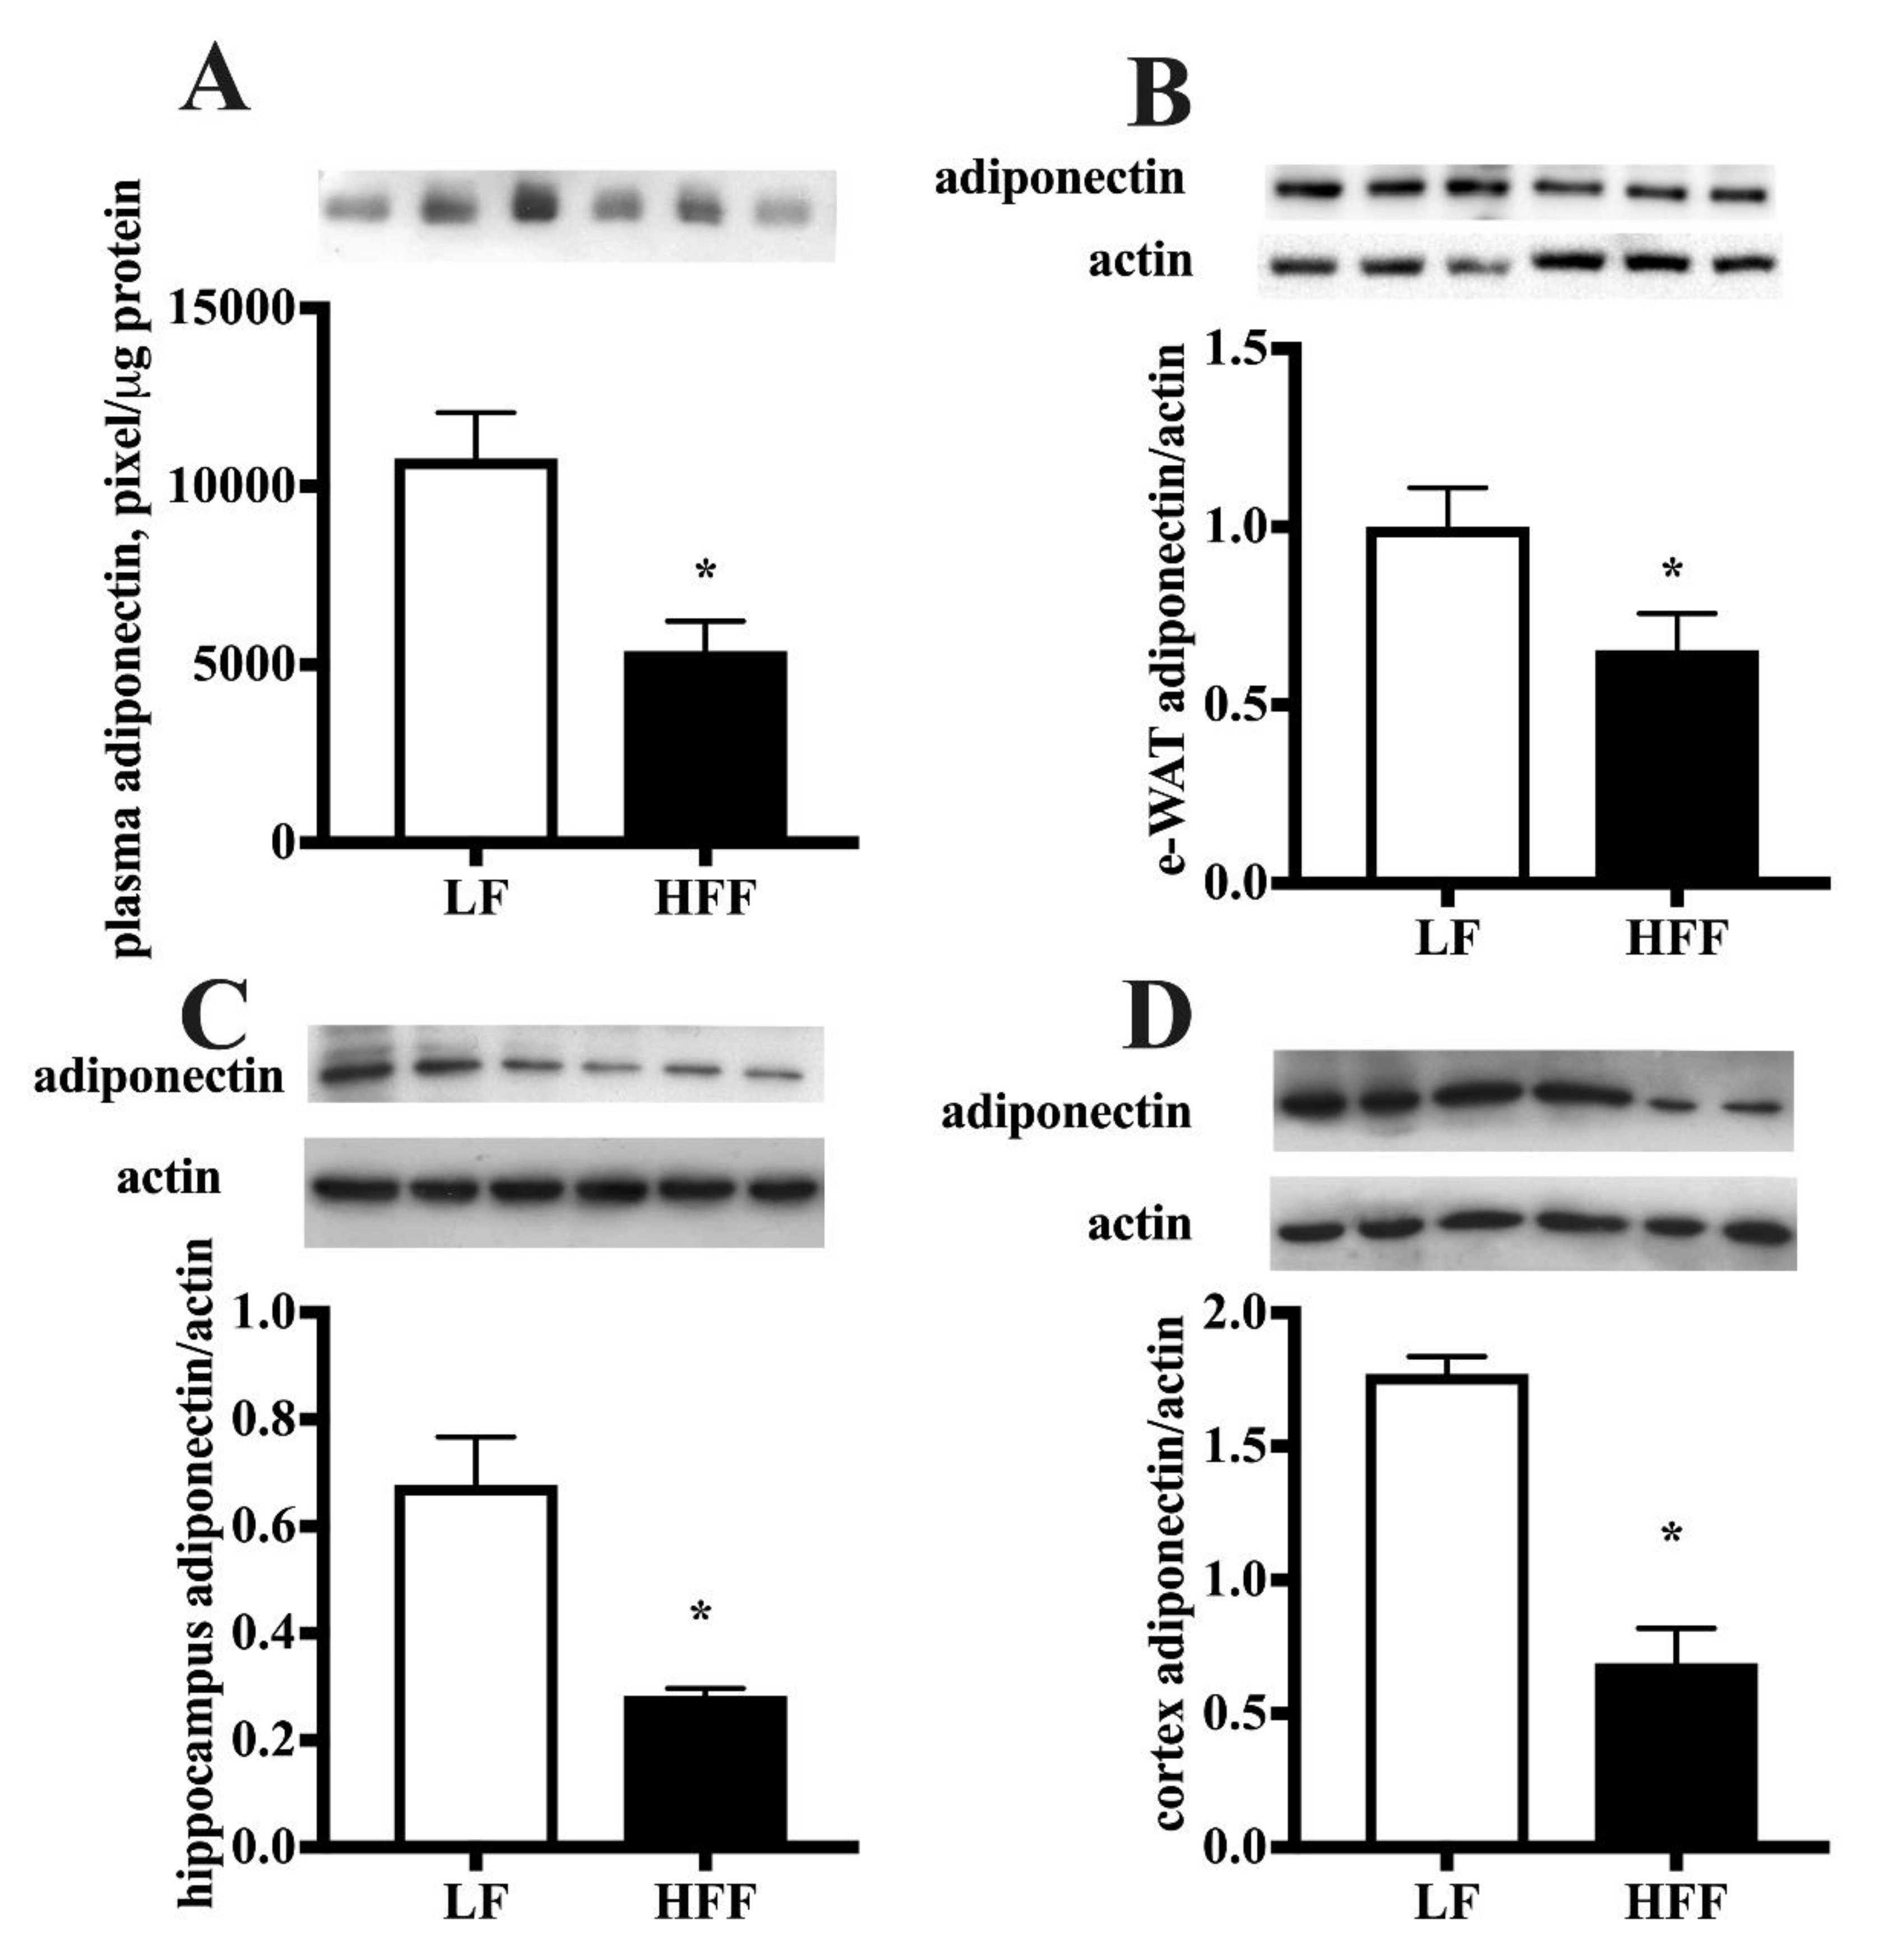
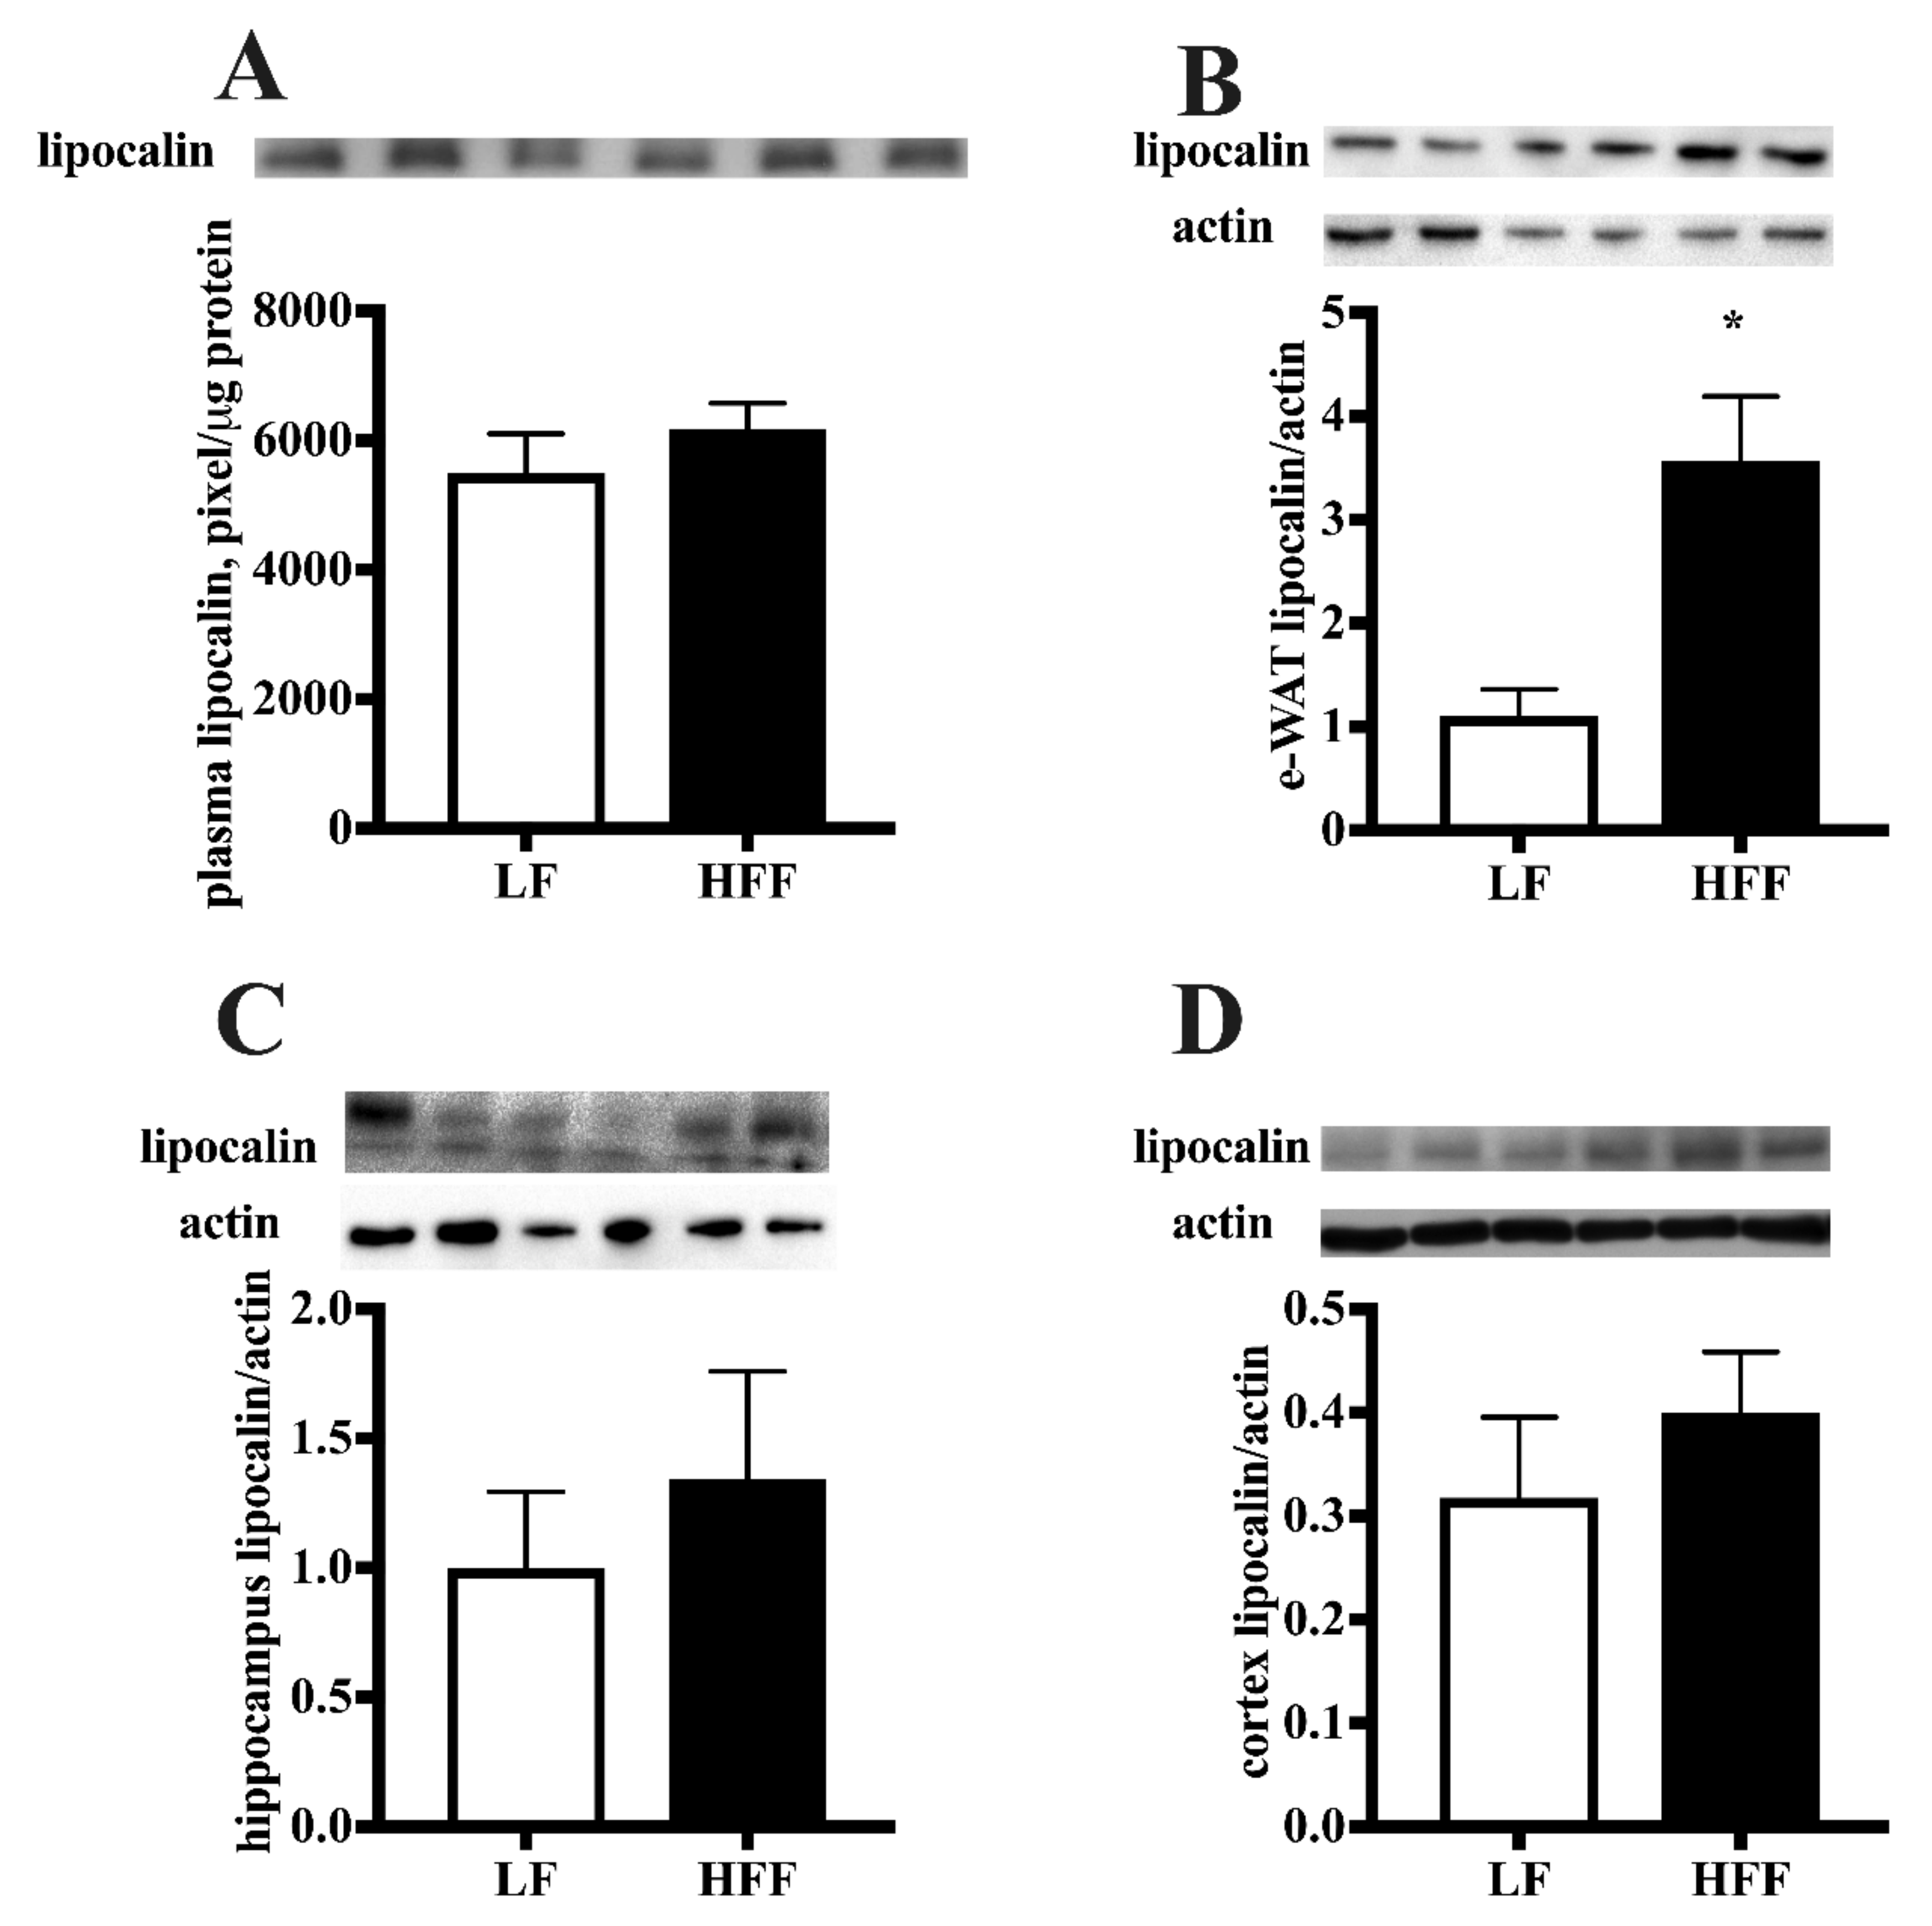
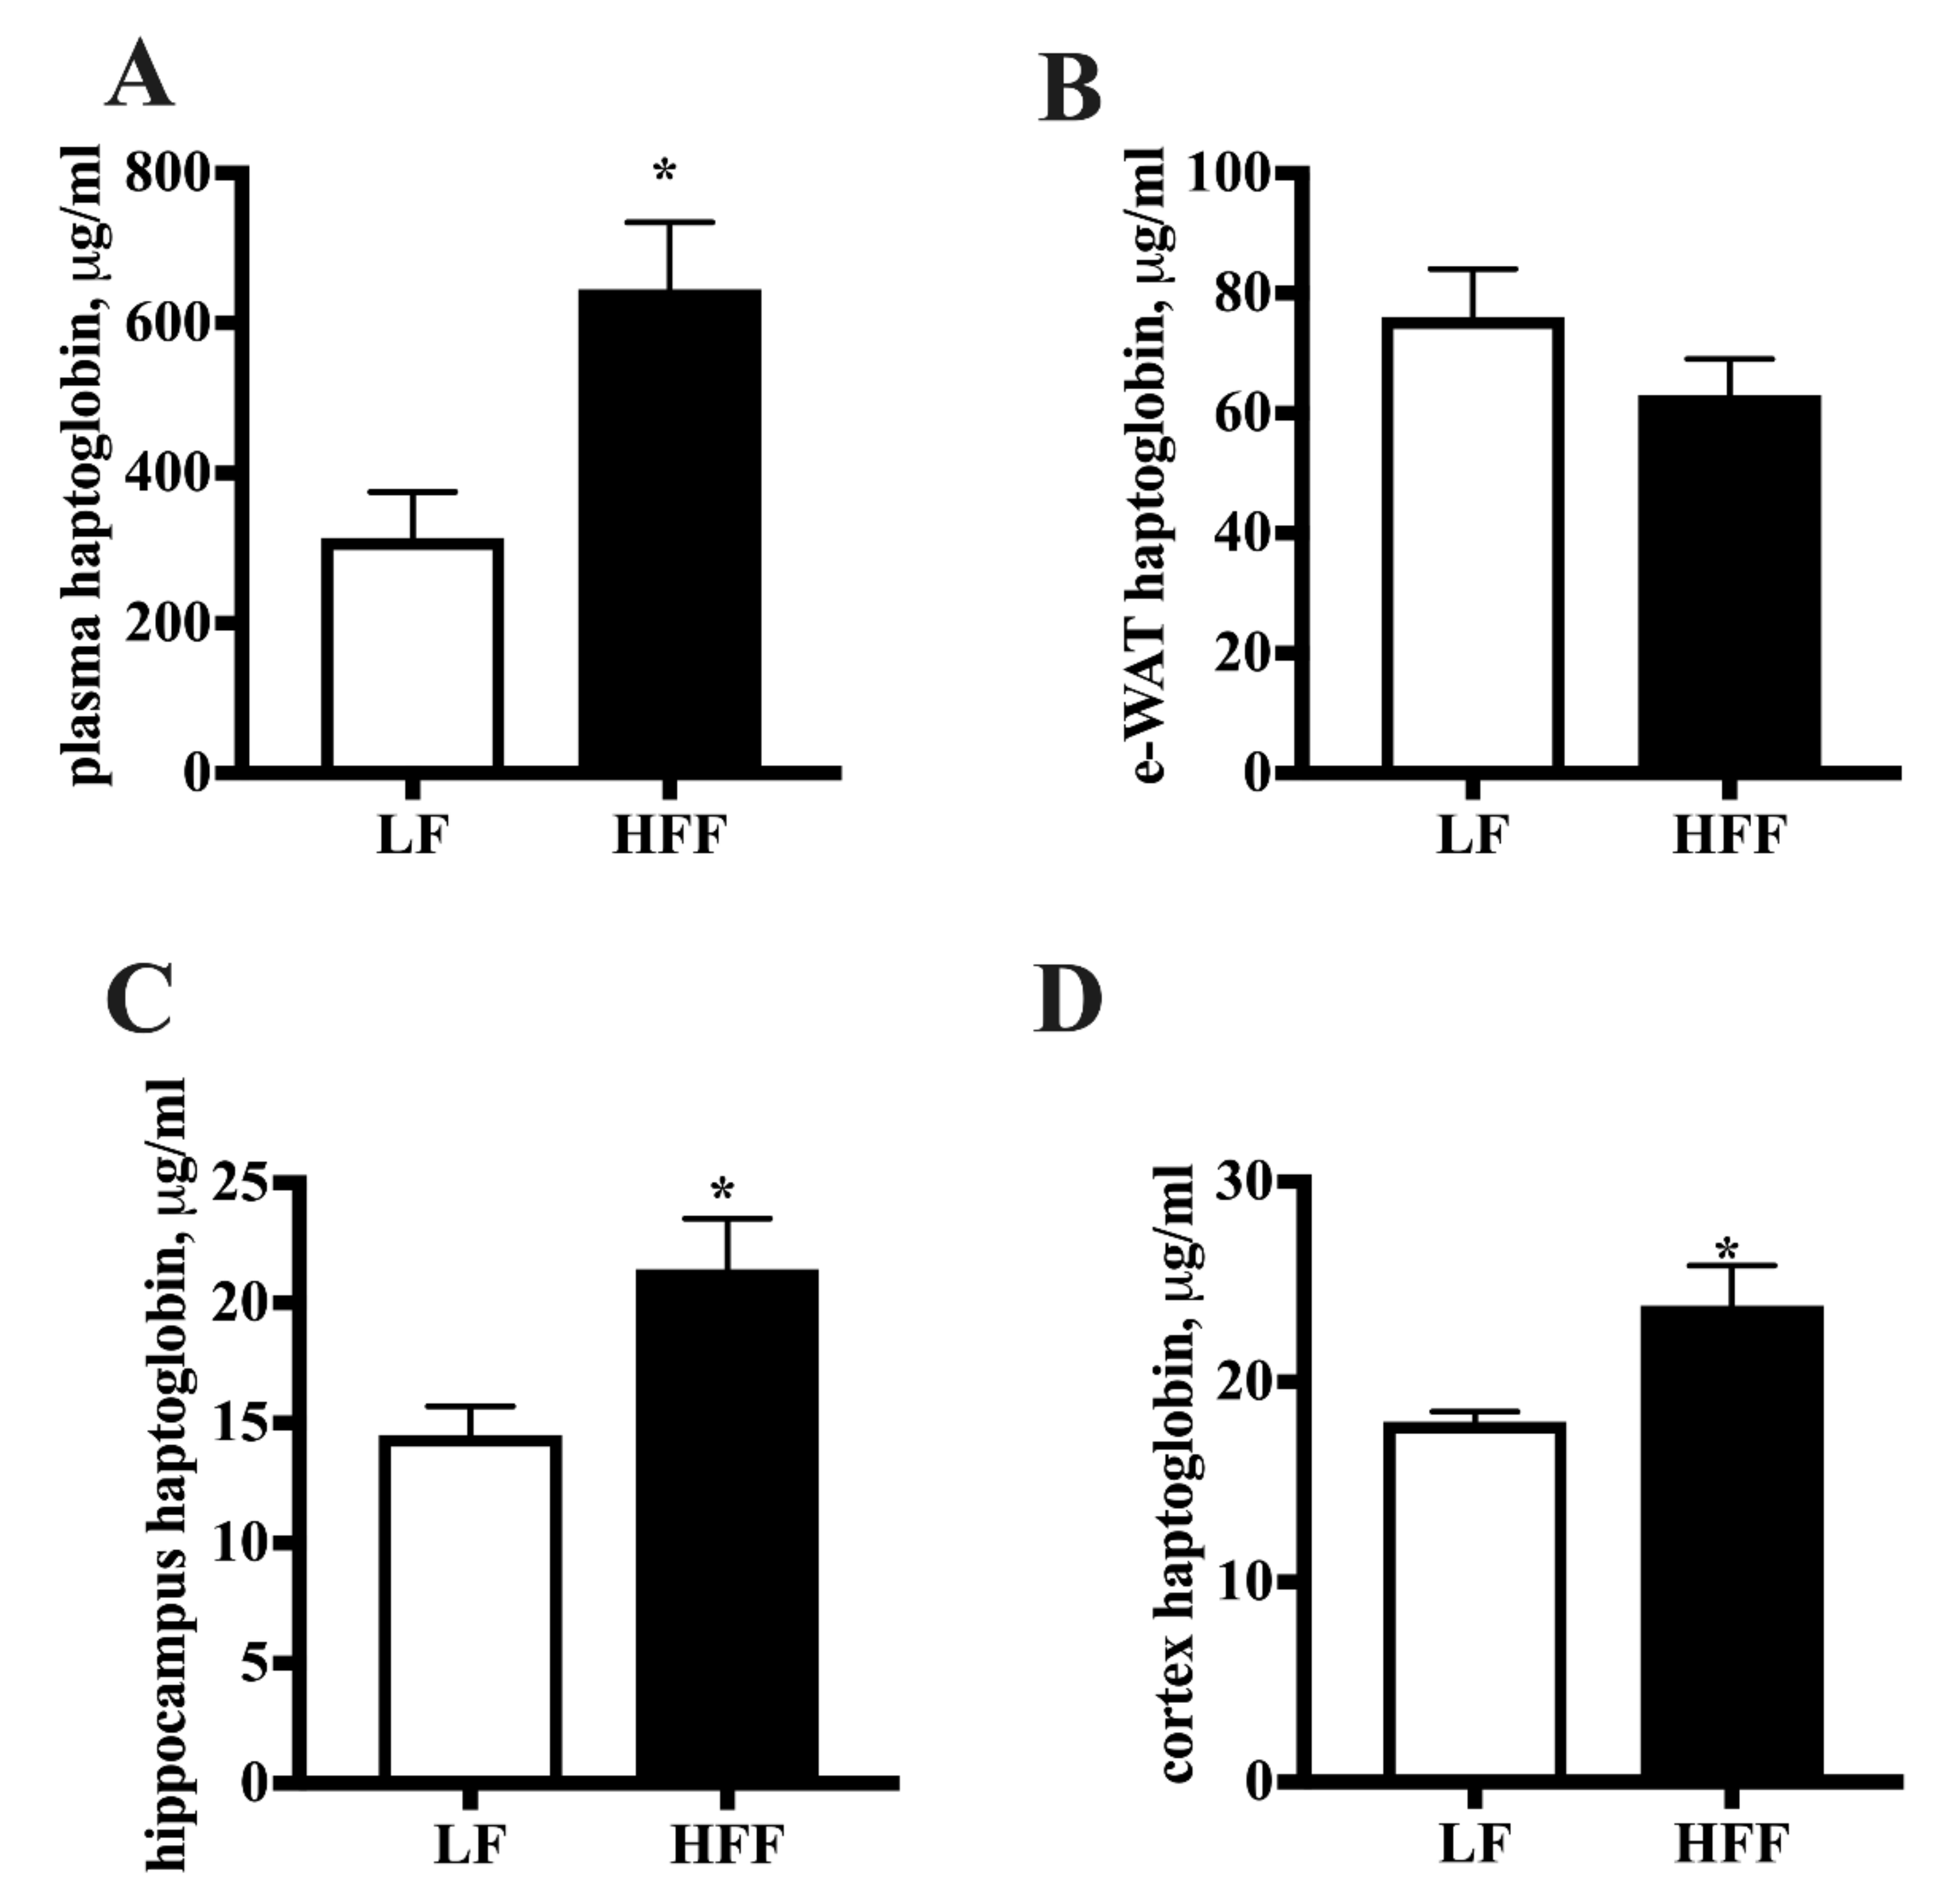
2.2. Inflammatory Markers
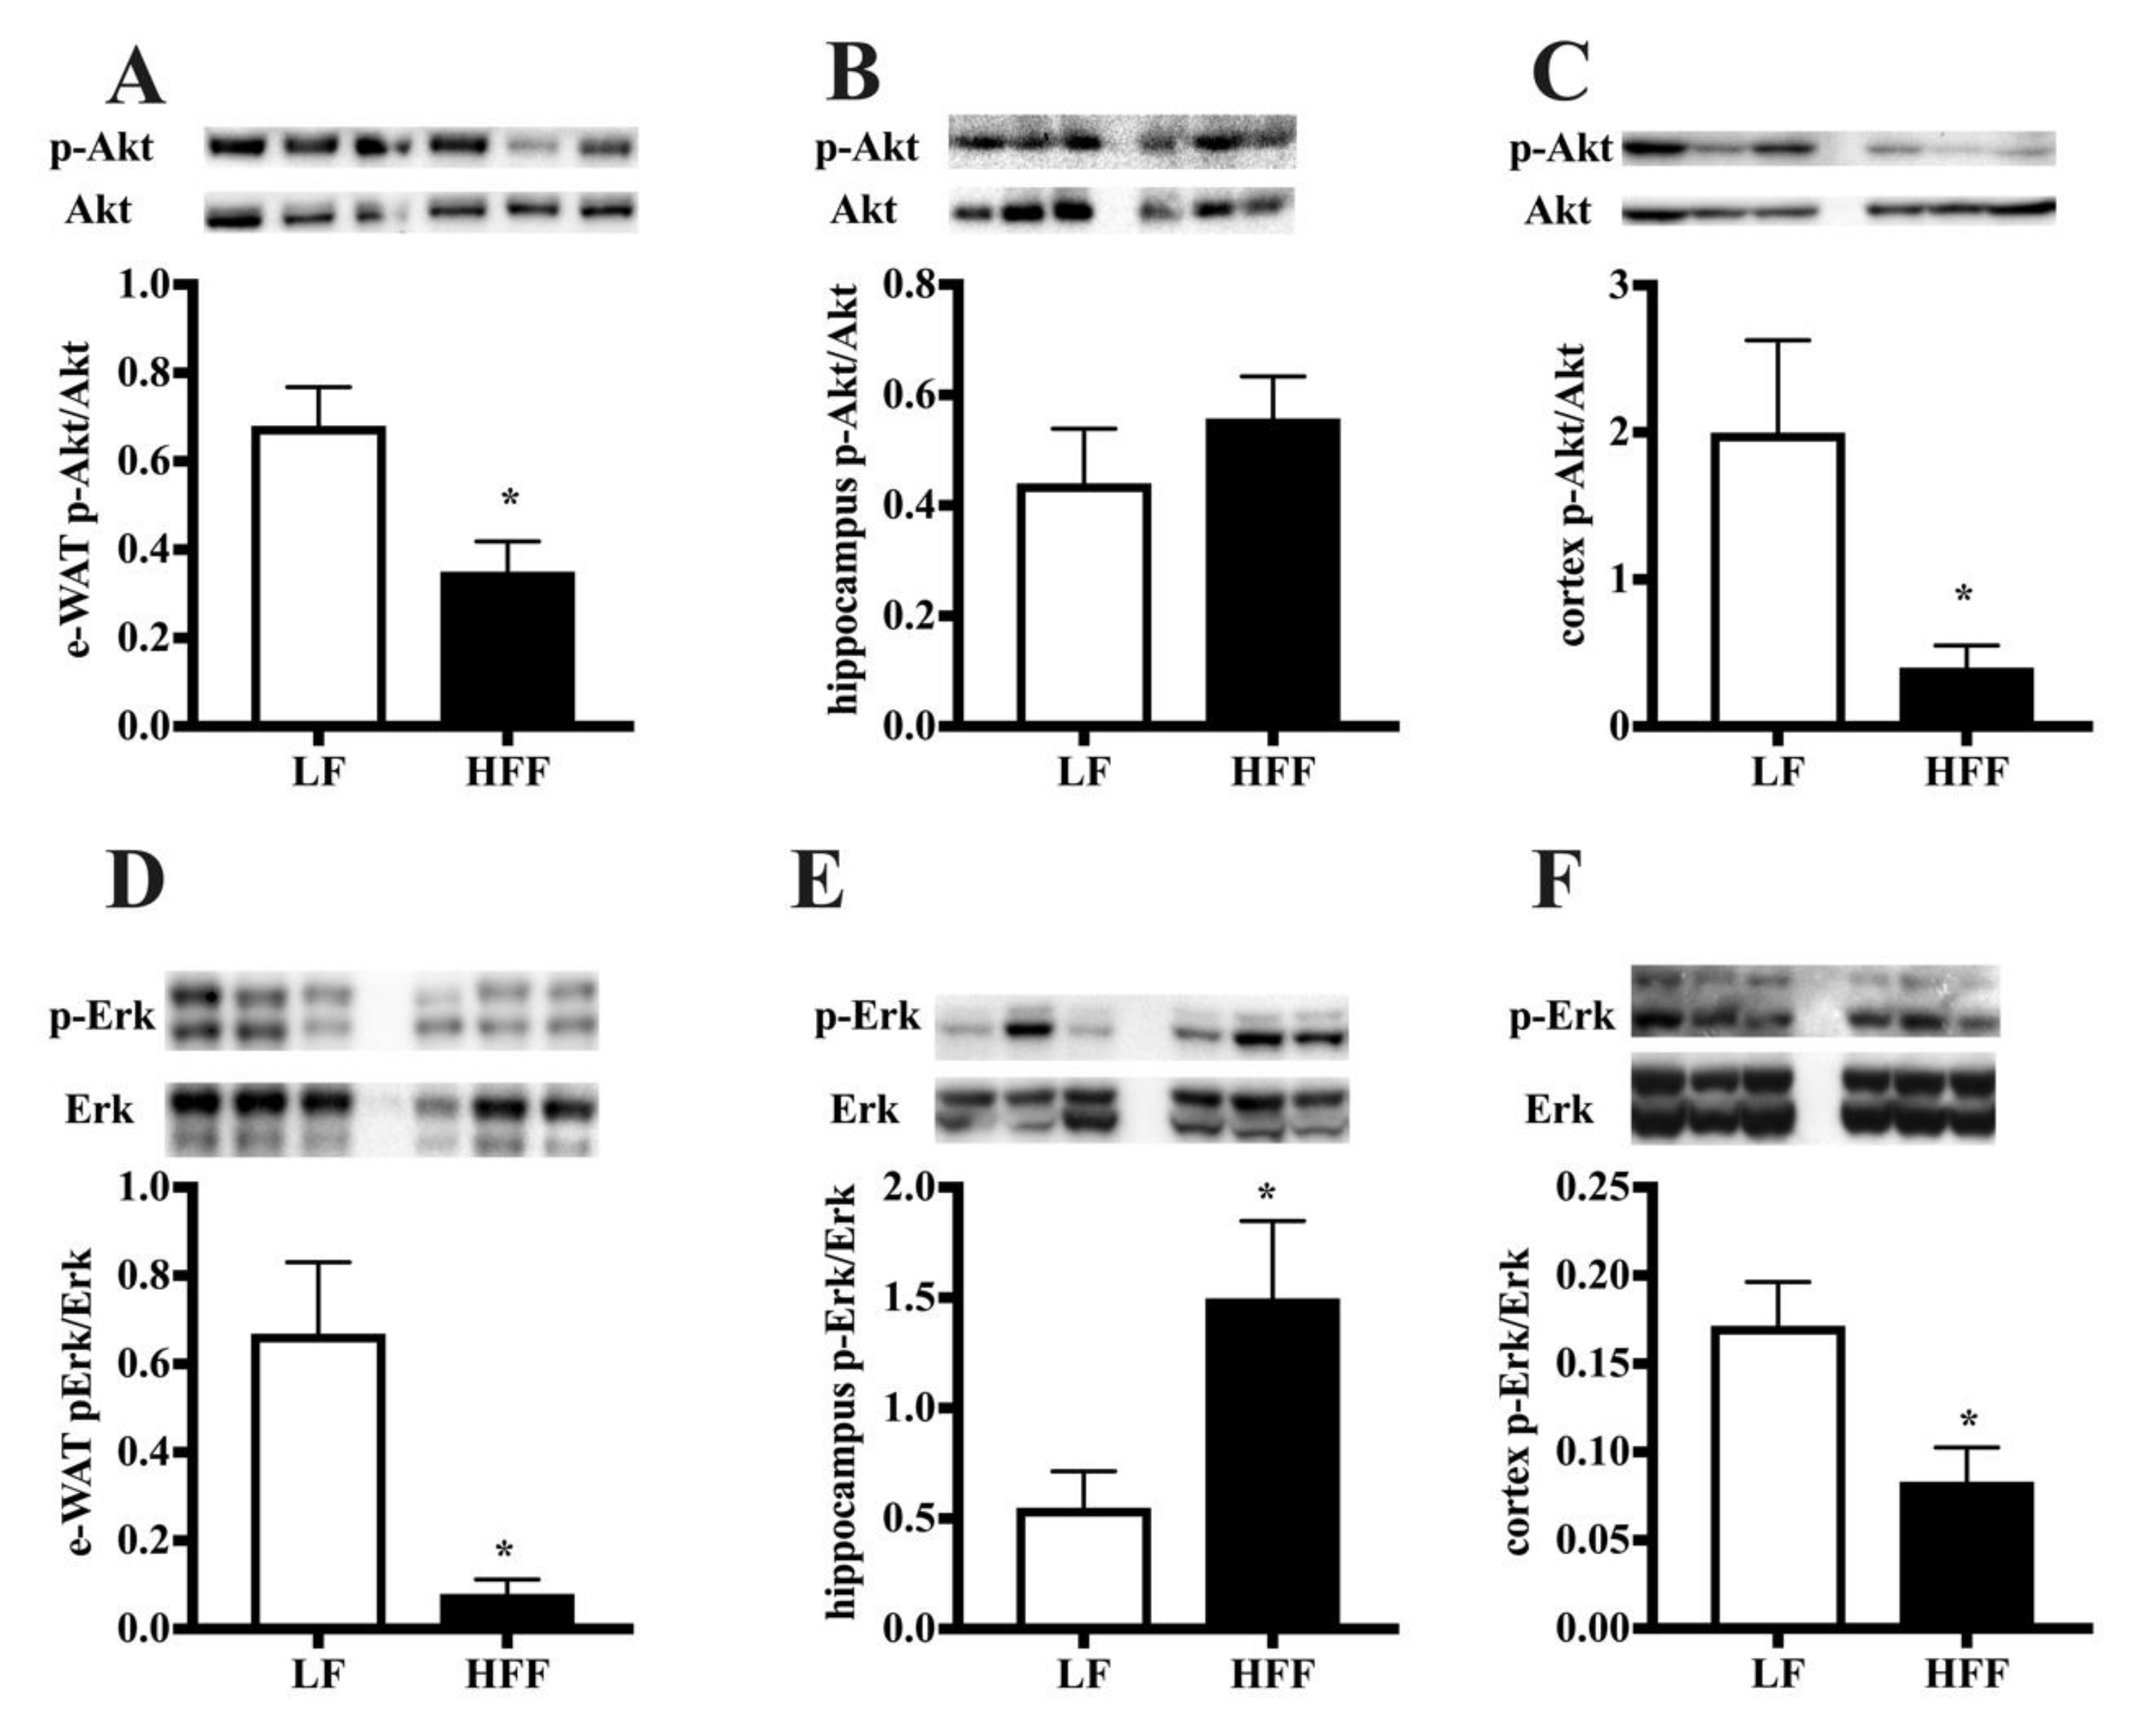
2.3. Insulin Signaling
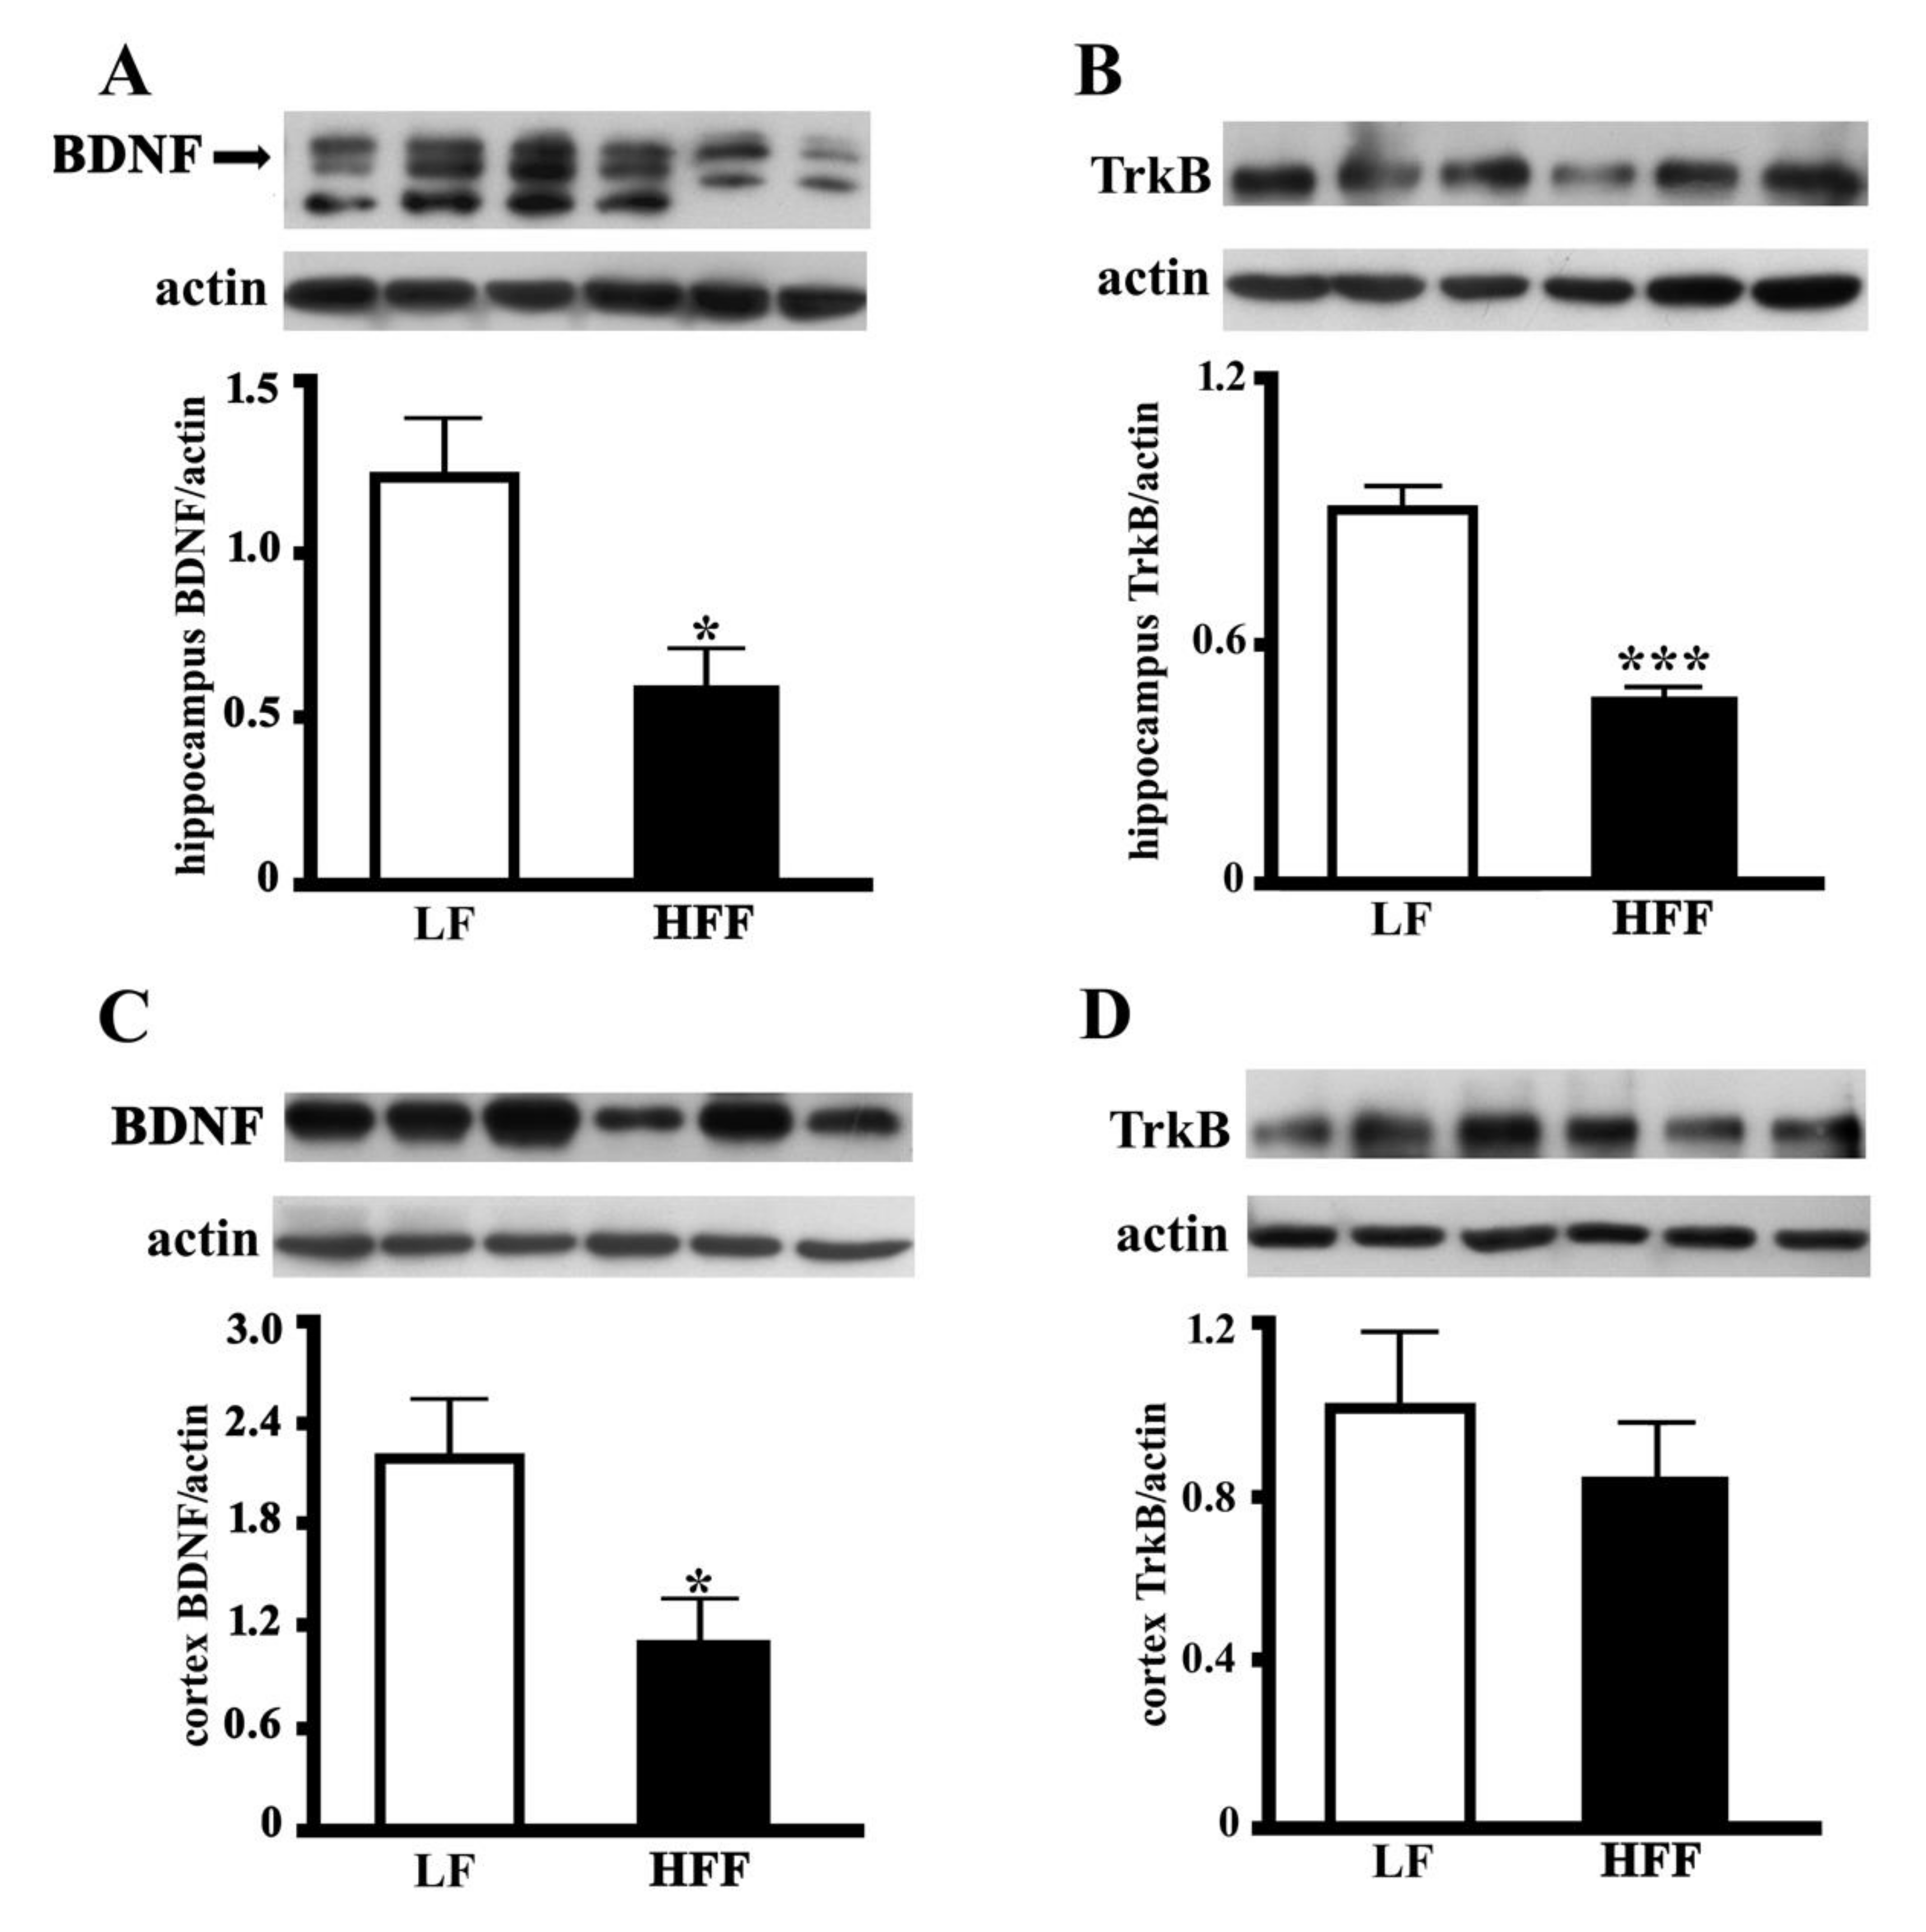
2.4. BDNF and TrkB
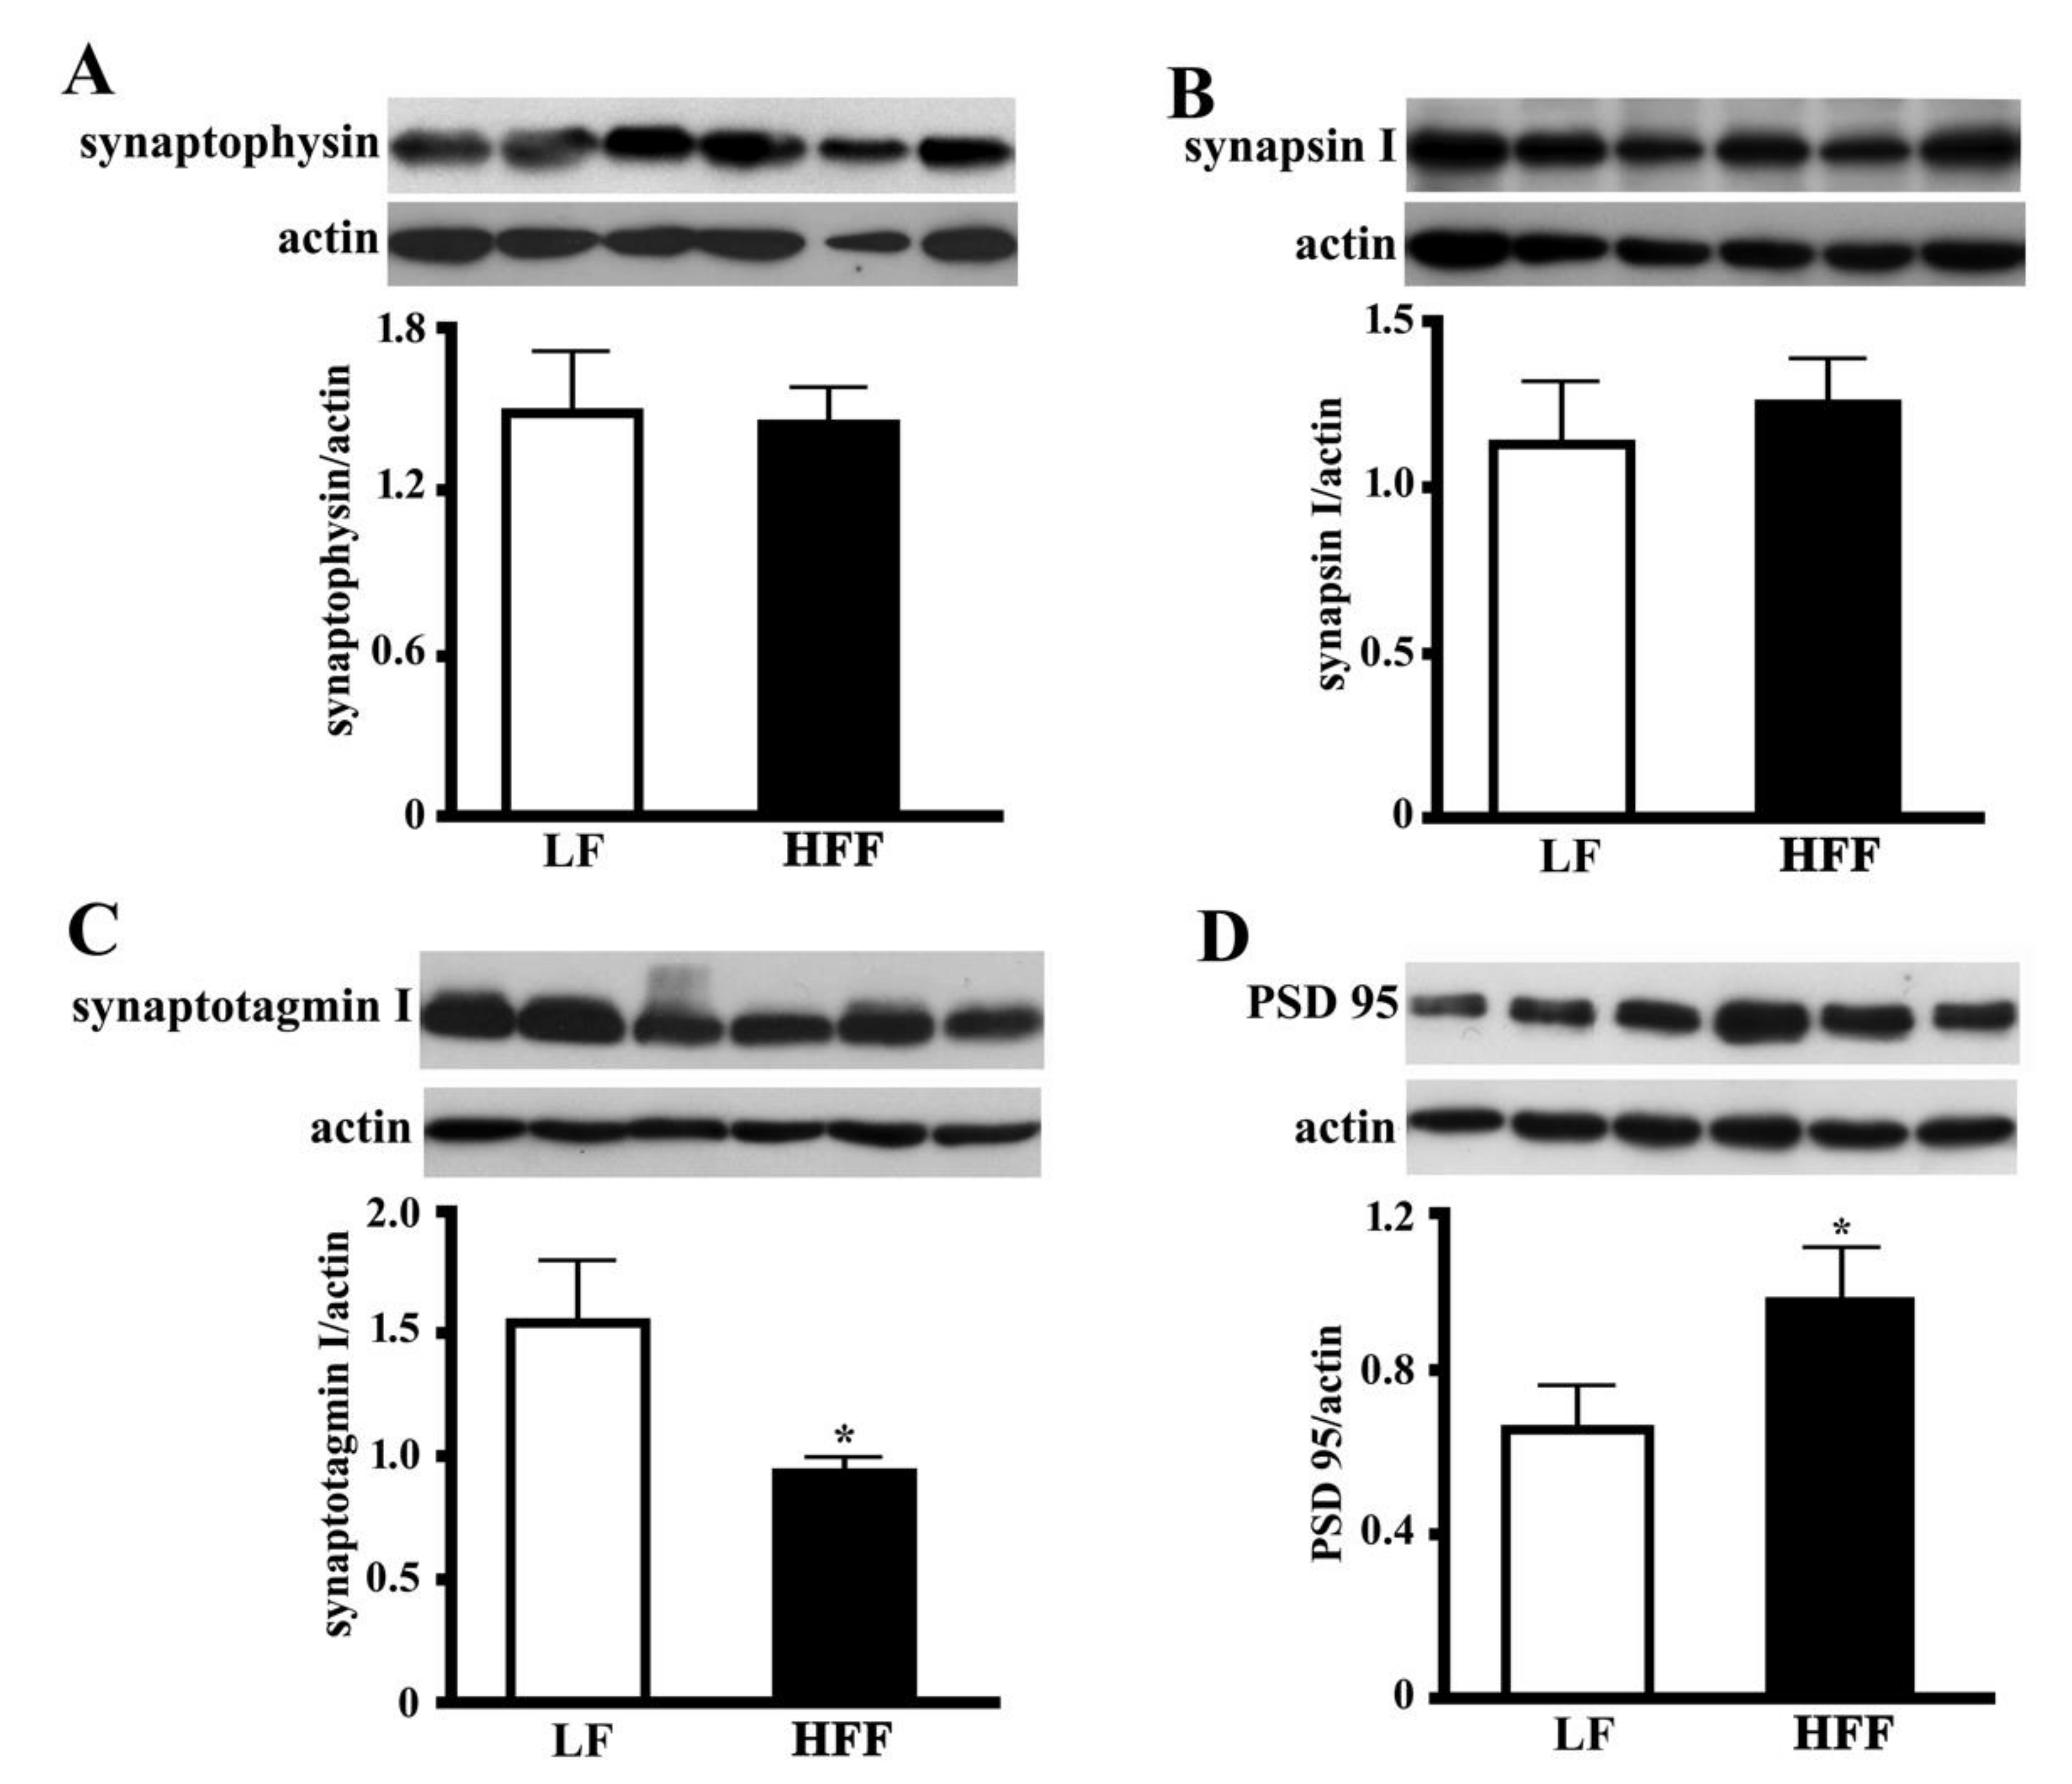
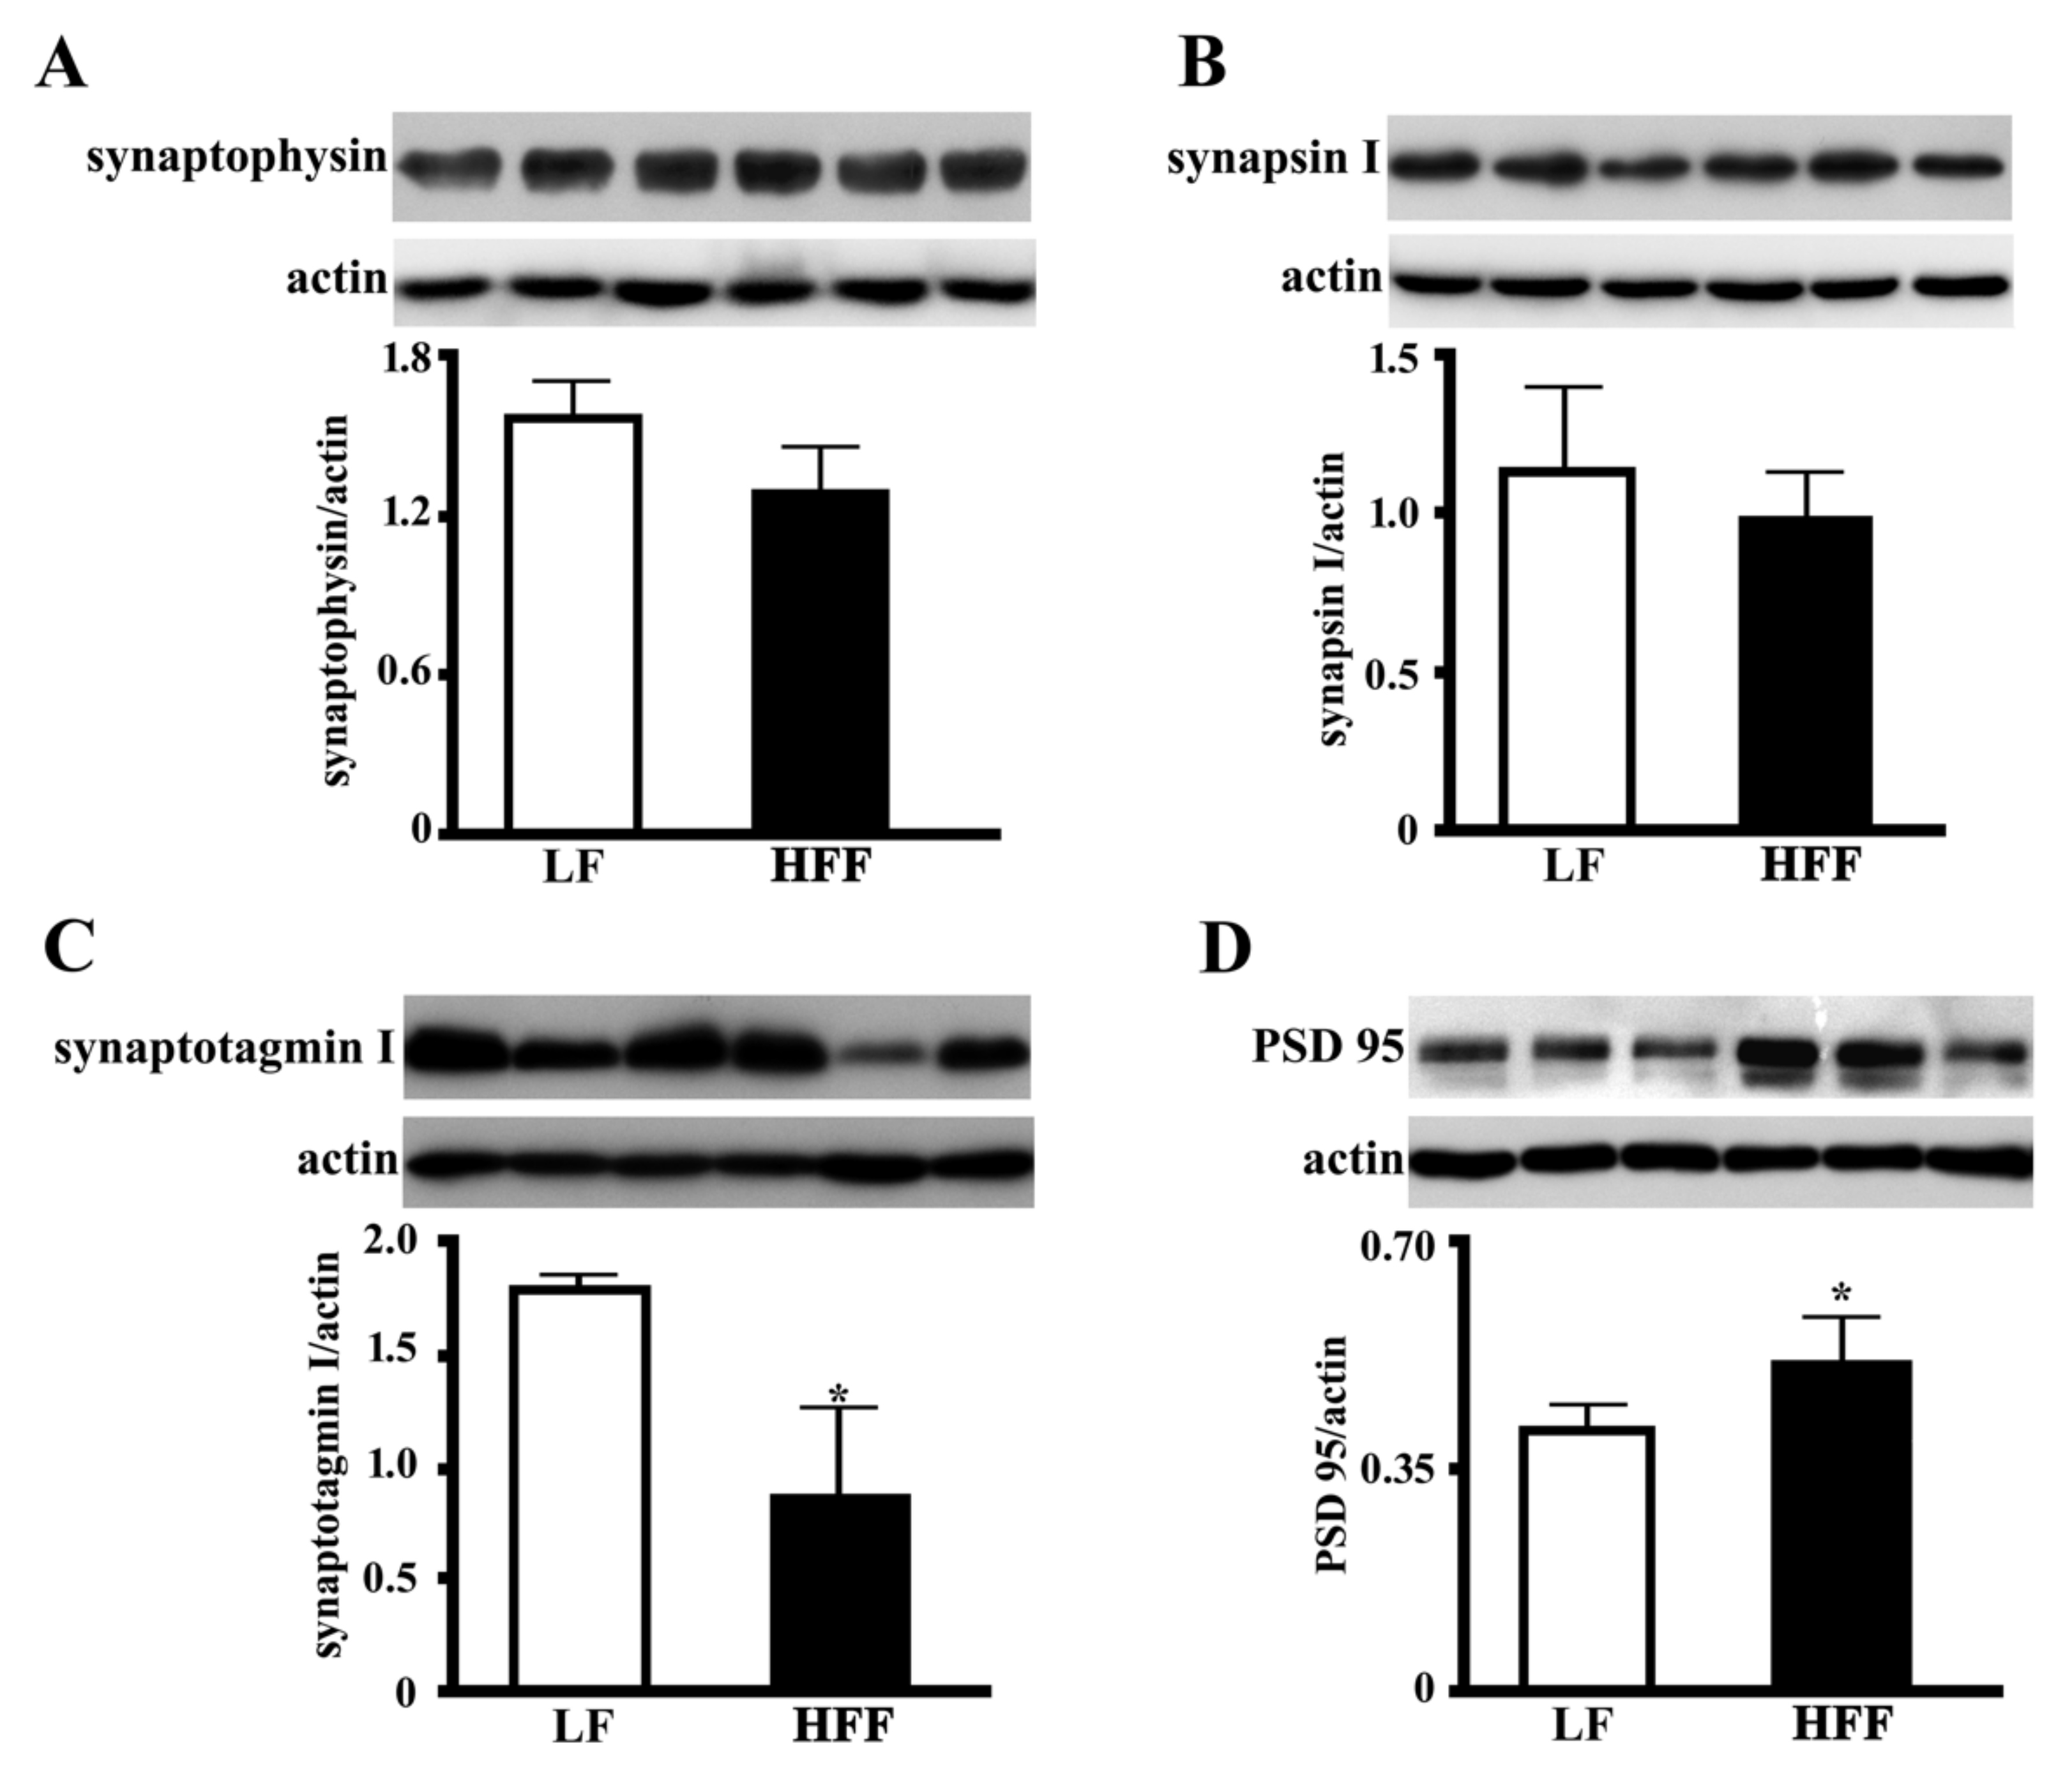
2.5. Synaptic Proteins in the Hippocampus and Frontal Cortex
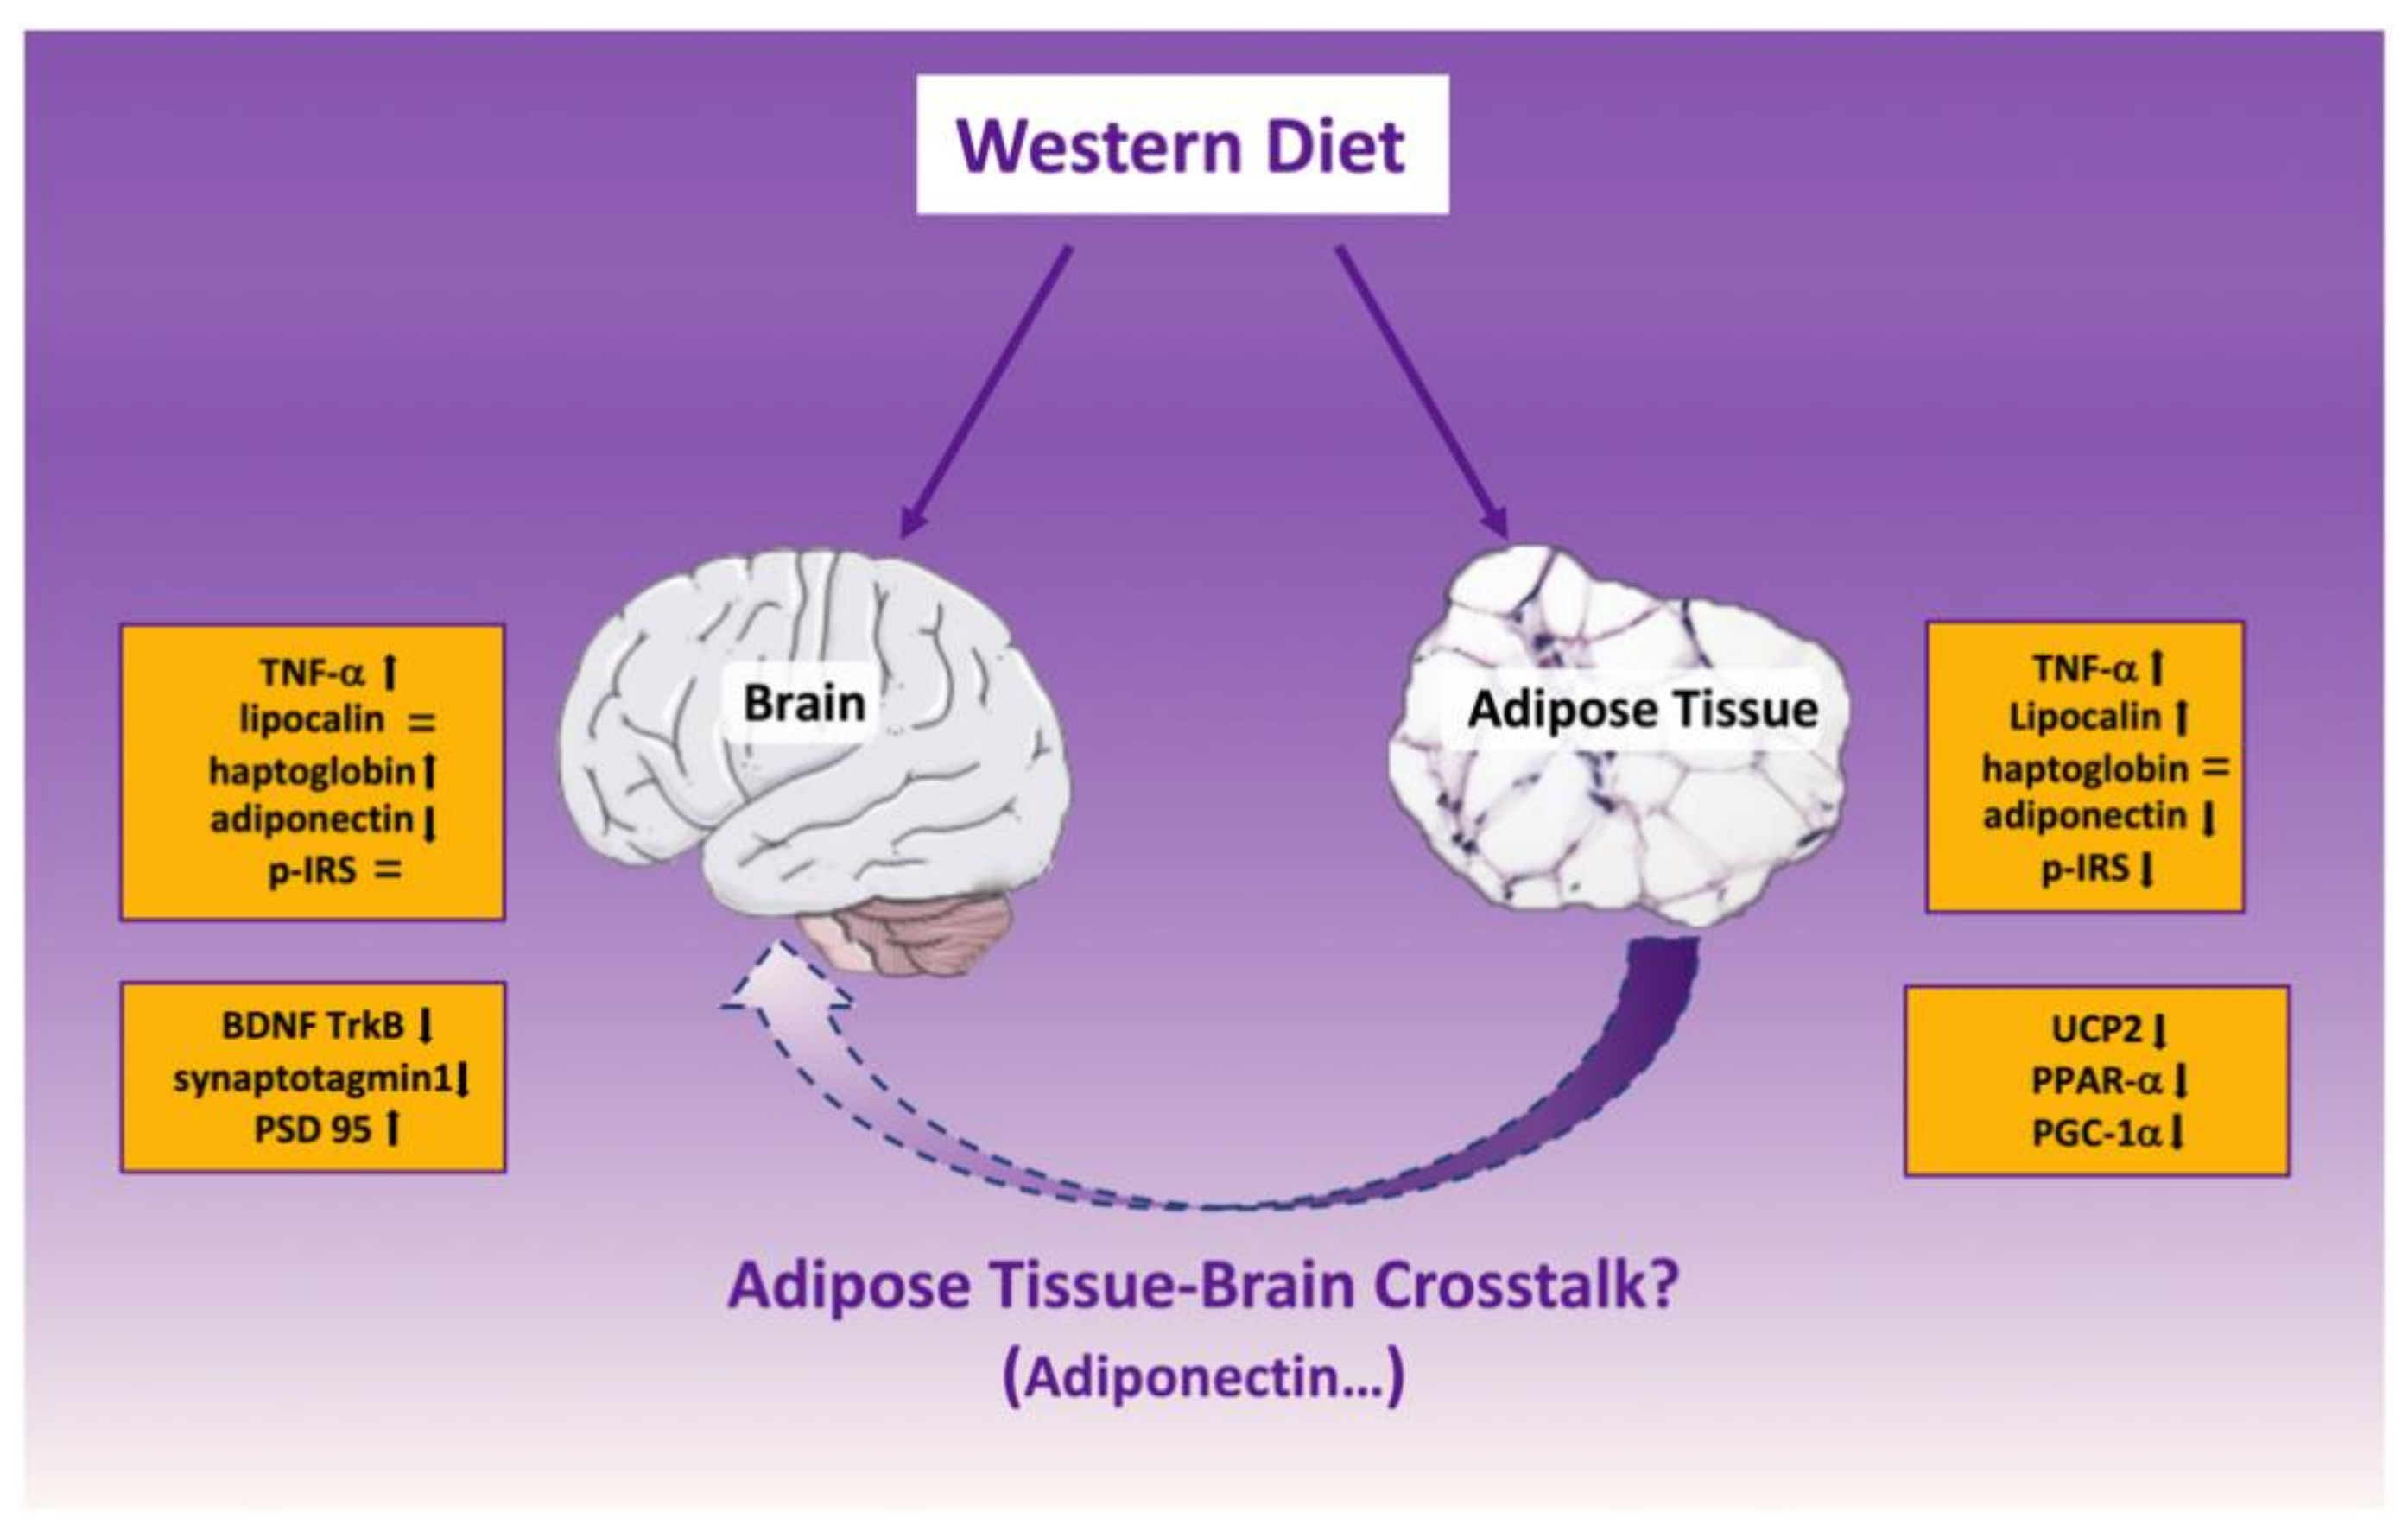
3. Discussion
4. Materials and Methods
4.1. Materials
4.2. Experimental Design
4.3. Metabolic Analyses
4.4. Markers of Inflammation in Plasma, e-WAT, Frontal Cortexok, and Hippocampus
4.5. Western Blotting
4.6. Statistical Analysis
5. Conclusions
Supplementary Materials
Author Contributions
Funding
Acknowledgments
Conflicts of Interest
References
- Hill, J.O.; Wyatt, H.R.; Peters, J.C. Energy balance and obesity. Circulation 2012, 126, 126–132. [Google Scholar] [CrossRef] [PubMed]
- Luppino, F.; de Wit, L.; Bouvy, P.F.; Et, A. Overweight, obesity, and depression: A systematic review and meta-analysis of longitudinal studies. Arch. Gen. Psychiatry 2010, 67, 220–229. [Google Scholar] [CrossRef] [PubMed]
- Gustafson, D.R. Adiposity and cognitive decline: Underlying mechanisms. J. Alzheimers Dis. 2012, 30, 203–217. [Google Scholar] [CrossRef] [PubMed]
- Arshad, N.; Lin, T.S.; Yahaya, M.F. Metabolic syndrome and its effect on the brain: Possible mechanism. CNS Neurol. Disord. Drug Targets 2018, 17, 595–603. [Google Scholar] [CrossRef]
- Cigliano, L.; Spagnuolo, M.S.; Crescenzo, R.; Cancelliere, R.; Iannotta, L.; Mazzoli, A.; Liverini, G.; Iossa, S. Short-term fructose feeding induces inflammation and oxidative stress in the hippocampus of young and adult rats. Mol. Neurobiol. 2018, 55, 2869–2883. [Google Scholar] [CrossRef]
- Crescenzo, R.; Spagnuolo, M.S.; Cancelliere, R.; Iannotta, L.; Mazzoli, A.; Gatto, C.; Iossa, S.; Cigliano, L. Effect of Initial Aging and High-Fat/High-Fructose Diet on Mitochondrial Bioenergetics and Oxidative Status in Rat Brain. Mol. Neurobiol. 2019, 56, 7651–7663. [Google Scholar] [CrossRef]
- Bomfim, T.R.; Forny-Germano, L.; Sathler, L.B.; Brito-Moreira, J.; Houzel, J.C.; Decker, H.; Silverman, M.A.; Kazi, H.; Melo, H.M.; McClean, P.L.; et al. An anti-diabetes agent protects the mouse brain from defective insulin signaling caused by Alzheimer’s disease–associated Ab oligomers. J. Clin. Invest. 2012, 122, 1339–1353. [Google Scholar] [CrossRef]
- Lourenco, M.V.; Clarke, J.R.; Frozza, R.L.; Bomfim, T.R.; Forny-Germano, L.; Batistam, A.F.; Sathler, L.B.; Brito-Moreira, J.; Amaral, O.B.; Silva, C.A.; et al. TNF-α mediates PKR-dependent memory impairment and brain IRS-1 inhibition induced by Alzheimer’s b-amyloid oligomers in mice and monkeys. Cell Metab. 2013, 18, 831–843. [Google Scholar] [CrossRef] [Green Version]
- De Felice, F.G.; Ferreira, S.T. Inflammation, defective insulin signaling, and mitochondrial dysfunction as common molecular denominators connecting type 2 diabetes to Alzheimer disease. Diabetes 2014, 63, 2262–2272. [Google Scholar] [CrossRef] [Green Version]
- Ogden, C.L.; Carroll, M.D.; Fryar, C.D.; Flegal, K.M. Prevalence of obesity among adults and youth: United States, 2011–2014. NCHS Data Briefs 2015, 219, 1–8. [Google Scholar]
- Kivipelto, M.; Ngandu, T.; Fratiglioni, L.; Viitanen, M.; Kåreholt, I.; Winblad, B.; Helkala, E.L.; Tuomilehto, J.; Soininen, H.; Nissinen, A. Obesity and vascular risk factors at midlife and the risk of dementia and Alzheimer disease. Arch. Neurol. 2005, 62, 1556–1560. [Google Scholar] [CrossRef] [PubMed] [Green Version]
- Whitmer, R.A.; Gunderson, E.P.; Barrett-Connor, E.; Quesenberry, C.P.; Yae, K. Obesity in middle age and future risk of dementia: A 27-year longitudinal population-based study. BMJ 2005, 330, 1360. [Google Scholar] [CrossRef] [PubMed] [Green Version]
- Mazzoli, A.; Crescenzo, R.; Cigliano, L.; Spagnuolo, M.S.; Cancelliere, R.; Gatto, C.; Iossa, S. Early hepatic oxidative stress and mitochondrial changes following western diet in middle aged rats. Nutrients 2019, 11, 2670. [Google Scholar] [CrossRef] [PubMed] [Green Version]
- Della Corte, K.W.; Perrar, I.; Penczynski, K.J.; Schwingshackl, L.; Herder, C.; Buyken, A.E. Effect of dietary sugar intake on biomarkers of subclinical inflammation: A systematic review and meta-analysis of intervention studies. Nutrients 2018, 10, 606. [Google Scholar] [CrossRef] [Green Version]
- Duan, Y.; Zeng, L.; Zheng, C.; Song, B.; Li, F.; Kong, X.; Xu, K. Inflammatory links between high fat diets and diseases. Front Immunol. 2018, 9, 2649. [Google Scholar] [CrossRef] [Green Version]
- Esmaili, S.; Xu, A.; George, J. The multifaceted and controversial immunometabolic actions of adiponectin. Trends Endocrinol. Metab. 2014, 25, 444–451. [Google Scholar] [CrossRef]
- Bloemer, J.; Pinky, P.D.; Govindarajulu, M.; Hong, H.; Judd, R.; Amin, R.H.; Moore, T.; Dhanasekaran, M.; Reed, M.N.; Suppiramaniam, V. Role of adiponectin in central nervous system disorders. Neural. Plast. 2018, 4593530. [Google Scholar] [CrossRef] [Green Version]
- Maffei, M.; Barone, I.; Scabia, G.; Santini, F. The multifaceted haptoglobin in the context of adipose tissue and metabolism. Endocr. Rev. 2016, 37, 403–416. [Google Scholar] [CrossRef] [Green Version]
- Zhang, J.; Wu, Y.; Zhang, Y.; LeRoith, D.; Bernlohr, D.A.; Chen, X. The role of lipocalin 2 in the regulation of inflammation in adipocytes and macrophages. Mol. Endocrinol. 2008, 22, 1416–1426. [Google Scholar] [CrossRef] [Green Version]
- Kowiański, P.; Lietzau, G.; Czuba, E.; Waśkow, M.; Steliga, A.; Moryś, J. BDNF: A key factor with multipotent impact on brain signaling and synaptic plasticity. Cell Mol. Neurobiol. 2018, 38, 579–593. [Google Scholar] [CrossRef]
- Cesca, F.; Baldelli, P.; Valtorta, F.; Benfenati, F. The synapsins: Key actors of synapse function and plasticity. Prog. Neurobiol. 2010, 91, 313–348. [Google Scholar] [CrossRef] [PubMed]
- Courtney, N.A.; Bao, H.; Briguglio, J.S.; Chapman, E.R. Synaptotagmin 1 clamps synaptic vesicle fusion in mammalian neurons independent of complexin. Nat. Commun. 2019, 10, 4076. [Google Scholar] [CrossRef] [PubMed] [Green Version]
- Chen, X.; Nelson, C.D.; Li, X.; Winters, C.A.; Azzam, R.; Sousa, A.A.; Leapman, R.D.; Gainer, H.; Sheng, M.; Reese, T.S. PSD-95 is required to sustain the molecular organization of the postsynaptic density. J. Neurosci. 2011, 31, 6329–6338. [Google Scholar] [CrossRef] [PubMed] [Green Version]
- Anstey, K.J.; Cherbuin, N.; Budge, M.; Young, J. Body mass index in midlife and late life as a risk factor for dementia: A meta-analysis of prospective studies. Obes. Rev. 2011, 12, e426–e437. [Google Scholar] [CrossRef]
- Jauch-Chara, K.; Oltmanns, K.M. Obesity a neuropsychological disease? Systematic review and neuropsychological model. Prog. Neurobiol. 2014, 114, 4–101. [Google Scholar] [CrossRef]
- Xu, W.L.; Atti, A.R.; Gatz, M.; Pedersen, N.L.; Johansson, B.; Fratiglioni, L. Midlife overweight and obesity increase late-life dementia risk: A population-based twin study. Neurology 2011, 76, 1568–1574. [Google Scholar] [CrossRef] [Green Version]
- Dandona, P.; Aljada, A.; Chaudhuri, A.; Mohanty, P.; Garg, R. Metabolic syndrome: A comprehensive perspective based on interactions between obesity, diabetes, and inflammation. Circulation 2005, 111, 1448–1454. [Google Scholar] [CrossRef] [Green Version]
- Bhat, N.R. Linking cardiometabolic disorders to sporadic Alzheimer’s disease: A perspective on potential mechanisms and mediators. J. Neurochem. 2010, 115, 551–562. [Google Scholar] [CrossRef]
- Parimisetty, A.; Dorsemans, A.C.; Awada, R.; Ravanan, P.; Diotel, N.; Lefebvre d’Hellencourt, C. Secret talk between adipose tissue and central nervous system via secreted factors—an emerging frontier in the neurodegenerative research. J. Neuroinflamm. 2016, 13, 67. [Google Scholar] [CrossRef] [Green Version]
- Huffman, D.M.; Barzilai, N. Role of visceral adipose tissue in aging. Biochim. Biophys. Acta Gen. Subj. 2009, 1790, 1117–1123. [Google Scholar] [CrossRef] [Green Version]
- Sutinen, E.M.; Pirttilä, T.; Anderson, G.; Salminen, A.; Ojala, J.O. Pro-inflammatory interleukin-18 increases Alzheimer’s disease associated amyloid-β production in human neuron-like cells. J. Neuroinflamm. 2012, 9, 1–14. [Google Scholar] [CrossRef] [PubMed] [Green Version]
- Chusyd, D.E.; Wang, D.; Huffman, D.M.; Nagy, T.R. Relationships between rodent white adipose fat pads and human white adipose fat depots. Front. Nutr. 2016, 3, 10. [Google Scholar] [CrossRef] [PubMed] [Green Version]
- Guo, H.; Bazuine, M.; Jin, D.; Huang, M.M.; Cushman, S.W.; Chen, X. Evidence for the regulatory role of lipocalin 2 in high-fat diet-induced adipose tissue remodeling in male mice. Endocrinology 2013, 54, 3525–3538. [Google Scholar] [CrossRef] [PubMed]
- Takahashi, H.; Sanada, K.; Nagai, H.; Li, Y.; Aoki, Y.; Ara, T.; Seno, S.; Matsuda, H.; Yu, R.; Kawada, T.; et al. Over-expression of PPARα in obese mice adipose tissue improves insulin sensitivity. Biochem. Biophys. Res. Commun. 2017, 493, 108–114. [Google Scholar] [CrossRef] [PubMed]
- Cheng, C.F.; Ku, H.C.; Lin, H. PGC-1α as a pivotal factor in lipid and metabolic regulation. Int. J. Mol. Sci. 2018, 19, 3447. [Google Scholar] [CrossRef] [Green Version]
- Chevillotte, E.; Giralt, M.; Miroux, B.; Ricquier, D.; Villarroya, F. Uncoupling protein-2 controls adiponectin gene expression in adipose tissue through the modulation of reactive oxygen species production. Diabetes 2007, 56, 1042–1050. [Google Scholar] [CrossRef] [Green Version]
- Shoelson, S.E.; Herrero, L.; Naaz, A. Obesity, Inflammation, and Insulin Resistance. Gastroenterol 2007, 132, 2169–2180. [Google Scholar] [CrossRef]
- Yan, Q.W.; Yang, Q.; Mody, N.; Graham, T.E.; Hsu, C.H.; Xu, Z.; Houstis, N.E.; Kahn, B.B.; Rosen, E.D. The Adipokine Lipocalin 2 Is Regulated by Obesity and Promotes Insulin Resistance. Diabetes 2007, 56, 2533–2540. [Google Scholar] [CrossRef] [Green Version]
- Salvatore, A.; Cigliano, L.; Bucci, E.M.; Corpillo, D.; Velasco, S.; Carlucci, A.; Pedone, C.; Abrescia, P. Haptoglobin binding to apolipoprotein A-I prevents damage from hydroxyl radicals on its stimulatory activity of the enzyme lecithin-cholesterol acyl-transferase. Biochemistry 2007, 46, 11158–11168. [Google Scholar] [CrossRef]
- Maresca, B.; Spagnuolo, M.S.; Cigliano, L. Haptoglobin modulates beta-amyloid uptake by U-87MG astrocytes cell line. J. Mol. Neurosci. 2015, 56, 35–47. [Google Scholar] [CrossRef] [Green Version]
- Zhang, J.Z.; Jing, L.; Guo, F.Y.; Ma, Y.; Wang, Y.L. Inhibitory effect of ketamine on phosphorylation of the extracellular signal-regulated kinase 1/2 following brain ischemia and reperfusion in rats with hyperglycemia. Exp. Toxicol. Pathol. 2007, 59, 227–235. [Google Scholar] [CrossRef] [PubMed]
- Frasca, G.; Carbonaro, V.; Merlo, S.; Copani, A.; Sortino, M.A. Integrins mediate beta-amyloid-induced cell-cycle activation and neuronal death. J. Neurosci. Res. 2008, 86, 350–355. [Google Scholar] [CrossRef] [PubMed]
- Goto, T.; Lee, J.Y.; Teraminami, A.; Kim, Y.I.; Hirai, S.; Uemura, T.; Inoue, H.; Takahashi, N.; Kawada, T.J. Activation of peroxisome proliferator-activated receptor-alpha stimulates both differentiation and fatty acid oxidation in adipocytes. Lipid Res. 2011, 52, 873–884. [Google Scholar] [CrossRef] [Green Version]
- Thundyil, J.; Pavlovski, D.; Sobey, C.G.; Arumugam, T.V. Adiponectin receptor signalling in the brain. Br. J. Pharm. 2012, 165, 313–327. [Google Scholar] [CrossRef] [PubMed] [Green Version]
- Wilkinson, M.; Brown, R.; Imran, S.A.; Ur, E. Adipokine gene expression in brain and pituitary gland. Neuroendocrinology 2007, 86, 191–209. [Google Scholar] [CrossRef] [PubMed]
- Zhang, D.; Wang, X.; Lu, X.Y. Adiponectin exerts neurotrophic effects on dendritic arborization, spinogenesis, and neurogenesis of the dentate gyrus of male mice. Endocrinology 2016, 157, 2853–2869. [Google Scholar] [CrossRef] [PubMed] [Green Version]
- Zhang, D.; Guo, M.; Zhang, W.; Lu, X.Y. Adiponectin stimulates proliferation of adult hippocampal neural stem/progenitor cells through activation of p38 mitogen-activated protein kinase (p38MAPK)/glycogen synthase kinase 3β (GSK-3β)/β-catenin signaling cascade. J. Biol. Chem. 2011, 286, 44913–44920. [Google Scholar] [CrossRef] [Green Version]
- Yau, S.Y.; Li, A.; Hoo, R.L.; Ching, Y.P.; Christie, B.R.; Lee, T.M.; Xu, A.; So, K.F. Physical exercise-induced hippocampal neurogenesis and antidepressant effects are mediated by the adipocyte hormone adiponectin. Proc. Natl. Acad Sci. USA 2014, 111, 15810–15815. [Google Scholar] [CrossRef] [Green Version]
- Letra, L.; Rodrigues, T.; Matafome, P.; Santana, I.; Seiça, R. Adiponectin and sporadic Alzheimer’s disease: Clinical and molecular links. Front Neuroendocr. 2017, 52, 1–11. [Google Scholar] [CrossRef]
- Chan, K.H.; Lam, K.S.; Cheng, O.Y.; Kwan, J.S.; Ho, P.W.; Cheng, K.K.; Chung, S.K.; Ho, J.W.; Guo, V.Y.; Xu, A. Adiponectin is protective against oxidative stress induced cytotoxicity in amyloid-beta neurotoxicity. PLoS ONE 2012, 7, e52354. [Google Scholar] [CrossRef] [Green Version]
- Scharfman, H.; Goodman, J.; Macleod, A.; Phani, S.; Antonelli, C.; Croll, S. Increased neurogenesis and the ectopic granule cells after intrahippocampal BDNF infusion in adult rats. Exp. Neurol. 2005, 192, 348–356. [Google Scholar] [CrossRef] [PubMed]
- Leal, G.; Afonso, P.M.; Salazara, I.L.; Duarte, C.B. Regulation of hippocampal synaptic plasticity by BDNF. Brain Res. 2015, 1621, 82–101. [Google Scholar] [CrossRef] [PubMed]
- Stranahan, A.M.; Norman, E.D.; Lee, K.; Cutler, R.G.; Telljohann, R.S.; Egan, J.M.; Mattson, M.P. Diet-induced insulin resistance impairs hippocampal synaptic plasticity and cognition in middle-aged rats. Hippocampus 2008, 18, 1085–1088. [Google Scholar] [CrossRef] [PubMed] [Green Version]
- Hussain, Y.; Jain, S.K.; Samaiya, P.K. Short-term westernized (HFFD) diet fed in adolescent rats: Effect on glucose homeostasis, hippocampal insulin signaling, apoptosis and related cognitive and recognition memory function. Behav. Brain Res. 2019, 361, 113–121. [Google Scholar] [CrossRef] [PubMed]
- Spagnuolo, M.S.; Bergamo, P.; Crescenzo, R.; Iannotta, L.; Treppiccione, L.; Iossa, S.; Cigliano, L. Brain Nrf2 pathway, autophagy, and synaptic function proteins are modulated by a short-term fructose feeding in young and adult rats. Nutr. Neurosci. 2018. [Google Scholar] [CrossRef] [PubMed]
- Cacho, J.; Sevillano, J.; de Castro, J.; Herrera, E.; Ramos, M.P. Validation of simple indexes to assess insulin sensitivity during pregnancy in Wistar and Sprague-Dawley rats. Am. J. Physiol. Endocrinol. Metab. 2008, 295, E1269–E1276. [Google Scholar] [CrossRef]
- Spagnuolo, M.S.; Mollica, M.P.; Maresca, B.; Cavaliere, G.; Cefaliello, C.; Trinchese, G.; Scudiero, R.; Crispino, M.; Cigliano, L. High Fat Diet and Inflammation—Modulation of Haptoglobin Level in Rat Brain. Front Cell. Neurosci. 2015, 9, 479. [Google Scholar] [CrossRef] [Green Version]
- Spagnuolo, M.S.; Maresca, B.; Mollica, M.P.; Cavaliere, G.; Cefaliello, C.; Trinchese, G.; Esposito, M.G.; Scudiero, R.; Crispino, M.; Abrescia, P.; et al. Haptoglobin increases with age in rat hippocampus and modulates Apolipoprotein E mediated cholesterol trafficking in neuroblastoma cell lines. Front. Cell. Neurosci. 2014, 8, 212. [Google Scholar] [CrossRef] [Green Version]


| Low Fat | High Fat-High Fructose | |
|---|---|---|
| Component, g/1000 g | ||
| Standard chow a | 395.3 | 231.5 |
| Sunflower oil | 19.3 | 19.3 |
| Casein | 59.7 | 133.3 |
| Water | 175.7 | 175.4 |
| AIN-93 Mineral mix | 11.4 | 11.4 |
| AIN-93 Vitamin mix | 3.2 | 3.2 |
| Choline | 0.7 | 0.7 |
| Methionine | 0.9 | 0.9 |
| Cornstarch | 333.8 | ------- |
| Butter | ------- | 129.8 |
| Fructose | ------- | 294.6 |
| Energy content and composition | ||
| ME content, kJ/g b | 11.2 | 14.9 |
| Lipids, J/100 J | 10.5 | 39.3 |
| Proteins, J/100 J | 19.9 | 19.8 |
| Complex carbohydrates, J/100 J | 63.9 | 7.5 |
| Simple sugars, J/100 J | 5.7 | 33.4 |
© 2020 by the authors. Licensee MDPI, Basel, Switzerland. This article is an open access article distributed under the terms and conditions of the Creative Commons Attribution (CC BY) license (http://creativecommons.org/licenses/by/4.0/).
Share and Cite
Mazzoli, A.; Spagnuolo, M.S.; Gatto, C.; Nazzaro, M.; Cancelliere, R.; Crescenzo, R.; Iossa, S.; Cigliano, L. Adipose Tissue and Brain Metabolic Responses to Western Diet—Is There a Similarity between the Two? Int. J. Mol. Sci. 2020, 21, 786. https://0-doi-org.brum.beds.ac.uk/10.3390/ijms21030786
Mazzoli A, Spagnuolo MS, Gatto C, Nazzaro M, Cancelliere R, Crescenzo R, Iossa S, Cigliano L. Adipose Tissue and Brain Metabolic Responses to Western Diet—Is There a Similarity between the Two? International Journal of Molecular Sciences. 2020; 21(3):786. https://0-doi-org.brum.beds.ac.uk/10.3390/ijms21030786
Chicago/Turabian StyleMazzoli, Arianna, Maria Stefania Spagnuolo, Cristina Gatto, Martina Nazzaro, Rosa Cancelliere, Raffaella Crescenzo, Susanna Iossa, and Luisa Cigliano. 2020. "Adipose Tissue and Brain Metabolic Responses to Western Diet—Is There a Similarity between the Two?" International Journal of Molecular Sciences 21, no. 3: 786. https://0-doi-org.brum.beds.ac.uk/10.3390/ijms21030786