Dynamic Behavior of p53 Driven by Delay and a Microrna-34a-Mediated Feedback Loop


1
Department of Mathematics, Yunnan Normal University, Kunming 650092, China
2
Department of Dynamics and Control, Beihang University, Beijing 100191, China
*
Author to whom correspondence should be addressed.
Int. J. Mol. Sci. 2020, 21(4), 1271; https://0-doi-org.brum.beds.ac.uk/10.3390/ijms21041271
Submission received: 31 December 2019
/
Revised: 30 January 2020
/
Accepted: 9 February 2020
/
Published: 13 February 2020
(This article belongs to the Special Issue Protein Structural Dynamics 2019)
Abstract
:The tumor suppressor protein p53 is a critical hub in the comprehensive transcriptional network that inhibits the growth of cells after acute stress stimulation. In this paper, an integrated model of the p53 signaling pathway in response to DNA damage is proposed and the p53 stability and oscillatory dynamics are analyzed. Through theoretical analysis and numerical simulation, we find that the delay as a bifurcation parameter can drive the p53-Mdm2 module to undergo a supercritical Hopf bifurcation, thereby producing oscillation behavior. Moreover, we demonstrate how the positive feedback loop formed by p53* and microRNA-34a (miR-34a) with the feature of double-negative regulation produces limit-cycle oscillations. Further, we find that miR-34a can affect the critical value of Hopf bifurcation in delay-induced p53 networks. In addition, we show that ATM, once activated by DNA damage, makes p53* undergo two Hopf bifurcations. These results revealed that both time delay and miR-34a can have tumor suppressing roles by promoting p53 oscillation or high level expression, which will provide a perspective for promoting the development of anti-cancer drugs by targeting miR-34a and time delay.
1. Introduction
The importance of p53 in preventing tumor formation is indicated by mutations of the p53 gene found in more than half of human cancers [1,2]. Tumor suppressor p53 is located at a junction of the cellular signaling network and can be activated by DNA damage, cellular stress and improper mitogenic stimulation [3,4]. P53 integrates these signals and mainly acts as a transcription factor to regulate the expression of downstream target genes, and thereby induces different cellular outcomes such as cell cycle arrest and apoptosis [5,6]. The former promotes cell repair and survival, while the latter provides an effective way to remove irreparable damaged cells and avoid transmitting damage to the next generation of cells. Previously, it was proposed that p53 protein dynamics were of vital importance to cellular fate decisions in response to DNA damage, which also emphasizes the crucial role of p53 oscillation in cancer cell decision making [7].
Negative feedback has the potential to generate limit-cycle oscillations and is considered as a necessary structure for biochemical oscillators [8]. Indeed, Mdm2 protein is p53-inducible and functions as a negative regulator of p53, thereby confirming a negative feedback which is fundamental for p53 oscillations [9]. However, in this process wherein p53 acts as a transcription factor to induce Mdm2 gene expression, there are inevitable time delays which often result in complex dynamical behavior [10,11,12,13]. For example, Monk [10] pointed out that time delays drive p53 oscillation in a simple negative feedback system. After that, Ma, et al. [11] proposed that the negative feedback loop formed by p53 and Mdm2 with a long time delay could produce coordinated oscillatory dynamics upon IR stimulation in single cells. Therefore, the effect of delay on p53 oscillation cannot be neglected.
MicroRNAs (miRNAs) are a class of noncoding RNAs of approximately 18–25 nucleotides in length that are involved in post-transcriptional regulation of gene expression [14]. It has been reported that aberrant expression of miRNAs and a global decrease of their levels are often observed in multiple human cancer types [15,16]. For example, a class of microRNAs, microRNA-34a (miR-34a), has been found in experiments to have a low expression level in unfavorable primary neuroblastoma (NB) tumors and cell lines, and the cell proliferation is significantly reduced when the microRNA is re-introduced into NB cell lines. It suggested that miR-34a functions as a potential tumor suppressor by inducing apoptosis in NB cells [17]. Intriguingly, a set of studies revealed that miR-34a forms a positive feedback loop with p53 [18,19,20,21]. Tt has been reported that robust oscillations can be accomplished through a combination of negative and positive feedback loops rather than a single negative feedback loop [22,23]. Therefore, the positive feedback loop mediated by miR-34a should integrated in to the p53 network.
Based on the above biological fact, in this paper, a mathematical model of with seven major components and a critical time delay is proposed to investigate how cell cycle progression and cell fate decisions are well coordinated by transcription factors p53 and miR-34a in response to DNA damage. On the one hand, based on the stability theory of delayed differential equation, the stability and oscillation of the proposed model with and without time delay were investigated. They revealed that the time delay required for the synthesis process of Mdm2 gene expression is vitally important for sustained p53 oscillations. On the other hand, according to the bifurcation theory, the effect of positive feedback loops formed by miR-34a and p53 was explored. That showed that the positive feedback loop mediated by miR-34a can control stress-induced p53 oscillation. These findings are well consistent with the existing biological phenomena [11,13,24,25]. Moreover, we also predicted that the p53 oscillatory behavior is more sensitive than that without miR-34a and the critical value of Hopf bifurcation of p53 networks miR-34a can be affected by miR-34a. These results may provide clues for developing drugs to target miR-34a and p53 for cancer treatment.
2. Mathematical Model
According to the biochemical reactions among p53, p53 * protein, Mdm2 protein, miR-34a, sirt1-miR-34a, sirt1 mRNA and SIRT1 protein, the mathematical model can be directly construed from Figure 1 as follows:
Here, xi(t) (I = 1,2,3,4,5,6,7) represent the concentrations at time t of inactive p53 protein, p53* protein, Mdm2 protein, miR-34a, sirt1-miR-34a, sirt1 mRNA and SIRT1 protein respectively. It is noteworthy that our model contains two feedback loops connected by the central node p53*, which is shown in the Figure 2. One is a negative feedback loop formed by p53* and Mdm2 with time delay, based on previously published work [11]; namely, the p53*-Mdm2 loop. This circuit alone can produce stable oscillations of p53 and Mdm2 in response to sufficiently strong ATM activation [11]. Specifically, as a sensitive and reliable detector of DNA damage [26,27], ATM* induces reaction of p53 from the inactive state to the active state (p53*) by post-translational modifications, such as phosphorylation, methylation and acetylation, on multiple different sites [28]. In particular, C-terminal acetylation of p53 on lysine 382 is indispensable to p53 activation and stability, which is shown in blue in Figure 1. As a transcription factor, p53* was able to promote the Mdm2 gene to synthesize the Mdm2 protein [29]. At the same time, phosphorylation of p53 on serine 15 negates MDM2, which is shown in red in Figure 1 and Figure 2 [29]. This process required certain time delays involving transcription, translation and transportation of Mdm2 molecules, denoted τ [12]. Normally, typical transcript elongation and processing rates would result in a time delay of around 15-20 min [30,31]. Similarly, synthesis of a typical protein from mRNA takes around 1-3 min and results in a translational delay [31]. Nuclear mRNA export has been estimated at 4 min [31]. Therefore, we estimate that the total delay time fluctuation ranges from 20 to 30 minutes. Subsequently, Mdm2 promotes the degradation of p53 and p53* protein [32].
The other is a positive feedback loop formed by p53* and miR-34a; namely, the p53*-miR-34a loop. Specifically, p53 acts as a transcription factor to increase expression of a set of miRNAs that includes miR-34a [33,34,35,36]. Subsequently, miR-34a regulates silencing of information regulator 1 (SIRT1) expression by inhibiting sirt1 mRNA translation [18,37]. In irradiated cells, SIRT1 proteins act as post-translational modification antagonists of p53, thereby inhibiting the transcriptional activity of p53 protein [38,39]. Therefore, the p53*-mir-34a loop is characterized by double negative regulation.
3. Results
Table 1 gives a complete list of model parameters and default values, and all the rate constants are used in all calculations, except where parameters are varied, or where noted otherwise. The numerical simulations were performed by Mathematica 10 and XPPAUT.
3.1. The Effect of Mir-34a on p53 Oscillations without Time Delay
To further understand the effect of miR-34a in p53-Mdm2 networks, we performed bifurcation analysis as shown in Figure 3. The green dots represent the bounds of p53* oscillation amplitude at oscillation state (black line), and the red line represents stationary steady state.
Under normal circumstances, ATM is in an inactive state. When stimulated by DNA damage, ATM behaves as a Double Strand Breaks (DSB) sensor, which is activated by phosphorylation, and the phosphorylated ATM is denoted by ATM* [43]. Biological experiments have shown that ATM* can induce oscillatory expression of p53 [44]. We now study how ATM* levels affect p53 expression levels. For this purpose, we plotted the bifurcation diagram of the p53* concentration versus ATM* concentration, as shown in Figure 3A. At the low level of expression of the ATM*, p53* remains predominantly in the inactive forms, and the corresponding steady state is stable. As the ATM* increases, p53* exhibits a sustained oscillation, and then goes again to the stable, high-level state. As expected, these results indicate that the ATM* level can lead to two Hopf bifurcation points at HB1=0.4661 and HB2=0.5245, respectively, and only a certain ATM* level can drive p53 oscillations, which is in good agreement with the results reported in the existing studies [12].
Subsequently, we analyze the effect of miR-34a-mediated positive feedback loop, which can be reflected by the role of parameters related to miR-34a on the p53 oscillation. In particular, we probed the effects of three parameters (kon2, ksmi1 and ksmi2) on p53* oscillation without time delay (i.e., τ = 0). The larger these three parameters are, the stronger the strength of positive feedback mediated by miR-34a are.
First, we obtained the bifurcation diagrams of the p53* concentration versus the association rate between miR-34a and sirt1 mRNA (kon2), as shown in Figure 3B. It is shown that p53* is so sensitive to the association rate kon2 of the miR-34a and sirt1 mRNA, and the parameter value kon2 = 3.328 is sufficient to induce p53* to be oscillatory. Moreover, the amplitudes of these oscillations increase with increasing kon2.
Second, the bifurcation diagrams of the p53* concentration versus the basal induction rate of miR-34a (ksmi1) is shown in Figure 3C. For ksmi1 < 0.001149, p53* level remains in a low steady state owing to weak promotion of miR-34a, and slowly rises with increasing ksmi1. Moreover, there exist two Hopf bifurcation points at HB1 and HB2, respectively. As ksmi1 increases gradually, a Hopf bifurcation labeled as HB1 appears at ksmi1 = 0.001149, beyond which p53* concentration undergoes periodical oscillations. When ksmi1 is increased to the other Hopf bifurcation labeled as HB2 at ksmi1 = 0.002238, oscillations vanish. Importantly, one can see that the amplitudes of these oscillations from HB1 to HB2 rise first and then decrease with increasing ksmi1. Furthermore, when ksmi1 > 0.002238, p53* remains at high levels. These results indicate that the threshold level of the input basal induction rate of miR-34a is a sufficient condition for generating p53* oscillations.
Third, we calculated the bifurcation diagrams of the p53* concentration versus the p53*-induced transcription rate of miR-34a (ksmi2), as shown in Figure 3D. As the p53*-induced transcription rate of miR-34a goes from low values to higher values, the p53* level goes from a stable state into a series of sustained oscillations and then again to stable state. In other words, when ksmi2 gradually increases from 0, there are two Hopf bifurcation points labeled HB1 and HB2 in turn. The first Hopf bifurcation point HB1 appears at the parameter ksmi2 = 0.006813. When ksmi2 continues to increase, the concentration of p53* will oscillate periodically. When ksmi2 is increased to the other Hopf bifurcation labeled as HB2 at ksmi2 = 0.02985, oscillations vanish. Therefore, a certain range of the p53*-induced transcription rate of miR-34a is required to generate the p53* oscillations.
In summary, as the intensity of inhibition of sirt1 by miR-34a and the production of miR-34a are increased, p53 will jump from a low steady state to a continuous oscillation state and even to a high steady state. This means that miR-34a has a role in promoting cell cycle arrest and apoptosis, and thus inhibits cancer development.
Additionally, we also plot the diagram of the kon2 versus ATM* concentration to further address the role of miR-34 on p53 oscillation, as shown in Figure 4. The blue line in the figure indicates the Hopf bifurcation point. Only when parameters kon2 and ATM* concentration are controlled in an appropriate range can p53* oscillate. Indeed, when the parameter kon2 is restricted to a specific value, with the increase of ATM* concentration, p53* enters the oscillating state from the monostable state, and then returns to the monostable state, which is consistent with Figure 3A. Similarly, when ATM* concentration is restricted to a specific medium value, p53* enters a sustained oscillation state from a monostable state with kon2 increases, which is consistent with Figure 3B. However, when the DNA damage is too small, that is, the ATM is small, even if the inhibition of sirt1 by miR-34a is enhanced, p53 does not oscillate. This is because the DNA damage is too small and does not require p53 oscillation to repair the damage. At the same time, when the DNA damage is too large, that is, the ATM is large, even if the inhibition of sirt1 by miR-34a is enhanced, p53 does not oscillate, but is at a high steady state. This indicates that the cells do not need to repair the damage by oscillation, but directly undergo apoptosis.
3.2. The Effect of Time Delay on the p53-mdm2 Network without MiR-34a
p53 regulates the gene expression of Mdm2, which inevitably involves the transcription and translation time delay τ. In this section, we focus on the effect of time delay on p53 oscillation by numerical simulation. To this end, we do not consider the role of miR-34a on p53; i.e., parameters ksmi2 = 0 and kon2 = 0. Figure 5 displays the time histories of the levels of p53* and Mdm2. Obviously, if there are no time delays in the system, the positive equilibrium is asymptotically stable, which can be seen in Figure 5A. Otherwise, if there exist time delays in the system, the effects of time delay on the p53-Mdm2 network are shown in Figure 5B–D. In particularly, when τ = 3 min, the system’s positive equilibrium point is asymptotically stable, and when τ = 6 min, the system’s positive equilibrium point is no longer stable but is in periodic oscillation. This shows that as the time delay gradually increases and exceeds the critical value, the positive equilibrium point loses its stability and becomes an oscillating state, which means that the system has experienced a Hopf bifurcation. The critical value of time delay for the Hopf bifurcation is calculated to be τ0 = 5.10388. Therefore, we find that the delay as a bifurcation parameter makes the p53-Mdm2 oscillator undergo a supercritical Hopf bifurcation without considering the miR-34a, which is consistent with the conclusions of some researchers [10,11].
3.3. Co-Regulation of the p53 Oscillatios by Time Delay and Mir-34a
In this part, we study how time delay and miR-34a co-regulate the p53 oscillations. As shown in Figure 6, we find that p53* still exhibits dynamic behavior similar to Figure 5 by introducing p53*-miR-34a into positive feedback loop. But the key difference is that the critical value of Hopf bifurcation appears earlier; i.e., τ0’=3.55785 < τ0 = 5.10388. This indicates that the p53* oscillatory behavior is more sensitive in the p53 network with the positive feedback loop induced by miR-34a, which suggests that miR-34a accelerates the response of p53 to DNA damage. Moreover, compared with a negative feedback loop with time delay, -sustained and robust P53 oscillation is achieved more easily by a coupled loop constructed by positive and negative feedback loops. In addition, it suggested that the positive feedback loop mediated by miR34-a can effectively accelerate the response of p53 to DNA damage so that it inhibits the occurrence of diseases caused by DNA damage. [45].
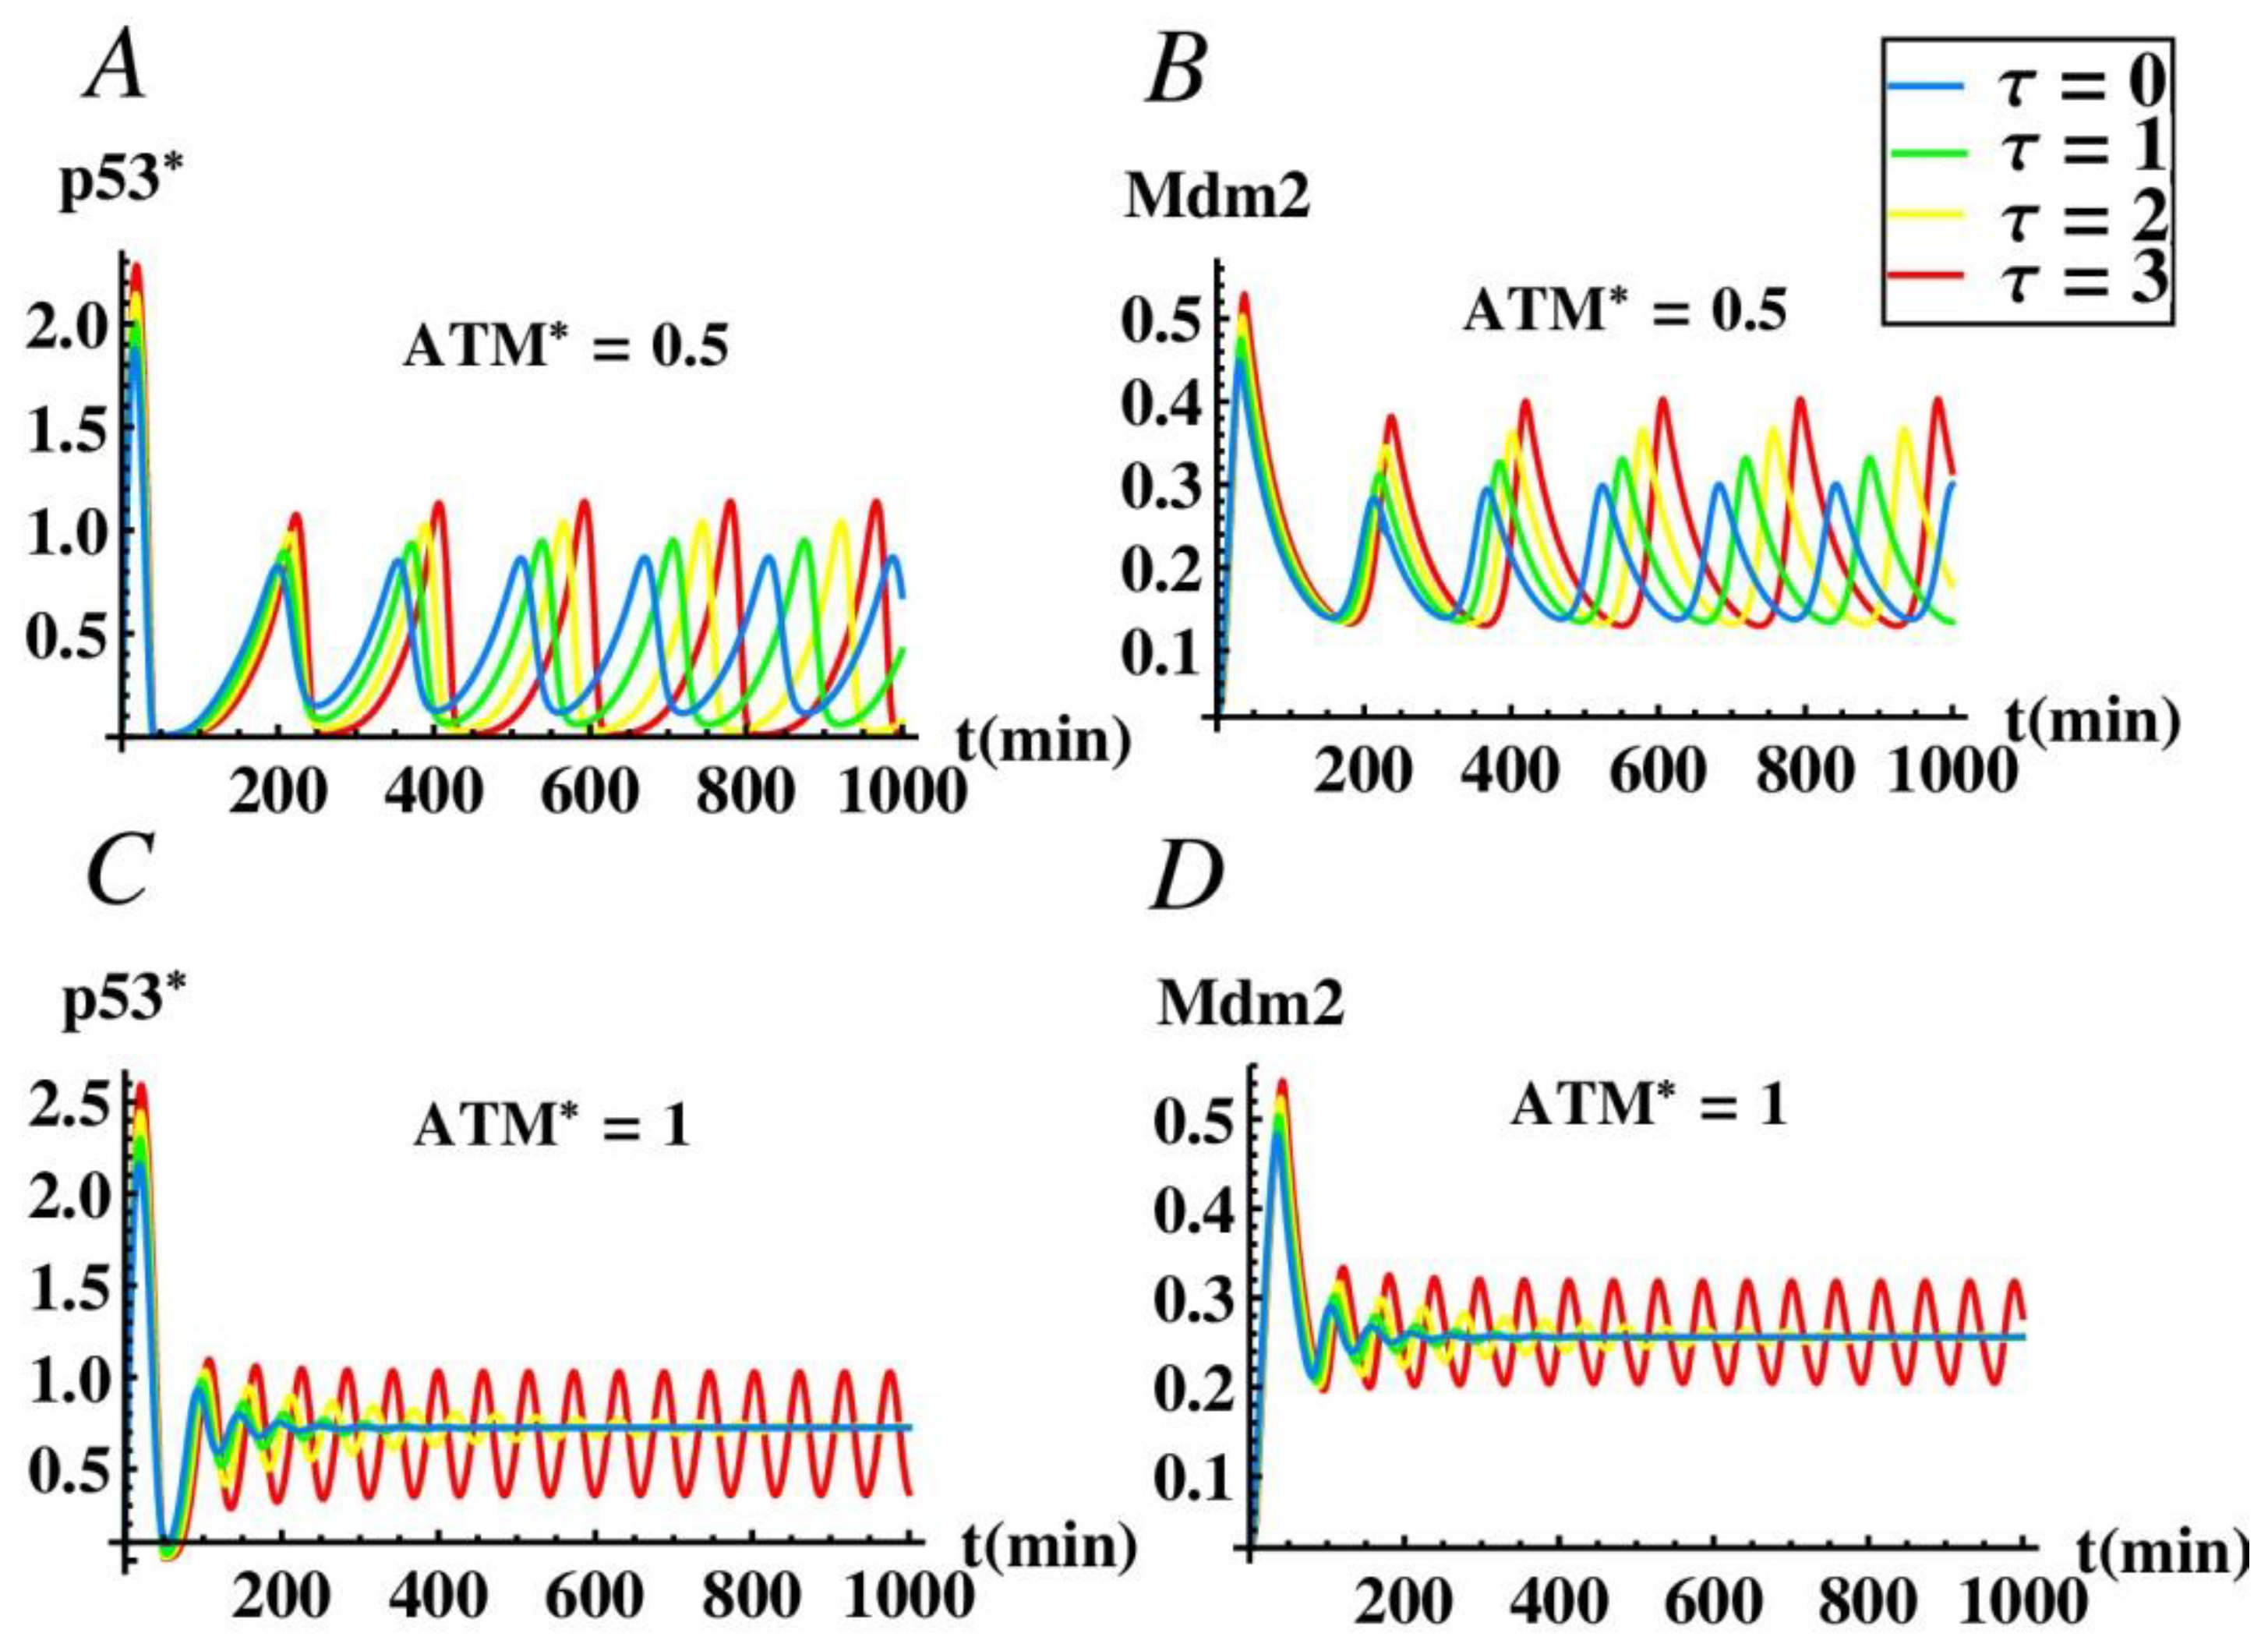
As mentioned in Section 3.1, miR-34a plays an important role in causing p53 oscillation without time delay. In order to further study the effect of time delay on the oscillation of p53 network, we also studied the influence of parameter τ on the amplitude and the period of the oscillation with the presence of miR-34a by numerical simulation. Figure 7A, B show that when A = 0.5, p53* and Mdm2 still exhibit oscillatory behavior without time delay, which is consistent with Figure 3A. At this time, although the change of time delay does not affect the stability of the system, we can see that the oscillation amplitude and period of the system increase with the increase of the delay. It is worth mentioning that in cells without damage, p53 remains at a low level [46,47]. However, when DNA is damaged, p53 accumulates, inducing genes to block DNA synthesis, repair damage or cause cell apoptosis [48,49]. Especially, p53 oscillation is beneficial to the repair of damaged cells, while the high level of p53 promotes the apoptosis of cells impossible to repair, or cancerous cells, avoiding inheritance [50]. Figure 7C,D shows that when A = 1, p53* and Mdm2 are stable state without delay, which is consistent with Figure 3A. As the delay τ increases and passes through the critical time delay τ1 = 2.7226, sustained oscillations of system can be observed. Moreover, both the amplitude and the period of the oscillations tend to increase with an increase of τ. Therefore, time delay plays a crucial role in the oscillation regulation of p53, and it is also known that miR-34a plays an indispensable role in the model.
4. Discussion
We have presented a mathematical model of the decision process with seven major components and a critical time delay. In our model, the dynamics of the p53-Mdm2 network were studied using the Hopf bifurcation theory and numerical simulations. From a biological point of view, under normal circumstances, the concentration of p53* is in a stable steady state and the concentration is low. When the cells meet mild or moderate DNA damage, p53* will show oscillating expression, which can lead to cell cycle arrest to repair DNA damage. When cells are stimulated by severe DNA damage, the concentration of p53* is stay at a stable steady state and the concentration is high, which promotes apoptosis. This means that as the degree of damage increases, p53* changes from a low stable steady state to an oscillating state and then to a high stable steady state. In this article, the degree of DNA damage is represented by the amount of ATM. Therefore, corresponding to the change of the concentration of p53* with ATM*, p53* experienced two Hopf bifurcations: the first time it changed from low steady state to oscillating state, and the second time it changed from oscillation state to high steady state. Similarly, we are also concerned about the effect of p53* on miR34-a, so the Hopf bifurcation of the concentration of p53* with the parameters kon2, ksmi1 and ksmi2 is discussed, which is shown in Figure 3. Considering the time delay as a bifurcation parameter, we studied the effect of time delay on p53* oscillation with or without miR-34a. It was found that time delay τ plays a key role in inducing Hopf bifurcation and in determining the amplitude and period of each oscillation. At the same time, we also found that the point of Hopf bifurcation induced by time delay was ahead of schedule after introducing miR-34a, which shows that miR-34a is also an indispensable factor affecting p53* oscillation. Then, in order to further study the role of miR-34a in our model, we performed a bifurcation analysis and found that the model parameters kon2, ksmi1 and ksmi2 could induce p53* oscillation in an appropriate range. Concretely, the results can be list as follows. First, consistent with the existing research results, we demonstrated that an association rate between miR-34a and sirt1 mRNA (kon2,) can drive p53* oscillations and the amplitude of the oscillation increases as its concentration increases. Second, we have shown that p53* undergoes the initial low-level steady state to the intermediate sustained oscillation state, and at the end reaches to the high-level steady state with the increase of the basal induction rate of miR-34a (ksmi1). Finally, as a transcription factor, p53 promotes the production of miR-34a, and its transcription rate (ksmi2) can induce the oscillation of p53* in an appropriate range. As expected, these results indicated that the positive feedback loop mediated by miR-34a could control stress-induced p53* oscillation. In addition, our results also indicate that a certain amount of miR-34a can also induce higher expression of p53*. Experiments have proven that when p53* was at a high level, the apoptosis program will be initiated, avoiding inheritance [51,52,53]. This suggests that miR-34a may be used as a potential anti-cancer tool. In conclusion, our research may provide a novel perspective for cancer treatment.
Although a new theoretical model is proposed in this paper to predict the dynamic behavior of p53 depending on the time delay and miR-34a, in fact the network is far from simple and involves some other feedback loops. For example, the double negative feedback loop miR34a-| MDM4 -| p53* and the bigger positive feedback loop miR34a-| MDM4 -> MDM2 -| p53*. These feedback loops undoubtedly increase the complexity of the network, so there may be more complex or new dynamic phenomena, which deserve further discussion and will be the next research topic we need to consider.
In our article, the main concern is the effect of other two factors, time delay and miR-34a, on the dynamic of activation of p53 to deduce the role of time delay and miR-34a on the p53-Mdm2 cancer network. Here, the different ways of activating p53 via different post-translational modifications are not handled differently, but we adopt the generally accepted biological fact that there is negative feedback regulation between p53 and Mdm2. For example, the effect of phosphorylation of p53 on serine 15 that negates MDM2 is reflected in the bifurcation diagram of p53* with respect to ksmd2 shown in Figure 8. For ksmd2 < 0.008, p53* level remains in a high steady state, and slowly declines with the increase of ksmd2. Once ksmd2 is greater than 0.008 and less than 0.036, p53* concentration undergoes periodical oscillations. When ksmd2 > 0.036, the oscillations of p53* vanished and the expression level stays at the low steady state. This bifurcation diagram suggested that the expression level of p53* is tightly depend on p53-dependent synthetic rate of Mdm2. Concretely, when the p53-dependent synthetic rate of Mdm2 is low, the p53* lies at a high steady state, which corresponds to cells with severe DNA damage, and the high level of p53* will promote cell apoptosis. When the p53-dependent synthetic rate of Mdm2 is low, the p53* is increased to a median range. The p53* then exhibits sustained oscillations, which correspond to cells with moderate DNA damage, and the oscillation of p53* will promote cell arrest. When the p53-dependent synthetic rate of Mdm2 was low, p53* was plentiful enough, so p53* switched to a low steady state, which corresponds to that of the normal cells. Moreover, C-terminal acetylation of p53 on lysine 382 is indispensable to p53 activation and stability, which is considered in a combined manner with other post-translational modification methods. The integrated effect of p53* on Mdm2 is reflected by the bifurcation diagram of p53* on p53-dependent synthetic rate of Mdm2, which is displayed in Figure 9. For kfp < 13.9, p53* level remains in a low steady state, and slowly rises with increasing of kfp. Once kfp is greater than 13.9 and less than 15.77, p53* concentration undergoes periodical oscillations. When kfp > 15.77, the oscillations of p53* vanished and the expression level stayed at the high steady state. This bifurcation diagram suggested that the expression level of p53* is tightly depend on the activation rate regulated by post-translational modifications. Concretely, when the activation rate regulated by post-translational modifications is low, p53* will lie at a low steady state, which corresponds to that of normal cells. When the activation rate regulated by post-translational modifications is increased to a median range, p53* exhibits sustained oscillations, which corresponds to cells with moderate DNA damage, and the oscillation of p53* will promote cell arrest. When the activation rate regulated by post-translational modifications was big enough, p53* switched to a high steady state, which corresponds to cells with severe DNA damage, and the high level of p53* will promote cell apoptosis.
In addition, p53 can be activated at multiple different sites through post-translational modifications, for example, phosphorylation, methylation and acetylation, to regulate different downstream target genes. We believe that separately and comprehensively comparing and summarizing the differences of the activation of p53 and the corresponding downstream tumor suppressor genes caused by different post-translational modifications of p53 on multiple sites will help biologists to flexibly and purposefully regulate the p53 cancer network so as to effectively treat cancer. This is a very interesting topic, which may be the theme of our next research effort.
5. Materials and Methods
In this paper, we systematically study the dynamical behavior of the p53-mdm2 system with a combination of theoretical predictions and numerical simulations. Particular attention is paid to the oscillatory behavior generated by Hopf bifurcation. From the perspective of mathematics and physics, bifurcation refers to the qualitative behavior of the system changes as the parameters change. In particular, Hopf bifurcation means that the system changes from a stable steady state to an oscillating state or from an oscillation state to a stable steady state as the parameters increase, which is often used to design biological and physical oscillations. In practice, stable steady state and oscillating state may correspond to different physiological states or biological functions. Therefore, it is extremely important at what rate the switching between these two states occurs. Using mathematical and physical methods to predict this switching point is of great significance for the control of certain biological issues. In addition, protein synthesis time delay in nonlinear dynamic systems often leads to rich dynamic behaviors, such as Hopf bifurcation, chaos and periodic oscillations. Here, we focus on the Hopf bifurcation caused by protein synthesis time delay and the positive feedback loop mediated by miR-34a. One of the conditions for satisfying the Hopf bifurcation theory is that the derivative of the real part to the parameter is greater than zero. Moreover, all of these bifurcation diagrams are drawn by using the software XPPAUT, which is a free crossing platform of dynamic system numerical simulation and bifurcation analysis. It is developed by Professor Eard Ermentrout at the Institute of Mathematical Sciences of the University of Pittsburgh, Pennsylvania. Its homepage is http://www.math.pitt.edu/~bard/xpp/xpp.html, where one can find more details. Other numerical simulations are plotted by mathematica10, which is a scientific computing software. It is founded by Stephen Wolfram in 1987. Its company is Wolfram Research, whose Corporate Headquarters is at Champaign, United States. On the grounds of biochemical reactions, the dynamic characteristics of p53 activity are analyzed and predicted based on a set of empirical data given in the published literature. If the empirical data of p53 activity have changed, the functional relationship in the mathematical model has not changed, but the parameters have changed, which can be analyzed by using the same method.
Author Contributions
Conceptualization, F.Y. and H.L.; methodology, H.L.; software, C.G. and F.Y.; validation, C.G., H.L. and F.Y.; formal analysis, C.G., H.L. and F.Y.; investigation, C.G., H.L. and F.Y.; resources, C.G. and F.Y.; data curation, C.G.; writing—original draft preparation, C.G.; writing—review and editing, F.Y.; visualization, C.G. and F.Y.; supervision, F.Y. and H.L.; project administration, F.Y.; funding acquisition, F.Y. and H.L. All authors have read and agreed to the published version of the manuscript.
Funding
This research was funded by the National Natural Science Foundations of China (grants 11762022, 11562021 and 11572278) and the Young Academic and Technical Leaders Program of Yunnan Province (2019HB015).
Acknowledgments
The authors express gratitude to the anonymous editors and reviewers for their helpful and valuable suggestions, which were useful for us to improve the quality of our research.
Conflicts of Interest
The authors declare no conflict of interest.
References
- Hollstein, M.; Sidransky, D.; Vogelstein, B.; Harris, C. p53 mutations in human cancers. Science 1991, 253, 49–53. [Google Scholar] [CrossRef] [PubMed] [Green Version]
- Vogelstein, B.; Lane, D.; Levine, A. Surfing the p53 network. Nature 2000, 408, 307–310. [Google Scholar] [CrossRef] [PubMed]
- Levine, A.J.; Hu, W.; Feng, A. The p53 pathway: what questions remain to be explored? Cell Death Differ. 2006, 13, 1027–1036. [Google Scholar] [CrossRef] [PubMed]
- Fiona, M.Z.; Slee, E.A.; Xin, L. A complex barcode underlies the heterogeneous response of p53 to stress. Nat. Rev. Mol. Cell Biol. 2008, 9, 702. [Google Scholar]
- Yael, A.; Moshe, O. Living with p53, dying of p53. Cell 2007, 130, 597–600. [Google Scholar]
- Ko, L.; Prives, C. p53: puzzle and paradigm. Genes Dev. 1996, 10, 1054. [Google Scholar] [CrossRef] [Green Version]
- Purvis, J.E.; Karhohs, K.W.; Caroline, M.; Eric, B.; Alexander, L.; Galit, L. p53 dynamics control cell fate. Science 2012, 336, 1440–1444. [Google Scholar] [CrossRef] [Green Version]
- Béla, N.; Tyson, J.J. Design principles of biochemical oscillators. Nat. Rev. Mol. Cell Biol. 2008, 9, 981–991. [Google Scholar]
- Lahav, G. Oscillations by the p53-mdm2 feedback loop. Adv. Exp. Med. Biol. 2008, 641, 28–38. [Google Scholar]
- Monk, N. Oscillatory expression of hes1, p53, and nf-kappab driven by transcriptional time delays. Curr. Biol. 2003, 13, 1409–1413. [Google Scholar] [CrossRef] [Green Version]
- Ma, L.; Wagner, J.; Rice, J.; Hu, W.; Levine, A.; Stolovitzky, G. A plausible model for the digital response of p53 to DNA damage. Proc. Natl. Acad. Sci. USA 2005, 102, 14266–14271. [Google Scholar] [CrossRef] [PubMed] [Green Version]
- Wagner, J.; Ma, L.; Rice, J.; Hu, W. p53-mdm2 loop controlled by a balance of its feedback strength and effective dampening using atm and delayed feedback. Syst. Biol. 2005, 152, 109. [Google Scholar] [CrossRef] [PubMed] [Green Version]
- Geva-Zatorsky, N.; Rosenfeld, N.; Itzkovitz, S.; Milo, R.; Sigal, A.; Dekel, E.; Yarnitzky, T.; Liron, Y.; Polak, P.; Lahav, G. Oscillations and variability in the p53 system. Mol. Syst. Biol. 2006, 2, 2006.0033. [Google Scholar] [CrossRef] [PubMed]
- Lujambio, A.; Lowe, S.W. The microcosmos of cancer. Nature 2012, 482, 347–355. [Google Scholar] [CrossRef]
- Esquelakerscher, A.; Slack, F.J. Oncomirs-micrornas with a role in cancer. Nat. Rev. Cancer 2006, 6, 259–269. [Google Scholar] [CrossRef] [PubMed]
- Michael, T.J.; Martin, N.; Parker, J.S.; Morin-Kensicki, E.M.; Tricia, W.; Hammond, S.M. Extensive post-transcriptional regulation of micrornas and its implications for cancer. Genes Dev. 2006, 20, 2202–2207. [Google Scholar]
- Welch, C.; Chen, Y.; Stallings, R.L. Microrna-34a functions as a potential tumor suppressor by inducing apoptosis in neuroblastoma cells. Oncogene 2007, 26, 5017–5022. [Google Scholar] [CrossRef] [Green Version]
- Bommer, G.T.; Gerin, I.; Feng, Y.; Kaczorowski, A.J.; Kuick, R.; Love, R.E.; Zhai, Y.; Giordano, T.J.; Qin, Z.S.; Moore, B.B. p53-mediated activation of mirna34 candidate tumor-suppressor genes. Curr. Biol. 2007, 17, 1298. [Google Scholar] [CrossRef] [Green Version]
- Zhaohui, F.; Cen, Z.; Rui, W.; Wenwei, H. Tumor suppressor p53 meets micrornas. J. Mol. Cell Biol. 2011, 3, 44–50. [Google Scholar]
- Chang, T.C.; Wentzel, E.A.; Kent, O.A.; Ramachandran, K.; Mullendore, M.; Lee, K.H.; Feldmann, G.; Yamakuchi, M.; Ferlito, M.; Lowenstein, C.J. Transactivation of mir-34a by p53 broadlyinfluences gene expression andpromotesapoptosis. Mol. Cell 2007, 26, 745–752. [Google Scholar] [CrossRef] [Green Version]
- Lin, H.; Xingyue, H.; Lim, L.P.; Elisa, D.S.; Zhenyu, X.; Yu, L.; Wen, X.; Lars, Z.; Jill, M.; Dana, R. A microrna component of the p53 tumour suppressor network. Nature 2007, 447, 1130–1134. [Google Scholar]
- Ciliberto, A.; Novak, B.; Tyson, J.J. Steady states and oscillations in the p53/mdm2 network. Cell Cycle 2005, 4, 488–493. [Google Scholar] [CrossRef] [PubMed] [Green Version]
- Zhang, X.; Liu, F.; Cheng, Z.; Wang, W. Cell fate decision mediated by p53 pulses. Proc. Natl. Acad. Sci. USA 2009, 106, 12245–12250. [Google Scholar] [CrossRef] [PubMed] [Green Version]
- Wee, K.; Aguda, B. Akt versus p53 in a network of oncogenes and tumor suppressor genes regulating cell survival and death. Biophys. J. 2006, 91, 857. [Google Scholar] [CrossRef] [Green Version]
- Lev, B.; Maya, R.; Segel, L.; Alon, U.; Levine, A.; Oren, M. Generation of oscillations by the p53-mdm2 feedback loop: a theoretical and experimental study. Proc. Natl. Acad. Sci. USA 2000, 97, 11250–11255. [Google Scholar]
- Pandita, T.K.; Lieberman, H.B.; Lim, D.S.; Dhar, S.; Zheng, W.; Taya, Y.; Kastan, M. Ionizing radiation activates the atm kinase throughout the cell cycle. Oncogene 2000, 19, 1386–1391. [Google Scholar] [CrossRef] [Green Version]
- John, R.; Jackson, S.P. Interfaces between the detection, signaling, and repair of DNA damage. Science 2002, 297, 547–551. [Google Scholar]
- Stommel, J.; Wahl, G. Accelerated mdm2 auto-degradation induced by DNA damage kinases is required for p53 activation. EMBO J. 2014, 23, 1547–1556. [Google Scholar] [CrossRef] [Green Version]
- Yin, Y.; Stephen, C.; Luciani, M.; Haeus, R.F. p53 stability and activity is regulated by mdm2-mediated induction of alternative p53 translation products. Nat. Cell Biol. 2002, 4, 462–467. [Google Scholar] [CrossRef]
- Lewin, B. Genes VIII; Prentice Hall: New York, NY, USA, 2004. [Google Scholar]
- Audibert, A.; Weil, D.; Dautry, F. In vivo kinetics of mrna splicing and transport in mammalian cells. Mol. Cell. Biol. 2002, 22, 6706–6718. [Google Scholar] [CrossRef] [Green Version]
- Vivanco, I.; Sawyers, C. The phosphatidylinositol 3-kinase akt pathway in human cancer. Nat. Rev. Cancer 2002, 2, 489–501. [Google Scholar] [CrossRef] [PubMed]
- Tarasov, V.; Jung, P.; Verdoodt, B.; Lodygin, D.; Epanchintsev, A.; Menssen, A.; Meister, G.; Hermeking, H. Differential regulation of micrornas by p53 revealed by massively parallel sequencing: mir-34a is a p53 target that induces apoptosis and g1-arrest. Cell Cycle 2007, 6, 1586–1593. [Google Scholar] [CrossRef] [PubMed] [Green Version]
- He, L.; He, X.; Lim, L.P.; Stanchina, E.D.; Xuan, Z.; Liang, Y.; Xue, W.; Zender, L.; Magnus, J.; Ridzon, D. A microrna component of the p53 tumour suppressor network. Nature 2007, 447, 1130–1134. [Google Scholar] [CrossRef] [PubMed] [Green Version]
- Tazawa, H.; Tsuchiya, N.; Izumiya, M.; Nakagama, H. Tumor-suppressive mir-34 induces senescence-like growth arrest through modulation of the e2f pathway in human colon cancer cells. Proc. Natl. Acad. Sci. USA 2007, 104, 15472–15477. [Google Scholar] [CrossRef] [PubMed] [Green Version]
- Ravershapira, N.; Marciano, E.; Meiri, E.; Spector, Y.; Rosenfeld, N.; Moskovits, N.; Bentwich, Z.; Oren, M. Transcriptional activation of mir-34a contributes to p53-mediated apoptosis. Mol. Cell 2007, 26, 731–743. [Google Scholar] [CrossRef]
- Yamakuchi, M.; Ferlito, M.; Lowenstein, C.J. mir-34a repression of sirt1 regulates apoptosis. Proc. Natl. Acad. Sci. USA 2008, 105, 13421–13426. [Google Scholar] [CrossRef] [Green Version]
- Eaton, E.N. hsir2(sirt1) functions as an nad-dependent p53 deacetylase. Cell 2001, 107, 149–159. [Google Scholar]
- Lai, X.; Wolkenhauer, O.; Vera, J. Modeling mirna regulation in cancer signaling systems: mir-34a regulation of the p53/sirt1 signaling module. Methods Mol. Biol. 2012, 880, 87. [Google Scholar]
- Zhang, X.; Liu, F.; Wang, W. Two-phase dynamics of p53 in the DNA damage response. Proc. Natl. Acad. Sci. USA 2011, 108, 8990. [Google Scholar] [CrossRef] [Green Version]
- Richard, M.; Kiang, O.H.; Kang, T.; Leonidas, B.; Lan, M. Mir-192-mediated positive feedback loop controls the robustness of stress-induced p53 oscillations in breast cancer cells. PloS Comput. Biol. 2015, 11, e1004653. [Google Scholar]
- Yan, F.; Liu, H.; Liu, Z. Dynamic analysis of the combinatorial regulation involving transcription factors and micrornas in cell fate decisions. Biochim. Biophys. Acta 2014, 1844, 248–257. [Google Scholar] [CrossRef] [PubMed]
- Bakkenist, C.J.; Kastan, M.B. DNA damage activates ATM intermolecular autophosphorylation and dimer dissociation. Nature 2003, 421, 499–506. [Google Scholar] [CrossRef] [PubMed]
- Banin, S.; Moyal, L.; Taya, Y.; Anderson, C.; Chessa, L.; Smorodinsky, N.; Prives, C.; Reiss, Y.; Shiloh, Y.; Ziv, Y. Enhanced phosphorylation of p53 by atm in response to DNA damage. Science 1998, 281, 1674–1677. [Google Scholar] [CrossRef] [PubMed]
- Pomerening, J.R.; Kim, S.Y.; Ferrell, J.E. Systems-level dissection of the cell-cycle oscillator: bypassing positive feedback produces damped oscillations. Cell 2005, 122, 565–578. [Google Scholar] [CrossRef] [PubMed] [Green Version]
- Su, W.; Fang, J.; Cheng, F.; Liu, C.; Zhou, F.; Zhang, J. Rnf2/ring1b negatively regulates p53 expression in selective cancer cell types to promote tumor development. Proc. Natl. Acad. Sci. USA 2013, 110, 1720–1725. [Google Scholar] [CrossRef] [PubMed] [Green Version]
- Levine, A.; Oren, M. The first 30 years of p53: growing ever more complex. Nat. Rev. Cancer 2009, 9, 749–758. [Google Scholar] [CrossRef] [Green Version]
- Meek, D.W. The p53 response to DNA damage. DNA Repair 2004, 3, 1049–1056. [Google Scholar] [CrossRef]
- Zhang, T.; Brazhnik, P.; Tyson, J.J. Exploring mechanisms of the DNA-damage response: p53 pulses and their possible relevance to apoptosis. Cell Cycle 2007, 6, 85–94. [Google Scholar] [CrossRef] [Green Version]
- Vousden, K.; Lu, X. Live or let die: the cell’s response to p53. Nat. Rev. Cancer 2002, 2, 594–604. [Google Scholar] [CrossRef] [Green Version]
- Vousden, K.; Lane, D. p53 in health and disease. Nature Reviews Mol. Cell Biol. 2007, 8, 275. [Google Scholar] [CrossRef]
- Calin, G.A.; Amelia, C.; Muller, F.; Manuela, F.; Wojcik, S.E.; Masayoshi, S.; Cristian, T.; Nicola, Z.; Ramiro, G.; Aqeilan, R.I. Mir-15a and mir-16-1 cluster functions in human leukemia. Proc. Natl. Acad. Sci. USA 2008, 105, 5166–5171. [Google Scholar] [CrossRef] [PubMed] [Green Version]
- Muller, F.; Ramiro, G.; Amelia, C.; Zhongfa, L.; Nicola, Z.; Elisa, C.; Shujun, L.; Hansjuerg, A.; Stefan, C.; Cecilia, F.C. MicroRNA-29 family reverts aberrant methylation in lung cancer by targeting DNA methyltransferases 3A and 3B. Proc. Natl. Acad. Sci. USA 2007, 104, 15805–15810. [Google Scholar]
Figure 1.
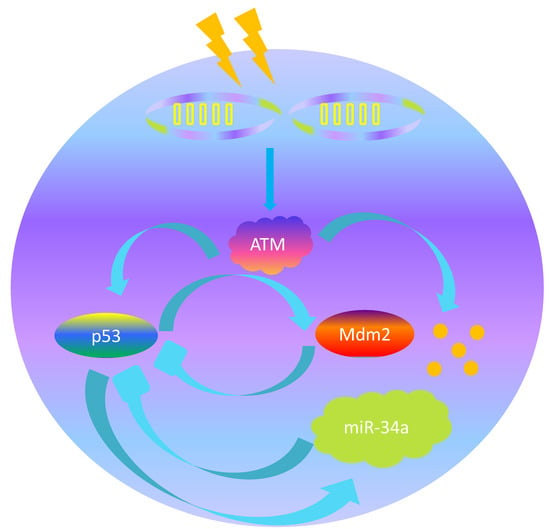
The p53 signal network. ATM* relays the DNA damage signal and induces activation of p53 from the inactive state to the active state (p53*). P53* is a transcriptional factor that can effectively promote the production of Mdm2; during that process there are inevitably time delays. Here, the time delay covers the time needed during both Mdm2 transcription and translation, which is recorded as τ. In turn, Mdm2 can bind to p53 and p53*, resulting in enhanced degradation of p53 and p53*. On the other hand, p53* can also activate miR-34a. Subsequently, miR-34a inhibits SIRT1 by promoting the degradation of sirt1 mRNA, which leads to an increase of acetylated p53. In addition, Mdm2 protein is degraded by a mechanism stimulated by ATM*.
Figure 1.
The p53 signal network. ATM* relays the DNA damage signal and induces activation of p53 from the inactive state to the active state (p53*). P53* is a transcriptional factor that can effectively promote the production of Mdm2; during that process there are inevitably time delays. Here, the time delay covers the time needed during both Mdm2 transcription and translation, which is recorded as τ. In turn, Mdm2 can bind to p53 and p53*, resulting in enhanced degradation of p53 and p53*. On the other hand, p53* can also activate miR-34a. Subsequently, miR-34a inhibits SIRT1 by promoting the degradation of sirt1 mRNA, which leads to an increase of acetylated p53. In addition, Mdm2 protein is degraded by a mechanism stimulated by ATM*.

Figure 2.
A simplified relationship containing the main components of the p53 signal network. The central node p53* connects two feedback loops. One is a negative feedback loop formed by p53* and Mdm2 with time delay, and the other is a positive feedback loop formed by p53* and miR-34a with the feature of double-negative regulation.

Figure 3.
The bifurcation diagram of p53* concentration and model parameters. (A), (B), (C) and (D) correspond to the parameters ATM*, kon2, ksmi1 and ksmi2, respectively.
Figure 3.
The bifurcation diagram of p53* concentration and model parameters. (A), (B), (C) and (D) correspond to the parameters ATM*, kon2, ksmi1 and ksmi2, respectively.

Figure 4.
The bifurcation diagram of the kon2 versus ATM* concentration.

Figure 5.
The effects of time delay τ on the p53-Mdm2 system of model (1) when there is no expression of miR34-a. (A) The positive equilibrium is asymptotically stable whenτ = 0. (B) The positive equilibrium is asymptotically stable when τ = 3 < τ0 = 5.1038. (C,D) The positive equilibrium is unstable when τ = 6 > τ0 = 5.1038.

Figure 6.
The effects of time delay τ on the p53-Mdm2 system of model (1) when there is certain expression of miR34-a. (A) The positive equilibrium is asymptotically stable when τ = 0. (B) The positive equilibrium is asymptotically stable when τ = 1.5 < τ0 = 3.5578. (C,D) The positive equilibrium is unstable when τ = 4.5 > τ0 = 3.5578.

Figure 7.
The effect of time delay on the dynamics of the p53-mdm2 system. (A) The time evolution process of the p53* concentration when ATM* = 0.5. (B) The time evolution process of the Mdm2 concentration when ATM* = 0.5. (C) The time evolution process of the p53* concentration when ATM* = 1. (D) The time evolution process of the Mdm2 concentration when ATM* = 1.

Figure 8.
The bifurcation diagram of p53* concentration corresponds to the parameter ksmd2.

Figure 9.
The bifurcation diagram of p53* concentration corresponds to the parameter kfp.


Table 1.
Parameters values used in numerical simulations.
| Parameter | Description | Value | Reference |
|---|---|---|---|
| ksp53 | Production rate of p53 | 0.2 | [40] |
| kda1 | Deactivation rate of p53* by SIRT1 | 3.3 | [41] |
| k0 | Michaelis constant of SIRT1-dependent p53 deactivation | 0.0087 | [41] |
| kdp531 | Basal degradation rate of p53 | 0.02 | [11] |
| kdp532 | Mdm2-dependent degradation rate of p53 | 0.7 | [40] |
| kd1 | Threshold conc. for Mdm2-dependent p53 degradation | 0.03 | [11] |
| kd2 | Threshold conc. for Mdm2-dependent p53* degradation | 0.3 | [11] |
| kfp | The post-translational modifications rate including phosphorylation, methylation, acetylation, etc. on multiple different sites of p53 | 15 | [41] |
| kp | Michaelis constant of ATM*-dependent p53 phosphorylation | 0.87 | [41] |
| A | ATM* concentration | 0~10 | [12] |
| krp | Dephosphorylation rate of p53* | 0.2 | [11] |
| kdp53s | Mdm2-dependent degradation rate of p53* | 0.14 | [40] |
| ksmd1 | Basal production rate of Mdm2 | 0.002 | [41] |
| ksmd2 | P53-dependent synthetic rate of Mdm2 | 0.024 | [41] |
| k | Michaelis constant of p53-dependent Mdm2 production | 1 | [11] |
| kdmdm20 | Basal degradation rate of Mdm2 | 0.003 | [40] |
| kdmdm21 | ATM*-dependent degradation rate of Mdm2 | 0.05 | [40] |
| ksmi1 | Basal induction rate of miR-34a | 0.0018 | [39] |
| ksmi2 | P53*-induced transcription rate of miR-34a | 0.01 | [39] |
| j1 | Michaelis constant of p53*-dependent miR-34a transcription | 1 | Estimate |
| kdmi | Degradation rate of miR-34a | 0.0078 | [41] |
| kon2 | Association rate between sirt1 mRNA and miR-34a | 10 | [41] |
| koff2 | Dissociation rate of sirt1-miR-34a complex | 0.13 | [41] |
| ksmir | Degradation rate of sirt1-miR-34a complex | 0.062 | [41] |
| kss | Basal induction rate of sirt1 mRNA | 0.01 | [42] |
| kssi | Degradation rate of sirt1 mRNA | 0.062 | [41] |
| rsirt1 | Translation rate of SIRT1 protein | 0.42 | [41] |
| ksirt1 | Degradation rate of SIRT1 protein | 0.03 | [41] |
| τ | Transcriptional and translation time delays | 0∼30min | Estimate |
© 2020 by the authors. Licensee MDPI, Basel, Switzerland. This article is an open access article distributed under the terms and conditions of the Creative Commons Attribution (CC BY) license (http://creativecommons.org/licenses/by/4.0/).
Share and Cite
MDPI and ACS Style
Gao, C.; Liu, H.; Yan, F. Dynamic Behavior of p53 Driven by Delay and a Microrna-34a-Mediated Feedback Loop. Int. J. Mol. Sci. 2020, 21, 1271. https://0-doi-org.brum.beds.ac.uk/10.3390/ijms21041271
AMA Style
Gao C, Liu H, Yan F. Dynamic Behavior of p53 Driven by Delay and a Microrna-34a-Mediated Feedback Loop. International Journal of Molecular Sciences. 2020; 21(4):1271. https://0-doi-org.brum.beds.ac.uk/10.3390/ijms21041271
Chicago/Turabian StyleGao, Chunyan, Haihong Liu, and Fang Yan. 2020. "Dynamic Behavior of p53 Driven by Delay and a Microrna-34a-Mediated Feedback Loop" International Journal of Molecular Sciences 21, no. 4: 1271. https://0-doi-org.brum.beds.ac.uk/10.3390/ijms21041271
Note that from the first issue of 2016, this journal uses article numbers instead of page numbers. See further details here.