Article

Salinity Stress-Mediated Suppression of Expression of Salt Overly Sensitive Signaling Pathway Genes Suggests Negative Regulation by AtbZIP62 Transcription Factor in Arabidopsis thaliana

1
Laboratory of Plant Functional Genomics, School of Applied Biosciences, Kyungpook National University, Daegu 702-701, Korea
2
National Laboratory of Seed Testing, National Seed Service, SENASEM, Ministry of Agriculture, Kinshasa 904KIN1, Congo
3
Laboratory of Crop Physiology, School of Applied Biosciences, Kyungpook National University, Daegu 41566, Korea
*
Author to whom correspondence should be addressed.
Int. J. Mol. Sci. 2020, 21(5), 1726; https://0-doi-org.brum.beds.ac.uk/10.3390/ijms21051726
Submission received: 7 February 2020 / Revised: 26 February 2020 / Accepted: 1 March 2020 / Published: 3 March 2020
(This article belongs to the Section Molecular Plant Sciences)

Abstract

:
Salt stress is one of the most serious threats in plants, reducing crop yield and production. The salt overly sensitive (SOS) pathway in plants is a salt-responsive pathway that acts as a janitor of the cell to sweep out Na+ ions. Transcription factors (TFs) are key regulators of expression and/or repression of genes. The basic leucine zipper (bZIP) TF is a large family of TFs regulating various cellular processes in plants. In the current study, we investigated the role of the Arabidopsis thaliana bZIP62 TF in the regulation of SOS signaling pathway by measuring the transcript accumulation of its key genes such as SOS1, 2, and 3, in both wild-type (WT) and atbzip62 knock-out (KO) mutants under salinity stress. We further observed the activation of enzymatic and non-enzymatic antioxidant systems in the wild-type, atbzip62, atcat2 (lacking catalase activity), and atnced3 (lacking 9-cis-epoxycarotenoid dioxygenase involved in the ABA pathway) KO mutants. Our findings revealed that atbzip62 plants exhibited an enhanced salt-sensitive phenotypic response similar to atnced3 and atcat2 compared to WT, 10 days after 150 mM NaCl treatment. Interestingly, the transcriptional levels of SOS1, SOS2, and SOS3 increased significantly over time in the atbzip62 upon NaCl application, while they were downregulated in the wild type. We also measured chlorophyll a and b, pheophytin a and b, total pheophytin, and total carotenoids. We observed that the atbzip62 exhibited an increase in chlorophyll and total carotenoid contents, as well as proline contents, while it exhibited a non-significant increase in catalase activity. Our results suggest that AtbZIP62 negatively regulates the transcriptional events of SOS pathway genes, AtbZIP18 and AtbZIP69 while modulating the antioxidant response to salt tolerance in Arabidopsis.

1. Introduction

Salinity stress is one of the major challenges threatening food security and restricting crop productivity [1,2,3,4]. This abiotic stress affects the agricultural sector on a global scale. Salt stress induction leads to impaired plant growth and development (i.e., reduced rate of leaf surface expansion, cessation of expansion with the intensification of stress), crop failure, and cytotoxicity due to excessive ions, such as from sodium uptake and nutritional imbalance [5,6]. To cope with salt stress conditions, plants acquired diverse mechanisms that function to maintain a balanced reduction-oxidation state, reduced cellular hyperosmolarity, and ion disequilibrium [7]. The adverse effect of salinity stress is perceived at the whole-plant level. The signs are expressed throughout development, including germination, seedling stage, vegetative growth, and flowering. Salt stress involves the induction of signals that are influenced by diverse signaling pathways [8,9,10,11,12].
Leonard and Hepler [13] supported that the balance of calcium (Ca2+) and sodium (Na+) ions is an important component of salt tolerance in plants. Diverse physiological, molecular, and biochemical aspects of Na+ and Cl uptake and transport associated with salt stress were identified. Generally, during salinity stress, plants generate reactive oxygen species (ROS) [14] and reactive nitrogen species (RNS) [15], which can lead to oxidative damage [16] and lipid peroxidation [17], among other effects. To tackle the extent of oxidative or nitrosative stress, plants activate antioxidant systems that include accumulation of nitric oxide, induction of catalase, superoxide dismutase, and peroxidase activity, enhancement of chlorophyll and proline content, etc. [17,18,19,20,21,22]. In order to withstand disturbed environmental conditions, such as salt stress, plants activate genes and transcription factors (TFs) coding genes. TFs are proteins indispensable for regulating gene expression and, as such, TFs modulate essential aspects of organismal function. Intrinsic to the TF mode of action is their ability to interact with particular sequences of DNA, as well as other proteins as part of their transcriptional activities to regulate gene expression [23]. ROS or RNS generation, transcriptional regulation, and ionic homeostasis are interconnected; therefore, they are part of the complex network modulating the response of plants, including salinity tolerance, to abiotic stress [24,25].
The salt tolerance mechanisms involve, in addition to the various antioxidant systems, the activation of many other biosynthetic and signaling pathways such as the salt overly sensitive (SOS) pathway [12]. In plants, the SOS pathway comprising SOS1, SOS2, and SOS3 was suggested to regulate cellular signaling during salt stress to mediate ion homeostasis. It is well established that SOS pathway genes are involved in Na+ extrusion [26].
In rice [27,28] and Arabidopsis [29,30], genes encoding the SOS proteins were identified. These genes play an important role in maintaining a balanced ion level within the cell and in conferring salt tolerance. Moreover, an increase in salt tolerance was recorded in plants overexpressing SOS genes [31]. The Arabidopsis SOS genes (1 to 3) co-express and are involved in the adaptive response to salt tolerance [29,31].
The SOS pathway in rice was shown to correlate with the ability to exclude sodium from the shoot and maintain a controlled and low Na+/K+ ratio [32,33]. Upon salt stress induction, SOS pathway genes are reported to be induced, and they regulate vacuolar Na+/H+ exchange in Arabidopsis [34]. These genes play an important role in pumping sodium ions out of the cell, among others, in addition to interacting with calcium, mitogen-activated protein kinases (MAPKs), and calcium-dependent protein kinases, as well as being involved signaling and signal transduction. MAPKs are protein serine/threonine kinases, which convert the extracellular stimuli into broad-spectrum cellular responses [35]. In addition, the characterization of tonoplast (vacuolar membrane) Na+/H+ exchange suggested that the activity of the regulatory pathway components (SOS1) originated from the AtNHX proteins [36]. Moreover, TFs such as bZIP were reported as being part of the adaptive response mechanisms to salt tolerance in plants [37,38,39,40].
In order to investigate the role of the AtbZIP62 gene encoding TF in the regulation of expression of SOS signaling pathway genes under salinity stress in plants, this study monitored the transcriptional response of three well-identified Arabidopsis thaliana SOS pathways genes in both wild-type (WT) and the atbzip62 mutant exposed to NaCl-induced salt stress. Additionally, changes in physiological and biochemical processes caused by the perturbation in the AtbZIP62 under salt stress, activation of antioxidants systems, modification of chloroplast pigment composition, proline content, lipid peroxidation, and the phenotypic response of atbzip62 under salinity stress were studied to elucidate the function of AtbZIP62 TF in salinity stress response. Moreover, the atcat2 deficient in AtCATALASE2 [41] and atnced3 deficient in AtNCED3 (9-cis-epoxycarotenoid dioxygenase involved in ABA pathway) [42] KO mutants were included in this study as salt-sensitive mutants to study the role that AtbZIP62 could play in maintaining a balanced cellular reduction–oxidation state within the cell during salinity stress.

2. Results

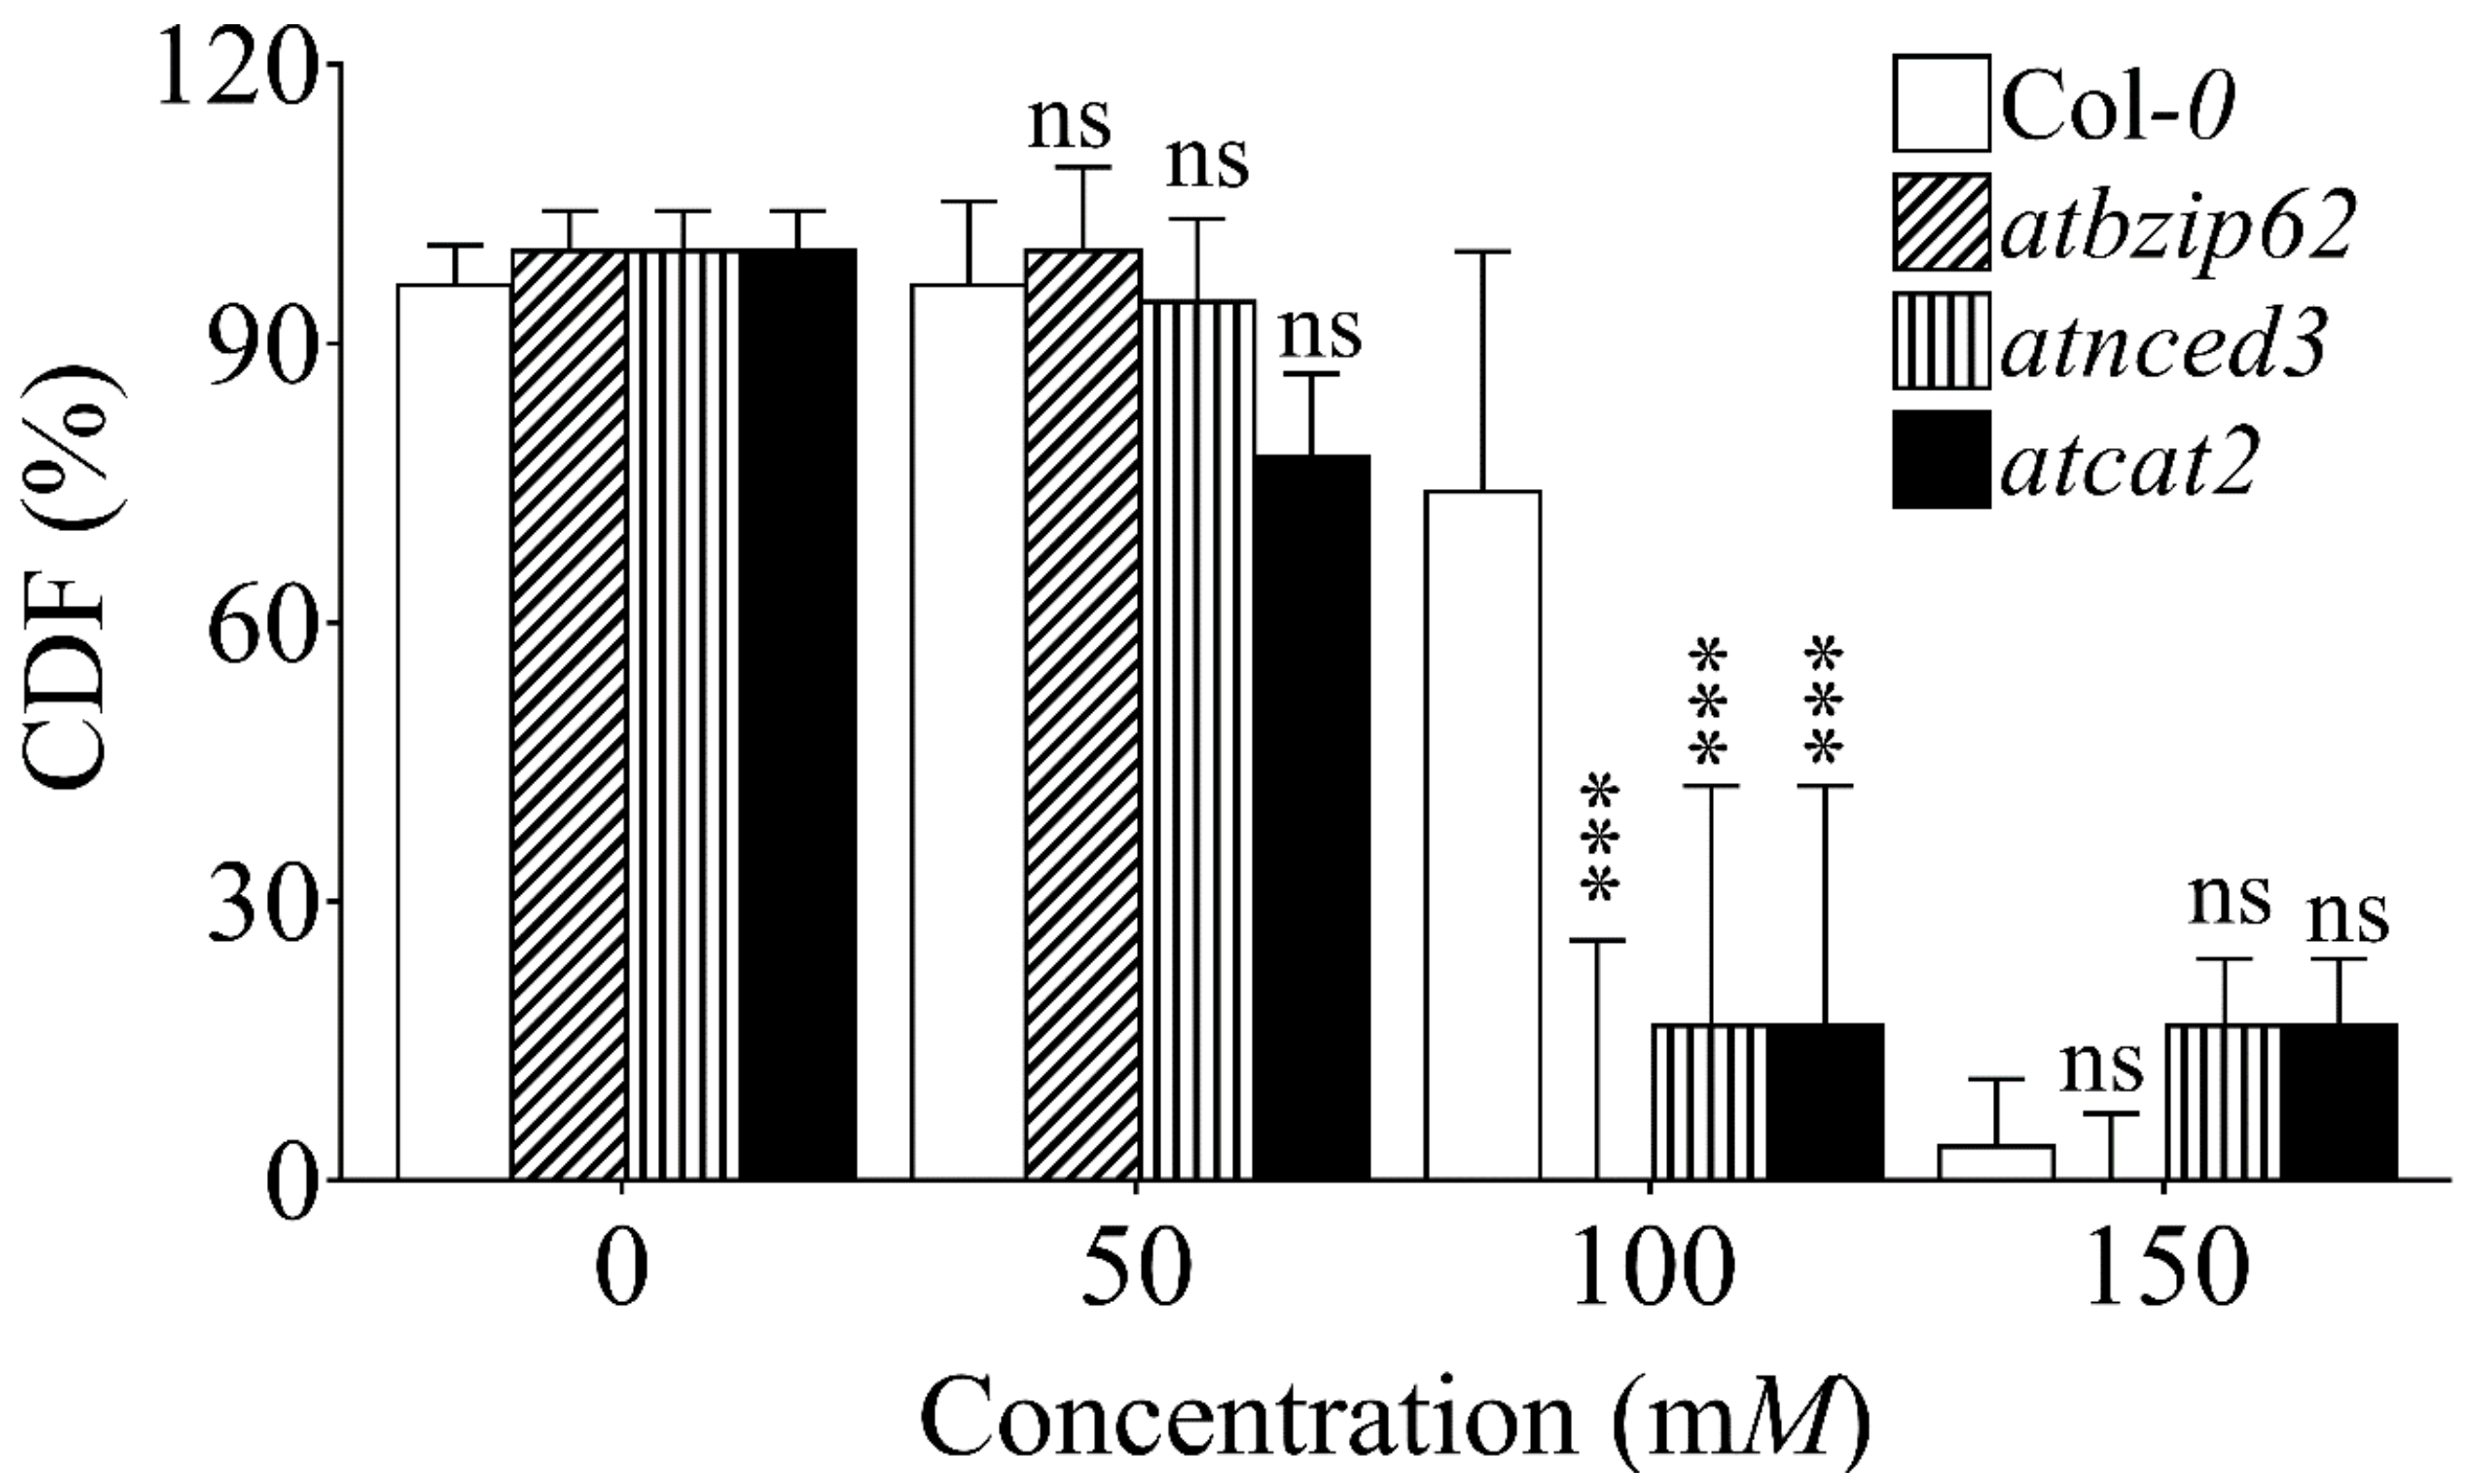
2.1. Initial Screening for Selection of NaCl Concentration

Prior to exposing Arabidopsis plants to salt stress at the rosette stage, we performed an initial screening of four genotypes to evaluate their response to salinity stress on MS media modified with gradient NaCl concentrations of 50, 100, 150, or 200 mM. We evaluated their germination ability for five days. The results showed that, under 150 mM NaCl, the germination of atbzip62 seeds was inhibited significantly compared to WT, atnced3, and atcat2 (see Figure S1, Supplementary Materials). Other NaCl concentrations (50 mM and 100 mM) also showed various reductions in germination patterns, after which recovery was observed. However, 200 mM completely inhibited the germination of atbzip62 seeds. To select the NaCl concentration for downstream experiments, we cross-evaluated the germination frequency data, as well as the shoot and root growth patterns. The cotyledon development frequency (CDF) was calculated by counting only the developed green seedlings (as some seeds might germinate but do not survive on stress media after long exposure) as described previously [43,44] of the targeted genotypes on media with different concentrations of salt. We identified 150 mM NaCl as the most effective concentration for downstream experiments, due to the inhibitory effect recorded (Figure 1).

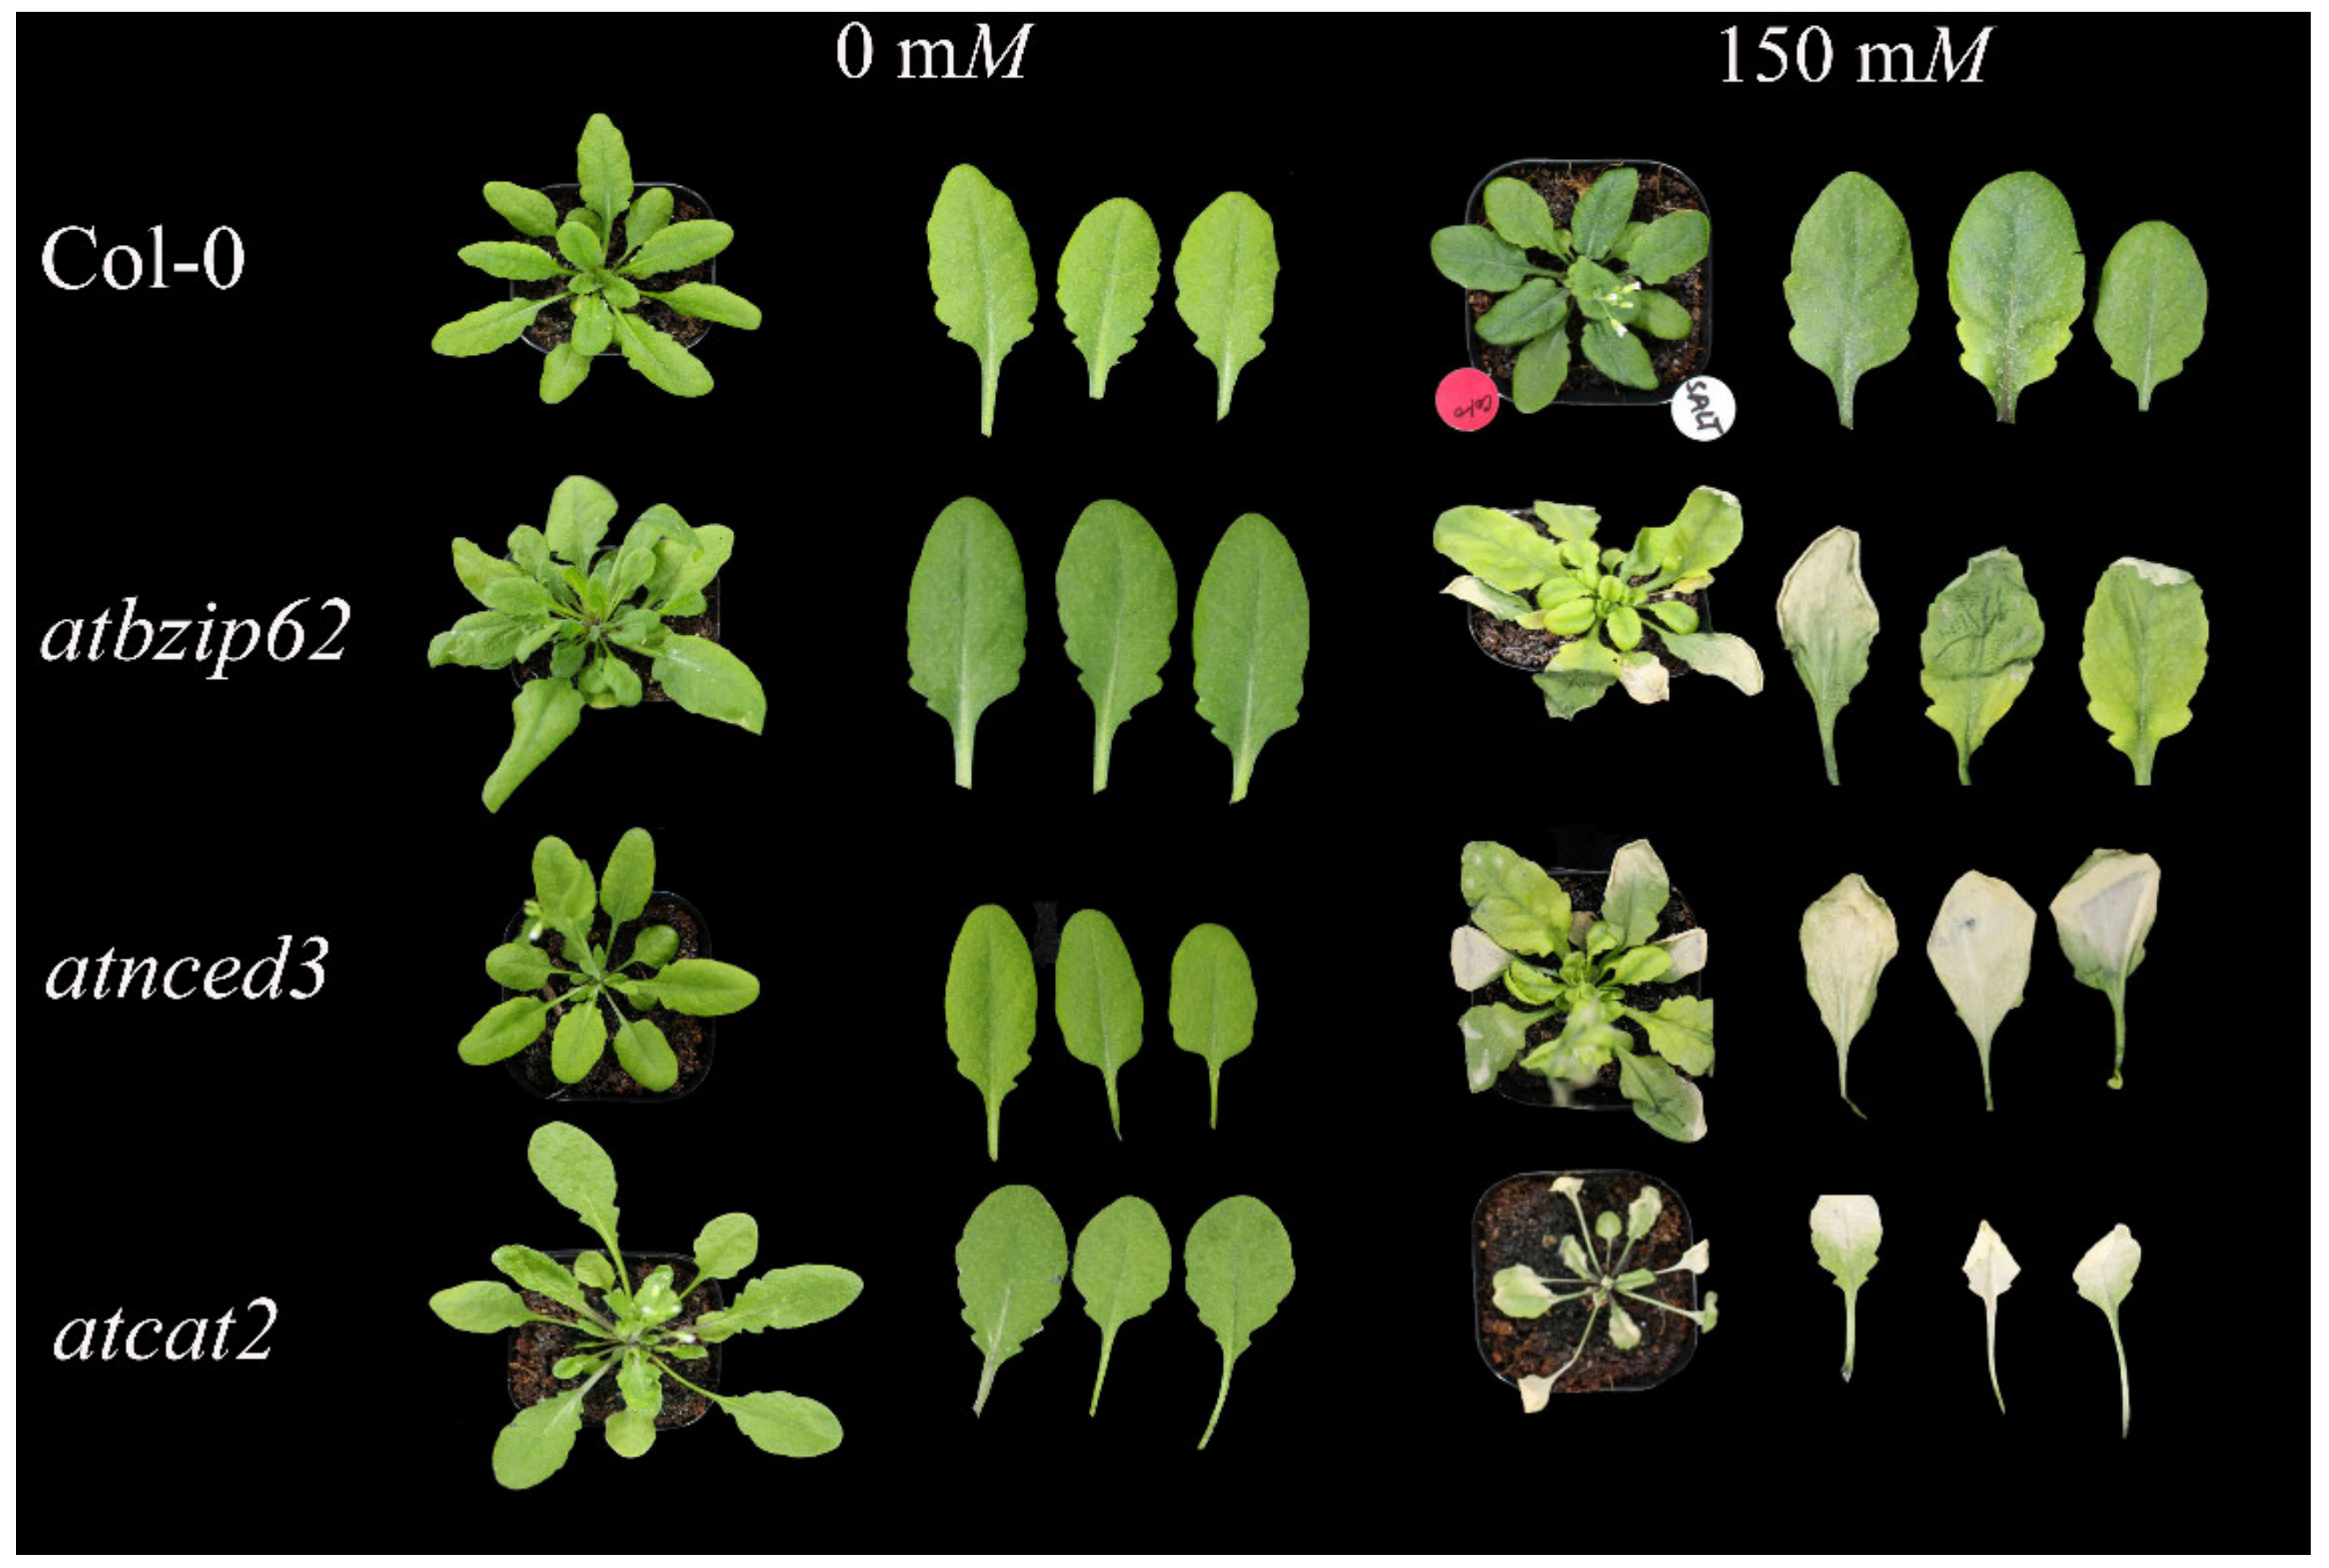
2.2. Growth of Arabidopsis Genotypes on Gradient NaCl Concentrations

We were interested to see how the atbzip62 KO mutant would respond to salt stress (Figure 1). The results showed that low salt concentration (50 mM) did not affect the growth of Arabidopsis genotypes two weeks after exposure. However, when grown on 100 mM NaCl, atbzip62, atnced3, and atcat2 were affected significantly compared to WT. Furthermore, when grown on 150 mM, the survival rate of all genotypes dropped drastically. When 200 mM was supplied, none of the genotypes grew. We further observed that shoot growth was inhibited significantly in response to gradient NaCl concentrations (Figures S2 and S3A,B,C, Supplementary Materials). The maximum inhibitory effect of NaCl-induced salt stress was recorded under 200 mM on MS medium, where total shoot growth inhibition was observed in the Col-0 wild type and atbzip62 mutant. In contrast, under 150 mM treatment, all genotypes had their shoot growth inhibited, but not completely. Low NaCl concentration (50 mM) did not have an inhibitory effect on root growth; rather, we observed a slight increase in root length (Figures S2 and S4, Supplementary Materials). From 100 mM, plants started experiencing a reduction in root growth. The shortest root length was recorded in atbzip62. Furthermore, when grown on 150 mM NaCl, all genotypes exhibited strong inhibition of root growth. However, 200 mM NaCl inhibited root growth completely.

2.3. The Arabidopsis Atbzip62 Loss-of-Function Mutant Is Sensitive to Salt Stress

Upon exposure to high salinity, four Arabidopsis genotypes exhibited different levels of response (Figure 2). For instance, Col-0 showed some level of tolerance. The leaves were intact at 10 days after salt stress induction. In contrast, atbzip62 showed severe leaf drying, wilting, and high sensitivity; atnced3, lacking the AtNCED3 gene, and atcat2, lacking the AtCAT2 gene, were affected severely by 150 mM NaCl.

2.4. Arabidopsis AtbZIP62 Loss-of-Function Mutant Upregulated AtPYD1, AtbZIP18, and AtbZIP69 under Salt Stress

After exposure of the atbzip62 loss-of-function mutant to high salinity, we investigated the transcriptional levels of AtPYD1 by quantitative real-time PCR (qRT-PCR), the ortholog of the rice DHODH1 observed previously to be upregulated by drought stress and salinity [45], in the atbzip62 mutant background. The results revealed that AtPYD1 expression was upregulated significantly in atbzip62, and increased over time, while it was downregulated in WT under the same conditions (Figure 3A). Under NaCl stress conditions, AtPYD1 showed a contrasting expression pattern (upregulated in WT and downregulated in atbzip62). A slight increase was also observed when AtPYD1 was expressed in atcat2, lacking the AtCAT2 gene. We were also interested to see the pattern of AtbZIP62 expression in WT under conditions of varying salinity. The qPCR results revealed that the expression of AtbZIP62 was upregulated significantly in atcat2 compared to WT (Figure 3B). We also observed that AtbZIP18 (Figure 3C) and AtbZIP69 (Figure 3D) were upregulated similarly in the atbzip62 loss-of-function mutant under the same conditions.

2.5. The Expression of SOS Signaling Pathway Genes Is Upregulated in atbzip62 Loss-of-Function Mutant Exposed to Salt Stress

SOS pathway genes regulate the balance of salt ions in the cell during salinity stress. This evidence helped us investigate the role of AtbZIP62 TF in the adaptive mechanism of salt tolerance in plants. We expressed three SOS pathway genes in atbzip62 exposed to NaCl-induced salt stress. Interestingly, all three SOS genes were downregulated similarly in the WT, whereas, in atbzip62, they were upregulated significantly (Figure 3E–G).

2.6. Glutamate Synthase-Encoded Genes Are Induced by Salt Stress in atbzip62

Glutamate synthase is involved in the initial steps of nitrogen assimilation in plants. Abiotic stresses do not only prevent plants from obtaining available water, but they also restrict them from acquiring essential nutrients, such as nitrogen, for their growth and development. Therefore, we investigated the transcriptional regulation of high-affinity nitrogen assimilation genes related to AtbZIP62 under salt stress. Our data, presented in Figure 3H, show that the glutamate synthase-encoding gene 1 (Gls1) was downregulated by salt stress in Col-0, whereas it was upregulated significantly in the atbzip62 KO mutant. Similarly, expression of the gene encoding glutamate synthase 2 was suppressed in Col-0 (Figure 3I).

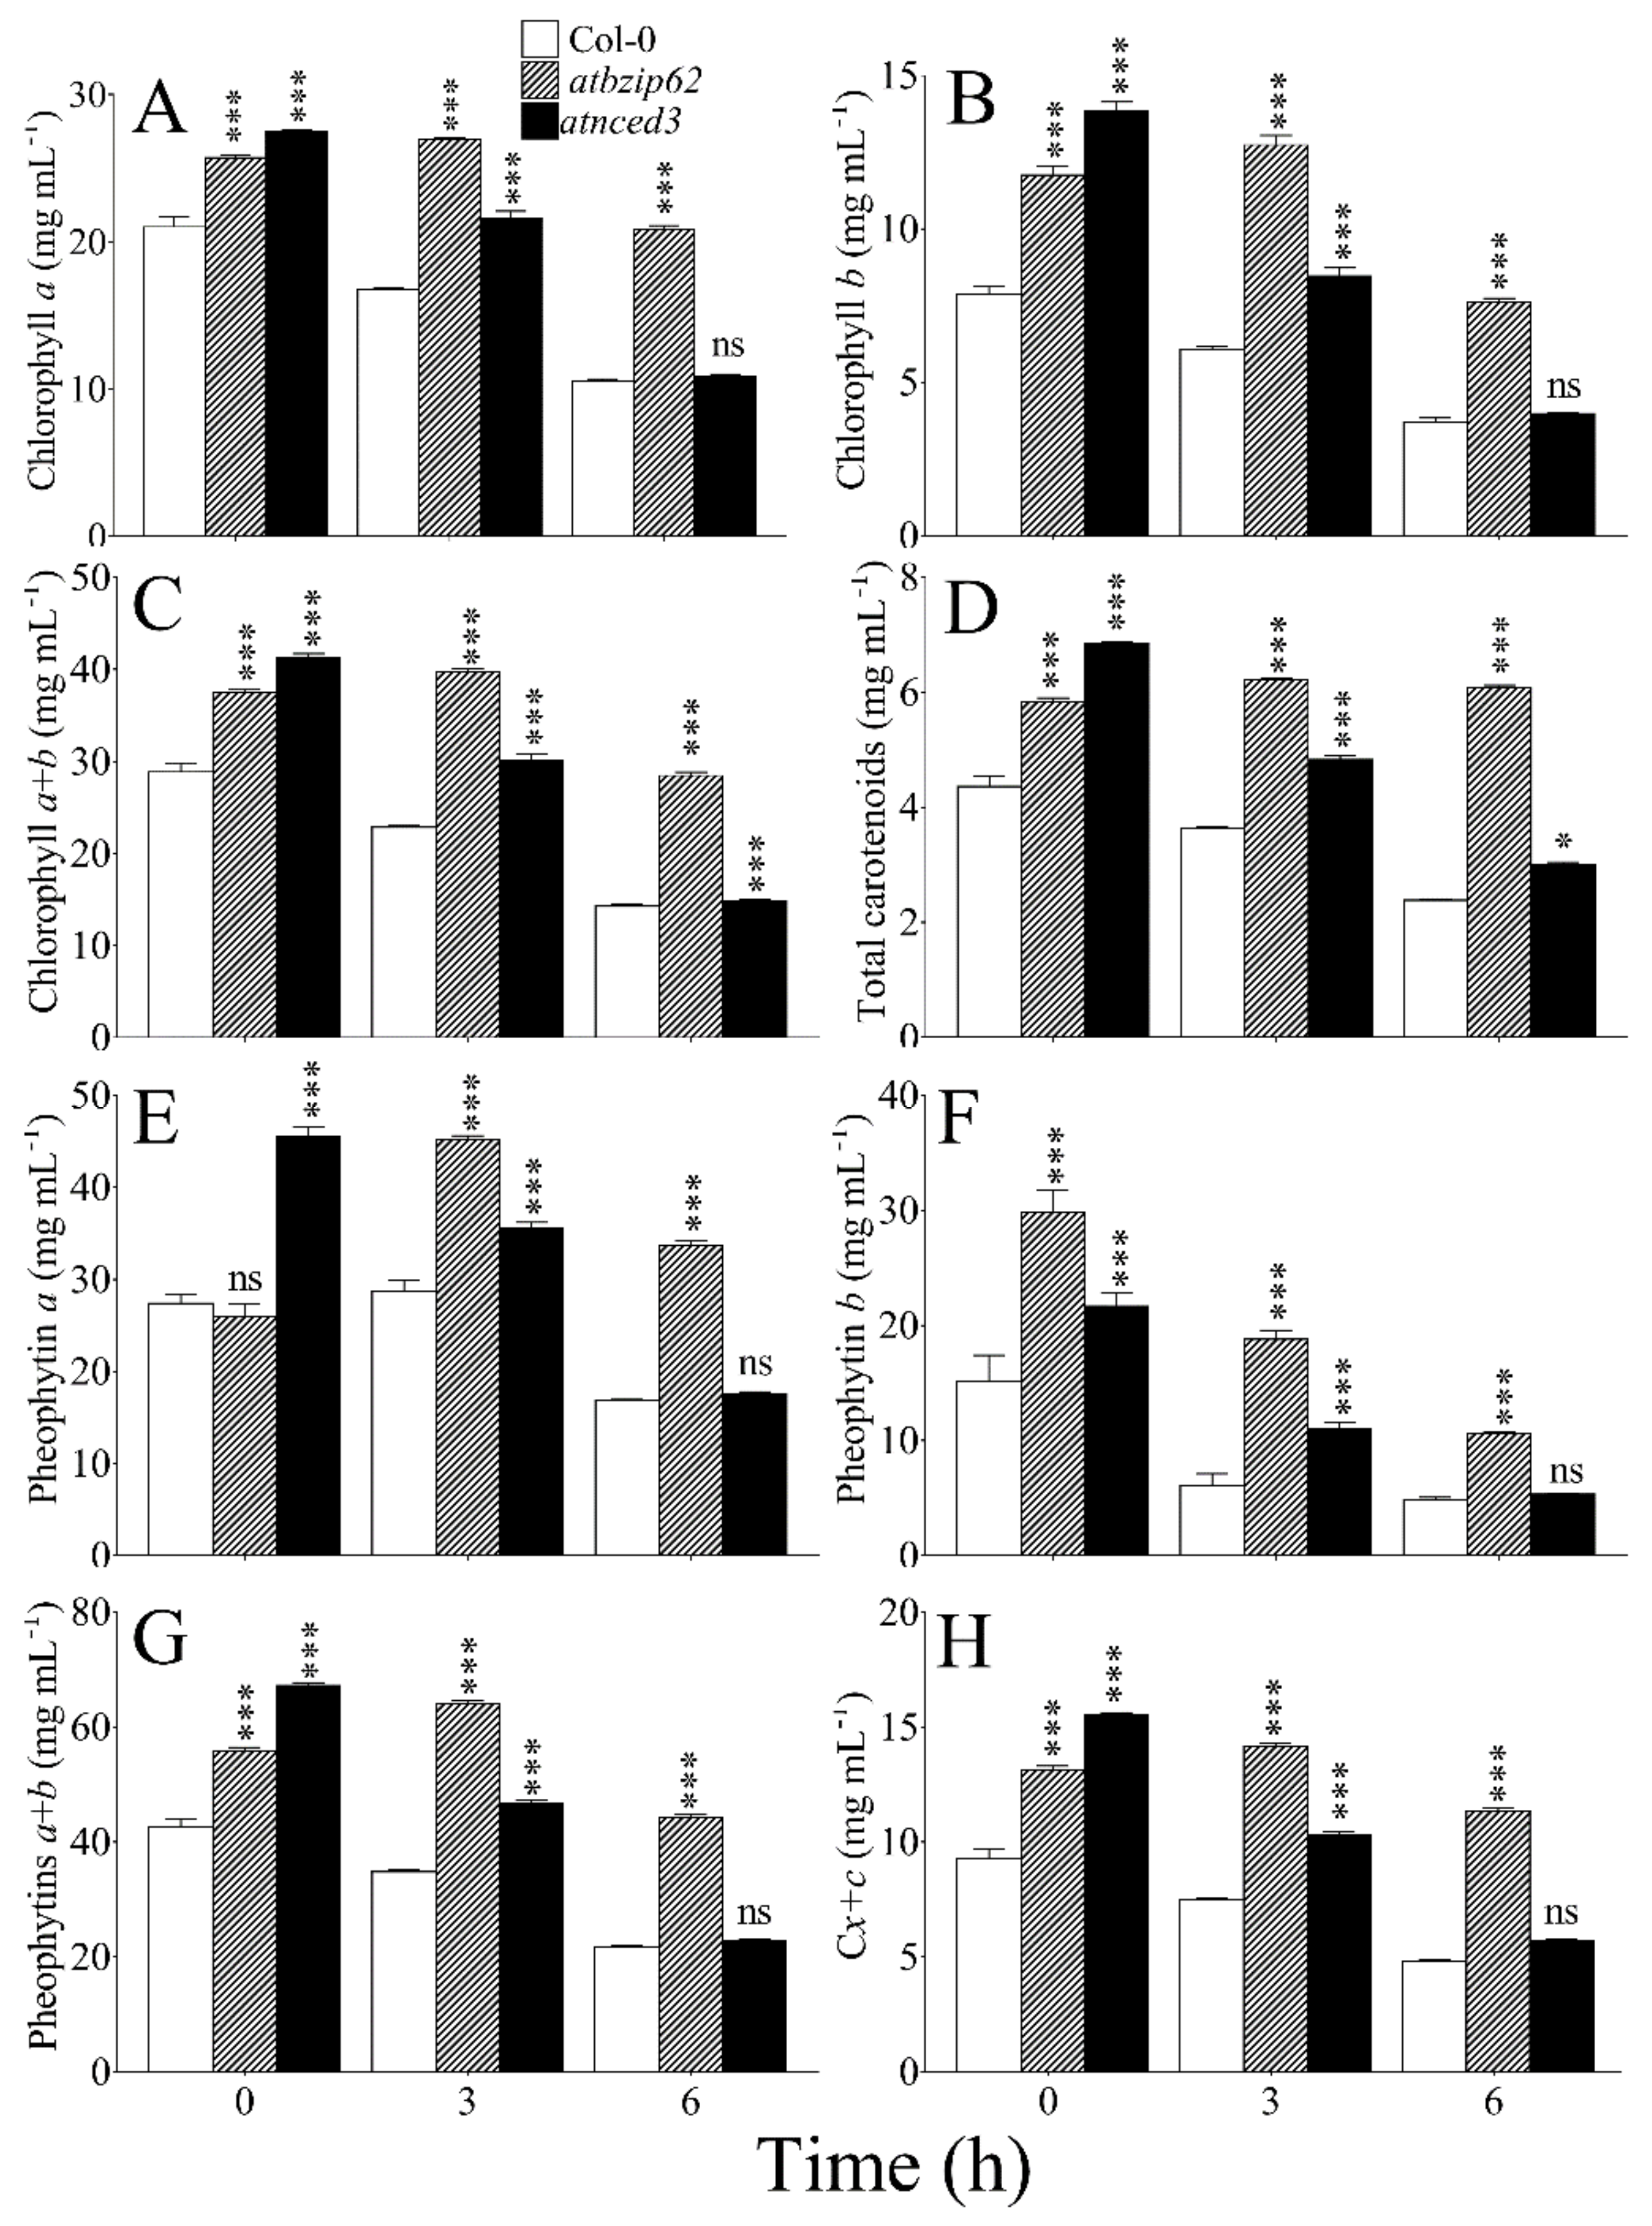
2.7. Change in Chloroplast Pigment Content under Salt Stress

Chlorophylls are major pigments that accumulate in the chloroplast and are key players in light-harvesting during the photosynthetic process. Chlorophyll a (Figure 4A), chlorophyll b (Figure 4B), and chlorophyll a + b (Figure 4C) were shown to decrease significantly in Col-0 wild type after exposure to NaCl-induced salinity over time. However, in atbzip62, a significant increase was recorded at 3 h and a decrease was recorded at 6 h. In atnced3, all chlorophylls decreased over time in response to salt stress in the same manner as observed in WT. Total carotenoid content exhibited patterns similar to chlorophylls under salt stress (Figure 4D).
Pheophytin is important in the transfer of electrons during photosynthesis. Here, we observed that pheophytin a pigment decreased significantly in WT 6 h after salt stress. In the atbzip62 and atnced3 loss-of-function mutants, we recorded an opposite pattern, where a significant increase in pheophytin a was observed after 3 h (Figure 4E). Pheophytin b decreased over time in WT, atbzip62, and atnced3 (Figure 4F). The level of pheophytin a + b (Figure 4G) and total carotenoids relative to pheophytin a and b, referred to as Cx + c (Figure 4H), in response to salinity stress decreased significantly over time in WT and atnced3, whereas a significant increase in the levels of each was noted 3 h after stress induction in atbzip62.

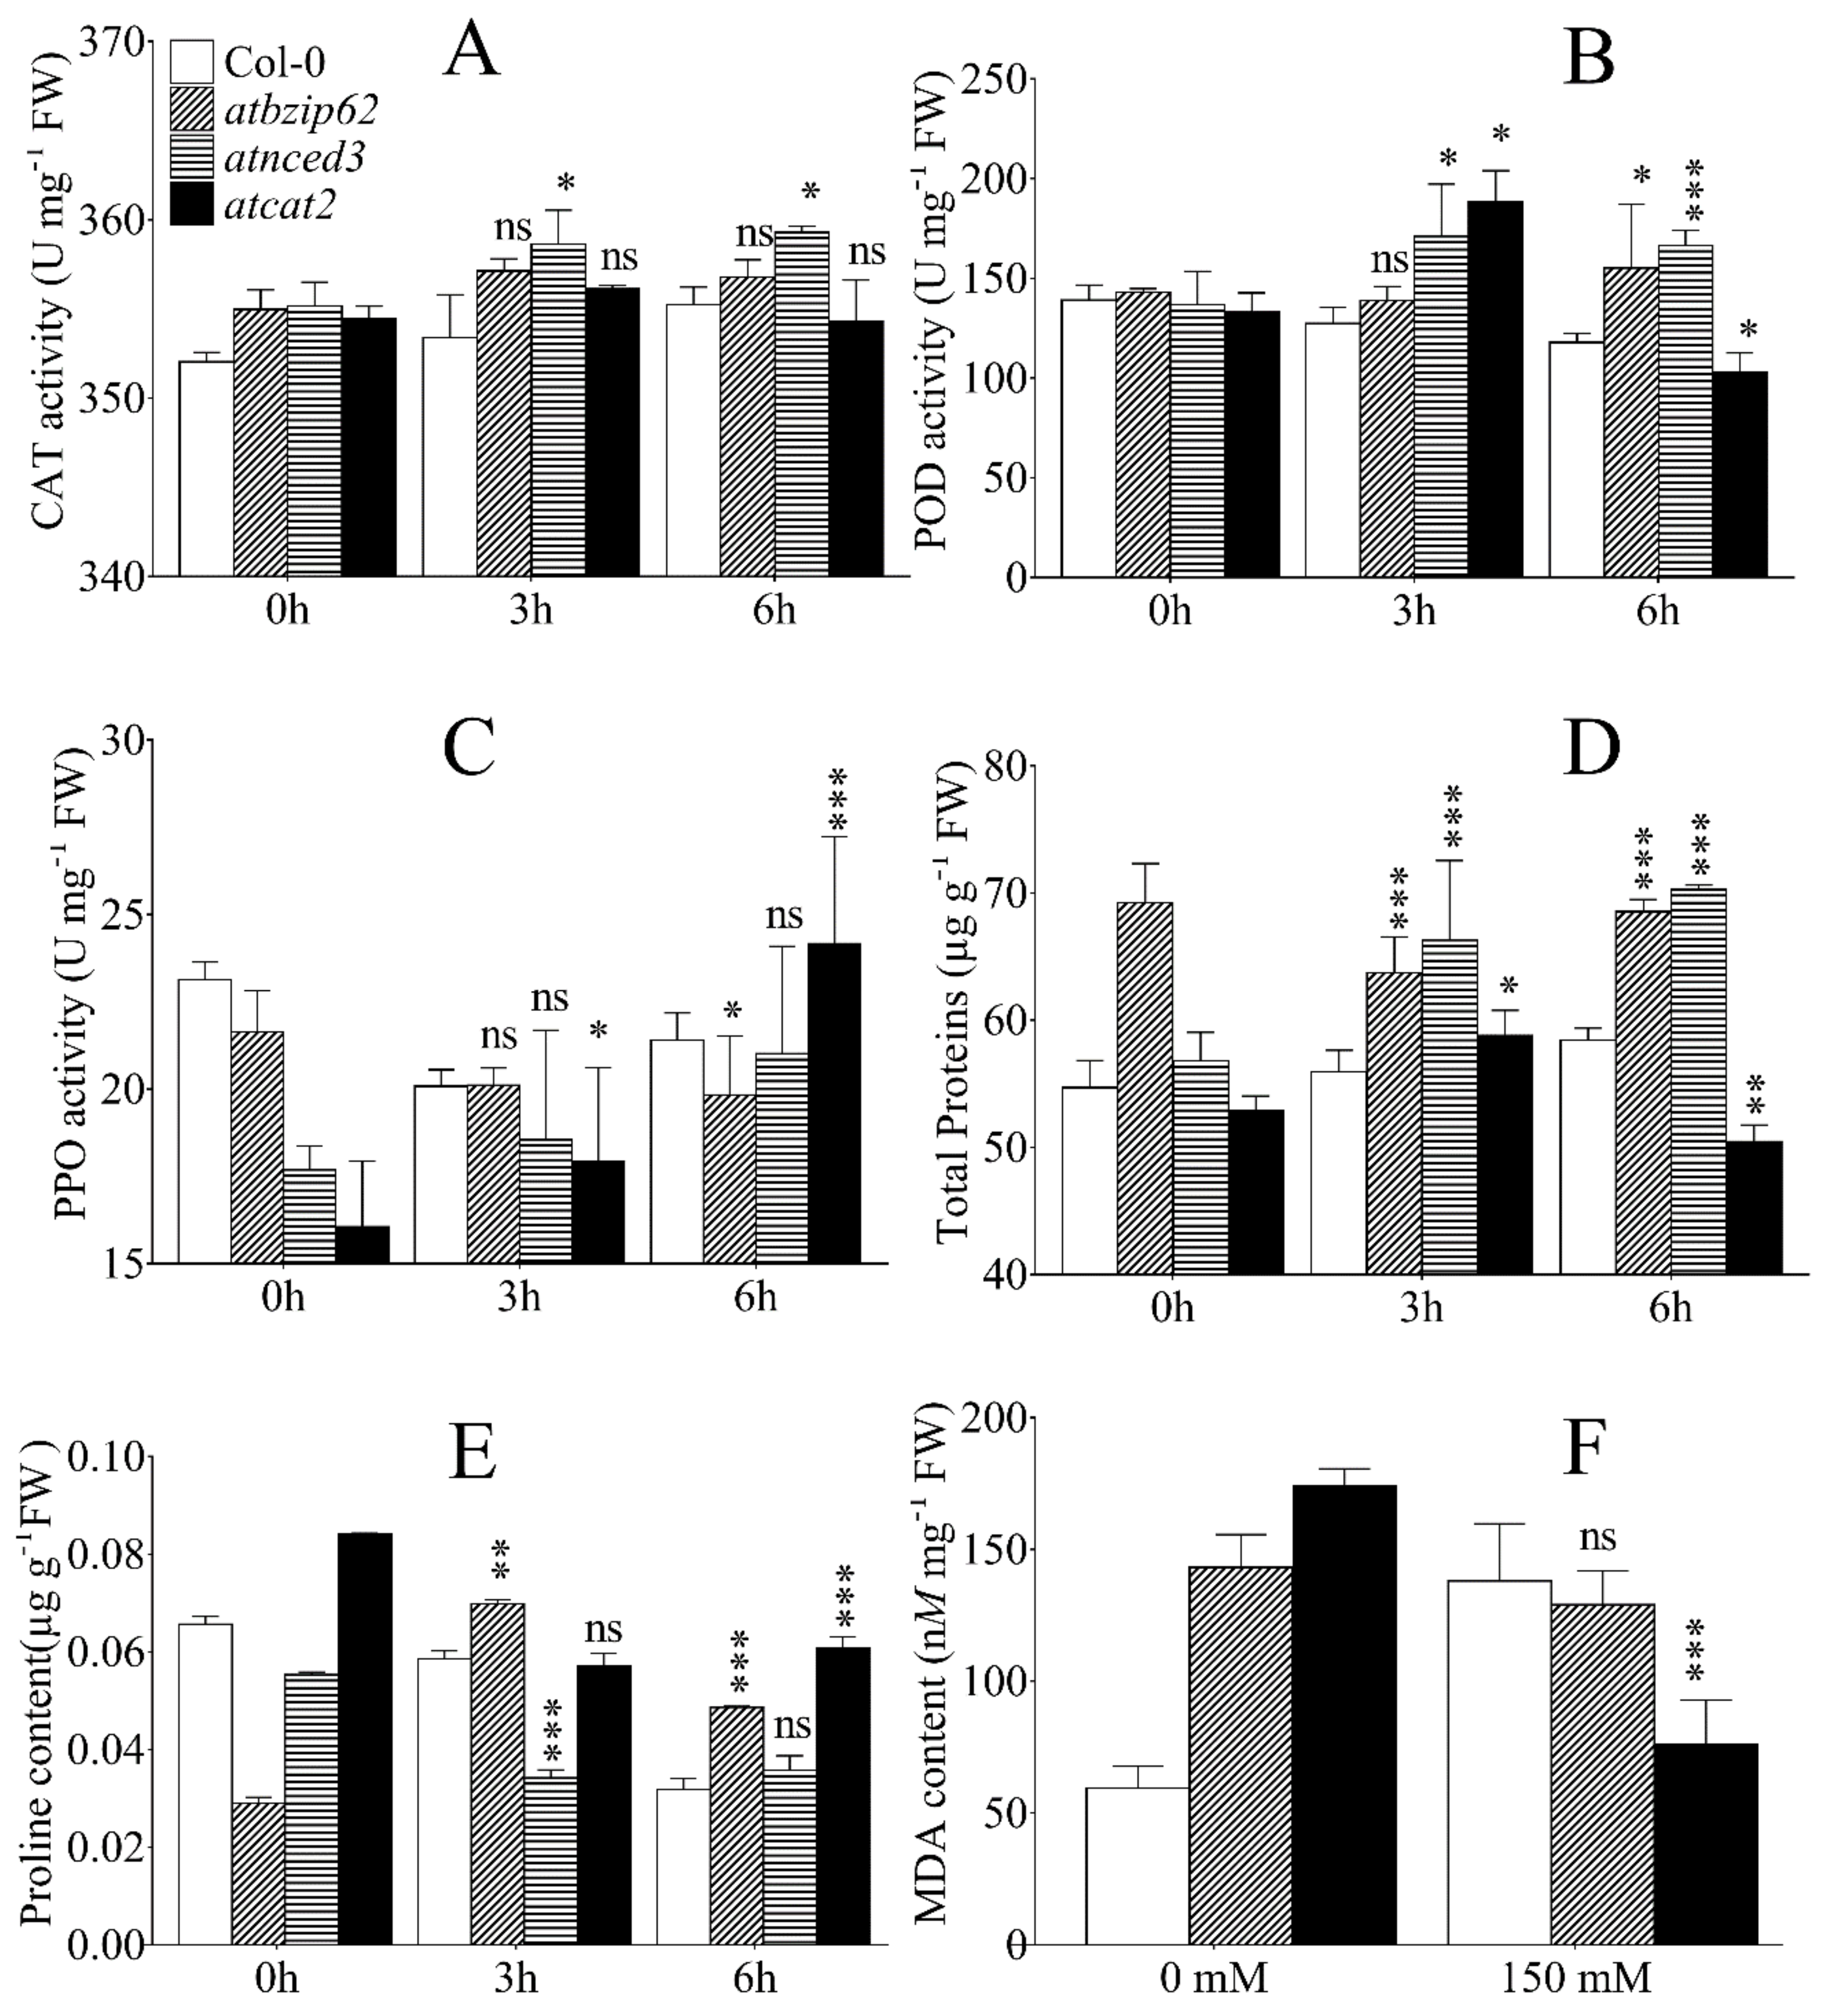
2.8. Detected Antioxidant Enzyme Activity, Proline Accumulation, Change in Protein, and Malondialdehyde (MDA) Content under Salt Stress in Arabidopsis Genotypes

In order to investigate the physiological processes activated during the exposure of Arabidopsis genotypes to salt stress, we measured the activity of antioxidant enzymes and the accumulation of proline. A gradual and persistent increase in catalase (CAT) activity was detected in WT plants from 0 h to 3 h to 6 h of exposure (Figure 5A). CAT activity also increased in atbzip62 at 3 h, but decreased slightly by 6 h. Both atbzip62 and atcat2 exhibited a similar pattern of CAT activity over time. Peroxidase (POD) activity (Figure 5B) decreased over time in WT. A slight increase in POD activity was observed in atbzip62 after 6 h of exposure to salt stress. A significant increase in POD activity was recorded in atnced3 and atcat2 after 3 h of exposure to salt stress, and a decrease was observed at 6 h in atcat2. As for polyphenol oxidase (PPO) activity (Figure 5C), WT and atbzip62 exhibited a decrease at 3 h. At 6 h, PPO activity slightly increase in WT, while slightly decreasing in atbzip62. PPO activity for atnced3 increased over time and atcat2 experienced an exponential increase in PPO from 0 h to 3 h to 6 h after salt stress.
The primary response of plants to abiotic stimuli is a decrease in regular metabolic activities. Consequently, there is a reduction in growth. When a reduction in growth occurs, the synthesis of protein is the most negatively affected anabolic process [46]. Figure 5D shows a significant increase in protein in atbzip62 at 3 and 6 h compared to WT, which shows a similar pattern from 0 h to 3 h to 6 h after NaCl application. A steady increase in protein content was seen in atnced3 over time, whereas atcat2 recorded an increase in proteins at 3 h, but a decrease after 6 h.
Proline, unlike other amino acids, was shown to accumulate in a particular manner in response to abiotic stress, such as drought and salinity. Here, we report that proline content significantly increased in atbzip62 3 h after NaCl application compared to WT and then decreased at 6 h (Figure 5E). In contrast, the level of proline accumulation recorded in atnced3 was significantly lower than that in WT and atbzip62 under the same conditions. However, the atcat2 exposed to salt stress by NaCl recorded a similar proline accumulation pattern to WT at 3 h of exposure and remained at the same level at 6 h.
We further investigated lipid peroxidation and cell membrane degradation by measuring malondialdehyde (MDA) accumulation in plants exposed to salt stress at the rosette stage. The results (Figure 5F) indicate that, upon the exposure of WT, atbzip62, and atnced3 loss-of-function mutants to salt stress induced by 150 mM NaCl, the level of MDA increased significantly in WT compared to non-stressed plants. In contrast, atbzip62 plants exhibited a slight decrease in MDA content and significant decreased in atnced3.

3. Discussion

3.1. AtbZIP62 Regulates SOS Pathway Genes under Salt Stress Conditions

When plants are grown in a saline environment, a high accumulation of Na+ occurs in the cell cytoplasm, which leads to disruption of metabolic processes and growth reduction. The coordination of transport proteins on cellular membranes is of great importance to maintaining a balanced level of cytoplasmic sodium. Some evidence supports the idea that SOS pathway genes SOS1, SOS2, and SOS3 are linked to salt tolerance in Arabidopsis [47]. The activity of SOS1, the plasma membrane Na+/H+ exchanger, was shown to be regulated by SOS2, a protein kinase [48], and SOS3, a calcium-binding protein [34].
SOS pathways genes were proposed to mediate signaling in response to salinity in plants while maintaining ion homeostasis [49,50]. In addition, the SOS regulatory pathway was shown to be the target for Na+/H+ exchange in the tonoplast (vacuolar membrane) of Arabidopsis, which was supported by fluctuations in Na+/H+ exchange activity in the tonoplast of the mutants (sos1, sos2, sos3) compared to the wild type. In the present study, all three Arabidopsis SOS genes were significantly upregulated over time in the atbzip62 loss-of-function mutant and downregulated in the WT. The expression level of SOS1 was significantly higher than that of SOS2 and SOS3. A recent study of the plasma membrane Na+/H+ exchanger reported that the rice SOS1 gene plays a pivotal role in the adaptive response to salt tolerance [51]. It is thought that Arabidopsis SOS1 could play a leading role in modulating ion pumping and exchange within the cell during salt stress events. However, despite being involved in the positive regulation of plant responses to salinity by controlling the Na+/H+ exchange rate, SOS1, SOS2, and SOS3 transcript accumulations were found to be negatively regulated by AtbZIP62 TF per the transcriptional patterns recorded in the atbzip62 loss-of-function mutant exposed to salt stress conditions. This is consistent with a previous report [49], supporting the idea that many genes control the salt tolerance trait in plants as part of a complex regulatory network. Another study [52], focusing on the transcriptional response of the SOS1 gene in Aeluropus littoralis, found that the messenger RNA (mRNA) level of SOS1 increased in response to 200 and 400 mM NaCl. In a similar study by Martínez-Atienza, et al. [53], mutant plants deficient in SOS1, SOS2, or SOS3 shared similar salt-sensitive phenotypes, and their co-expression was shown to improve salt tolerance [31]. Our study suggests that AtbZIP62 could be required for the transcriptional regulation of Arabidopsis SOS signaling pathway genes while modulating the adaptive response to salt tolerance, which includes the regulation of ion exchange, signal perception and transduction, and modulation of assimilation.
Hence, using the expression data, this study proposes a simplified model in Figure 6 illustrating the possible interactions between the AtbZIP62 TF and the SOS pathway genes, which would involve two other AtbZIP TF family members, AtbZIP18 and AtbZIP69, as part of the plant adaptive response to salt tolerance.

3.2. AtbZIP62 Is Involved in the Regulation of Antioxidants Systems and Chloroplast Pigment Accumulation under Salt Stress

Generally, the adaptive response of plants to abiotic stress such as salinity involves the activation of antioxidant systems. This response involves the perception and transduction of signals resulting in the accumulation of enzymes such as CAT, and stress amino acids like proline, among others. Therefore, the recorded CAT activity in all genotypes exposed to high salinity, the differential activity in POD and PPO, and the proline accumulation in the WT compared to atbzip62 loss-of-function mutant indicate that the transcription factor-coding gene AtbZIP62 could play an important role in the regulation of antioxidant systems under salinity stress.
Abiotic stress induces ROS accumulation, leading to oxidative stress, which results in oxidative damage to plants. The persistence of the oxidative stress may cause cell membrane degradation and lipid peroxidation. Our data showed that the WT plants exhibited a significant increase in MDA content under salinity stress. Unexpectedly, MDA accumulation in atbzip62 loss-of-function mutant slightly decreased upon salt stress induction. In general cases, the level of lipid peroxidation is expected to be high over time in sensitive genotypes. In this study, atbzip62 was shown to be a highly sensitive phenotype in response to salt stress 10 days after exposure (Figure 2). We mentioned previously that the expression of AtbZIP62 was downregulated over time in WT exposed to NaCl-induced salt stress. These findings suggest that AtbZIP62 contributes to the maintenance of a balanced cellular redox state, maintaining cell membrane integrity and controlling the level of lipid peroxidation under salinity stress.
Carotenoids are the second most abundant group of pigments in plants [54], found in photosynthetic and non-photosynthetic tissues. Their yellow or orange pigments and, on occasion, red color characterize the carotenoids found in photosynthesizing cells. The data presented in Figure 4 show that, regardless of the difference in the accumulation levels in the tested Arabidopsis genotypes, the pattern of carotenoid content was similar to the pattern of chlorophylls at all time points, thus supporting the suggestion that the color of carotenoids in the cells is masked by chlorophyll, which gives plants their characteristic green color. Furthermore, AtbZIP62 is proposed to play a role in the regulation of chloroplast pigments under salinity stress in Arabidopsis.

4. Materials and Methods

4.1. Plant Materials and Screening for Salt Tolerance of atbzip62 on Gradient NaCl Concentrations

To perform the experiments, we used Arabidopsis Col-0 (wild type), atbzip62, atnced3 (abscisic acid (ABA)-deficient mutant for the possible role of AtbZIP62 in the ABA signaling-mediated salt stress response), and atcat2 (high H2O2-producing mutant lacking the AtCAT2 gene). Seed sterilization followed the protocol described previously [55].
We initially conducted a screening of the atbzip62 loss-of-function mutant exposed to gradient NaCl concentrations on MS medium (50, 100, 150, or 200 mM) in order to identify the adequate concentration for downstream experiments. We tested seed germination capacity on salt-modified media for five days. For each genotype, 30 seeds were sown, 10 per replication. Seedlings were kept on salt medium to assess the growth ability under salinity stress conditions. The ability of Arabidopsis genotypes to survive on NaCl-stressed medium was evaluated 14 days after sowing. The cotyledon development frequency (CDF) was calculated by counting only the developed green seedlings (as some seeds might germinate but do not survive on stress media after long exposure) as described previously Seedlings with green, expanded, and intact cotyledons were counted, and CDF was calculated relative to the total number sown/germinated as described previously [44] and expressed as percentage cotyledon development frequency. On the 10th day of sowing, shoot and root length were measured.

4.2. Arabidopsis Genotypes Growth Conditions and Salt Stress Induction

Well-sterilized seeds were grown under growth chamber conditions (approximately 22 °C and a 16-h/8-h light/dark cycle). Arabidopsis seeds were sown on the surface of a peat moss–soil mixture with perlite and vermiculite in 50-well trays. A preventive antifungal treatment was given, mixed with the peat moss–soil to avoid fungal growth during the experimental period. Water was given via sub-irrigation daily during the first few days after sowing and reduced to twice a week after plants developed their two true leaves to provide adequate moisture for plant maintenance and growth until flowering.
To induce salt stress conditions, at least 30 Arabidopsis plants, 10 per replication, 150 mM NaCl, identified as the appropriate concentration after the screening, was applied at the rosette stage via sub-irrigation. Leaf samples were collected at 0 (plants supplemented with water only), 3, and 6 h (NaCl-treated plants) for gene expression analysis, enzyme activity assays, and chlorophyll, pheophytin, and proline measurement. However, for phenotypic observations, plants were exposed to NaCl-induced salt stress for 10 days, and the response of each genotype was evaluated.

4.3. Total RNA Isolation, Complementary DNA (cDNA) Synthesis, RT-PCR, and Real-time qPCR Analysis

Total RNA was isolated from leaf samples using the TRI-SolutionTM Reagent (Cat. No: TS200-001, Virginia Tech Bio-Technology, Lot: 337871401001) as described by the manufacturer. Thereafter, the complementary DNA (cDNA) was synthesized as described previously [56]. Briefly, 1 µg of RNA was used to synthesize cDNA using BioFACTTM RT-Kit (BioFACTTM, Republic of Korea) according to the manufacturer’s standard protocol. The cDNA was then used as a template in reverse transcription PCR (RT-PCR) or real-time (RT) qPCR (RT qPCR) to study the transcript accumulation of selected genes (Table S1, Supplementary Materials). For RT-PCR, a reaction mixture of 7 µL of 2× F-Star Taq PCR Master mix (BioFACT, Korea) and 10 nM of each RT-PCR forward and reverse primer in a final volume of 25 µL was used. A three-step cycling reaction was performed, including polymerase activation at 95 °C for 2 min, 95 °C strand separation for 20 s, annealing at 56–58 °C for 40 s for 25 cycles, extension at 72 °C for 1 min/kb, and the final extension at 72 °C for 5 min.
For quantitative real-time reverse transcription PCR (qRT-RT-PCR), we prepared a reaction mixture compost of SYBR green (BioFACT, Korea) along with 100 ng of template DNA and 10 nM of each forward and reverse primer in a final volume of 20 µL. A no-template control was used. A two-step reaction including polymerase activation at 95 °C for 15 min, followed by denaturation at 95 °C for 5 s and annealing and extension at 65 °C for 30 s, was performed in a real-time PCR machine (Eco™ Illumina). Total reaction cycles were 40 and the data were normalized with relative expression of Arabidopsis Actin.

4.4. Proline Measurement Assay

Quantification of proline was done using the colorimetric method described previously [57]. Approximately 100 mg of leaves collected from well-watered or NaCl-treated plants of Col-0, atbzip62, atnced3, or atcat2 were homogenized in 3% sulfosalicylic acid (5 µL mg−1 FW) in Eppendorf tubes. The homogenate was centrifuged at room temperature (benchtop centrifuge) at 13,000 rpm for 5 min. Then, 100 µL from the supernatant of plant extract was added to the reaction mixture (100 µL of 3% sulfosalicylic acid, 200 µL glacial acetic acid, 200 µL acidic ninhydrin (1.25 g ninhydrin (1,2,3-indantrione monohydrate)), 30 mL glacial acetic acid, 20 mL of 6 M orthophosphoric acid (H3PO4), dissolved into double distilled water and stored at 4 °C). The mixture was incubated at 96 °C for 1 h and cooled immediately on ice to terminate the reaction. The samples were extracted by adding 1 mL of toluene to the reaction mixture, vortexed for about 20 s, and allowed to rest for 5 min on the bench in order to permit separation of the organic and water phases. Then the chromophore (upper phase colored light red) containing toluene was moved into a fresh cuvette, and the absorbance was read at 520 nm using toluene as a reference. The proline concentration was calculated on the fresh weight basis and expressed in µg g−1 FW.

4.5. CAT, PPO, and POD Activity Assay

The activity of antioxidant enzymes was assayed using the spectrophotometric method as described previously [58]. Briefly, 100 mg of leaves were ground to a fine powder using liquid nitrogen and immediately homogenized in 50 mM phosphate buffer (pH 7.5). The mixture was centrifuged for 10 min at 12,000 rpm at 4 °C after being kept on ice for approximately 10 min. The supernatant was then transferred to fresh 1.5-mL e-tubes. The homogenate was used as a crude enzyme source for CAT, PPO, and POD activities.
CAT activity was assayed as described previously [59]. Briefly, a volume of 50 µL of H2O2 (50 mM) was added to the crude enzyme extract, and the absorbance of the reaction mixture was measured at 240 nm after 1 min. CAT activity was expressed per milligram of the sample’s fresh weight [60].
The spectrophotometric method was also used to estimate PPO and POD activities as described previously [61]. The supernatant obtained after centrifugation was used as a crude enzyme source. For POD, the reaction contained 50 µL of crude extract, 50 µL of pyrogallol, 25 µL of H2O2, and 10 µL of phosphate buffer, and it was incubated for 5 min in dark conditions. Then, 25 µL of H2SO4 was added to the reaction mixture. The absorbance was measured at 420 nm [62]. Calculations were done using the method described previously [63].

4.6. Total Protein Assay

The spectrophotometric Bradford assay [64] was used to estimate the total protein in Arabidopsis leaf extracts exposed to salinity. This method is based on the absorbance shift observed in an acidic solution of dye Coomassie® Brilliant Blue G-250. When added to a solution of protein, the dye binds to the protein resulting in a color change from reddish-brown to blue. The absorbance of the complex protein-dye was measured at 595 nm (vs. the blank) about 5 min after initiation of the reaction [65]. The protein concentration was expressed as µg g−1 FW.

4.7. Lipid Peroxidation Assay

The lipid peroxidation level in the leaf tissue was measured as the MDA content, determined by the thiobarbituric acid (TBA) reaction [66]. About 200 mg of nontreated and treated samples were homogenized in 4 mL of trichloroacetic acid (TCA) (0.1%) with a porcelain mortar and pestle, followed by centrifugation for 15 min at 10,000 rpm. Then, 1 mL of the supernatant was harvested and 2 mL of TCA (20%) containing 0.5% TBA was added. The supernatant was incubated in a preheated water bath at 95 °C for 30 min and cooled immediately on ice. The reaction mixture was centrifuged for 10 min at 10,000 rpm, and the optical density (OD) was measured at 532 nm and 600 nm (OD600 is the nonspecific absorbance that is subtracted from the OD532 reading). MDA level was calculated using Lambert’s equation (extinction coefficient of MDA, 155 nM−1 cm−1).

4.8. Chlorophyll, Pheophytin, and Total Carotenoids Content Measurements

Chlorophylls, pheophytin, and total carotenoids were measured as described previously [67]. Approximately 200 mg of leaf tissue was homogenized with acetone (80%), followed by centrifugation for 10 min at 3000 rpm. The supernatant was transferred to fresh falcon tubes, and centrifugation was repeated until all chlorophyll was harvested in the solvent. The combined supernatant was made to known volume with acetone (80%). The absorbance of the extract was read at 645, 663, and 652 nm for chlorophyll a, b, and total chlorophyll, 480 and 510 nm for total carotenoids, and 665, 653, and 470 nm for pheophytin a, b, and total pheophytins, using acetone as a blank. The OD values at 645, 663, and 652 were used to calculate chlorophyll contents and total carotenoids as described previously [68].

4.9. Statistical Analysis

All experiments were done using a completely randomized design. Experiments were repeated two times. Data were collected in triplicate and analyzed statistically using GraphPad Prism software (Version 7.00, 1992–2016 GraphPad). Analysis of variance for completely randomized design was performed, and the least significant difference was calculated where needed at a significance level of 0.05. Where applicable, at any significant effect, differences between means were evaluated for significance by using the Student’s t-test.

5. Conclusions

The current study investigated the role the Arabidopsis AtbZIP62 encoding a transcription factor in modulating the transcriptional events of the salt overly sensitive pathway genes in response to salt stress. The SOS pathway consist of three important genes SOS1, SOS2, and SOS3. Our results suggested that all three SOS genes, SOS1, 2, and 3, were significantly downregulated by NaCl-induced salt stress in the atbzip62 background, with SOS1 exhibiting the highest expression level. In addition, the transcriptional levels of AtbZIP18 and AtbZIP69, two candidate bZIP TF encoding genes expressed in the atbzip62 background, were significantly induced compared to wild type under the same conditions. Furthermore, the observed phenotypic response of atbzip62 revealed an enhanced sensitivity toward salt stress, followed by an increase in the chlorophyll, pheophytin, and carotenoids contents, the activation of catalase activity, and the accumulation of malondialdehyde and proline. Therefore, this study suggests that AtbZIP62 negatively regulates the transcript accumulation of SOS signaling pathway genes, SOS1, SOS2, and SOS3, as well as AtbZIP18 and AtbZIP69 in Arabidopsis thaliana, while maintaining a balanced redox state under salt stress conditions.

Supplementary Materials

Supplementary materials can be found at https://0-www-mdpi-com.brum.beds.ac.uk/1422-0067/21/5/1726/s1.

Author Contributions

Conceptualization, methodology, and validation, B.-W.Y.; formal analysis, investigation, data curation, and writing—original draft preparation, N.K.R.; writing—review and editing, Q.M.I.; visualization and supervision, B.-W.Y. and I.-J.L.; funding acquisition, B.-W.Y. All authors have read and agreed to the published version of the manuscript.

Funding

This work was supported by a grant from the Next-Generation BioGreen 21 Program (SSAC, Grant No. PJ01342501), Rural Development Administration, Republic of Korea.

Conflicts of Interest

The authors declare no conflicts of interest.

References

  1. Butcher, K.; Wick, A.F.; DeSutter, T.; Chatterjee, A.; Harmon, J. Soil salinity: A threat to global food security. Agron. J. 2016, 108, 2189–2200. [Google Scholar] [CrossRef]
  2. Shrivastava, P.; Kumar, R. Soil salinity: A serious environmental issue and plant growth promoting bacteria as one of the tools for its alleviation. Saudi J. Biol. Sci. 2015, 22, 123–131. [Google Scholar] [CrossRef] [PubMed] [Green Version]
  3. Reddy, I.N.B.L.; Kim, B.-K.; Yoon, I.-S.; Kim, K.-H.; Kwon, T.-R. Salt tolerance in rice: Focus on mechanisms and approaches. Rice Sci. 2017, 24, 123–144. [Google Scholar] [CrossRef]
  4. Hussain, S.; Shaukat, M.; Ashraf, M.; Zhu, C.; Jin, Q.; Zhang, J. Salinity stress in arid and semi-arid climates: Effects and management in field crops. In Climate Change and Agriculture; IntechOpen: London, UK, 2019. [Google Scholar]
  5. Isayenkov, S.V.; Maathuis, F.J. Plant Salinity Stress: Many Unanswered Questions Remain. Front. Plant Sci. 2019, 10, 80. [Google Scholar] [CrossRef] [PubMed] [Green Version]
  6. Rasool, S.; Hameed, A.; Azooz, M.; Siddiqi, T.; Ahmad, P. Salt stress: causes, types and responses of plants. In Ecophysiology and Responses of Plants under Salt Stress; Springer Nature Switzerland AG: Basel, Switzerland, 2013; pp. 1–24. [Google Scholar]
  7. Chandna, R.; Azooz, M.; Ahmad, P. Recent advances of metabolomics to reveal plant response during salt stress. In Salt Stress in Plants; Springer: New York, NY, USA, 2013; pp. 1–14. [Google Scholar]
  8. Wang, X.; Gao, B.; Liu, X.; Dong, X.; Zhang, Z.; Fan, H.; Zhang, L.; Wang, J.; Shi, S.; Tu, P. Salinity stress induces the production of 2-(2-phenylethyl) chromones and regulates novel classes of responsive genes involved in signal transduction in Aquilaria sinensis calli. BMC Plant Biol. 2016, 16, 119. [Google Scholar] [CrossRef] [Green Version]
  9. Tuteja, N.; Sopory, S.K. Chemical signaling under abiotic stress environment in plants. Plant Signal. Behav. 2008, 3, 525–536. [Google Scholar] [CrossRef] [Green Version]
  10. Manishankar, P.; Wang, N.; Köster, P.; Alatar, A.A.; Kudla, J. Calcium signaling during salt stress and in the regulation of ion homeostasis. J. Exp. Bot. 2018, 69, 4215–4226. [Google Scholar] [CrossRef] [Green Version]
  11. Quintero, F.J.; Ohta, M.; Shi, H.; Zhu, J.-K.; Pardo, J.M. Reconstitution in yeast of the Arabidopsis SOS signaling pathway for Na+ homeostasis. Proc. Natl. Acad. Sci. USA 2002, 99, 9061–9066. [Google Scholar] [CrossRef] [Green Version]
  12. Ji, H.; Pardo, J.M.; Batelli, G.; Van Oosten, M.J.; Bressan, R.A.; Li, X. The Salt Overly Sensitive (SOS) pathway: established and emerging roles. Mol. Plant 2013, 6, 275–286. [Google Scholar] [CrossRef] [Green Version]
  13. Leonard, R.T.; Hepler, R.K. Calcium in Plant Growth and Development: Proceedings, 13th Annual Riverside Symposium in Plant Physiology, January 11–13, 1990, Department of Botany and Plant Sciences, University of California, Riverside; American Society of Plant Physiologists: Rockville, MD, USA, 1990. [Google Scholar]
  14. Isayenkov, S. Physiological and molecular aspects of salt stress in plants. Cytol. Genet. 2012, 46, 302–318. [Google Scholar] [CrossRef] [Green Version]
  15. Camejo, D.; del Carmen Romero-Puertas, M.; Rodríguez-Serrano, M.; Sandalio, L.M.; Lázaro, J.J.; Jiménez, A.; Sevilla, F. Salinity-induced changes in S-nitrosylation of pea mitochondrial proteins. J. Proteom. 2013, 79, 87–99. [Google Scholar] [CrossRef] [PubMed]
  16. AbdElgawad, H.; Zinta, G.; Hegab, M.M.; Pandey, R.; Asard, H.; Abuelsoud, W. High salinity induces different oxidative stress and antioxidant responses in maize seedlings organs. Front. Plant Sci. 2016, 7, 276. [Google Scholar] [CrossRef] [PubMed] [Green Version]
  17. El-baky, A.; Hanaa, H.; Amal, A.; Hussein, M. Influence of salinity on lipid peroxidation, antioxidant enzymes and electrophoretic patterns of protein and isoenzymes in leaves of some onion cultivars. Asian J. Plant Sci. 2003, 2, 633–638. [Google Scholar]
  18. Jin, X.; Liu, T.; Xu, J.; Gao, Z.; Hu, X. Exogenous GABA enhances muskmelon tolerance to salinity-alkalinity stress by regulating redox balance and chlorophyll biosynthesis. BMC Plant Biol. 2019, 19, 48. [Google Scholar] [CrossRef]
  19. Borzouei, A.; Kafi, M.; Akbari-Ghogdi, E.; Mousavi-Shalmani, M. Long term salinity stress in relation to lipid peroxidation, super oxide dismutase activity and proline content of salt-sensitive and salt-tolerant wheat cultivars. Chil. J. Agric. Res. 2012, 72, 476. [Google Scholar] [CrossRef]
  20. Esfandiari, E.; Shekari, F.; Shekari, F.; Esfandiari, M. The effect of salt stress on antioxidant enzymes’activity and lipid peroxidation on the wheat seedling. Not. Bot. Horti Agrobot. Cluj-Napoca 2007, 35, 48. [Google Scholar]
  21. Cha-Um, S.; Kirdmanee, C. Effect of salt stress on proline accumulation, photosynthetic ability and growth characters in two maize cultivars. Pak. J. Bot 2009, 41, 87–98. [Google Scholar]
  22. Malecka, A.; Jarmuszkiewicz, W.A.; Tomaszewska, B. Antioxidative defense to lead stress in subcellular compartments of pea root cells. Acta Bioquim. Pol. 2001, 48, 687–698. [Google Scholar] [CrossRef]
  23. Gonzalez, D.H. Plant Transcription Factors: Evolutionary, Structural and Functional Aspects; Academic Press: London, UK, 2015. [Google Scholar]
  24. Julkowska, M.M.; Testerink, C. Tuning plant signaling and growth to survive salt. Trends Plant Sci. 2015, 20, 586–594. [Google Scholar] [CrossRef]
  25. Dinneny, J.R. Traversing organizational scales in plant salt-stress responses. Curr. Opin. Plant Biol. 2015, 23, 70–75. [Google Scholar] [CrossRef]
  26. Zhu, J.K.; Liu, J.P.; Xiong, L.M. Genetic analysis of salt tolerance in Arabidopsis: Evidence for a critical role of potassium nutrition. Plant Cell 1998, 10, 1181–1191. [Google Scholar] [CrossRef] [PubMed] [Green Version]
  27. Carillo, P.; Annunziata, M.G.; Pontecorvo, G.; Fuggi, A.; Woodrow, P. Salinity stress and salt tolerance. Abiotic Stress Plants–Mech. Adapt. 2011, 1, 21–38. [Google Scholar]
  28. Pardo, J.; Quintero, F. Conservation of the salt overly sensitive pathway in rice. Plant Physiol. 2007, 143, 1001–1012. [Google Scholar]
  29. Shi, H.; Ishitani, M.; Kim, C.; Zhu, J.-K. The Arabidopsis thaliana salt tolerance gene SOS1 encodes a putative Na+/H+ antiporter. Proc. Natl. Acad. Sci. USA 2000, 97, 6896–6901. [Google Scholar] [CrossRef] [PubMed] [Green Version]
  30. Liu, J.; Ishitani, M.; Halfter, U.; Kim, C.-S.; Zhu, J.-K. The Arabidopsis thaliana SOS2 gene encodes a protein kinase that is required for salt tolerance. Proc. Natl. Acad. Sci. USA 2000, 97, 3730–3734. [Google Scholar] [CrossRef] [PubMed]
  31. Ma, D.-M.; Xu, W.-R.; Li, H.-W.; Jin, F.-X.; Guo, L.-N.; Wang, J.; Dai, H.-J.; Xu, X. Co-expression of the Arabidopsis SOS genes enhances salt tolerance in transgenic tall fescue (Festuca arundinacea Schreb.). Protoplasma 2014, 251, 219–231. [Google Scholar] [CrossRef] [Green Version]
  32. Zhou, H.; Lin, H.; Chen, S.; Becker, K.; Yang, Y.; Zhao, J.; Kudla, J.; Schumaker, K.S.; Guo, Y. Inhibition of the Arabidopsis salt overly sensitive pathway by 14-3-3 proteins. Plant Cell 2014, 26, 1166–1182. [Google Scholar] [CrossRef] [Green Version]
  33. Zhu, J.-K. Plant salt tolerance. Trends Plant Sci. 2001, 6, 66–71. [Google Scholar] [CrossRef]
  34. Qiu, Q.-S.; Guo, Y.; Quintero, F.J.; Pardo, J.M.; Schumaker, K.S.; Zhu, J.-K. Regulation of vacuolar Na+/H+ exchange in Arabidopsis thaliana by the salt-overly-sensitive (SOS) pathway. J. Biol. Chem. 2004, 279, 207–215. [Google Scholar] [CrossRef] [Green Version]
  35. Cargnello, M.; Roux, P.P. Activation and function of the MAPKs and their substrates, the MAPK-activated protein kinases. Microbiol. Mol. Biol. Rev. 2011, 75, 50–83. [Google Scholar] [CrossRef] [Green Version]
  36. Venema, K.; Quintero, F.J.; Pardo, J.M.; Donaire, J.P. The Arabidopsis Na+/H+ exchanger AtNHX1 catalyzes low affinity Na+ and K+ transport in reconstituted liposomes. J. Biol. Chem. 2002, 277, 2413–2418. [Google Scholar] [CrossRef] [PubMed] [Green Version]
  37. Liu, C.; Mao, B.; Ou, S.; Wang, W.; Liu, L.; Wu, Y.; Chu, C.; Wang, X. OsbZIP71, a bZIP transcription factor, confers salinity and drought tolerance in rice. Plant Mol. Biol. 2014, 84, 19–36. [Google Scholar] [CrossRef]
  38. Das, P.; Lakra, N.; Nutan, K.K.; Singla-Pareek, S.L.; Pareek, A. A unique bZIP transcription factor imparting multiple stress tolerance in Rice. Rice 2019, 12, 58. [Google Scholar] [CrossRef] [PubMed] [Green Version]
  39. Zhu, M.; Meng, X.; Cai, J.; Li, G.; Dong, T.; Li, Z. Basic leucine zipper transcription factor SlbZIP1 mediates salt and drought stress tolerance in tomato. BMC Plant Biol. 2018, 18, 83. [Google Scholar] [CrossRef] [PubMed] [Green Version]
  40. Liang, C.; Meng, Z.; Meng, Z.; Malik, W.; Yan, R.; Lwin, K.M.; Lin, F.; Wang, Y.; Sun, G.; Zhou, T. GhABF2, a bZIP transcription factor, confers drought and salinity tolerance in cotton (Gossypium hirsutum L.). Sci. Rep. 2016, 6, 35040. [Google Scholar] [CrossRef] [PubMed] [Green Version]
  41. Hu, Y.Q.; Liu, S.; Yuan, H.M.; Li, J.; Yan, D.W.; Zhang, J.F.; Lu, Y.T. Functional comparison of catalase genes in the elimination of photorespiratory H2O2 using promoter- and 3’-untranslated region exchange experiments in the Arabidopsis cat2 photorespiratory mutant. Plant Cell Env. 2010, 33, 1656–1670. [Google Scholar] [CrossRef]
  42. Tan, B.C.; Schwartz, S.H.; Zeevaart, J.A.; McCarty, D.R. Genetic control of abscisic acid biosynthesis in maize. Proc. Natl. Acad. Sci. USA 1997, 94, 12235–12240. [Google Scholar] [CrossRef] [Green Version]
  43. Yun, B.-W.; Feechan, A.; Yin, M.; Saidi, N.B.B.; Le Bihan, T.; Yu, M.; Moore, J.W.; Kang, J.-G.; Kwon, E.; Spoel, S.H.; et al. S-nitrosylation of NADPH oxidase regulates cell death in plant immunity. Nature 2011, 478, 264–268. [Google Scholar] [CrossRef]
  44. Imran, Q.M.; Hussain, A.; Lee, S.-U.; Mun, B.-G.; Falak, N.; Loake, G.J.; Yun, B.-W. Transcriptome profile of NO-induced Arabidopsis transcription factor genes suggests their putative regulatory role in multiple biological processes. Sci. Rep. 2018, 8, 771. [Google Scholar] [CrossRef]
  45. Liu, W.Y.; Wang, M.M.; Huang, J.; Tang, H.J.; Lan, H.X.; Zhang, H.S. The OsDHODH1 gene is involved in salt and drought tolerance in rice. J. Integr. Plant Biol. 2009, 51, 825–833. [Google Scholar] [CrossRef]
  46. Bohnert, H.J.; Jensen, R.G. Metabolic engineering for increased salt tolerance–the next step. Funct. Plant Biol. 1996, 23, 661–667. [Google Scholar] [CrossRef]
  47. Guo, Y.; Halfter, U.; Ishitani, M.; Zhu, J.-K. Molecular characterization of functional domains in the protein kinase SOS2 that is required for plant salt tolerance. Plant Cell 2001, 13, 1383–1400. [Google Scholar] [CrossRef] [PubMed] [Green Version]
  48. Cheng, N.-H.; Pittman, J.K.; Zhu, J.-K.; Hirschi, K.D. The protein kinase SOS2 activates the Arabidopsis H+/Ca2+ antiporter CAX1 to integrate calcium transport and salt tolerance. J. Biol. Chem. 2004, 279, 2922–2926. [Google Scholar] [CrossRef] [Green Version]
  49. Munns, R.; Tester, M. Mechanisms of salinity tolerance. Annu. Rev. Plant Biol. 2008, 59, 651–681. [Google Scholar] [CrossRef] [PubMed] [Green Version]
  50. Oh, D.H.; Gong, Q.; Ulanov, A.; Zhang, Q.; Li, Y.; Ma, W.; Yun, D.J.; Bressan, R.A.; Bohnert, H.J. Sodium stress in the halophyte Thellungiella halophila and transcriptional changes in a thsos1-RNA interference line. J. Integr. Plant Biol. 2007, 49, 1484–1496. [Google Scholar] [CrossRef]
  51. El Mahi, H.; Pérez-Hormaeche, J.; De Luca, A.; Villalta, I.; Espartero, J.; Gámez-Arjona, F.; Fernández, J.L.; Bundó, M.; Mendoza, I.; Mieulet, D. A critical role of sodium flux via the plasma Membrane Na+/H+ exchanger SOS1 in the salt tolerance of rice. Plant Physiol. 2019, 180, 1046–1065. [Google Scholar] [CrossRef] [PubMed] [Green Version]
  52. Moshaei, M.R.; Nematzadeh, G.A.; Askari, H.; Nejad, A.S.M. Quantitative gene expression analysis of some sodium ion transporters under salinity stress in Aeluropus littoralis. Saudi J. Biol. Sci. 2014, 21, 394–399. [Google Scholar] [CrossRef] [Green Version]
  53. Martínez-Atienza, J.; Jiang, X.; Garciadeblas, B.; Mendoza, I.; Zhu, J.-K.; Pardo, J.M.; Quintero, F.J. Conservation of the salt overly sensitive pathway in rice. Plant Physiol. 2007, 143, 1001–1012. [Google Scholar] [CrossRef] [Green Version]
  54. Roger, M.J.R. Handbook of Plant Ecophysiology Techniques; Reigosa Roger, M.J., Ed.; Springer: Dordrecht, Netherlands, 2001. [Google Scholar]
  55. Rivero-Lepinckas, L.; Crist, D.; Scholl, R. Growth of plants and preservation of seeds. In Arabidopsis Protocols; Humana Press: Totowa, NJ, USA, 2006; pp. 3–12. [Google Scholar]
  56. Mun, B.-G.; Lee, S.-U.; Hussain, A.; Kim, H.-H.; Rolly, N.K.; Jung, K.-H.; Yun, B.-W. S-nitrosocysteine-responsive genes modulate diverse regulatory pathways in Oryza sativa: A transcriptome profiling study. Funct. Plant Biol. 2018, 45, 630–644. [Google Scholar] [CrossRef]
  57. Ábrahám, E.; Hourton-Cabassa, C.; Erdei, L.; Szabados, L. Methods for determination of proline in plants. In Plant Stress Tolerance; Humana Press: Totowa, NJ, USA, 2010; pp. 317–331. [Google Scholar]
  58. Elavarthi, S.; Martin, B. Spectrophotometric assays for antioxidant enzymes in plants. In Plant Stress Tolerance; Humana Press: Totowa, NJ, USA, 2010; pp. 273–280. [Google Scholar]
  59. Rolly, N.K.; Lee, S.-U.; Imran, Q.M.; Hussain, A.; Mun, B.-G.; Kim, K.-M.; Yun, B.-W. Nitrosative stress-mediated inhibition of OsDHODH1 gene expression suggests roots growth reduction in rice (Oryza sativa L.). 3 Biotech 2019, 9, 273. [Google Scholar] [CrossRef]
  60. Aebi, H. [13] Catalase in vitro. In Methods in Enzymology; Academic Press: London, UK, 1984; Volume 105, pp. 121–126. [Google Scholar]
  61. Khan, A.R.; Ullah, I.; Waqas, M.; Park, G.-S.; Khan, A.L.; Hong, S.-J.; Ullah, R.; Jung, B.K.; Park, C.E.; Ur-Rehman, S. Host plant growth promotion and cadmium detoxification in Solanum nigrum, mediated by endophytic fungi. Ecotoxicol. Env. Saf. 2017, 136, 180–188. [Google Scholar] [CrossRef] [PubMed]
  62. Shannon, L.M.; Kay, E.; Lew, J.Y. Peroxidase isozymes from horseradish roots I. Isolation and physical properties. J. Biol. Chem. 1966, 241, 2166–2172. [Google Scholar] [PubMed]
  63. Chance, B.; Maehly, A.C. [136] Assay of Catalase and Peroxidase. In Methods in Enzymology; Elsevier: Amsterdam, Netherlands, 1995; Volume 2, pp. 764–775. [Google Scholar]
  64. Bradford, M.M. A rapid and sensitive method for the quantitation of microgram quantities of protein utilizing the principle of protein-dye binding. Anal. Biochem. 1976, 72, 248–254. [Google Scholar] [CrossRef]
  65. Bonjoch, N.P.; Tamayo, P.R. Protein content quantification by Bradford method. In Handbook of Plant Ecophysiology Techniques; Springer: Dordrecht, Netherlands, 2001; pp. 283–295. [Google Scholar]
  66. Jambunathan, N. Determination and detection of reactive oxygen species (ROS), lipid peroxidation, and electrolyte leakage in plants. In Plant Stress Tolerance; Humana Press: Totowa, NJ, USA, 2010; pp. 291–297. [Google Scholar]
  67. Lichtenthaler, H.K. [34] Chlorophylls and carotenoids: pigments of photosynthetic biomembranes. In Methods in Enzymology; Elsevier: Amsterdam, The Netherlands, 1987; Volume 148, pp. 350–382. [Google Scholar]
  68. Sumanta, N.; Haque, C.I.; Nishika, J.; Suprakash, R. Spectrophotometric analysis of chlorophylls and carotenoids from commonly grown fern species by using various extracting solvents. Res. J. Chem. Sci. Issn 2014, 2231, 606X. [Google Scholar]
Figure 1. Growth of Arabidopsis mutant lines on gradient NaCl concentrations. Four Arabidopsis genotypes, the Col-0 wild type, the atbzip62, atnced3, and atcat2 loss-of-function mutants were exposed to salt stress induced by gradient NaCl concentrations. The survival of all genotypes was recorded as a percentage of seedlings having green cotyledons over the total number of seeds germinated (referred to as cotyledon development frequency or CDF) on half-strength MS medium for two weeks. Data points are the mean values of triplicate assays while bars indicate ±SD. The statistical significance level is indicated by asterisks on top of each bar. *** p < 0.05 compared to the wild type; ns, non-significant.
Ijms 21 01726 g001
Figure 2. Phenotypic response of Arabidopsis genotypes to salt stress at the rosette stage 10 days after NaCl treatment. The left panel shows plants and detached leaves grown under normal conditions (no salt treatment), whereas the right panel shows plants subjected to salt stress conditions (150 mM). Pictures were taken 10 days after salt stress induction. Adobe Photoshop CS6 was used to remove the background for better display and visualization.
Ijms 21 01726 g002
Figure 3. Transcripts accumulation of AtbZIP transcription factors (TFs) encoding genes, AtPYD1, SOS, and glutamate synthase under salt stress. (A) AtPYD1 expression in response to salt stress (150 mM) for 3 to 6 h in Col-0 wild type, atbzip62 loss-of-function mutant, and atcat2. (B) AtbZIP62 transcript accumulation in Col-0, atbzip62 loss-of-function mutant, and atcat2. (C) Expression pattern of AtbZIP18 over time. (D) Expression pattern of AtbZIP69 over time. (E) Expression of SOS1 in Col-0 wild type and atbzip62 loss-of-function mutant over time. (F) Transcriptional level of SOS2, (G) SOS3, (H) AtGLS1, and (I) AtGLS2 overtime at the rosette stage in Col-0 and atbzip62. All the data points are the mean of triplicate assays, while error bars represent ± SD. Statistical significance is indicated by asterisks on top of bars. ** p < 0.01; *** p < 0.001 compared to wild type; ns, non-significant.
Ijms 21 01726 g003
Figure 4. Pattern of chloroplast pigment content under salt stress. (A) Chlorophyll a content. (B) Chlorophyll b content. (C) Chlorophyll a + b content. (D) Total carotenoids. (E) Pheophytin a content. (F) Pheophytin b content. (G) Pheophytin a + b content. (H) Total carotenoids relative to pheophytin a and b (Cx + c). The first set of three bars in each panel represents time 0 h (no salt stress), the second set of three bars represents enzyme activity at 3 h post-stress induction, and the third set of three bars represents enzyme activity at 6 h post-stress induction. All the data points are the mean of triplicate assays, while error bar represents ± SD. The asterisks on top of bars are statistical significance level with 95% confidence level. * p < 0.05; *** p < 0.001 compared to wild type; ns, non-significant.
Ijms 21 01726 g004
Figure 5. Antioxidant enzyme activity in response to 150 mM NaCl in Arabidopsis genotypes (Col-0 wild type, atbzip62, atnced3, and atcat2 mutants) subjected to salt stress conditions at the rosette stage. (A) Catalase (CAT) activity. (B) Peroxidase (POD) activity. (C) Polyphenol oxidase (PPO) activity. (D) Change in total protein content. (E) Change in proline content. Data in A–E were collected 3 h and 6 h after stress. (F) Malondialdehyde (MDA) content as a measure of lipid peroxidation for Col-0 wild type, atbzip62, and atnced3 exposed to no salt or to 150 mM NaCl. The data points are mean values of triplicate assays, while error bars indicate ±SD. * p < 0.05; ** p < 0.01; *** p < 0.001; ns, non-significant.
Ijms 21 01726 g005
Figure 6. Simplified model of the transcriptional regulation of three salt overly sensitive (SOS) pathway genes in response to salinity in Arabidopsis. AtbZIP62 is shown to control the expression of SOS genes in Arabidopsis plants exposed to salt stress. The loss-of-function mutant atbzip62 significantly upregulates SOS genes. AtbZIP18 and AtbZIP69 are genes coding bZIP transcription factors proposed to have an interplay with the AtbZIP62 under abiotic stress conditions. Upon salt stress perception, plants activate various metabolic and physiological processes, which include the induction of signaling components that interact with each other to provide the proper response to stress tolerance. During this event, plants redirect their resources and allocate them to protect against the stress, affecting their growth and development. ROS, reactive oxygen species. NO, nitric oxide.
Ijms 21 01726 g006

