Malignancy Grade-Dependent Mapping of Metabolic Landscapes in Human Urothelial Bladder Cancer: Identification of Novel, Diagnostic, and Druggable Biomarkers

 , , and
Abstract
:1. Introduction
2. Results
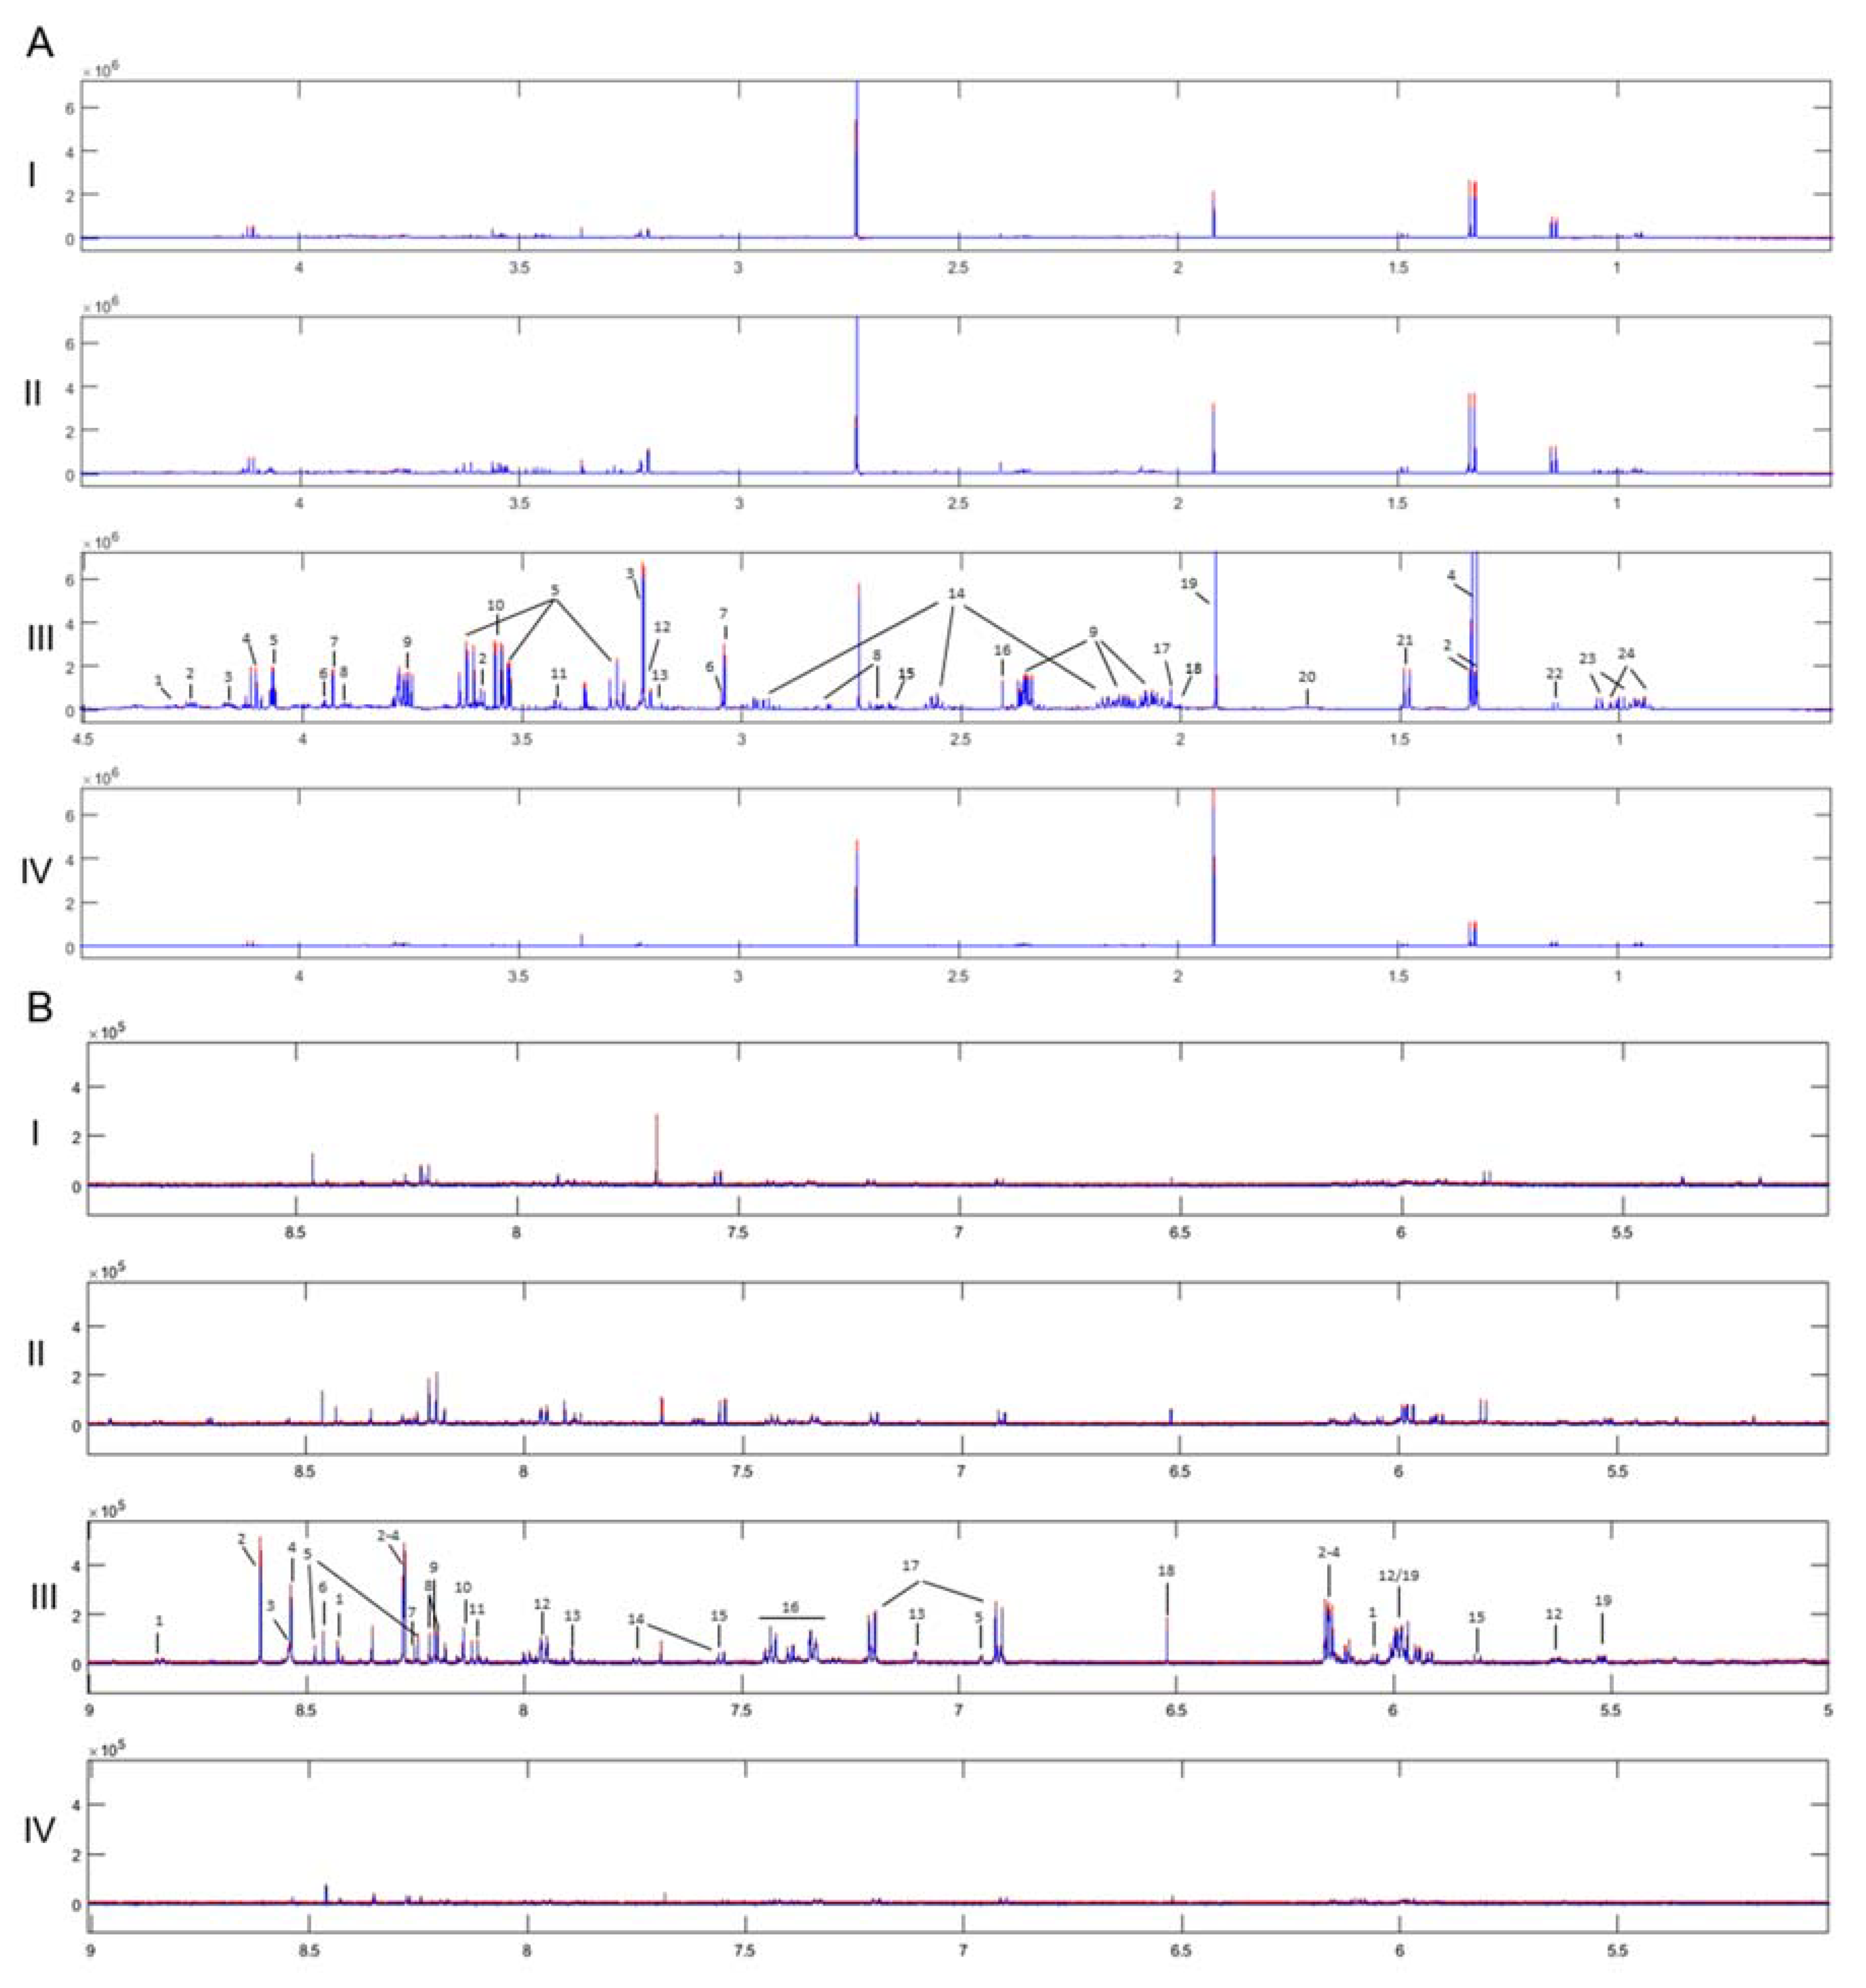
2.1. NMR Analysis
2.2. MS Analysis
3. Discussion
4. Materials and Methods
4.1. Chemicals and Reagents
4.2. Cell Lines and Culture Conditions
4.3. Cell Collection and Storage
4.4. Metabolomics Experiments
4.5. Data Preprocessing
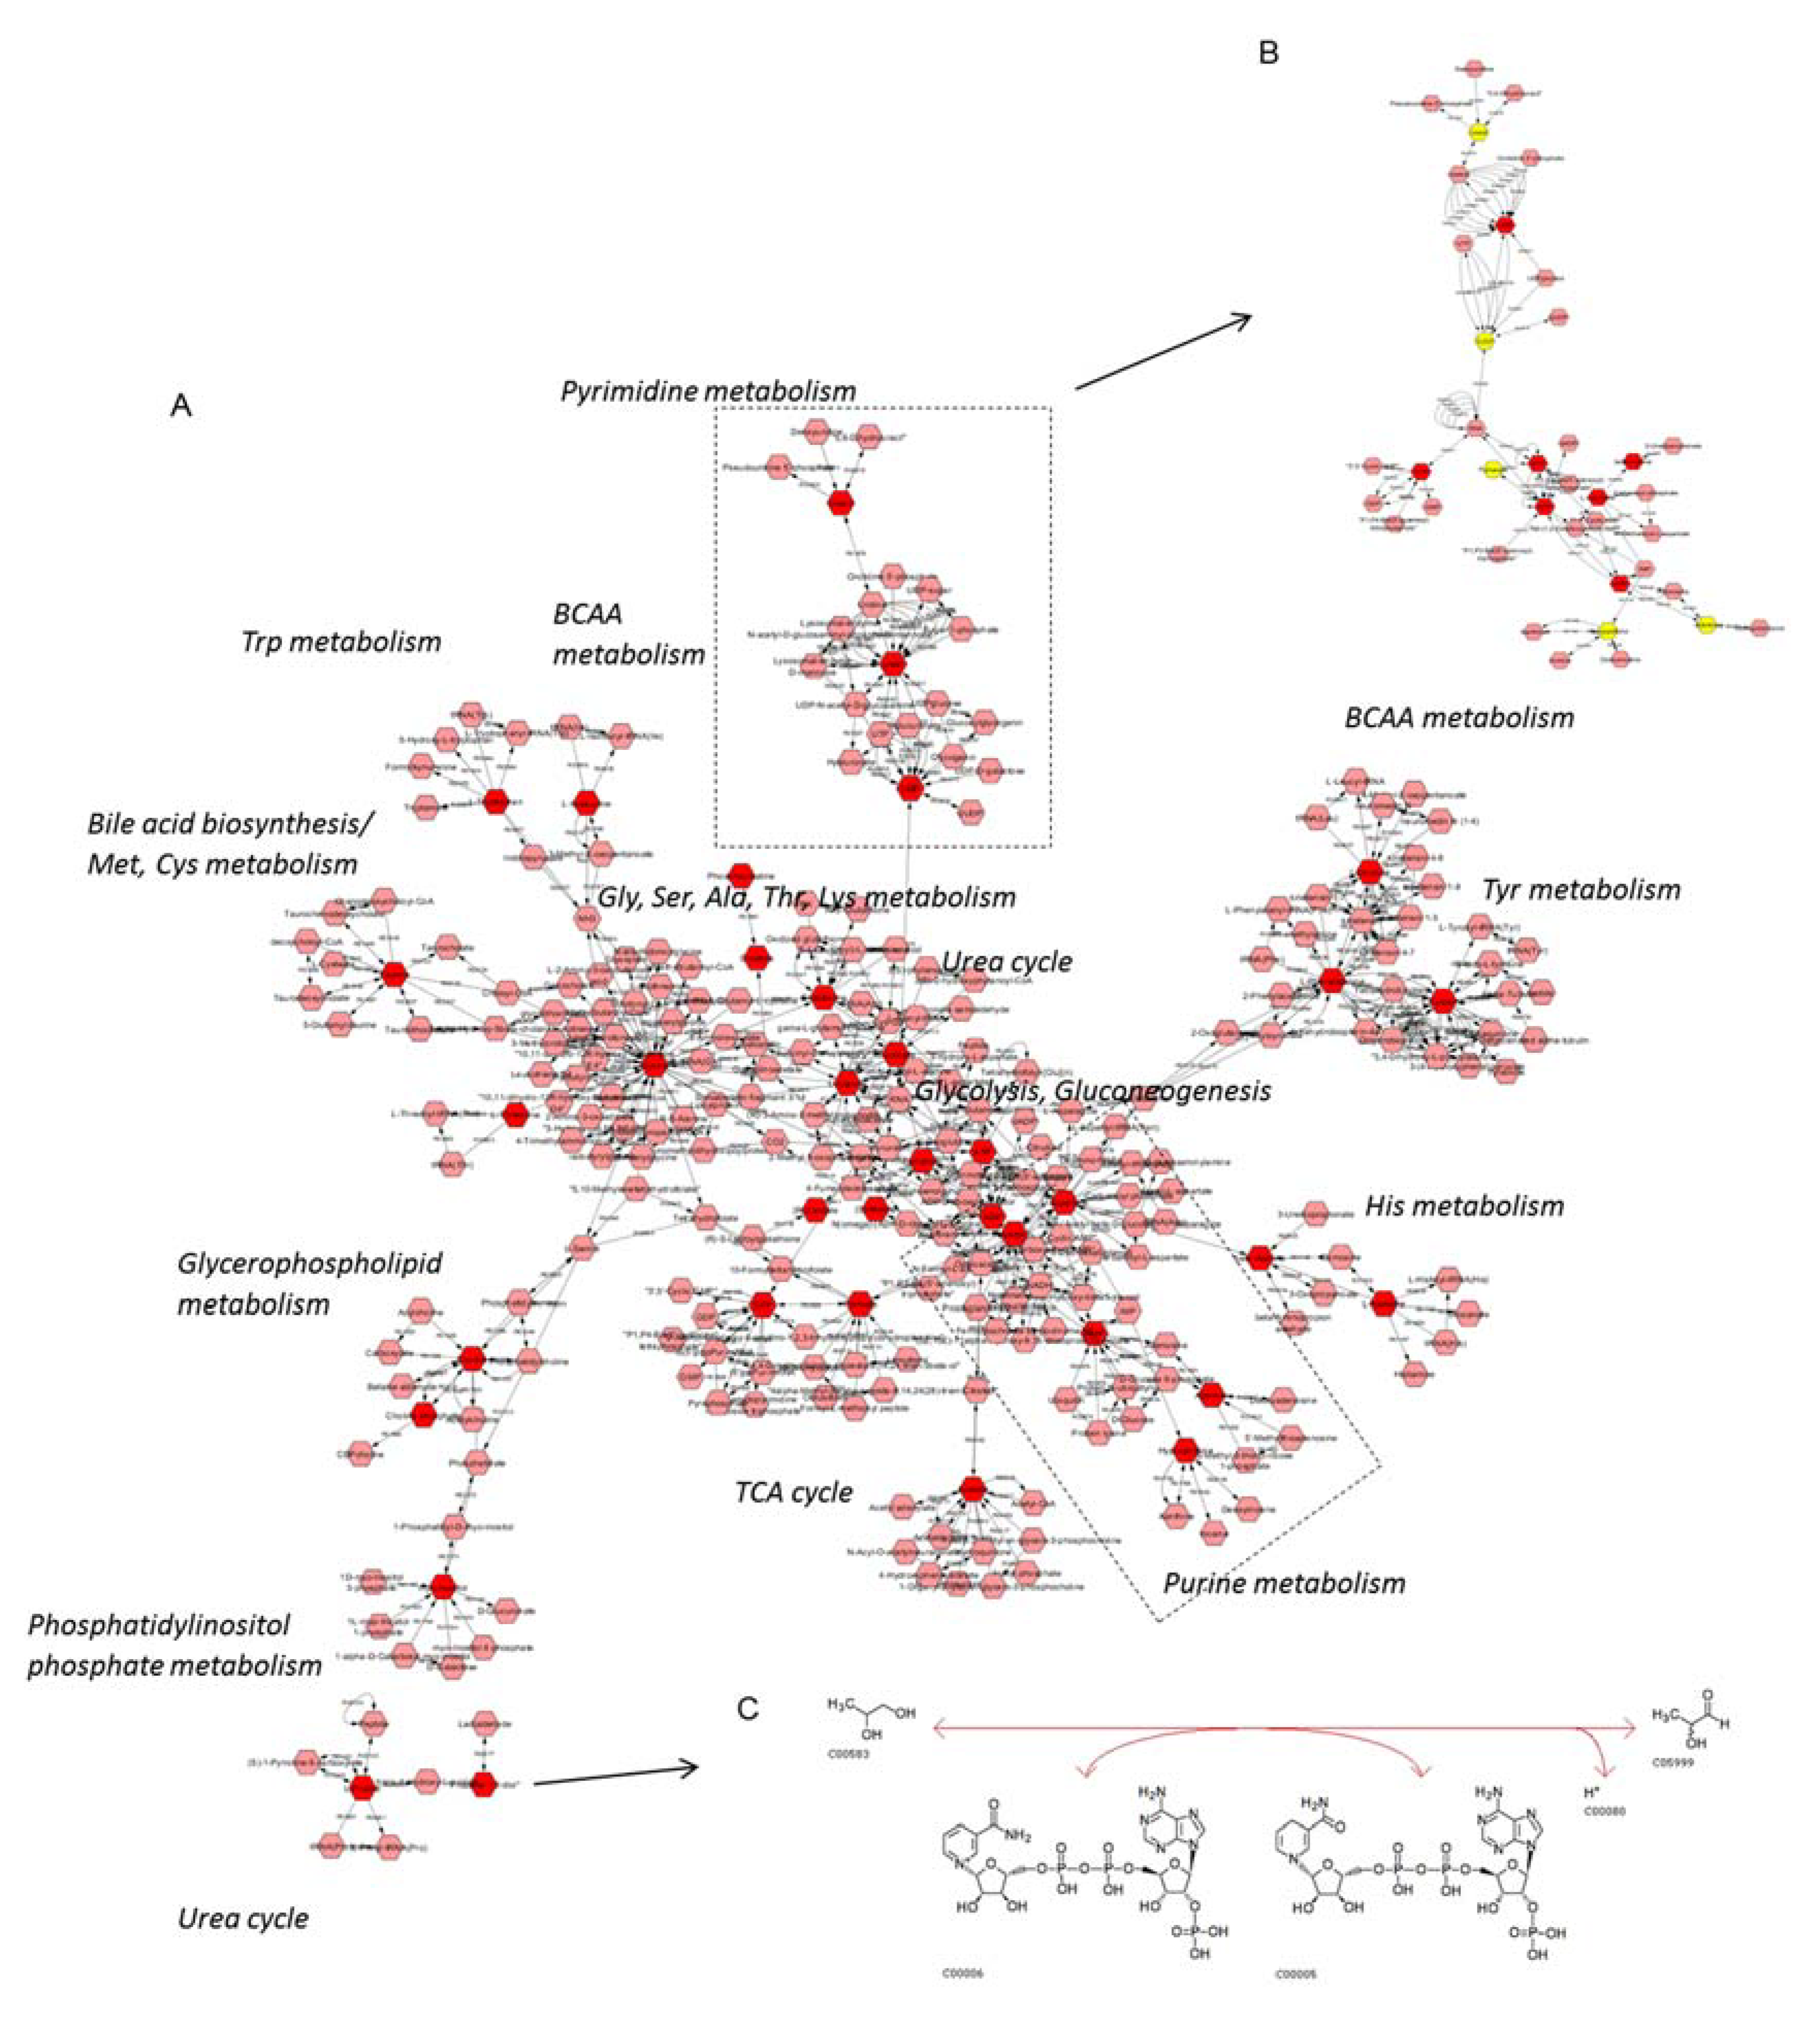
4.6. Metabolite/Pathway Identification
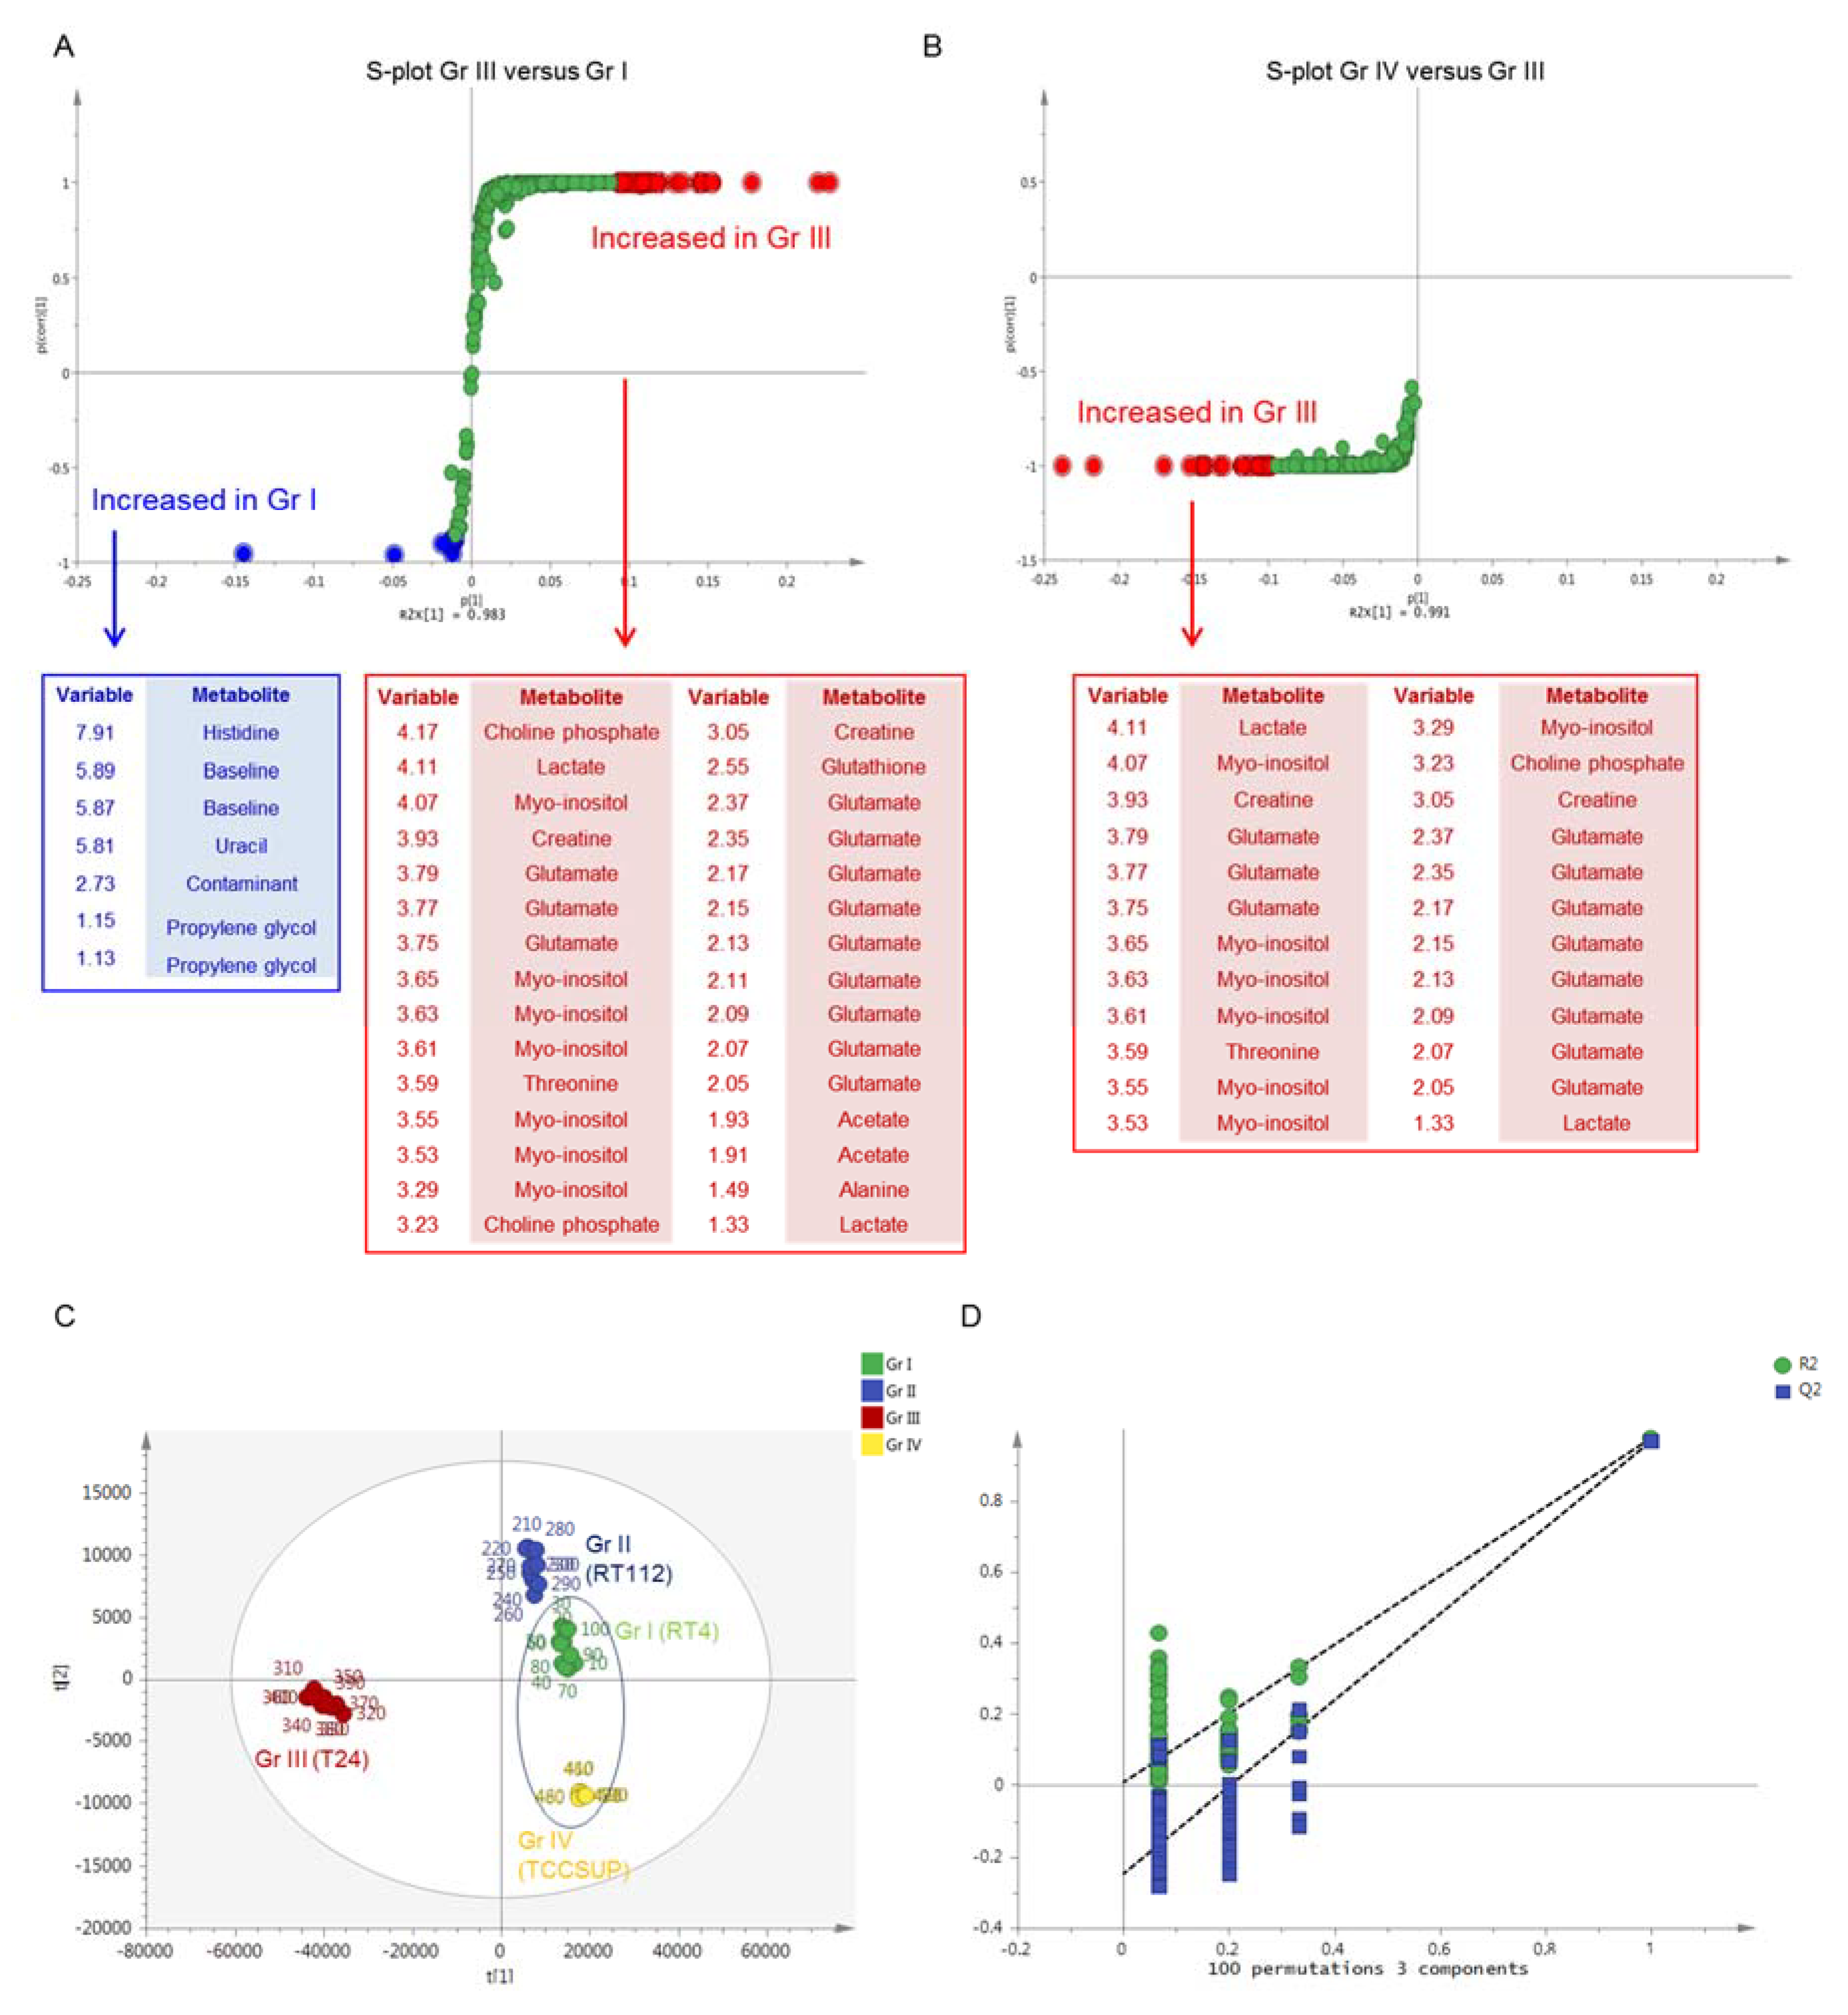
4.7. Statistical Analysis
5. Conclusions
Supplementary Materials
Author Contributions
Funding
Acknowledgments
Conflicts of Interest
Abbreviations
| AKR1A1/AKR1B1 | Aldo-keto Reductases Family 1 Member(s) A1/B1 |
| AUC-ROC | Area Under the Receiver Operating Characteristic Curve |
| BR-F | Breiman’s Random-Forest |
| KEGG | Kyoto Encyclopedia of Genes and Genomes |
| KODAMA | Knowledge Discovery by Accuracy Maximization Analysis |
| OPLS-DA | Orthogonal Partial Least Squares-Discriminant Analysis |
| PCA | Principal Component Analysis |
| PLS-DA | Partial Least Squares-Discriminant Analysis |
| QC-RLSC | QC-based Signal-correction Method |
| QCs | Quality Control Samples |
| UBC | Urothelial Bladder Cancer |
| VIP | Variable Importance in Projection |
References
- Burger, M.; Catto, J.W.; Dalbagni, G.; Grossman, H.B.; Herr, H.; Karakiewicz, P.; Kassouf, W.; Kiemeney, L.A.; La Vecchia, C.; Shariat, S.; et al. Epidemiology and risk factors of urothelial bladder cancer. Eur. Urol. 2013, 63, 234–241. [Google Scholar] [CrossRef]
- Huang, Z.; Lin, L.; Gao, Y.; Chen, Y.; Yan, X.; Xing, J.; Hang, W. Bladder cancer determination via two urinary metabolites: A biomarker pattern approach. Mol. Cell. Proteom. 2011, 10. [Google Scholar] [CrossRef] [PubMed] [Green Version]
- Montironi, R.; Cheng, L.; Scarpelli, M.; Lopez-Beltran, A. Pathology and genetics: Tumours of the urinary system and male genital system: Clinical implications of the 4th edition of the who classification and beyond. Eur. Urol. 2016, 70, 120–123. [Google Scholar] [CrossRef] [PubMed]
- Hurle, R.; Losa, A.; Manzetti, A.; Lembo, A. Upper urinary tract tumors developing after treatment of superficial bladder cancer: 7-year follow-up of 591 consecutive patients. Urology 1999, 53, 1144–1148. [Google Scholar] [CrossRef]
- Hansen, R.P.; Vedsted, P.; Sokolowski, I.; Søndergaard, J.; Olesen, F. Time intervals from first symptom to treatment of cancer: A cohort study of 2,212 newly diagnosed cancer patients. BMC Health Serv. Res. 2011, 11, 284. [Google Scholar] [CrossRef] [PubMed] [Green Version]
- James, A.C.; Gore, J.L. The costs of non-muscle invasive bladder cancer. Urol. Clin. N. Am. 2013, 40, 261–269. [Google Scholar] [CrossRef]
- Vlachostergios, P.J.; Faltas, B.M. Treatment resistance in urothelial carcinoma: An evolutionary perspective. Nat. Rev. Clin. Oncol. 2018, 15, 495–509. [Google Scholar] [CrossRef] [PubMed]
- Giannopoulou, A.F.; Velentzas, A.D.; Konstantakou, E.G.; Avgeris, M.; Katarachia, S.A.; Papandreou, N.; Kalavros, N.; Mpakou, V.E.; Iconomidou, V.A.; Anastasiadou, E.; et al. Revisiting histone deacetylases in human tumorigenesis: The paradigm of urothelial bladder cancer. Int. J. Mol. Sci. 2019, 20, 1291. [Google Scholar] [CrossRef] [Green Version]
- Nicholson, J.K.; Lindon, J.C.; Holmes, E. Metabonomics: Understanding the metabolic responses of living systems to pathophysiological stimuli via multivariate statistical analysis of biological nmr spectroscopic data. Xenobiotica 1999, 29, 1181–1189. [Google Scholar] [CrossRef]
- Locasale, J.W.; Cantley, L.C.; Heiden, M.G.V. Cancer’s insatiable appetite. Nat. Biotechnol. 2009, 27, 916–917. [Google Scholar] [CrossRef] [Green Version]
- Hanahan, D.; Weinberg, R.A. Hallmarks of cancer: The next generation. Cell 2011, 144, 646–674. [Google Scholar] [CrossRef] [PubMed] [Green Version]
- Aboud, O.A.; Weiss, R.H. New opportunities from the cancer metabolome. Clin. Chem. 2013, 59, 138–146. [Google Scholar] [CrossRef] [PubMed] [Green Version]
- DeBerardinis, R.J.; Chandel, N.S. Fundamentals of cancer metabolism. Sci. Adv. 2016, 2, e1600200. [Google Scholar] [CrossRef] [PubMed] [Green Version]
- Boroughs, L.K.; DeBerardinis, R.J. Metabolic pathways promoting cancer cell survival and growth. Nat. Cell Biol. 2015, 17, 351–359. [Google Scholar] [CrossRef] [PubMed] [Green Version]
- Sahu, D.; Lotan, Y.; Wittmann, B.; Neri, B.; Hansel, D.E. Metabolomics analysis reveals distinct profiles of nonmuscle-invasive and muscle-invasive bladder cancer. Cancer Med. 2017, 6, 2106–2120. [Google Scholar] [CrossRef] [PubMed]
- Denkert, C.; Budczies, J.; Kind, T.; Weichert, W.; Tablack, P.; Sehouli, J.; Darb-Esfahani, S.; Könsgen, D.; Dietel, M.; Fiehn, O. Mass spectrometry-based metabolic profiling reveals different metabolite patterns in invasive ovarian carcinomas and ovarian borderline tumors. Cancer Res. 2006, 66, 10795–10804. [Google Scholar] [CrossRef] [Green Version]
- Rodrigues, D.; Jerónimo, C.; Henrique, R.; Belo, L.; Bastos, M.D.L.; De Pinho, P.G.; Carvalho, M. Biomarkers in bladder cancer: A metabolomic approach using in vitro and ex vivo model systems. Int. J. Cancer 2016, 139, 256–268. [Google Scholar] [CrossRef] [Green Version]
- Catchpole, G.; Platzer, A.; Weikert, C.; Kempkensteffen, C.; Johannsen, M.; Krause, H.; Jung, K.; Miller, K.; Willmitzer, L.; Selbig, J.; et al. Metabolic profiling reveals key metabolic features of renal cell carcinoma. J. Cell. Mol. Med. 2011, 15, 109–118. [Google Scholar] [CrossRef] [Green Version]
- Cheng, Y.; Xie, G.; Chen, T.; Qiu, Y.; Zou, X.; Zheng, M.; Tan, B.; Feng, B.; Dong, T.; He, P.; et al. Distinct urinary metabolic profile of human colorectal cancer. J. Proteom. Res. 2012, 11, 1354–1363. [Google Scholar] [CrossRef]
- Huang, Q.; Tan, Y.; Yin, P.; Ye, G.; Gao, P.; Lu, X.; Wang, H.; Xu, G. Metabolic characterization of hepatocellular carcinoma using nontargeted tissue metabolomics. Cancer Res. 2013, 73, 4992–5002. [Google Scholar] [CrossRef] [Green Version]
- Pendyala, L.; Velagapudi, S.; Toth, K.; Zdanowicz, J.; Glaves, D.; Slocum, H.; Perez, R.; Huben, R.; Creaven, P.J.; Raghavan, D. Translational studies of glutathione in bladder cancer cell lines and human specimens. Clin. Cancer Res. 1997, 3, 793–798. [Google Scholar]
- Pasikanti, K.K.; Norasmara, J.; Cai, S.; Mahendran, R.; Esuvaranathan, K.; Ho, P.C.; Chan, E.C.Y. Metabolic footprinting of tumorigenic and nontumorigenic uroepithelial cells using two-dimensional gas chromatography time-of-flight mass spectrometry. Anal. Bioanal. Chem. 2010, 398, 1285–1293. [Google Scholar] [CrossRef] [PubMed]
- Bansal, N.; Gupta, A.; Mitash, N.; Shakya, P.S.; Mandhani, A.; Mahdi, A.A.; Sankhwar, S.N.; Mandal, S.K. Low- and high-grade bladder cancer determination via human serum-based metabolomics approach. J. Proteom. Res. 2013, 12, 5839–5850. [Google Scholar] [CrossRef] [PubMed]
- Wittmann, B.M.; Stirdivant, S.M.; Mitchell, M.; Wulff, J.E.; McDunn, J.E.; Li, Z.; Dennis-Barrie, A.; Neri, B.P.; Milburn, M.V.; Lotan, Y.; et al. Bladder cancer biomarker discovery using global metabolomic profiling of urine. PLoS ONE 2014, 9, e115870. [Google Scholar] [CrossRef] [PubMed]
- Tan, G.; Wang, H.; Yuan, J.; Qin, W.; Dong, X.; Wu, H.; Meng, P. Three serum metabolite signatures for diagnosing low-grade and high-grade bladder cancer. Sci. Rep. 2017, 7, 46176. [Google Scholar] [CrossRef] [Green Version]
- Kouznetsova, V.L.; Kim, E.; Romm, E.L.; Zhu, A.; Tsigelny, I. Recognition of early and late stages of bladder cancer using metabolites and machine learning. Metabolomics 2019, 15, 94. [Google Scholar] [CrossRef]
- Rodrigues, D.; Pinto, J.; Araujo, A.M.; Jerónimo, C.; Henrique, R.; Bastos, M.D.L.; De Pinho, P.G.; Carvalho, M. Gc-ms metabolomics reveals distinct profiles of low- and high-grade bladder cancer cultured cells. Metabolites 2019, 9, 18. [Google Scholar] [CrossRef] [Green Version]
- Conde, V.R.; Oliveira, P.F.; Nunes, A.R.; Rocha, C.S.; Ramalhosa, E.; Pereira, J.A.; Alves, M.G.; Silva, B.M. The progression from a lower to a higher invasive stage of bladder cancer is associated with severe alterations in glucose and pyruvate metabolism. Exp. Cell Res. 2015, 335, 91–98. [Google Scholar] [CrossRef]
- Inzitari, R.; Cabras, T.; Pisano, E.; Fanali, C.; Manconi, B.; Scarano, E.; Faa, G. Hplc-esi-ms analysis of oral human fluids reveals that gingival crevicular fluid is the main source of oral thymosins β4 and β10. J. Sep. Sci. 2009, 32, 57–63. [Google Scholar] [CrossRef]
- León, Z.; García-Cañaveras, J.C.; Donato, M.T.; Lahoz, A. Mammalian cell metabolomics: Experimental design and sample preparation. Electrophoresis 2013, 34, 2762–2775. [Google Scholar] [CrossRef]
- Kalluri, U.; Naiker, M.; Myers, M.A. Cell culture metabolomics in the diagnosis of lung cancer-the influence of cell culture conditions. J. Breath Res. 2014, 8, 027109. [Google Scholar] [CrossRef] [PubMed] [Green Version]
- Čuperlović-Culf, M.; Barnett, D.; Culf, A.S.; Chute, I. Cell culture metabolomics: Applications and future directions. Drug Discov. Today 2010, 15, 610–621. [Google Scholar] [CrossRef] [PubMed]
- Bi, H.; Krausz, K.W.; Manna, S.K.; Li, F.; Johnson, C.H.; Gonzalez, F.J. Optimization of harvesting, extraction, and analytical protocols for uplc-esi-ms-based metabolomic analysis of adherent mammalian cancer cells. Anal. Bioanal. Chem. 2013, 405, 5279–5289. [Google Scholar] [CrossRef] [PubMed] [Green Version]
- Konstantakou, E.G.; Voutsinas, G.E.; Velentzas, A.D.; Basogianni, A.-S.; Paronis, E.; Balafas, E.; Kostomitsopoulos, N.; Syrigos, K.; Anastasiadou, E.; Stravopodis, D.J. 3-brpa eliminates human bladder cancer cells with highly oncogenic signatures via engagement of specific death programs and perturbation of multiple signaling and metabolic determinants. Mol. Cancer 2015, 14, 135. [Google Scholar] [CrossRef] [PubMed] [Green Version]
- Zheng, W.; Tayyari, F.; Gowda, G.N.; Raftery, D.; McLamore, E.S.; Porterfield, D.M.; Donkin, S.; Bequette, B.; Teegarden, R. Altered glucose metabolism in harvey-ras transformed mcf10a cells. Mol. Carcinog. 2015, 54, 111–120. [Google Scholar] [CrossRef] [PubMed] [Green Version]
- Gatenby, R.A.; Gillies, R.J. Why do cancers have high aerobic glycolysis? Nat. Rev. Cancer 2004, 4, 891–899. [Google Scholar] [CrossRef] [PubMed]
- Koppenol, W.H.; Bounds, P.L.; Dang, C.V. Otto warburg’s contributions to current concepts of cancer metabolism. Nat. Rev. Cancer 2011, 11, 325–337. [Google Scholar] [CrossRef]
- Harper, K.L.; Sosa, M.S.; Entenberg, D.; Hosseini, H.; Cheung, J.F.; Nobre, R.; Farias, E.F. Mechanism of early dissemination and metastasis in her2 mammary cancer. Nature 2016, 540, 588–592. [Google Scholar] [CrossRef]
- Hosseini, H.; Obradović, M.M.S.; Hoffmann, M.; Harper, K.L.; Sosa, M.S.; Werner-Klein, M.; Nanduri, S.L.K.; Werno, C.; Ehrl, C.; Maneck, M.; et al. Early dissemination seeds metastasis in breast cancer. Nature 2016, 540, 552–558. [Google Scholar] [CrossRef] [Green Version]
- Yachida, S.; Jones, S.; Bozic, I.; Antal, T.; Leary, R.; Fu, B.; Kamiyama, M.; Hruban, R.H.; Eshleman, J.R.; Nowak, M.A.; et al. Distant metastasis occurs late during the genetic evolution of pancreatic cancer. Nature 2010, 467, 1114–1117. [Google Scholar] [CrossRef] [Green Version]
- Vettore, L.; Westbrook, R.L.; Tennant, D.A. New aspects of amino acid metabolism in cancer. Br. J. Cancer 2020, 122, 150–156. [Google Scholar] [CrossRef] [PubMed]
- Griffin, J.L.; Shockcor, J.P. Metabolic profiles of cancer cells. Nat. Rev. Cancer 2004, 4, 551–561. [Google Scholar] [CrossRef] [PubMed]
- Loo, J.M.; Scherl, A.; Nguyen, A.; Man, F.Y.; Weinberg, E.; Zeng, Z.; Saltz, L.B.; Paty, P.B.; Tavazoie, S.F. Extracellular metabolic energetics can promote cancer progression. Cell 2015, 160, 393–406. [Google Scholar] [CrossRef] [PubMed] [Green Version]
- Sullivan, W.J.; Christofk, H.R. The metabolic milieu of metastases. Cell 2015, 160, 363–364. [Google Scholar] [CrossRef] [Green Version]
- Valli, A.; Morotti, M.; Zois, C.E.; Albers, P.K.; Soga, T.; Feldinger, K.; Fischer, R.; Frejno, M.; McIntyre, A.; Bridges, E.; et al. Adaptation to hif1α deletion in hypoxic cancer cells by upregulation of glut14 and creatine metabolism. Mol. Cancer Res. 2019, 17, 1531–1544. [Google Scholar] [CrossRef] [Green Version]
- Kung, A.; Zabludoff, S.D.; France, D.S.; Freedman, S.J.; Tanner, E.A.; Vieira, A.; Cornell-Kennon, S.; Lee, J.; Wang, B.; Wang, J.; et al. Small molecule blockade of transcriptional coactivation of the hypoxia-inducible factor pathway. Cancer Cell 2004, 6, 33–43. [Google Scholar] [CrossRef] [Green Version]
- Hardie, D.G.; Ross, F.A.; Hawley, S.A. Ampk: A nutrient and energy sensor that maintains energy homeostasis. Nat. Rev. Mol. Cell Biol. 2012, 13, 251–262. [Google Scholar] [CrossRef] [Green Version]
- Mihaylova, M.M.; Shaw, R.J. The ampk signalling pathway coordinates cell growth, autophagy and metabolism. Nat. Cell Biol. 2011, 13, 1016–1023. [Google Scholar] [CrossRef]
- Guo, J.Y.; Chen, H.-Y.; Mathew, R.; Fan, J.; Strohecker, A.M.; Karsli-Uzunbas, G.; Kamphorst, J.J.; Chen, G.; Lemons, J.M.; Karantza, V.; et al. Activated ras requires autophagy to maintain oxidative metabolism and tumorigenesis. Genes Dev. 2011, 25, 460–470. [Google Scholar] [CrossRef] [Green Version]
- Sribenja, S.; Wongkham, S.; Wongkham, C.; Yao, Q.C.; Chen, C. Roles and mechanisms of β-thymosins in cell migration and cancer metastasis: An update. Cancer Investig. 2013, 31, 103–110. [Google Scholar] [CrossRef]
- Lee, S.H.; Son, M.J.; Oh, S.H.; Rho, S.B.; Park, K.; Kim, Y.J.; Lee, J.H. Thymosin β10 inhibits angiogenesis and tumor growth by interfering with ras function. Cancer Res. 2005, 65, 137–148. [Google Scholar] [PubMed]
- Wang, B.; Wang, Z.; Zhang, T.; Yang, G. Overexpression of thymosin β10 correlates with disease progression and poor prognosis in bladder cancer. Exp. Ther. Med. 2019, 18, 3759–3766. [Google Scholar] [CrossRef] [Green Version]
- Wang, Z.Y.; Zhang, W.; Yang, J.; Song, D.K.; Wei, J.X.; Gao, S. Association of thymosin β4 expression with clinicopathological parameters and clinical outcomes of bladder cancer patients. Neoplasma 2016, 63, 991–998. [Google Scholar] [CrossRef] [Green Version]
- Wen, B.; Mei, Z.; Zeng, C.; Liu, S. Metax: A flexible and comprehensive software for processing metabolomics data. BMC Bioinform. 2017, 18, 183. [Google Scholar] [CrossRef] [PubMed] [Green Version]
- Strohalm, M.; Kavan, D.; Novák, P.; Volny, M.; Havlicek, V. Mmass 3: A cross-platform software environment for precise analysis of mass spectrometric data. Anal. Chem. 2010, 82, 4648–4651. [Google Scholar] [CrossRef] [PubMed]
- Gao, J.; Tarcea, V.G.; Karnovsky, A.; Mirel, B.R.; Weymouth, T.E.; Beecher, C.W.; Cavalcoli, J.D.; Athey, B.; Omenn, G.S.; Burant, C.; et al. Metscape: A cytoscape plug-in for visualizing and interpreting metabolomic data in the context of human metabolic networks. Bioinformatics 2010, 26, 971–973. [Google Scholar] [CrossRef] [PubMed] [Green Version]
- Shannon, P.; Markiel, A.; Ozier, O.; Baliga, N.S.; Wang, J.T.; Ramage, D.; Amin, N.; Schwikowski, B.; Ideker, T. Cytoscape: A software environment for integrated models of biomolecular interaction networks. Genome Res. 2003, 13, 2498–2504. [Google Scholar] [CrossRef]
- Cacciatore, S.; Tenori, L.; Luchinat, C.; Bennett, P.R.; MacIntyre, D.A. Kodama: An r package for knowledge discovery and data mining. Bioinformatics 2017, 33, 621–623. [Google Scholar] [CrossRef] [Green Version]
- Luan, H.; Ji, F.; Chen, Y.; Cai, Z. Stattarget: A streamlined tool for signal drift correction and interpretations of quantitative mass spectrometry-based omics data. Anal. Chim. Acta 2018, 1036, 66–72. [Google Scholar] [CrossRef]
- Robin, X.; Turck, N.; Hainard, A.; Tiberti, N.; Lisacek, F.; Sanchez, J.-C.; Müller, M. Proc: An open-source package for r and s+ to analyze and compare roc curves. Bmc Bioinform. 2011, 12, 77. [Google Scholar] [CrossRef]
- Wu, H.; Southam, A.D.; Hines, A.; Viant, M.R. High-throughput tissue extraction protocol for NMR- and MS-based metabolomics. Anal. Biochem. 2008, 372, 204–212. [Google Scholar] [CrossRef] [PubMed]
- Dunn, W.B.; Broadhurst, D.; Begley, P.; Zelena, E.; Francis-McIntyre, S.; Anderson, N.; Brown, M.; Knowles, J.D.; Halsall, A.; Haselden, J.N.; et al. Procedures for large-scale metabolic profiling of serum and plasma using gas chromatography and liquid chromatography coupled to mass spectrometry. Nat. Protoc. 2011, 6, 1060–1083. [Google Scholar] [CrossRef] [PubMed]


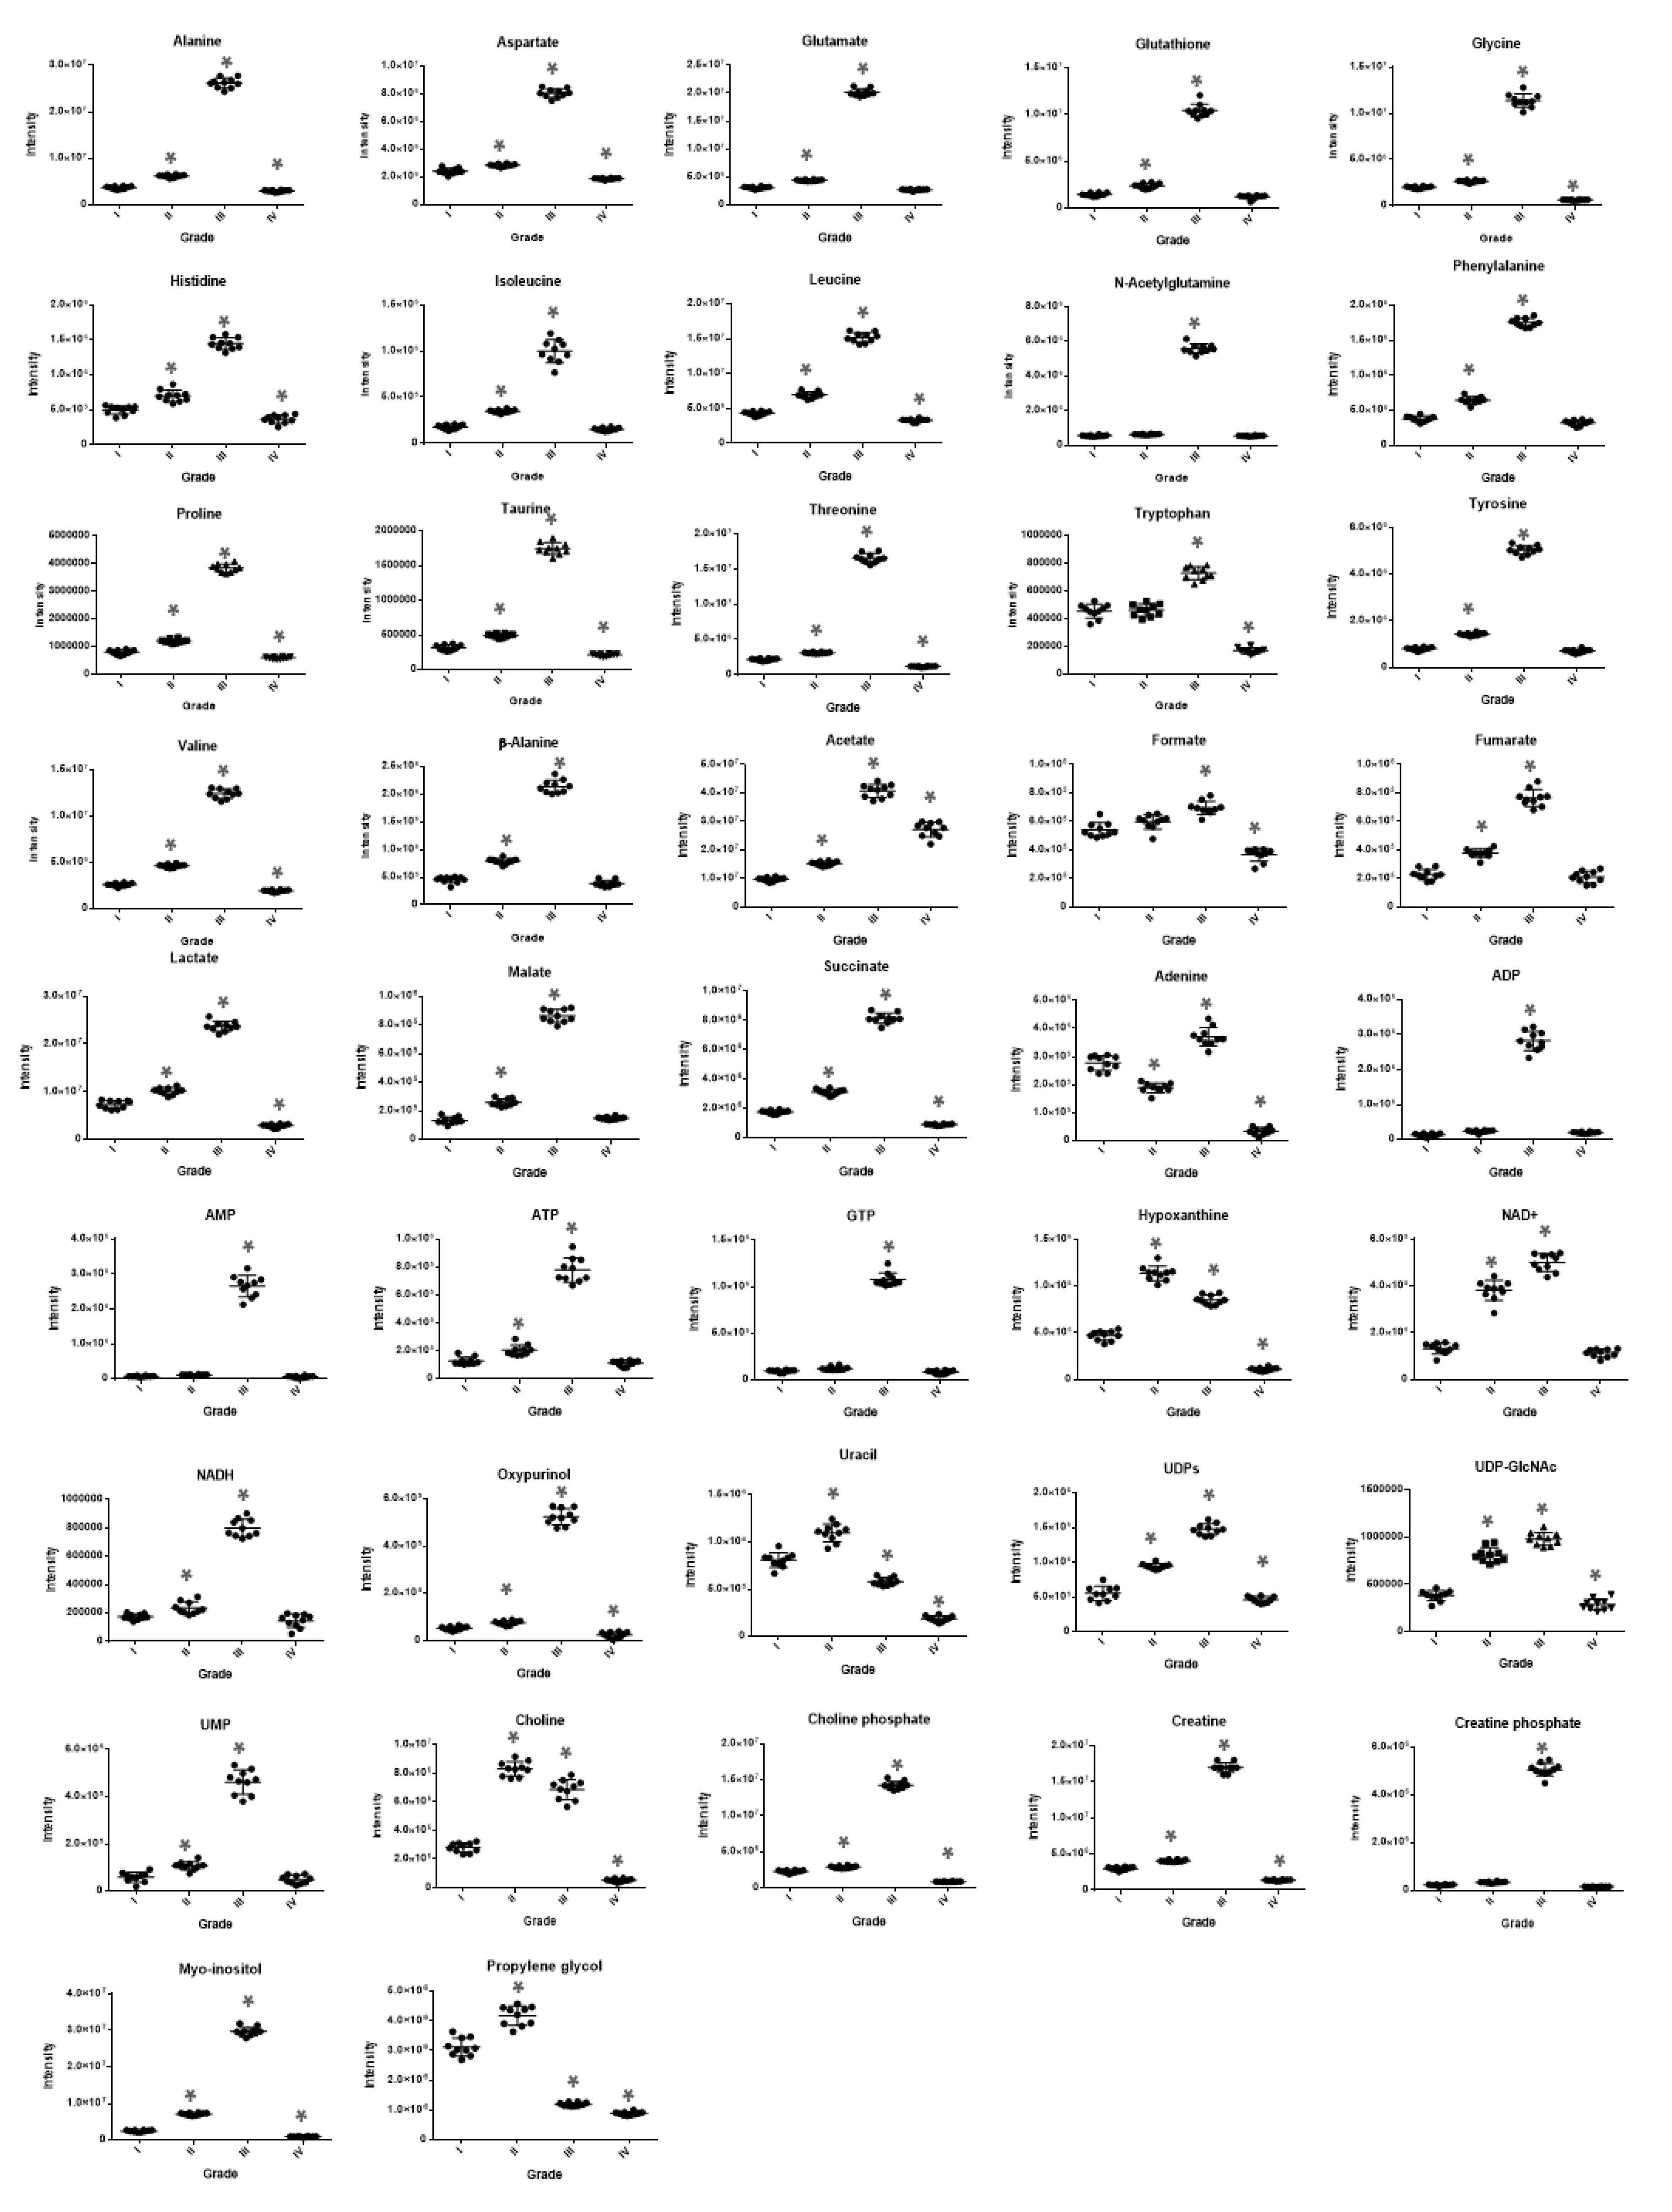
| Metabolites | Gr II/Gr I | Gr III/Gr I | Gr IV/Gr I |
|---|---|---|---|
| Alanine | 1.66 | 6.99 | 0.81 |
| Aspartate | 1.18 | 3.33 | 0.78 |
| Glutamate | 1.41 | 6.44 | 0.88 |
| Glutathione | 1.65 | 7.18 | 0.87 |
| Glycine | 1.33 | 5.71 | 0.32 |
| Histidine | 1.41 | 2.91 | 0.74 |
| Isoleucine | 1.96 | 5.62 | 0.86 |
| Leucine | 1.61 | 3.51 | 0.77 |
| N-Acetylglutamine | 1.14 | 10.17 | 0.99 |
| Phenylalanine | 1.82 | 5.92 | 0.86 |
| Proline | 1.5 | 4.77 | 0.75 |
| Taurine | 1.55 | 5.5 | 0.67 |
| Threonine | 1.42 | 5.38 | 0.74 |
| Tryptophan | 1.01 | 1.6 | 0.37 |
| Tyrosine | 1.77 | 6.25 | 0.88 |
| Valine | 1.79 | 4.81 | 0.74 |
| β-Alanine | 1.68 | 4.54 | 0.82 |
| Acetate | 1.56 | 4.17 | 2.78 |
| Formate | 1.13 | 1.28 | 0.68 |
| Fumarate | 1.65 | 3.34 | 0.92 |
| Lactate | 1.39 | 3.22 | 0.39 |
| Malate | 1.95 | 6.5 | 1.12 |
| Succinate | 1.79 | 4.65 | 0.51 |
| Adenine | 0.68 | 1.33 | 0.12 |
| ADP | 1.76 | 20.76 | 1.49 |
| AMP | 1.45 | 34.33 | 0.79 |
| ATP | 1.6 | 6.1 | 0.88 |
| GTP | 1.29 | 11.31 | 0.88 |
| Hypoxanthine | 2.41 | 1.81 | 0.24 |
| NAD+ | 2.86 | 3.76 | 0.86 |
| NADH | 1.36 | 4.62 | 0.83 |
| Oxypurinol | 1.46 | 10.16 | 0.45 |
| Uracil | 1.36 | 0.72 | 0.23 |
| UDPs | 1.71 | 2.66 | 0.83 |
| UDP-GlcNAc | 2.43 | 3.25 | 0.75 |
| UMP | 1.82 | 7.77 | 0.82 |
| Choline | 2.96 | 2.44 | 0.19 |
| Choline phosphate | 1.27 | 6.26 | 0.37 |
| Creatine | 1.35 | 5.73 | 0.45 |
| Creatine phosphate | 1.51 | 22.99 | 0.66 |
| Myo-inositol | 2.89 | 12.06 | 0.37 |
| Propylene glycol | 1.34 | 0.38 | 0.29 |
| Feature | Multi-ROC AUC | Variable Importance in Projection (VIP) (PLS-DA) | Loadings Ranking | Kruskal Ranking | Random Forest (RF) (p-Value) |
|---|---|---|---|---|---|
| 993.7033_3.7 | 0.995 | 56 | 11 | 54 | 2 |
| 828.2532_3.71 | 0.982 | 77 | 6 | 58 | 5 |
| 129.1015_3.71 | 0.98 | 79 | 4 | 61 | 2 |
| 993.3025_3.7 | 0.973 | 66 | 5 | 53 | 6 |
| 348.7831_0.69 | 0.972 | 22 | 3 | 1 | 7 |
| 993.5029_3.7 | 0.972 | 58 | 13 | 66 | 11 |
| 828.0866_3.71 | 0.96 | 69 | 9 | 57 | 20 |
| 136.0611_3.3 | 0.955 | 1 | 66 | 11 | 8 |
| 827.9193_3.71 | 0.952 | 71 | 14 | 65 | 12 |
| 828.4207_3.71 | 0.95 | 74 | 7 | 33 | 9 |
| 696.5591_0.69 | 0.942 | 49 | 52 | 17 | 41 |
| 823.9269_3.79 | 0.938 | 55 | 12 | 24 | 16 |
| 824.0938_3.8 | 0.938 | 52 | 32 | 70 | 13 |
| 120.08_2.03 | 0.935 | 99 | 57 | 4 | 15 |
| 823.4258_3.79 | 0.932 | 51 | 2 | 3 | 16 |
| 823.5929_3.8 | 0.932 | 41 | 15 | 31 | 5 |
| 823.7596_3.8 | 0.928 | 53 | 23 | 25 | 18 |
| 380.7729_0.69 | 0.925 | 86 | 49 | 28 | 38 |
| 118.0643_2.01 | 0.922 | 39 | 37 | 16 | 28 |
| 988.1106_3.8 | 0.917 | 54 | 20 | 12 | 1 |
| 828.7551_3.7 | 0.913 | 67 | 10 | 69 | 18 |
| 622.646_0.68 | 0.912 | 65 | 16 | 8 | 34 |
| 350.7812_0.69 | 0.91 | 47 | 26 | 20 | 31 |
| 212.8509_0.69 | 0.908 | 19 | 38 | 36 | 30 |
| 828.5893_3.79 | 0.908 | 112 | 30 | 55 | 14 |
| 988.7121_3.78 | 0.907 | 62 | 17 | 47 | 26 |
| 330.7728_0.66 | 0.902 | 36 | 33 | 13 | 45 |
| 486.713_0.66 | 0.902 | 34 | 28 | 6 | >50 |
| 827.7527_3.7 | 0.9 | 84 | 21 | 79 | 22 |
| Ions of b Series, (Acetylated) Thymosin β4 (Tβ4) | |||||
| m/z | Ion | z | Sequence | Error (Da) | Deconvoluted Mass |
| 774.9006 | b13 | 2 | .SDKPDMAEIEKFD.k [1xAcetyl] | 0.053 | 1547.696 |
| 946.616 | b16 | 2 | .SDKPDMAEIEKFDKSK.l [1xAcetyl] | 0.157 | 1890.9178 |
| 1067.2304 | b18 | 2 | .SDKPDMAEIEKFDKSKLK.k [1xAcetyl] | 0.182 | 2132.097 |
| 831.2934 | b21 | 3 | .SDKPDMAEIEKFDKSKLKKTE.t [1xAcetyl] | 0.197 | 2490.2895 |
| 355.2822 | b27 | 9 | .SDKPDMAEIEKFDKSKLKKTETQEKNP.l [1xAcetyl] | 0.096 | 3187.6722 |
| 850.3742 | b29 | 4 | .SDKPDMAEIEKFDKSKLKKTETQEKNPLP.s [1xAcetyl] | −0.069 | 3397.7732 |
| 936.3339 | b32 | 4 | .SDKPDMAEIEKFDKSKLKKTETQEKNPLPSKE.t [1xAcetyl] | −0.152 | 3741.9428 |
| 869.5772 | b37 | 5 | .SDKPDMAEIEKFDKSKLKKTETQEKNPLPSKETIEQE.k [1xAcetyl] | 0.132 | 4342.2255 |
| 1086.6825 | b37 | 4 | .SDKPDMAEIEKFDKSKLKKTETQEKNPLPSKETIEQE.k [1xAcetyl] | 0.128 | 4342.218 |
| 1164.2402 | b40-NH3 | 4 | .SDKPDMAEIEKFDKSKLKKTETQEKNPLPSKETIEQEKQA.g [1xAcetyl] | 0.145 | 4669.4134 |
| 788.6117 | b41 | 6 | .SDKPDMAEIEKFDKSKLKKTETQEKNPLPSKETIEQEKQAG.e [1xAcetyl] | −0.129 | 4726.4448 |
| 1182.801 | b41 | 4 | .SDKPDMAEIEKFDKSKLKKTETQEKNPLPSKETIEQEKQAG.e [1xAcetyl] | 0.194 | 4726.4304 |
| 971.9887 | b42 | 5 | .SDKPDMAEIEKFDKSKLKKTETQEKNPLPSKETIEQEKQAGE.s [1xAcetyl] | −0.107 | 4855.48 |
| Ions of y Series, (Acetylated) Thymosin β10 (Tβ10) | |||||
| m/z | Ion | z | Sequence | Error (Da) | Deconvoluted Mass |
| 839.5505 | y14 | 2 | p.TKETIEQEKRSEIS. | 0.1142 | 1676.8726 |
| 592.5017 | y15 | 3 | l.PTKETIEwebQEKRSEIS. | 0.1909 | 1773.9327 |
| 1775.0578 | y15 | 1 | l.PTKETIEQEKRSEIS. | 0.1397 | 1790.9491 |
| 944.3809 | y16 | 2 | t.LPTKETIEQEKRSEIS. | −0.1239 | 1887.0094 |
| 663.8185 | y17 | 3 | n.TLPTKETIEQEKRSEIS. | 0.1304 | 1988.0643 |
| 994.9422 | y17 | 2 | n.TLPTKETIEQEKRSEIS. | −0.0864 | 1988.0572 |
| 1052.2492 | y18 | 2 | k.NTLPTKETIEQEKRSEIS. | 0.1992 | 2119.131 |
| 1244.6476 | y21 | 2 | t.QEKNTLPTKETIEQEKRSEIS. | −0.0005 | 2504.3272 |
| 863.8784 | y22 | 3 | e.TQEKNTLPTKETIEQEKRSEIS. | 0.0947 | 2605.3821 |
| 1295.2735 | y22 | 2 | e.TQEKNTLPTKETIEQEKRSEIS. | 0.1016 | 2605.3748 |
| 983.2832 | y25 | 3 | k.KTETQEKNTLPTKETIEQEKRSEIS. | 0.1044 | 2946.5364 |
| 1130.0686 | y29 | 3 | k.AKLKKTETQEKNTLPTKETIEQEKRSEIS. | 0.1194 | 3403.8786 |
| 1172.5977 | y30 | 3 | d.KAKLKKTETQEKNTLPTKETIEQEKRSEIS. | −0.0498 | 3531.9735 |
| 630.6308 | y32 | 6 | s.FDKAKLKKTETQEKNTLPTKETIEQEKRSEIS. | 0.1209 | 3777.0594 |
| 756.3638 | y32 | 5 | s.FDKAKLKKTETQEKNTLPTKETIEQEKRSEIS. | −0.0466 | 3777.0525 |
| 945.1581 | y32 | 4 | s.FDKAKLKKTETQEKNTLPTKETIEQEKRSEIS. | −0.1031 | 3777.0452 |
| 810.8174 | y35 | 5 | e.IASFDKAKLKKTETQEKNTLPTKETIEQEKRSEIS. | 0.1763 | 4048.2055 |
| 807.212 | y35-NH3 | 5 | e.IASFDKAKLKKTETQEKNTLPTKETIEQEKRSEIS. | −0.0238 | 4048.21 |
| 1059.3714 | y37 | 4 | m.GEIASFDKAKLKKTETQEKNTLPTKETIEQEKRSEIS. | −0.1943 | 4251.2934 |
| 744.6523 | y39-H2O | 6 | p.DMGEIASFDKAKLKKTETQEKNTLPTKETIEQEKRSEIS. | −0.07 | 4480.3443 |
| 1116.7269 | y39-H2O | 4 | p.DMGEIASFDKAKLKKTETQEKNTLPTKETIEQEKRSEIS. | 0.1471 | 4479.3502 |
| 916.6534 | y40 | 5 | k.PDMGEIASFDKAKLKKTETQEKNTLPTKETIEQEKRSEIS. | 0.1754 | 4594.421 |
| 965.1255 | y42 | 5 | a.DKPDMGEIASFDKAKLKKTETQEKNTLPTKETIEQEKRSEIS. | 0.0231 | 4837.5425 |
| 1206.0731 | y42 | 4 | a.DKPDMGEIASFDKAKLKKTETQEKNTLPTKETIEQEKRSEIS. | −0.053 | 4837.5354 |
| 801.7036 | y42-NH3 | 6 | a.DKPDMGEIASFDKAKLKKTETQEKNTLPTKETIEQEKRSEIS. | 0.1215 | 4820.5236 |
© 2020 by the authors. Licensee MDPI, Basel, Switzerland. This article is an open access article distributed under the terms and conditions of the Creative Commons Attribution (CC BY) license (http://creativecommons.org/licenses/by/4.0/).
Share and Cite
Iliou, A.; Panagiotakis, A.; Giannopoulou, A.F.; Benaki, D.; Kosmopoulou, M.; Velentzas, A.D.; Tsitsilonis, O.E.; Papassideri, I.S.; Voutsinas, G.E.; Konstantakou, E.G.; et al. Malignancy Grade-Dependent Mapping of Metabolic Landscapes in Human Urothelial Bladder Cancer: Identification of Novel, Diagnostic, and Druggable Biomarkers. Int. J. Mol. Sci. 2020, 21, 1892. https://0-doi-org.brum.beds.ac.uk/10.3390/ijms21051892
Iliou A, Panagiotakis A, Giannopoulou AF, Benaki D, Kosmopoulou M, Velentzas AD, Tsitsilonis OE, Papassideri IS, Voutsinas GE, Konstantakou EG, et al. Malignancy Grade-Dependent Mapping of Metabolic Landscapes in Human Urothelial Bladder Cancer: Identification of Novel, Diagnostic, and Druggable Biomarkers. International Journal of Molecular Sciences. 2020; 21(5):1892. https://0-doi-org.brum.beds.ac.uk/10.3390/ijms21051892
Chicago/Turabian StyleIliou, Aikaterini, Aristeidis Panagiotakis, Aikaterini F. Giannopoulou, Dimitra Benaki, Mariangela Kosmopoulou, Athanassios D. Velentzas, Ourania E. Tsitsilonis, Issidora S. Papassideri, Gerassimos E. Voutsinas, Eumorphia G. Konstantakou, and et al. 2020. "Malignancy Grade-Dependent Mapping of Metabolic Landscapes in Human Urothelial Bladder Cancer: Identification of Novel, Diagnostic, and Druggable Biomarkers" International Journal of Molecular Sciences 21, no. 5: 1892. https://0-doi-org.brum.beds.ac.uk/10.3390/ijms21051892