Article

LPMO AfAA9_B and Cellobiohydrolase AfCel6A from A. fumigatus Boost Enzymatic Saccharification Activity of Cellulase Cocktail

by
Aline Vianna Bernardi
1,
Luis Eduardo Gerolamo
1,
Paula Fagundes de Gouvêa
1,
Deborah Kimie Yonamine
1,
Lucas Matheus Soares Pereira
1,
Arthur Henrique Cavalcante de Oliveira
1,
Sérgio Akira Uyemura
2 and
Taisa Magnani Dinamarco
1,*
1
Faculdade de Filosofia Ciências e Letras de Ribeirão Preto, Universidade de São Paulo, Ribeirão Preto 14040-901, Brazil
2
Faculdade de Ciências Farmacêuticas de Ribeirão Preto, Universidade de São Paulo, Ribeirão Preto 14040-903, Brazil
*
Author to whom correspondence should be addressed.
Int. J. Mol. Sci. 2021, 22(1), 276; https://0-doi-org.brum.beds.ac.uk/10.3390/ijms22010276
Submission received: 3 December 2020 / Revised: 21 December 2020 / Accepted: 24 December 2020 / Published: 29 December 2020

Abstract

:
Cellulose is the most abundant polysaccharide in lignocellulosic biomass, where it is interlinked with lignin and hemicellulose. Bioethanol can be produced from biomass. Since breaking down biomass is difficult, cellulose-active enzymes secreted by filamentous fungi play an important role in degrading recalcitrant lignocellulosic biomass. We characterized a cellobiohydrolase (AfCel6A) and lytic polysaccharide monooxygenase LPMO (AfAA9_B) from Aspergillus fumigatus after they were expressed in Pichia pastoris and purified. The biochemical parameters suggested that the enzymes were stable; the optimal temperature was ~60 °C. Further characterization revealed high turnover numbers (kcat of 147.9 s−1 and 0.64 s−1, respectively). Surprisingly, when combined, AfCel6A and AfAA9_B did not act synergistically. AfCel6A and AfAA9_B association inhibited AfCel6A activity, an outcome that needs to be further investigated. However, AfCel6A or AfAA9_B addition boosted the enzymatic saccharification activity of a cellulase cocktail and the activity of cellulase Af-EGL7. Enzymatic cocktail supplementation with AfCel6A or AfAA9_B boosted the yield of fermentable sugars from complex substrates, especially sugarcane exploded bagasse, by up to 95%. The synergism between the cellulase cocktail and AfAA9_B was enzyme- and substrate-specific, which suggests a specific enzymatic cocktail for each biomass by up to 95%. The synergism between the cellulase cocktail and AfAA9_B was enzyme- and substrate-specific, which suggests a specific enzymatic cocktail for each biomass.

1. Introduction

Fossil fuel depletion, increasing energy consumption, growing CO2 emissions, and climate change have increased the demand for renewable energy sources. In this scenario, lignocellulosic residues stand out as a new generation of renewable energy sources, including second-generation (2G) ethanol [1,2,3,4,5]. Lignocellulosic biomass-derived biofuels can potentially substitute fossil fuels with the advantage that they can help to reduce the emission of greenhouse gases and global warming [6,7]. Every year, tons of agricultural residues, such as byproducts of sugarcane, corn, wheat, rice, and barley, are generated worldwide and have emerged as the most promising feedstock to produce biofuels by hydrolysis and subsequent fermentation [8].
The composition of the plant cell wall varies in terms of the percentage of cellulose (35–50%), hemicellulose (20–30%), and lignin (20–30%). The wall lignocellulosic structure is recalcitrant and resists chemical and biological treatments. Cellulose, a crystalline homopolysaccharide, is made up of thousands of D-glucose subunits linked by β-1,4-glycosidic bonds, forming linear chains. The cellulose chains are bound through intra- and intermolecular hydrogen bonds, creating insoluble microfibrils [9]. The recalcitrant structure of the plant cell wall matrix makes the release of soluble sugars challenging [10].
Industrial processes that produce ethanol from cellulose require that mixtures of fungal cellulases be employed, so that soluble sugars are released for further fermentation into bioethanol [7,11]. These enzymes work synergistically to break down polysaccharides and crystalline cellulose [12,13]. First, endoglucanases (EGL, EC 3.2.1.4) hydrolyze β-1,4-glucosidic bonds in amorphous regions of the cellulose chains, to release cello-oligosaccharides; cellobiohydrolases (CBH; EC 3.2.1.91) act on short cellulose molecules and cello-oligosaccharides, releasing disaccharide units like cellobiose. Then, β-glucosidases (BG; EC 3.2.1.21) cleave cellobiose into glucose for further fermentation. Together, these enzymes are part of an enzymatic cocktail and are used to break down lignocellulose.
In contrast to cellulases, lytic polysaccharide monooxygenases (LPMO; EC: 1.14.99.53–56) degrade cellulose by an oxidative mechanism and enhance accessibility to cellulose, improving the hydrolytic performance of cellulases [14,15,16]. LPMOs are copper-dependent enzymes that act on crystalline cellulose and other polysaccharides in nature, to generate oxidized and non-oxidized chain ends. In addition, LPMO is a virulence factor in fungal meningitis [17].
The fact that LPMO boosts the activity of hydrolytic enzymes during chitin degradation was first described in 2005 [18]. The LPMO activity on cellulose and other biomasses has also been reported [19,20]. The copper ion in the LPMO catalytic structure is coordinated to three nitrogen atoms of the two conserved histidine residues in a histidine brace, which is essential for LPMO activity [21,22,23,24,25,26,27]. The LPMO oxidative mechanism is not fully understood, but analysis of reaction products has revealed that LPMO hydroxylates carbon C1 or C4, or both. To initiate oxidative cleavage, an enzyme, such as cellobiose dehydrogenase, or a small reductor molecule must reduce the LPMO copper center. Subsequently, the enzyme reacts with a co-substrate (O2 or H2O2), to form oxygen species that can hydroxylate C1 or C4 in the glycosidic bond [28,29].
Some studies have described inhibitory results or no synergism between LPMOs and cellulases. For example, HjLPMO9A addition to accellerase elicits no synergism until 100 h [30]. Moreover, NcLPMO9F reduces CBHI efficiency in the degradation of mixed amorphous-crystalline cellulosic substrate (MACS) [31]. MtLPMO9L affects CBHI and CBHII differently depending on the ratio between the enzymes, substrate characteristics, and incubation time. These data highlight that understanding the synergistic mechanism between LPMO and GHs is still necessary and will be helpful for the development of novel cellulase mixtures.
Enzymes from thermophilic microorganisms offer several advantages for industrial applications. For example, Aspergillus fumigatus produces thermophilic CAZymes, which have high cellulolytic activity and stability in a wide range of pH and at elevated temperatures, unlike commercial fungal cellulases [32,33,34,35].
To characterize the association of cellulases (AfCel6A and Af-EGL7) and LPMO (AfAA9_B) from A. fumigatus, we evaluated their action on the degradation of different biomasses on a pilot scale. AfCel6A is a cellobiohydrolase from the glycoside hydrolase (GH) class, family 6; it acts exclusively on nonreducing ends of cellulosic polymers. Af-EGL7 is a previously characterized endoglucanase that can potentially hydrolyze biomass [32,36].
Here, we present the biochemical characterization of AfCel6A and AfAA9_B after they are expressed in Pichia pastoris. We will show that supplementation of enzymatic cocktails can enhance the production of fermentable sugars, and that LPMOs have a critical role in biomass hydrolysis. In addition, we evaluate the synergistic effect between AfAA9_B and cellulases (AfCel6A and Af-EGL7) and show different effects for the two enzymes.

2. Results and Discussion

Enzymatic biomass hydrolysis underlies most of the cost involved in biofuel production [37,38]. Different commercially available cellulolytic cocktails such as Novozyme, Du-Pont-Genencor, and Dyadic are still expensive. These cocktails consist of several enzymes that promote complete lignocellulosic biomass conversion into fermentable sugars [39,40]. However, widely variable biomasses are available for biorefinery purposes; e.g., wheat straw, rice straw, corncob, cotton-stalk, and sugar cane bagasse, so these commercial cocktails may not have the same efficiency for all feedstocks [41].
Developing cheaper and more effective enzymatic cocktails for hydrolysis of different biomasses is one of the major interests of researchers devoted to biomass conversion. Such cocktails can only be achieved by reducing the amount of enzymes that is required for hydrolysis, by bioprospecting and characterizing new enzymes, and by developing new enzyme mixtures. [42]. Moreover, the addition of an extra enzyme increases hydrolysis performance by increasing the release of fermentable sugars and reducing the time of hydrolysis.
LPMO (AfAA9_B) and Cellobiohydrolase GH6 (AfCel6A) from A. fumigatus and expressed in Escherichia coli and Aspergillus oryzae, respectively, have been described [35,43]. However, to evaluate the action of the combined enzymes, we characterized and analyzed their biochemical properties after expressing them in Pichia pastoris, and we detected some differences.

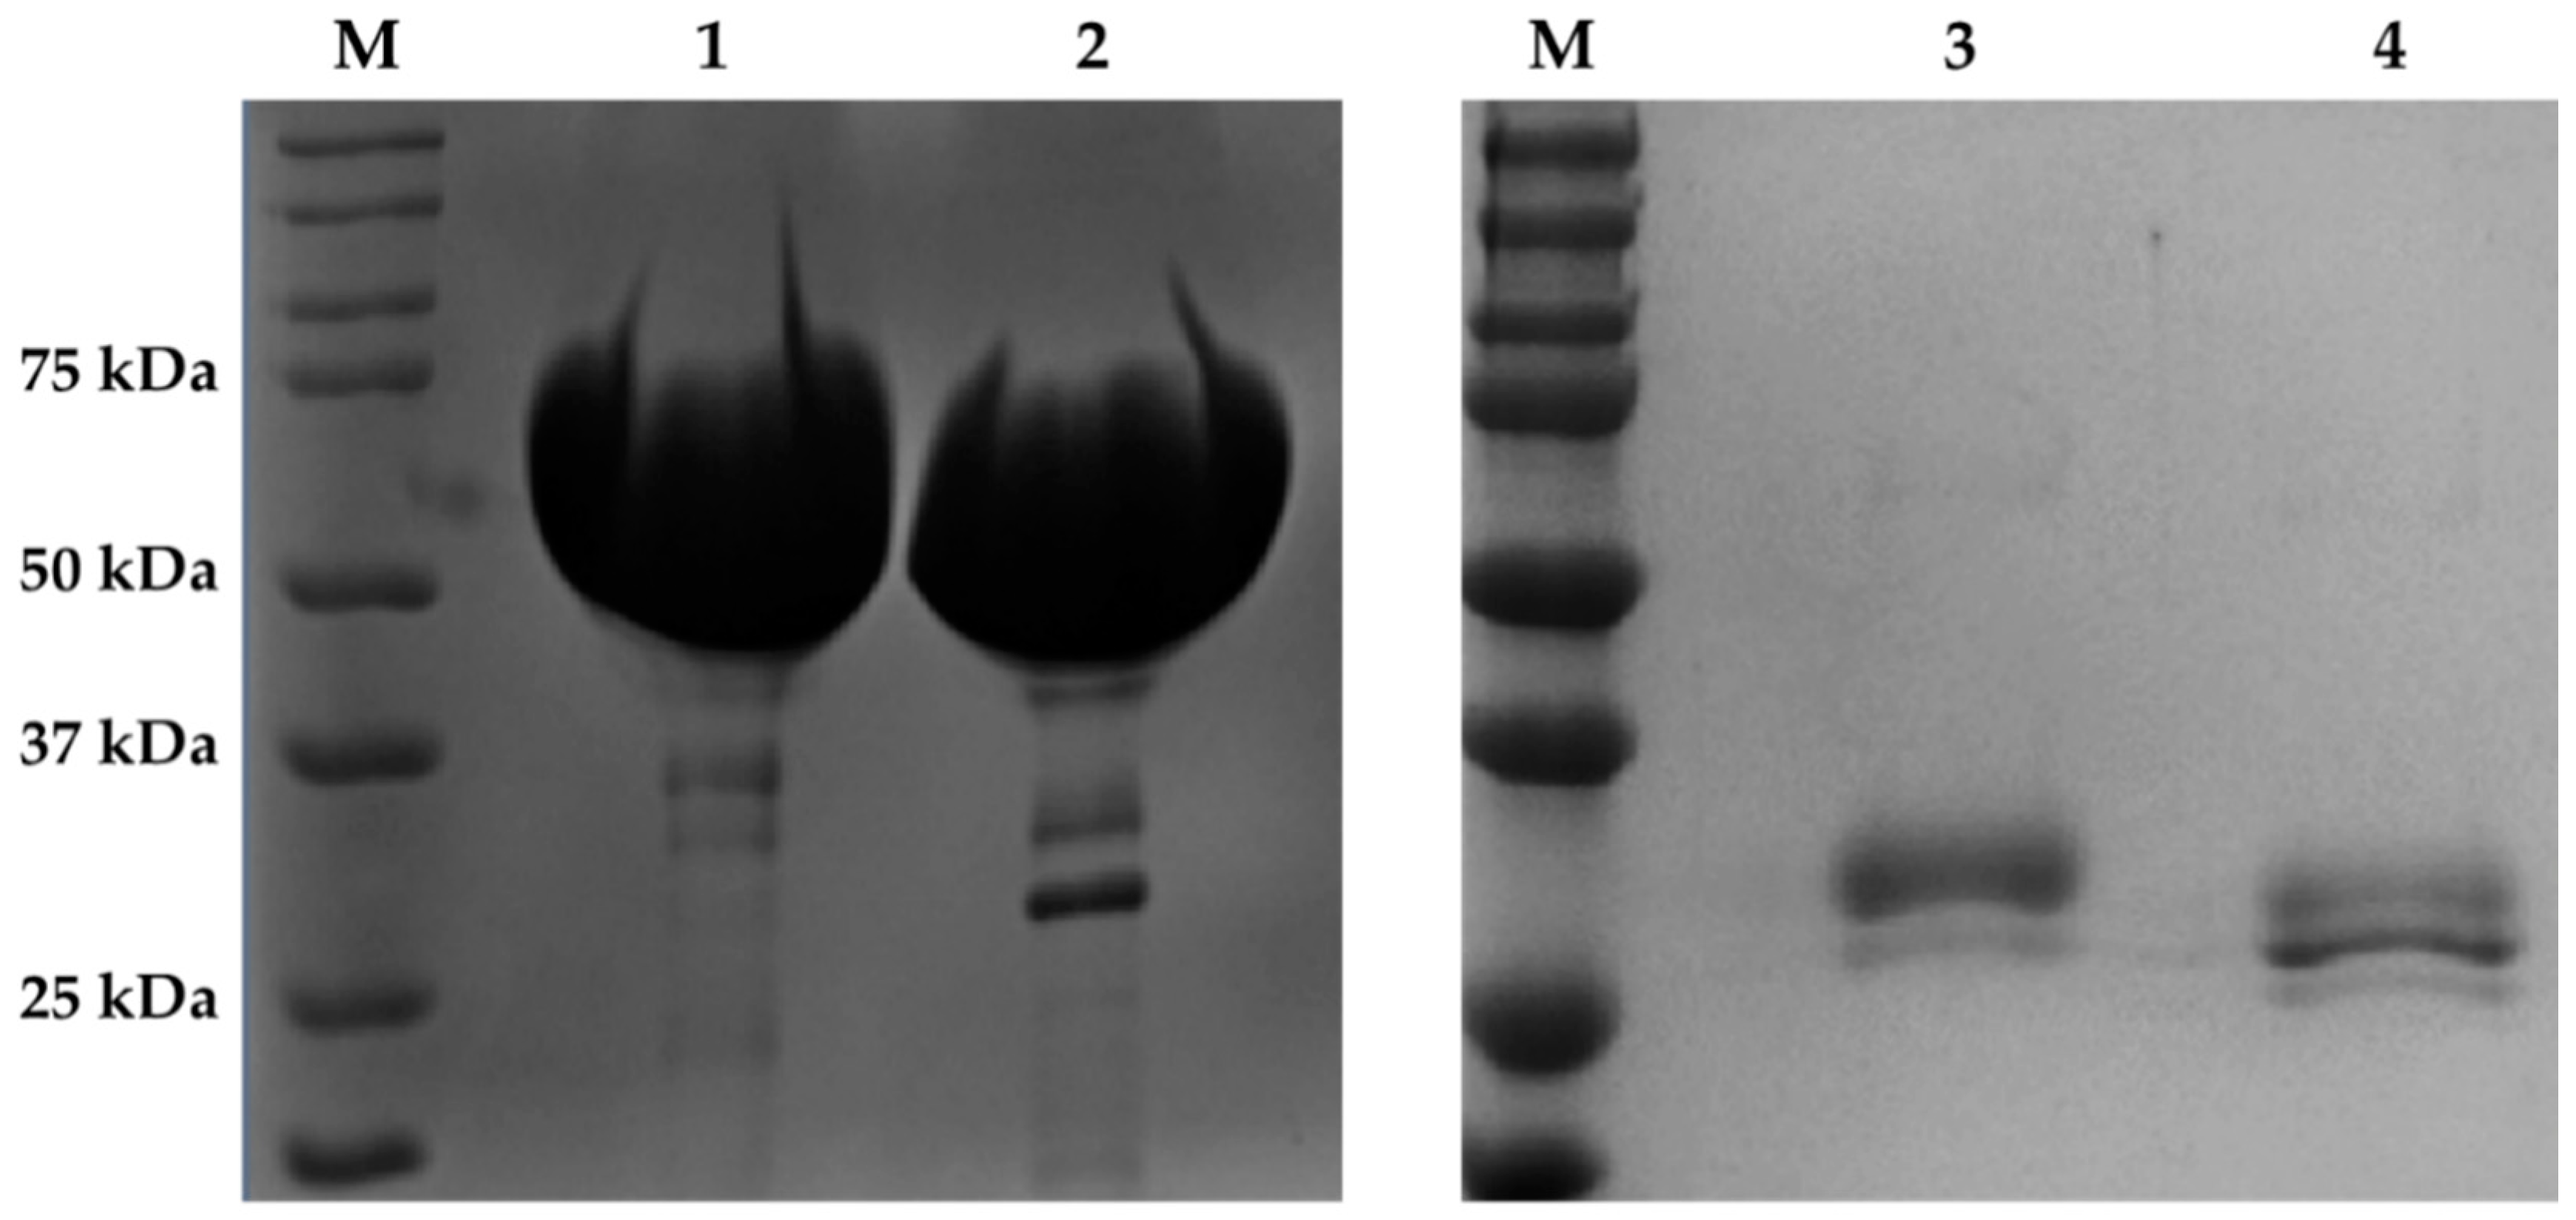
2.1. Expression and Purification of Recombinant AfCel6A and AfAA9_B

We successfully expressed recombinant AfCel6A and AfAA9_B in P. pastoris X-33. After induction for 144 h, we collected, concentrated, and purified the culture supernatants on Ni+ Sepharose 6 Fast Flow resin (Ge Healthcare, Little Chalfont, UK). SDS-PAGE revealed that the purified recombinant AfCel6A and AfAA9_B had apparent molecular masses of approximately 65 and 30 kDa, respectively (Figure 1). After Endo H treatment, the molecular mass of AfCel6A remained almost the same, while AfAA9_B migrated as a band of approximately 26 kDa. Analyses of potential N-glycosylation sites by the NetNGlyc 1.0 program (http://www.cbs.dtu.dk/services/NetNG lyc/) suggested that a potential site was present at position N413 in AfCel6A and N159 in AfAA9_B, confirmed by deglycosylation of the recombinant proteins by the enzyme Endoglycosidase H. The presence of N-glycans at different sites in the structure of the enzyme can influence enzymatic properties, such as secretion, folding, and stability, among others [44].
We excised the purified AfAA9_B from the gel and analyzed it on the LC-MS/MS Xevo TQS (Waters) system at the Multi-User Laboratory of Mass Spectrometry, which confirmed that the enzyme was LPMO (Table 1).

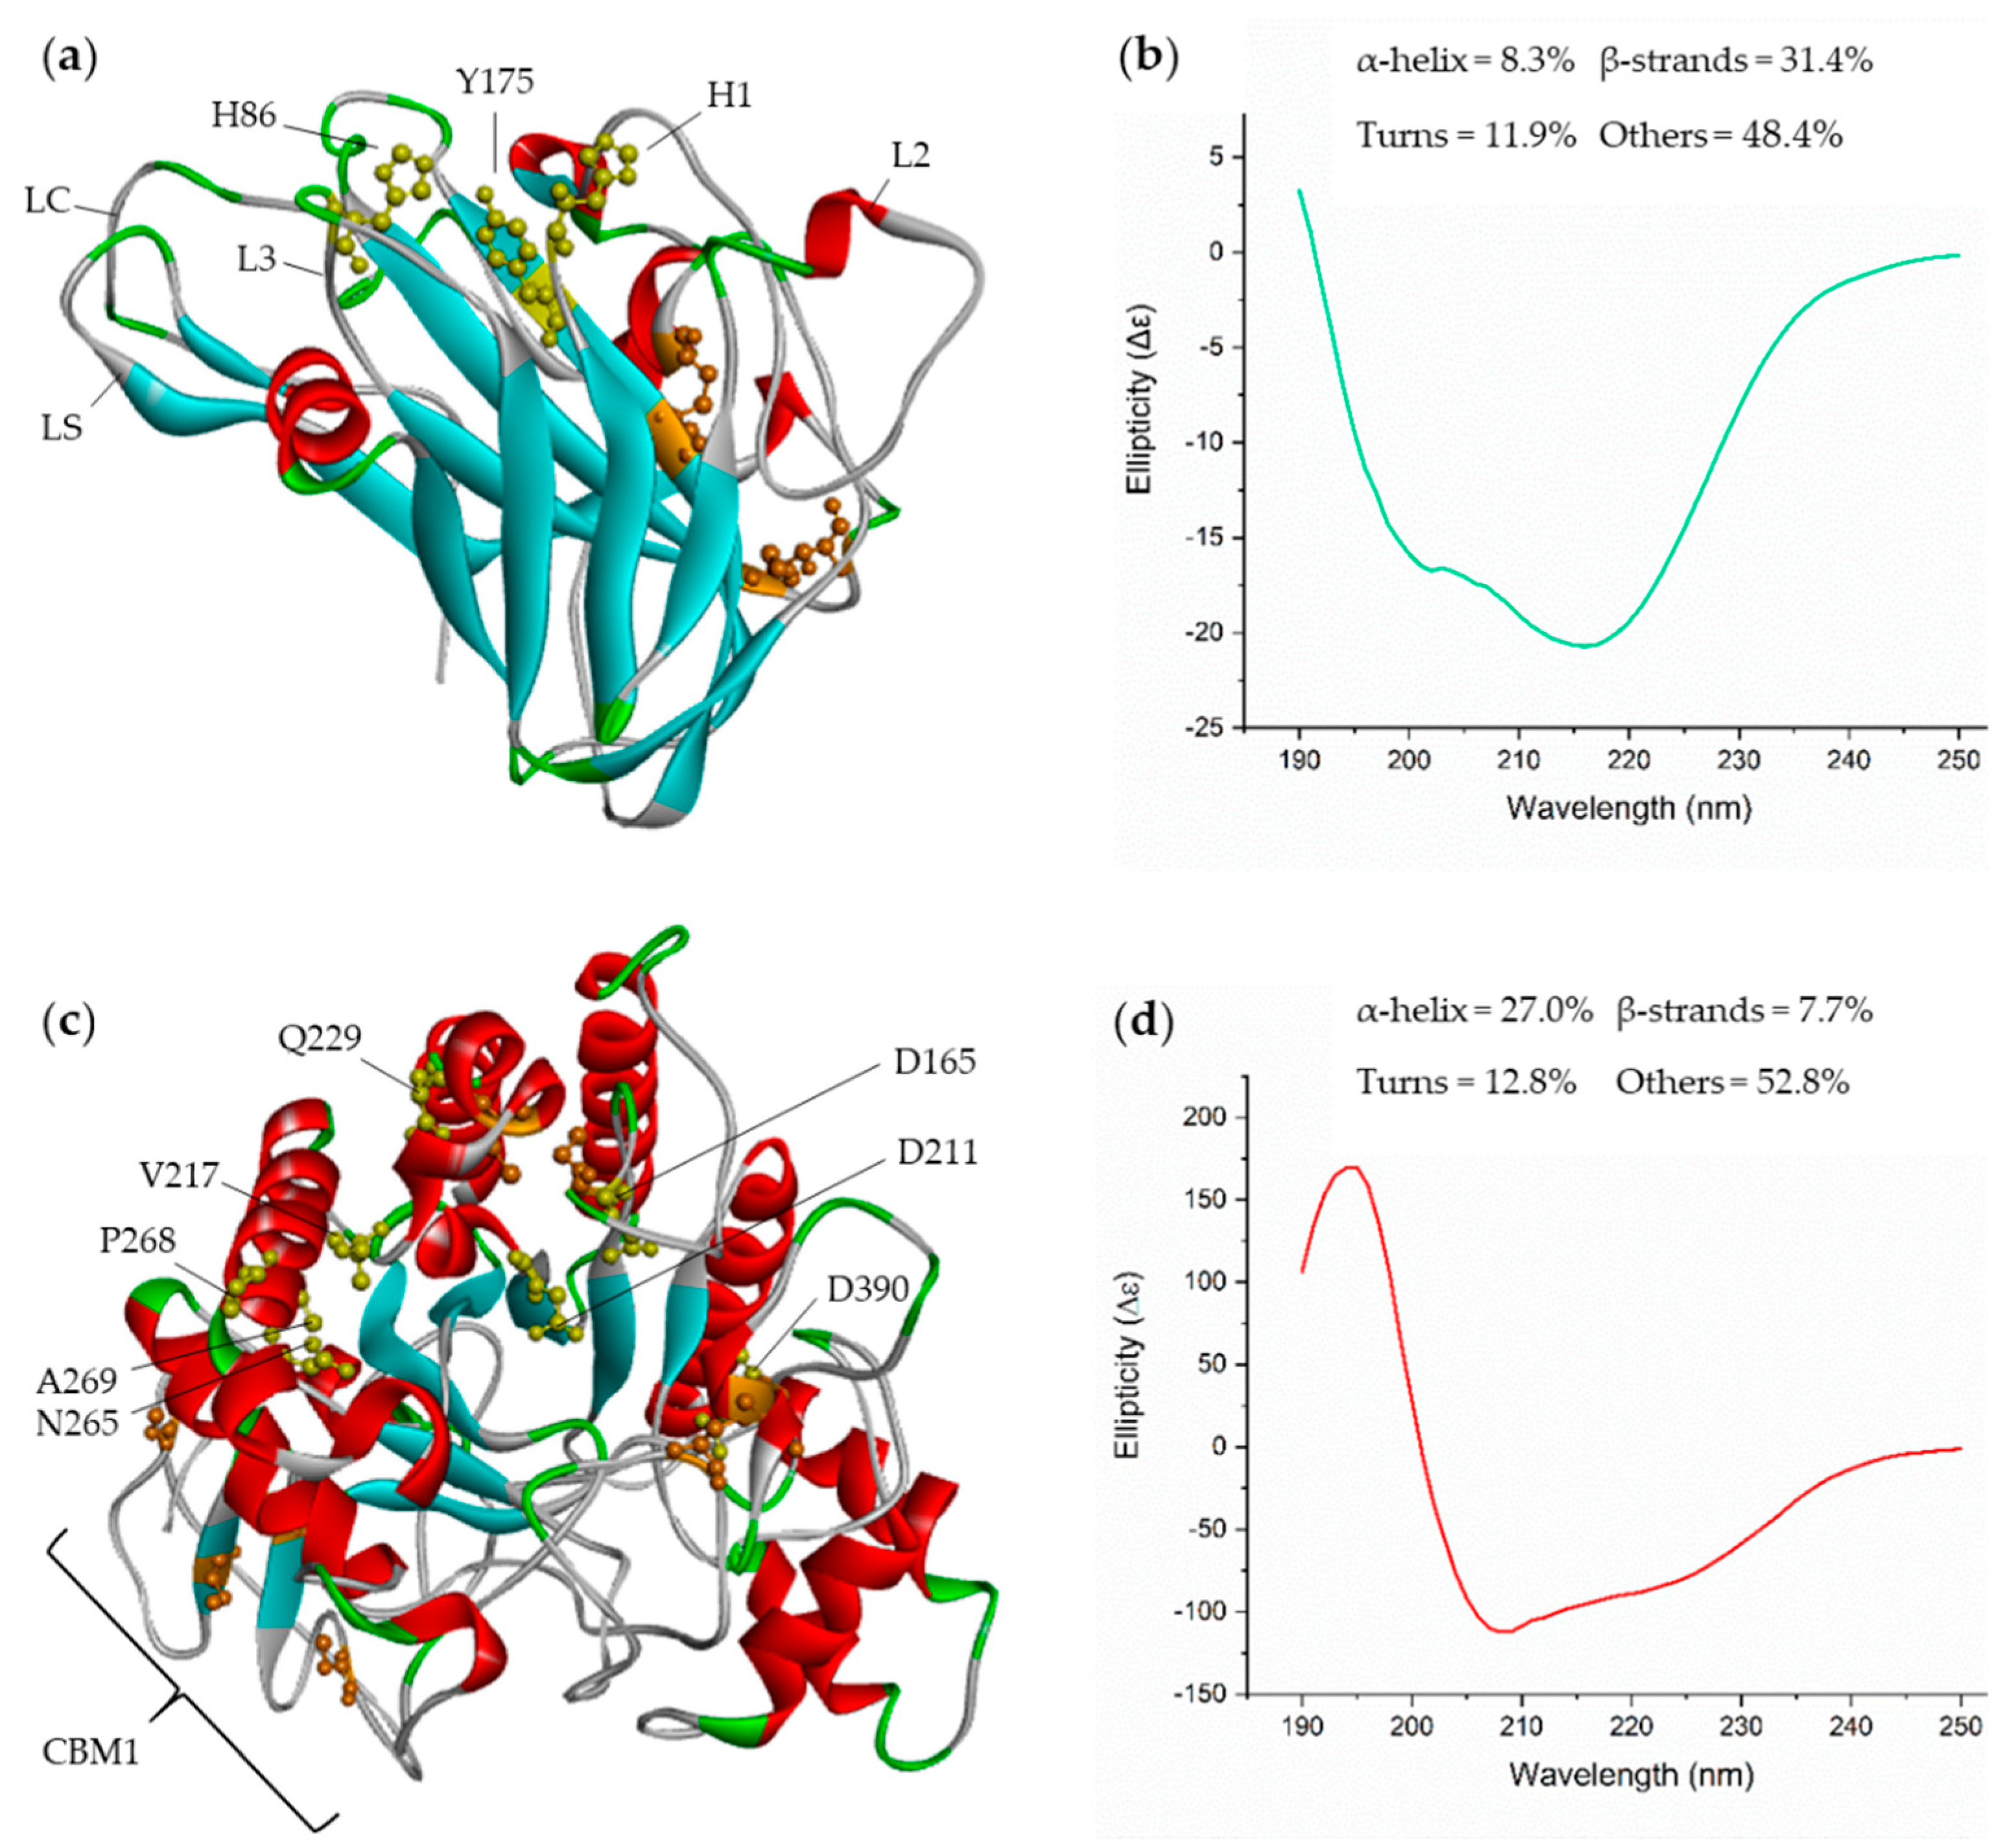
2.2. Structural Analysis and Predictions by Circular Dichroism (CD)

LPMOs comprise a group of redox enzymes that belong to the auxiliary activity (AA) class (families 9–16, except 12) [45] and which bear a β-sandwich core (presence of 8–10 β-strands). The catalytic region of the enzyme is known as histidine brace [21,24,46], which contains many loops and accounts for the active site topology and substrate specificity. Specificity is due to the presence of aromatic residues and their weak interactions with polysaccharides [22,47]. Figure 2a shows the crystallized structure of LPMO AfAA9_B (PDB: 5 × 6A), where the active site residues H1, H86, and Y175 in the histidine brace are highlighted.
Due to its tunnel-shaped catalytic structure, AfCel6A acts exclusively on nonreducing ends of cellulosic polymers. The cellulosic polymers enter this catalytic structure through one of their extremities, and AfCel6A continuously cleaves the long chains into small cellobiose units via anomeric inversion (Figure 2c). The enzymatic core consists of a distorted α/β-barrel motif. Few parallel β-strands in sandwich conformation are connected by several loops, which are rich in α-helices [48,49,50]. As depicted in Figure 2c, AfCel6A contains N-terminal CBM1 (carbohydrate-binding module) as well as the main residues involved in catalysis, namely Q229, P268, V217, N265, A269 [48], D165, D211, and D390 (determined by the Pfam database [51]).
Since the 1980s, thousands of three-dimensional protein structures have been resolved and deposited in the Protein Data Bank (PDB), allowing more detailed insights into the structure and function of proteins, including protein complexes [52]. However, performing structural studies under the conditions in which proteins actually operate (i.e., generally in solution), as well as under other conditions, is crucial, and providing measures of the rates of structural changes in proteins, which are often essential to their biological function [52], is vital. Circular dichroism (CD) has become increasingly recognized as a valuable structural technique for addressing these issues [52]. In this sense, the first important information to be obtained is whether the structure of the expressed proteins in solution corresponds to crystal or modeled structures. To this end, we obtained the secondary structure content on the basis of on circular dichroism spectra, from which we predicted the secondary structures of the enzymes by using BESTSEL [53]. This analysis showed substantial structural similarity between the enzymes and their templates from PDB:5X6A resolved by Q. Shen (unpublished) (for AfAA9_B) [54] and Phyre2 web server [55] (for AfCel6A), as displayed in Figure 2 and Supplementary Table S1.
The CD spectrum of AfAA9_B and its predicted secondary structures (Figure 2b) demonstrated that the enzyme consisted of 8.3% α-helices and 31.4% β-strands. These values reinforced that LPMOs present a large number of β-strands in their cores, reflected by the well-defined negative peak at 218 nm, the small peak at 190 nm, and the approximated single band profile. Small negative peaks around 208 nm also evidenced the small number of helices [56]. Compared to the expected values based on the PDB: 5X6A structure, the percentage of β-strands was exactly the same, while the percentage of α-helices was −4.3%. TaLPMO9A (PDB: 2YET) [26], an LPMO from Thermoascus aurantiacus, has been reported to share 71% identity with AfAA9_B and to present similar proportions of α-helices and β-strands: 30.8% and 15.0%, respectively.
AfCel6A presented 27.0% α-helix and 7.7% β-strands, as estimated by BeStSel (Figure 2d). The accentuated peak at 190 nm and the two negative peaks near 208 nm and 222 nm indicated a large number of α-helices. The absence of a negative peak at approximately 218 nm and a single band profile are typical of proteins with low content of β-strands [56]. On the basis of the proportions of α-helices and β-strands estimated by Phyre2 [55] and the Kabsch and Sander method [57] for the modeled structure (Figure 2c), the differences were −4.3% and −1.0%, and −1.0% and −2.3%, respectively. The enzyme Cel6A from Trichoderma reesei (PDB:1QJW), which shares 69% identity, presents a similar proportion of 35.8% α-helices and 8.7% β-strands [58]. Furthermore, a cellobiohydrolase from a different A. fumigatus strain that shares 99% identity with AfCel6A consists of 26.0% α-helix and 15.4% β-strands, confirming that the prediction based on the CD spectrum is remarkably close.
Therefore, CD analysis of both enzymes obtained herein evidenced that their secondary structure profiles resembled the profiles described in the literature. This indicated that both enzymes were correctly folded during heterologous expression, and that their structures were maintained after they were purified.
Confirming that the structure of wild enzymes in solution corresponds to the structure obtained by crystallography or modeling allows enzymes to be efficiently improved by protein engineering. To increase the catalytic efficiency of cocktails, alterations modeled on the protein structure can be accompanied by spectroscopic studies in solution, allowing improved activity to be directly associated with conformational changes in the structure of the enzyme.

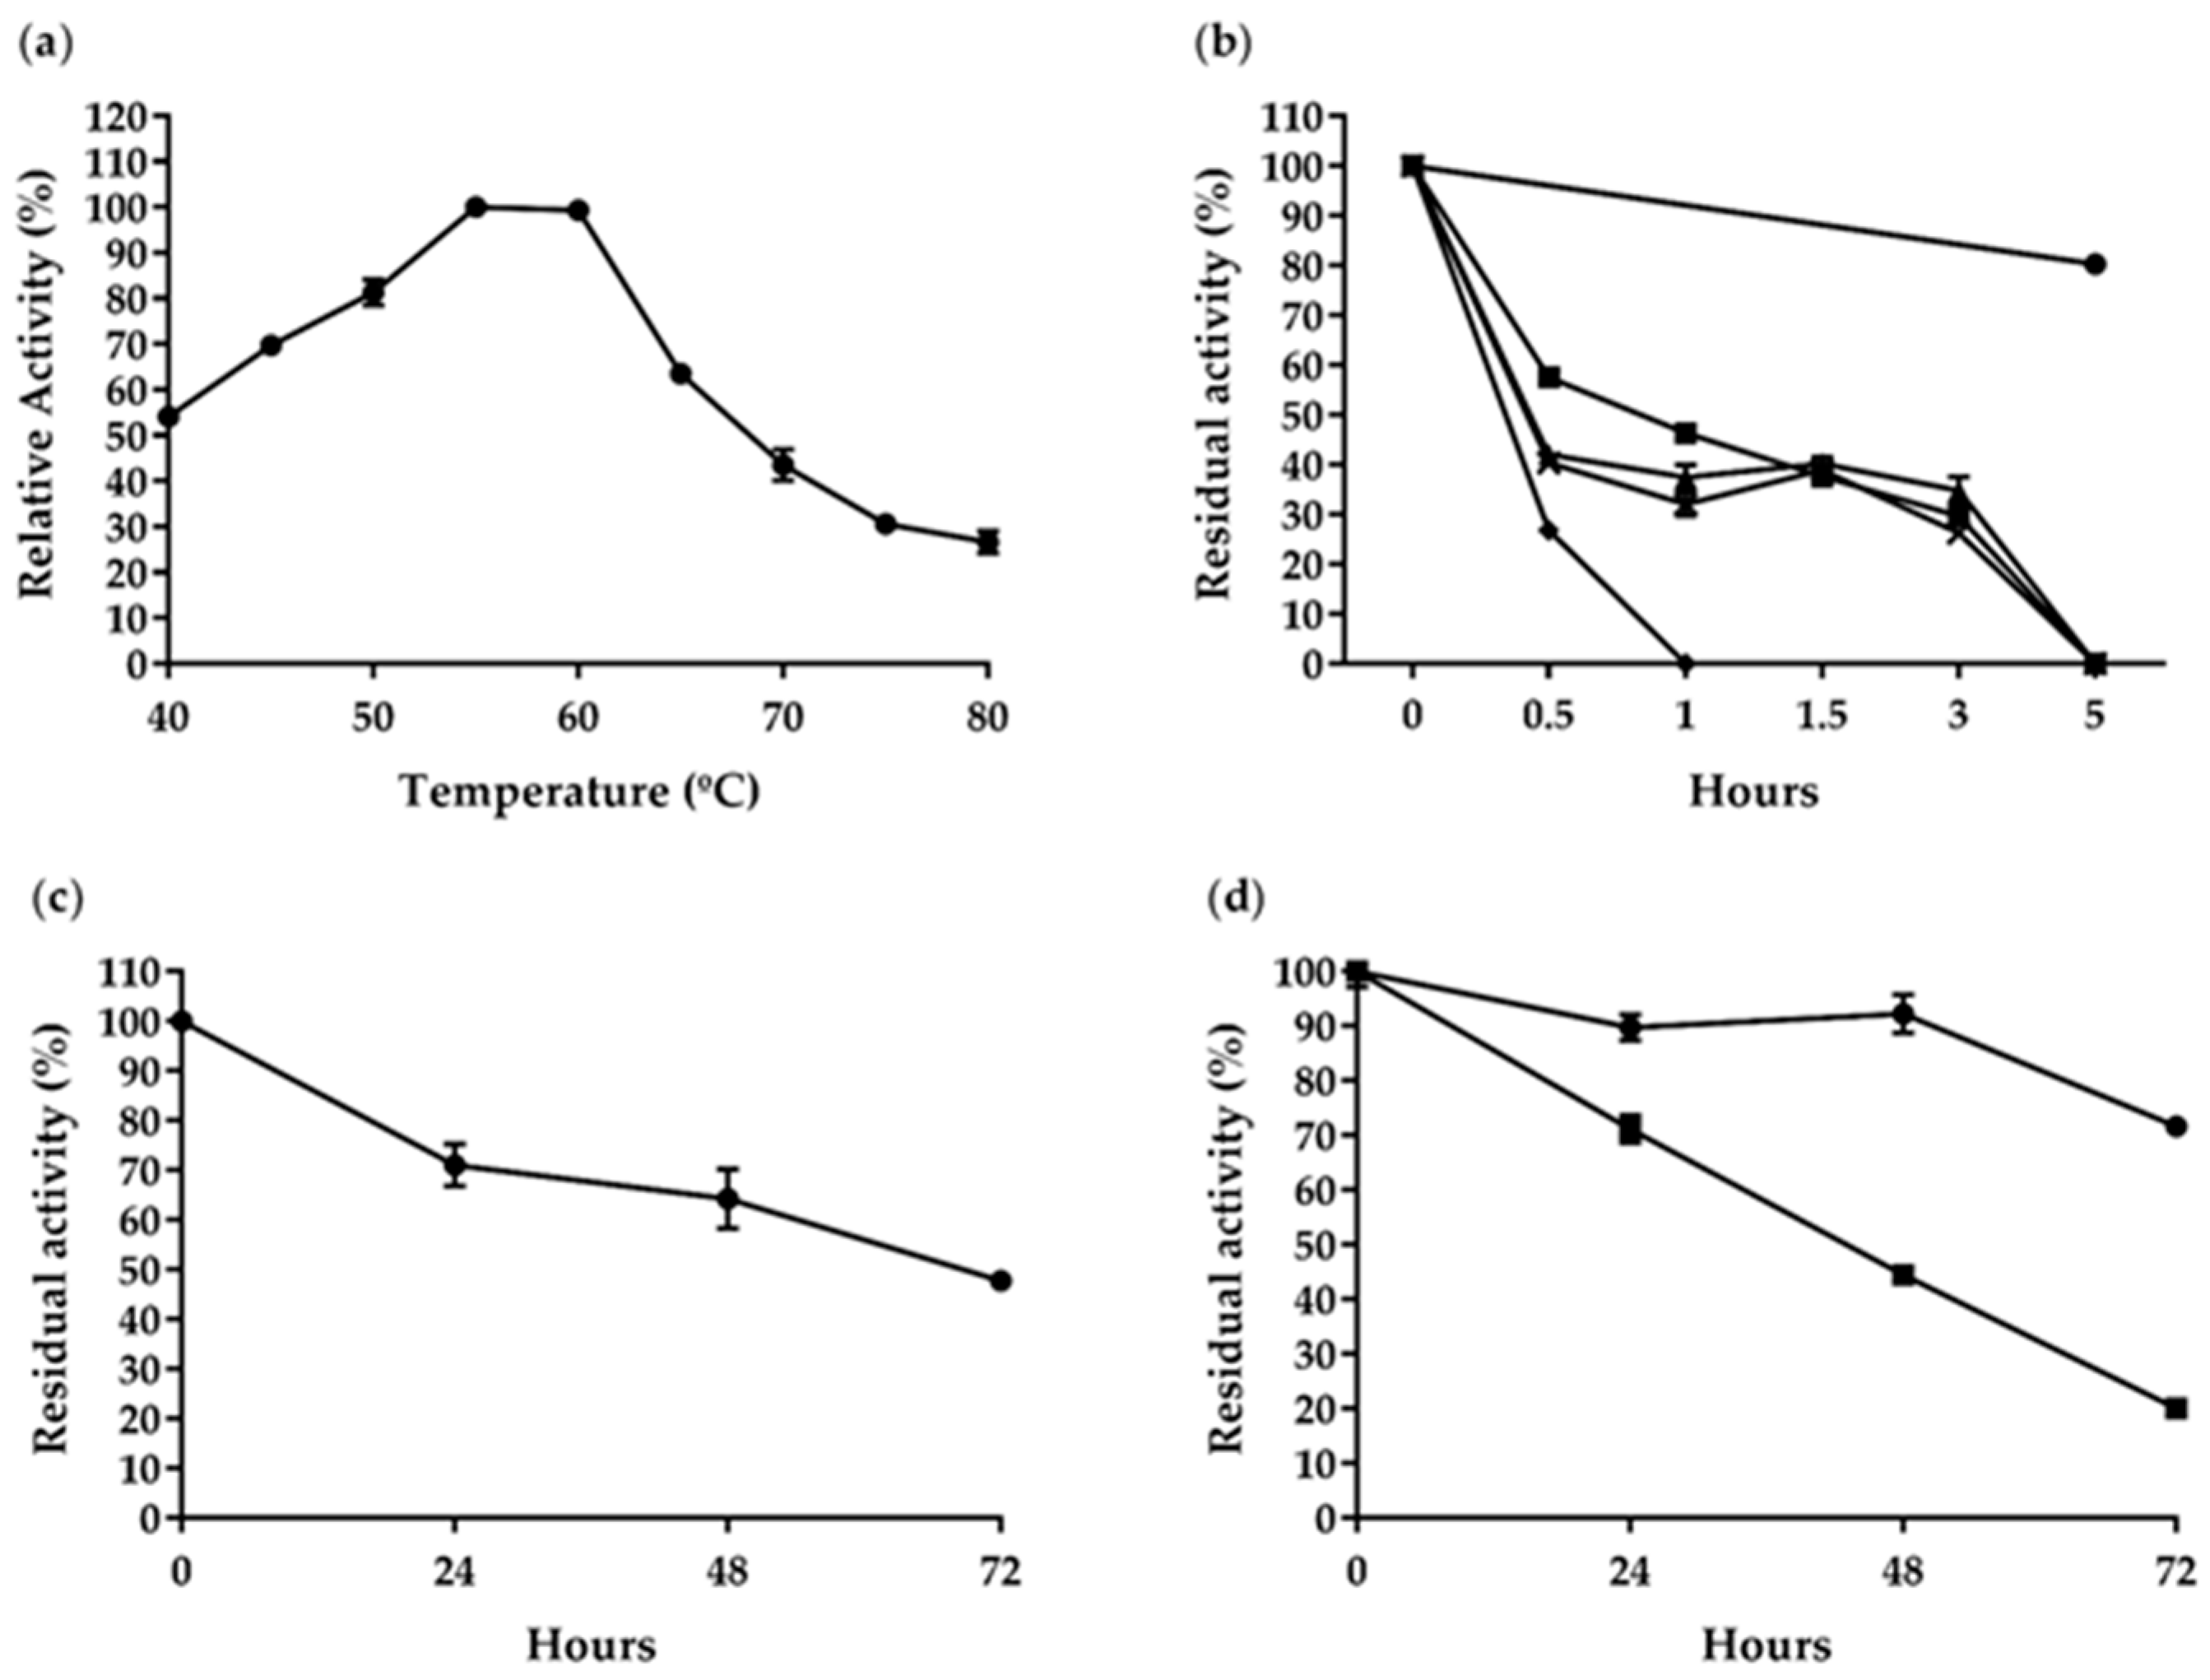
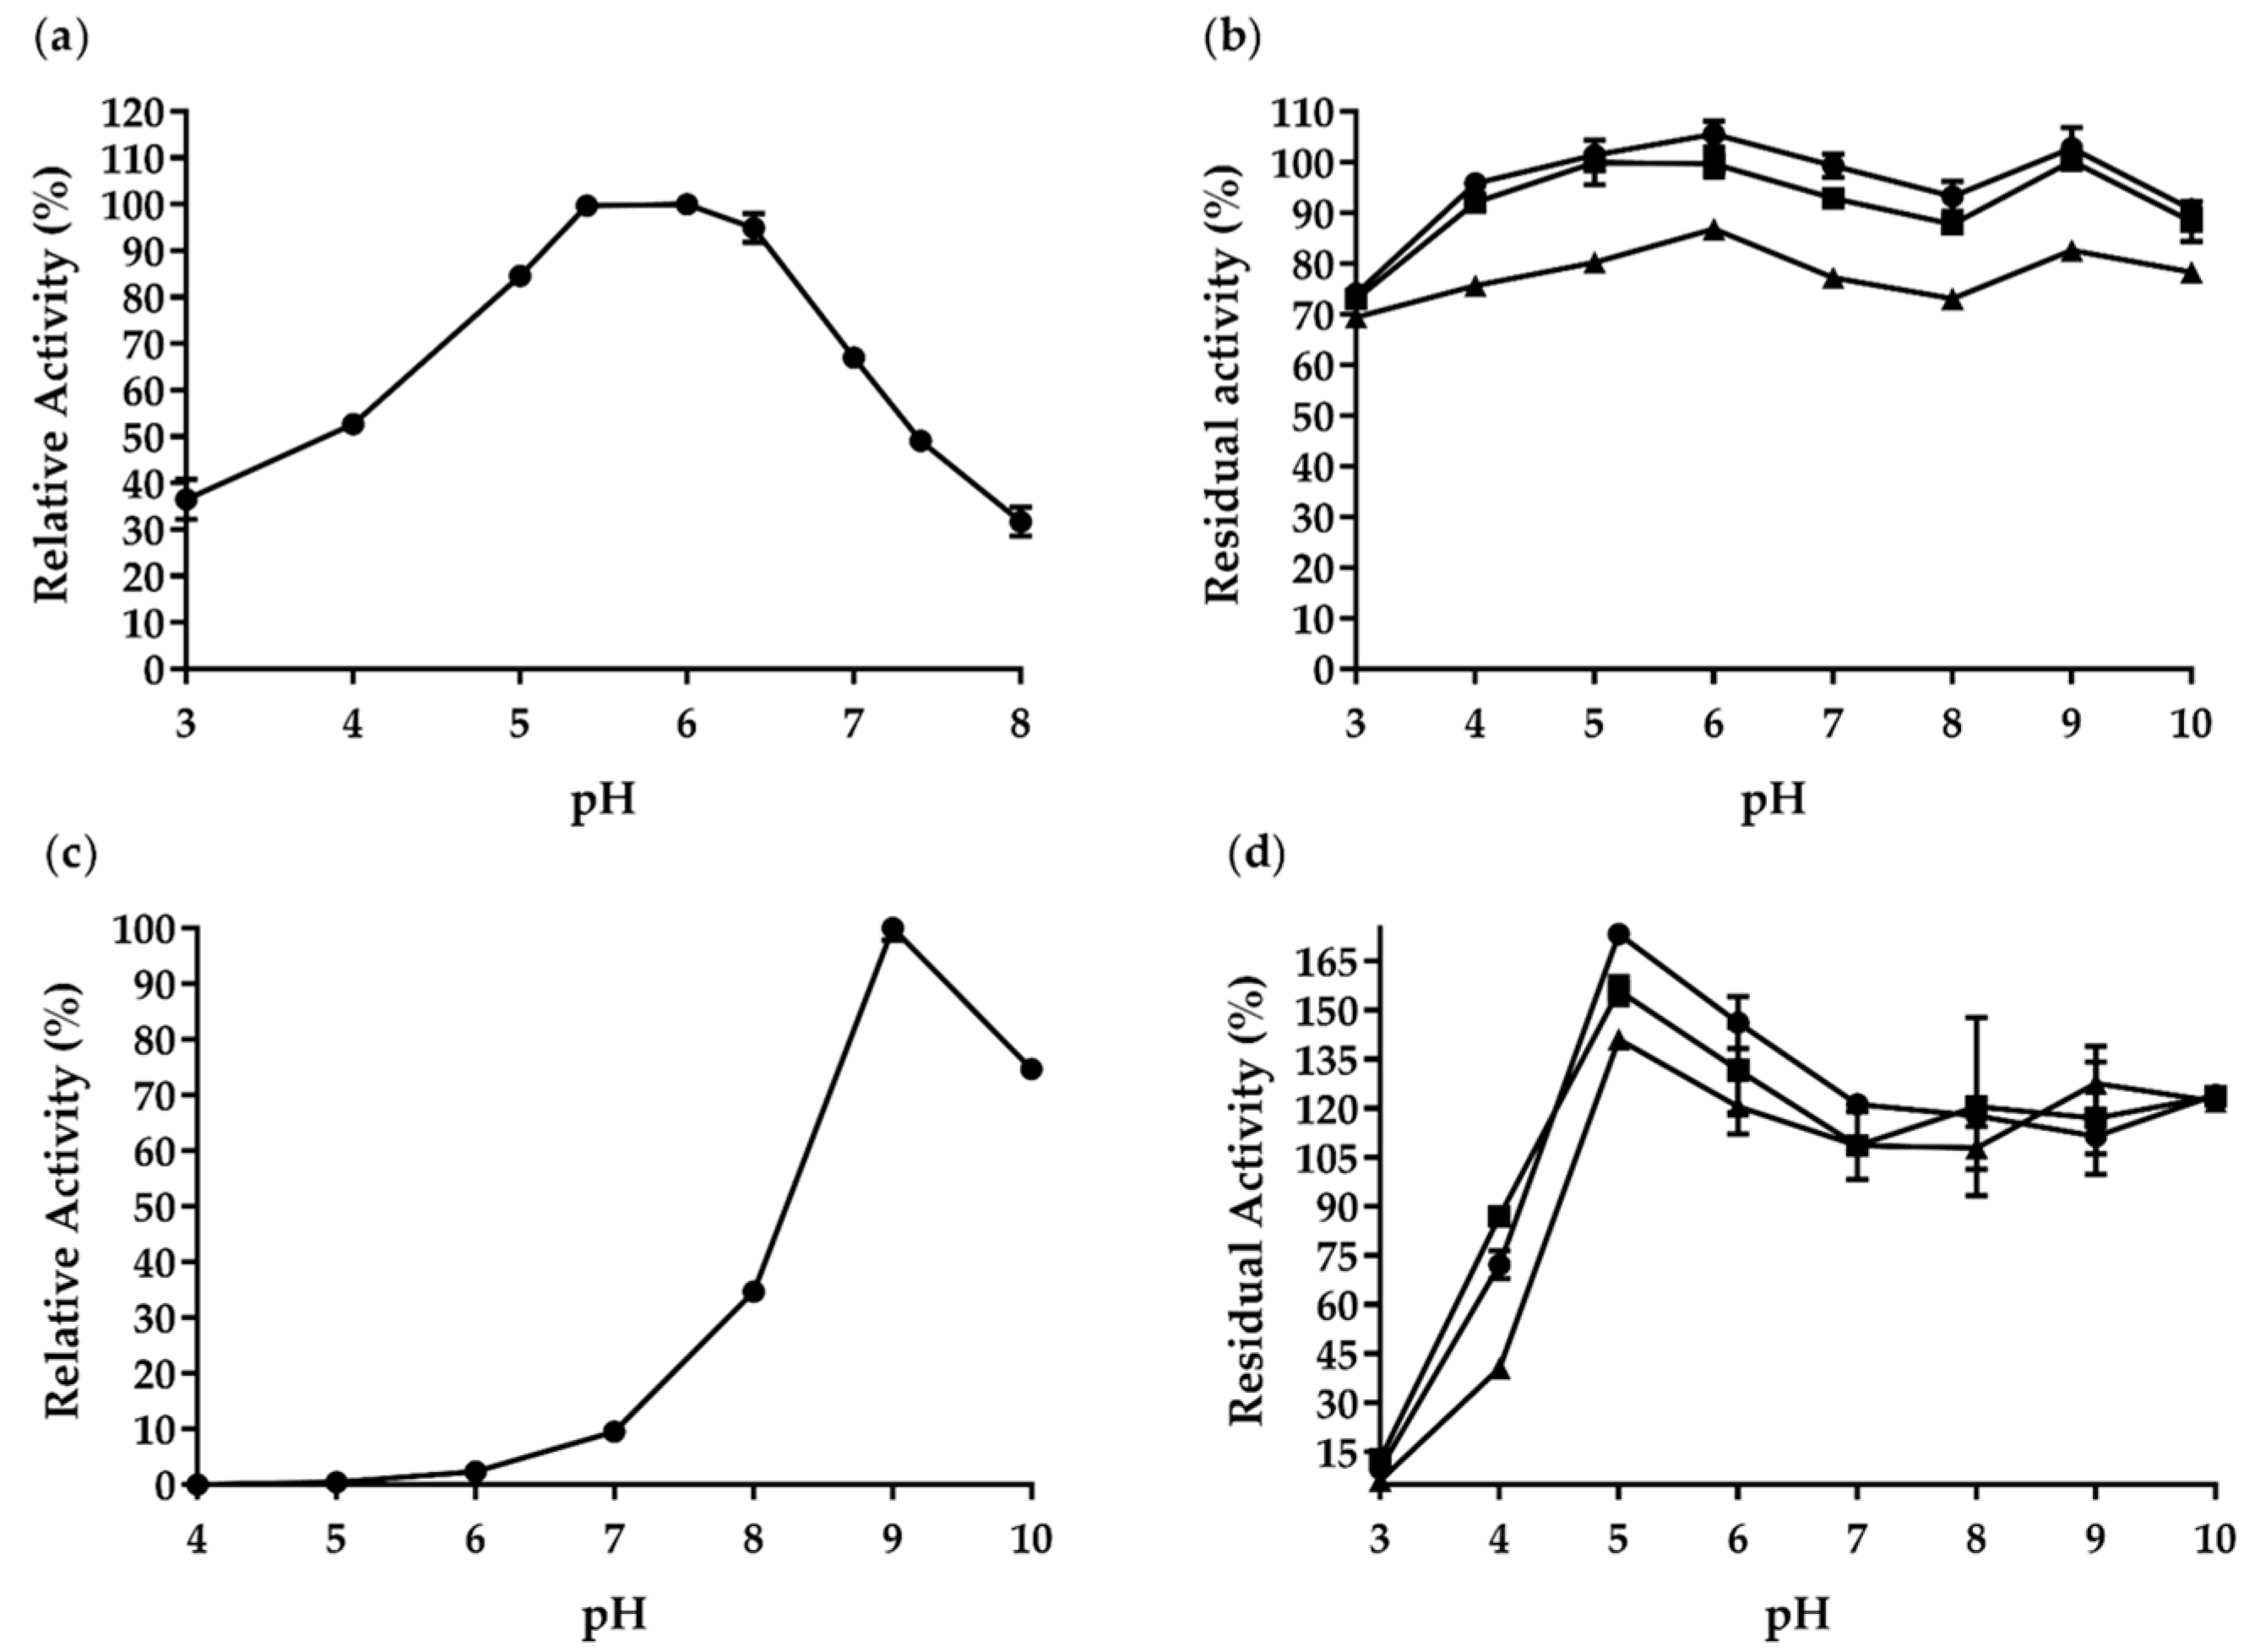
2.3. Enzymatic Properties of AfCel6A and AfAA9_B

We used CM-Cellulose and 2,6-DMP as substrates to determine the enzymatic properties of AfCel6A and the activity of AfAA9_B, respectively.
The optimal temperature for AfCel6A activity was 55–60 °C, and the enzyme retained over 54% of the maximum activity between 40 and 65 °C. At 70, 75, and 80 °C, AfCel6A maintained 43.5%, 30%, and 26% of the maximum activity, respectively (Figure 3a). Most characterized cellobiohydrolases, shown in Table 2, were also active at these temperatures. We studied the AfCel6A thermal stability after preincubating it at 50, 60, 70, 80, or 90 °C for different times (Figure 3b). The enzyme was stable after 30 min and retained 57.5%, 42.0%, 40.4%, and 26.9% of the initial activity at 60, 70, 80, and 90 °C, respectively. AfCel6A maintained about 30% of the initial activity at 60–80 °C. However, the enzyme was completely inactivated after 5 h at 60–80 °C. AfCel6A was stable at 50 °C. It lost only 30% of its original activity after 24 h and retained 64.2% and 47.7% of its initial activity after 48 and 72 h, respectively (Figure 3c). These results showed that AfCel6A was stable at high temperatures, especially at 50 °C. In another study, after expression in A. oryzae, AfCel6A was stable at 60 °C, but it completely lost its activity at 70 °C [35]. Therefore, AfCel6A was more stable after expression in P. pastoris than in A. oryzae.
The optimal temperature for AfAA9_B activity was 60 °C (data not shown). AfAA9_B was stable at 50 and 60 °C and retained over 75% and 20% of its initial activity, respectively (Figure 3d). Like AfAA9_B, other LPMOs were stable at 50 and 60 °C; e.g., PMO9D_SCYTH, PMO9D_MALCI, MtLPMO9D, MtLPMO9J, and MtLPMO9A (Table 3).
Figure 4 illustrates how pH influenced AfCel6A and AfAA9_B. The highest AfCel6A activity emerged at pH 5.5–6.0, but it was active in a narrow pH range (pH 4.0–7.5) and retained >50% of maximum activity therein (Figure 4a).
Many cellobiohydrolases seem to belong to the class of acidic enzymes, with optimal pH ranging from 3.9 to 6.0; for example, CBH II from Talaromyces emersonii (pH 3.8), Cel6D (pH 3.9), CBH II from Chaetomium thermophilum (pH 4.0), CBH II from Penicillium occitanis (pH 3.0–5.0), CBH II from Trichoderma viride (pH 5.0), J11 CelA (pH 6.0), and EX4 (pH 5.0). Only one GH6 has been classified as active at pH 9.0: MoCel6A from Magnaporthe oryzae (Table 2).
We also investigated AfCel6A pH stability (Figure 4b). Notably, AfCel6A was stable at pH ranging between 3 and 10 and retained over 70% of its original activity after 72 h. Compared to other GH6 cellobiohydrolases, AfCel6A was more stable over a wide pH range, whereas others had narrower range of pH stability—CBH II from Talaromyces emersonii (38 min at pH 5.0), Cel6D (over 60% activity at pH 4.0–6.0 and 47 °C and complete inactivation at pH 4.0 and 55 °C), CBH II from Penicillium occitanis (24 h at pH 2.0–9.0), J11 CelA (1 h), and EX4 (over 80% activity at pH 3.0–8.0 at 60 °C for 1 h).
AfAA9_B showed the highest activity at pH 9.0. At pH 10.0, it retained >74.0% of its activity (Figure 4c). The optimal AfAA9_B pH was pH 9.0, but this enzyme was stable at pH ranging between 5.0 and 10.0 and maintained 100% of the original activity after 72 h (Figure 4d). Compared to PMO9D_SCYTH (pH 7.0) and PMO9D_MALCI (pH 9.0), AfAA9_B was more stable, whereas the former LPMOs were stable at a specific pH (Table 3).

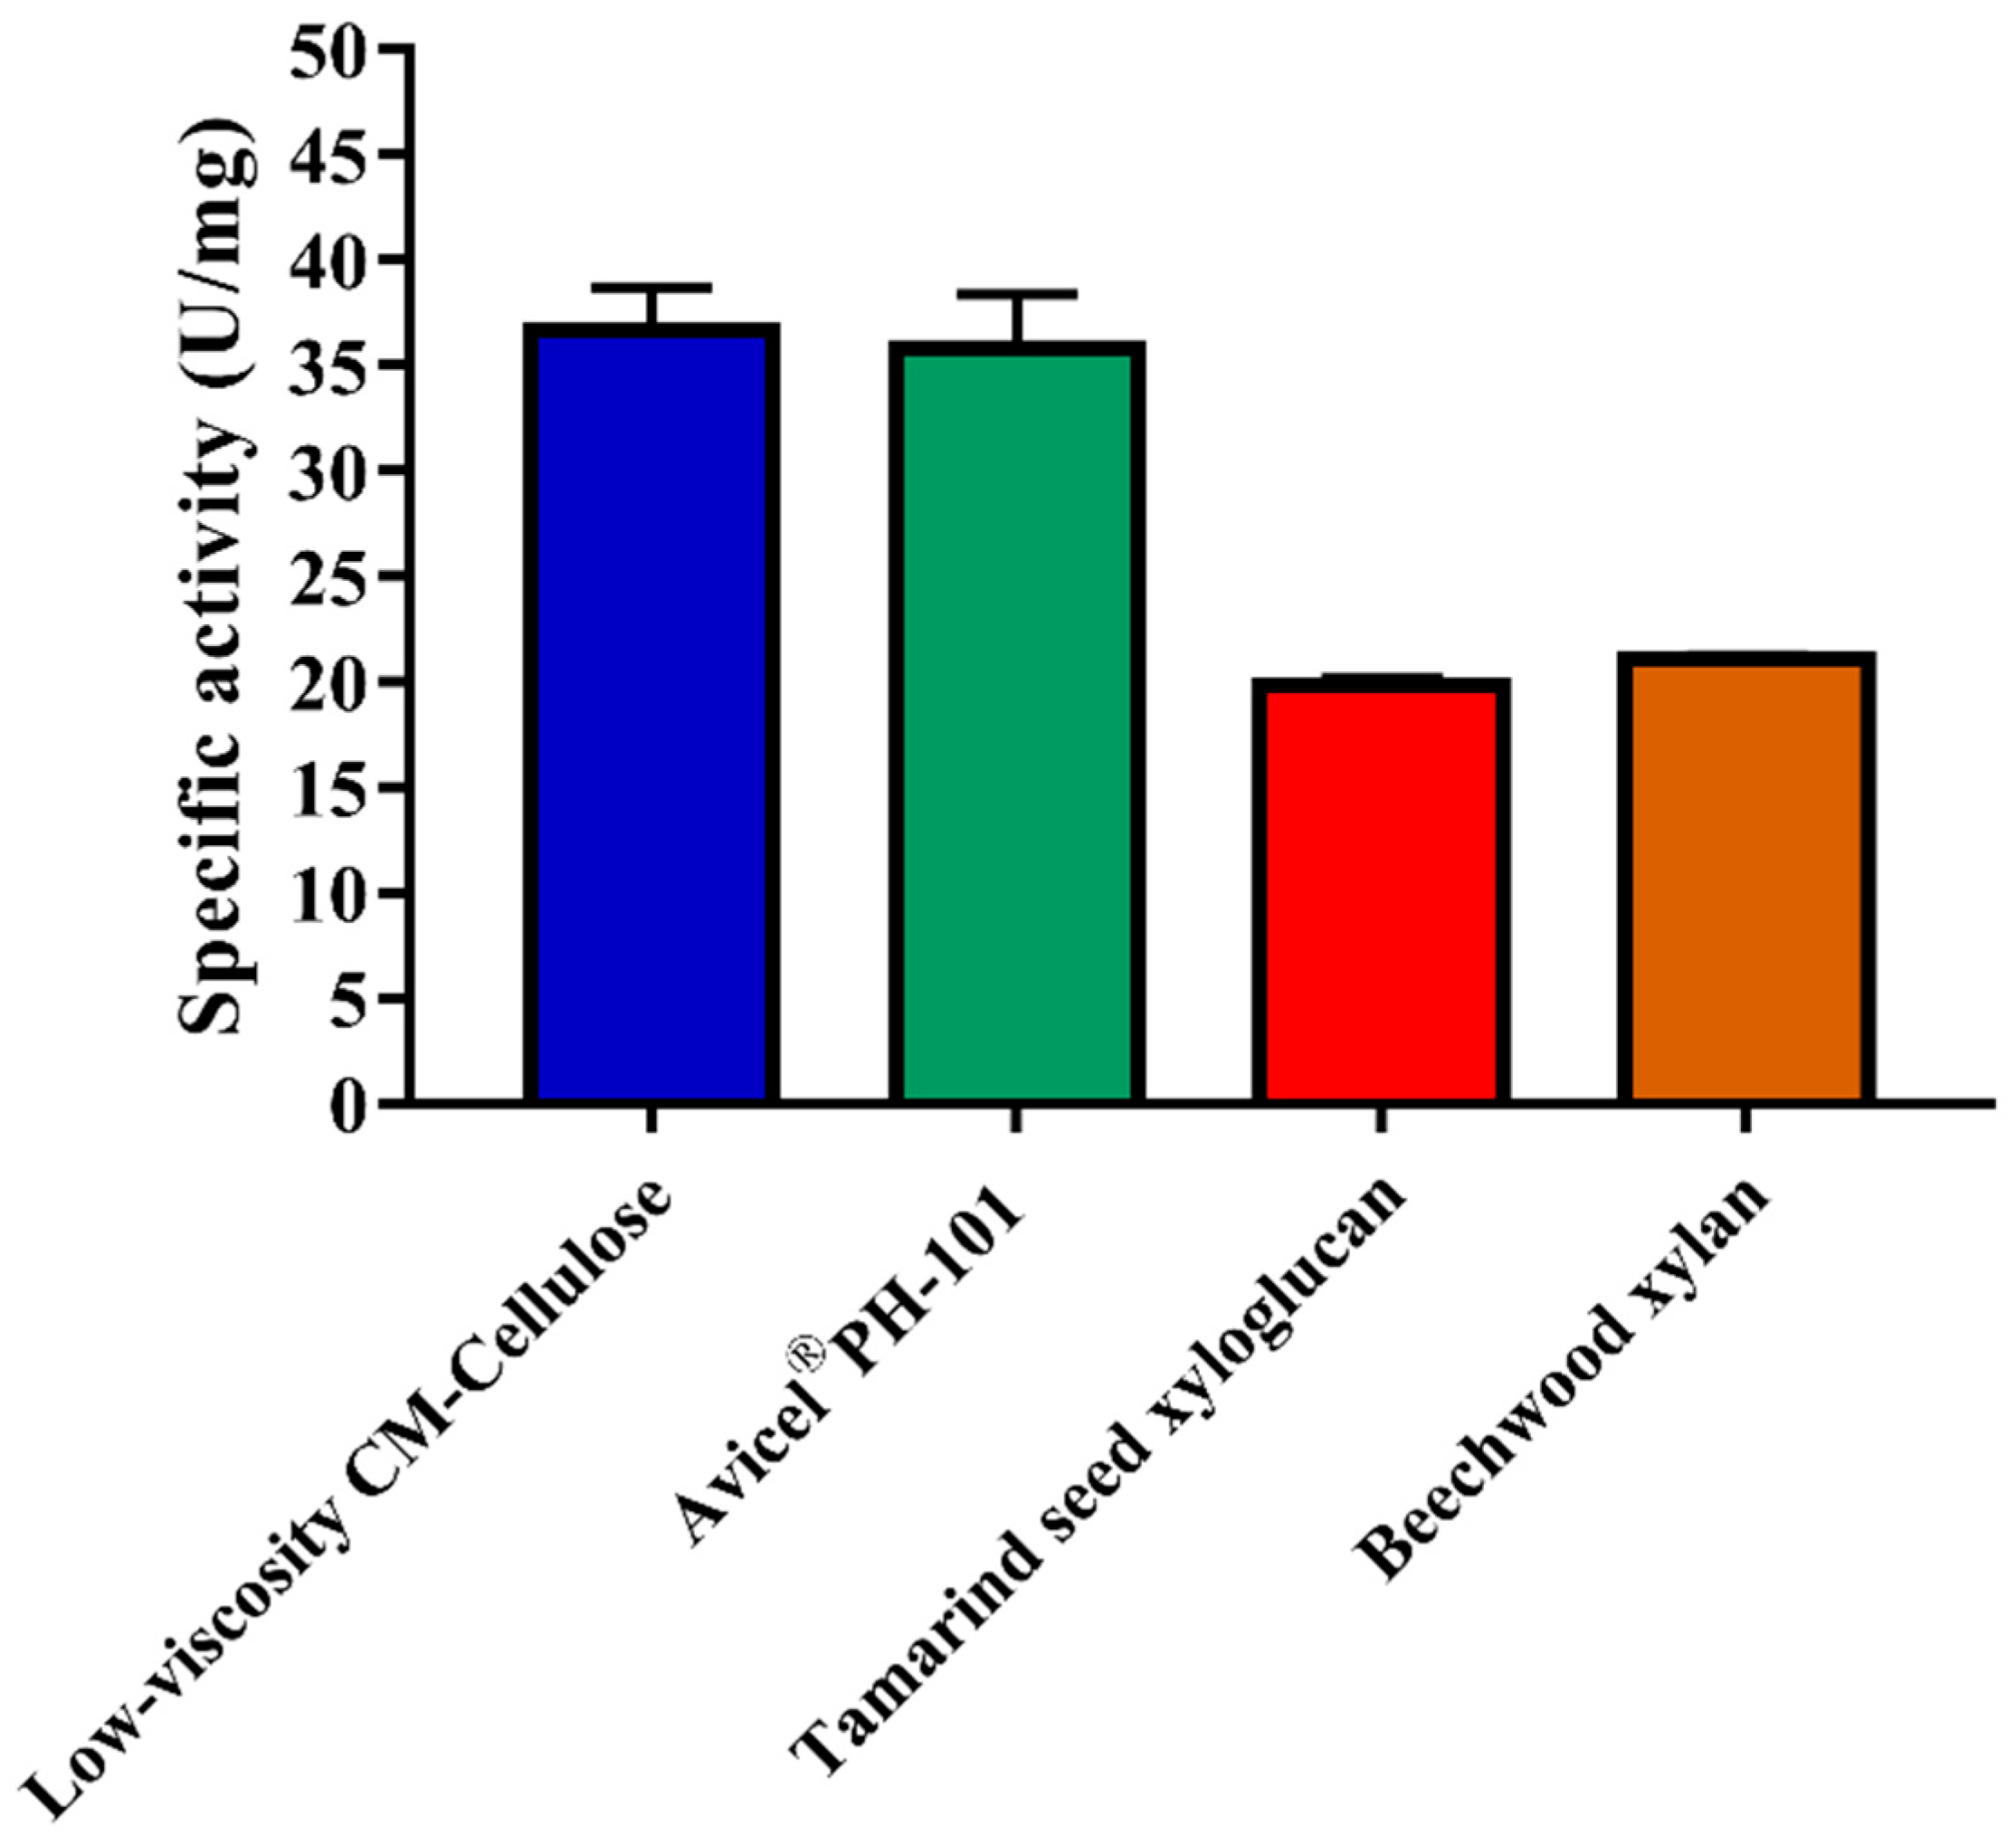
2.4. Substrate Specificity and Kinetic Parameters

AfCel6A exhibited broad substrate specificity, including CM-Cellulose, Avicel®, xyloglucan, and birchwood xylan. This enzyme displayed higher specific activities toward CM-Cellulose (36.6 ± 2.1 U mg−1) and Avicel® (35.8 ± 2.6 U mg−1) than birchwood xylan (21.1 ± 0.1 U mg−1) and xyloglucan (19.9 ± 0.3 U mg−1) (Figure 5). When CMC was the substrate, purified AfCel6A had KM, Vmax, and kcat/KM of 7.44 ± 0.51 g L−1, 195.2 ± 4.65 U mg−1, and 19.9 mL mg−1 s−1, respectively (Table 2).
We evaluated recombinant AfAA9_B peroxidase activity toward the chromogenic substrate 2,6-DMP and the co-substrate H2O2, according to Breslmayr et al. (2018) [80], with some modifications. Table 3 summarizes the kinetic parameters determined when the reactions were carried out at pH 6.0 or 9.0 and 50 °C.
The Vmax values were higher at pH 9.0 for both the substrate (1481 ± 72.19 U g−1) and the co-substrate (972.5 ± 28.31 U g−1). Since we performed the saccharification tests at pH 6.0, we also determined the kinetic parameters under these conditions. At this pH, Vmax was 78.52 ± 3.33 U g−1 for the substrate and 49.26 ± 4.48 U g−1 for the co-substrate. These results were expected because pH 9.0 was optimal for AfAA9_B activity.
Compared to the kinetic parameters described for other LPMOs, AfAA9_B had lower KMapp (0.79 µM) than PMO9D_SCYTH (0.51 mM), PMO9D_SCYTH (0.51 mM), and PMO9D_MALCI (1.17 mM), which showed that AfAA9_B had higher binding affinity for 2,6-DMP (Table 3).

2.5. Effect of Different Metal Ions and Chemicals

Cellobiohydrolases are commonly used in many industrial processes. The effects of additives and products of cellulose hydrolysis on the activity of these enzymes must be considered during operation on an industrial scale.
Table 4 depicts how different ions and reagents influence CM-Cellulose hydrolysis by purified AfCel6A. At 5 mM, MnCl2 (189.25 ± 2.33%), DTT (150.68 ± 5.29%), CoCl2 (116.75 ± 1.36%), FeSO4 (125.83 ± 3.61%), β-mercaptoethanol (134.24 ± 1.02%), AgNO3 (179.27 ± 20.04%), and ascorbic acid (121.40 ± 2.55%) stimulated AfCel6A activity. EDTA, DMSO, SLS, Triton X-100, Tween 20, CaCl2, MgSO4, KCl, and (NH4)2SO4 practically did not affect AfCel6A activity. On the other hand, SDS inhibited the enzyme by approximately 50%. The fact that β-mercaptoethanol and DTT boosted AfCel6A activity by 134.64% and 150.68%, respectively, suggested that the presence of sulfhydryl groups such as the ones from cysteine residues in the active site is important for enzymatic catalysis [81].
As for AfAA9_B, SLS (115.3 ± 0.7%), SDS (107.8 ± 4.8%), Tween 20 (103.7 ± 9.6%), DMSO (108.3 ± 1.5%), MgSO4 (113.9 ± 1.9%), and KCl (107.5 ± 2.1%) did not inhibit this enzyme. DTT, EDTA, CoCl2, FeSO4, and AgNO3 completely inhibited AfAA9_B. β-mercaptoethanol, ZnSO4, and CuSO4 decreased AfAA9_B activity by 70%. MnCl2, CaCl2, and (NH4)2SO4 affected AfAA9_B little.
We described that cellobiohydrolases act on short cellulose molecules and cellooligosaccharides, releasing disaccharide units, such as cellobiose [35]. Cellobiose is the major product of cellulose hydrolysis by cellobiohydrolases, whereas glucose is the final product of cellulose hydrolysis.
Product inhibition can affect lignocellulosic hydrolysis to glucose and represents a barrier to achieving the high product yields that are necessary for an efficient process [82].
We examined how different glucose (10–250 mM) and cellobiose (10–100 mM) concentrations affected AfCel6A activity (Figure 6a). Glucose at 100 and 250 mM inhibited the enzymatic activity by 12% and 13%, respectively. Cellobiose (100 mM) inhibited AfCel6A activity by 50%. Cellobiohydrolase from T. reesei (Cel6A) has been described as the most efficient cellobiohydrolase, with IC50 of 240 mM for glucose and 20 mM for cellobiose [58]. Therefore, our results showed that AfCel6A was more resistant to inhibition by both products because IC50 was higher than 250 mM for glucose and 100 mM for cellobiose.
Likewise, we investigated how both sugars affected AfAA9_B activity (Figure 6b). Surprisingly, the enzyme retained more than 80% of its initial activity when we added 250 mM glucose or 100 mM cellobiose to the reaction. Together, these findings indicated that AfCel6A and AfAA9_B have potential application in enzymatic cellulose saccharification. However, to improve the efficiency of these enzymes and to increase glucose production, synergistic association with other enzymes is required.

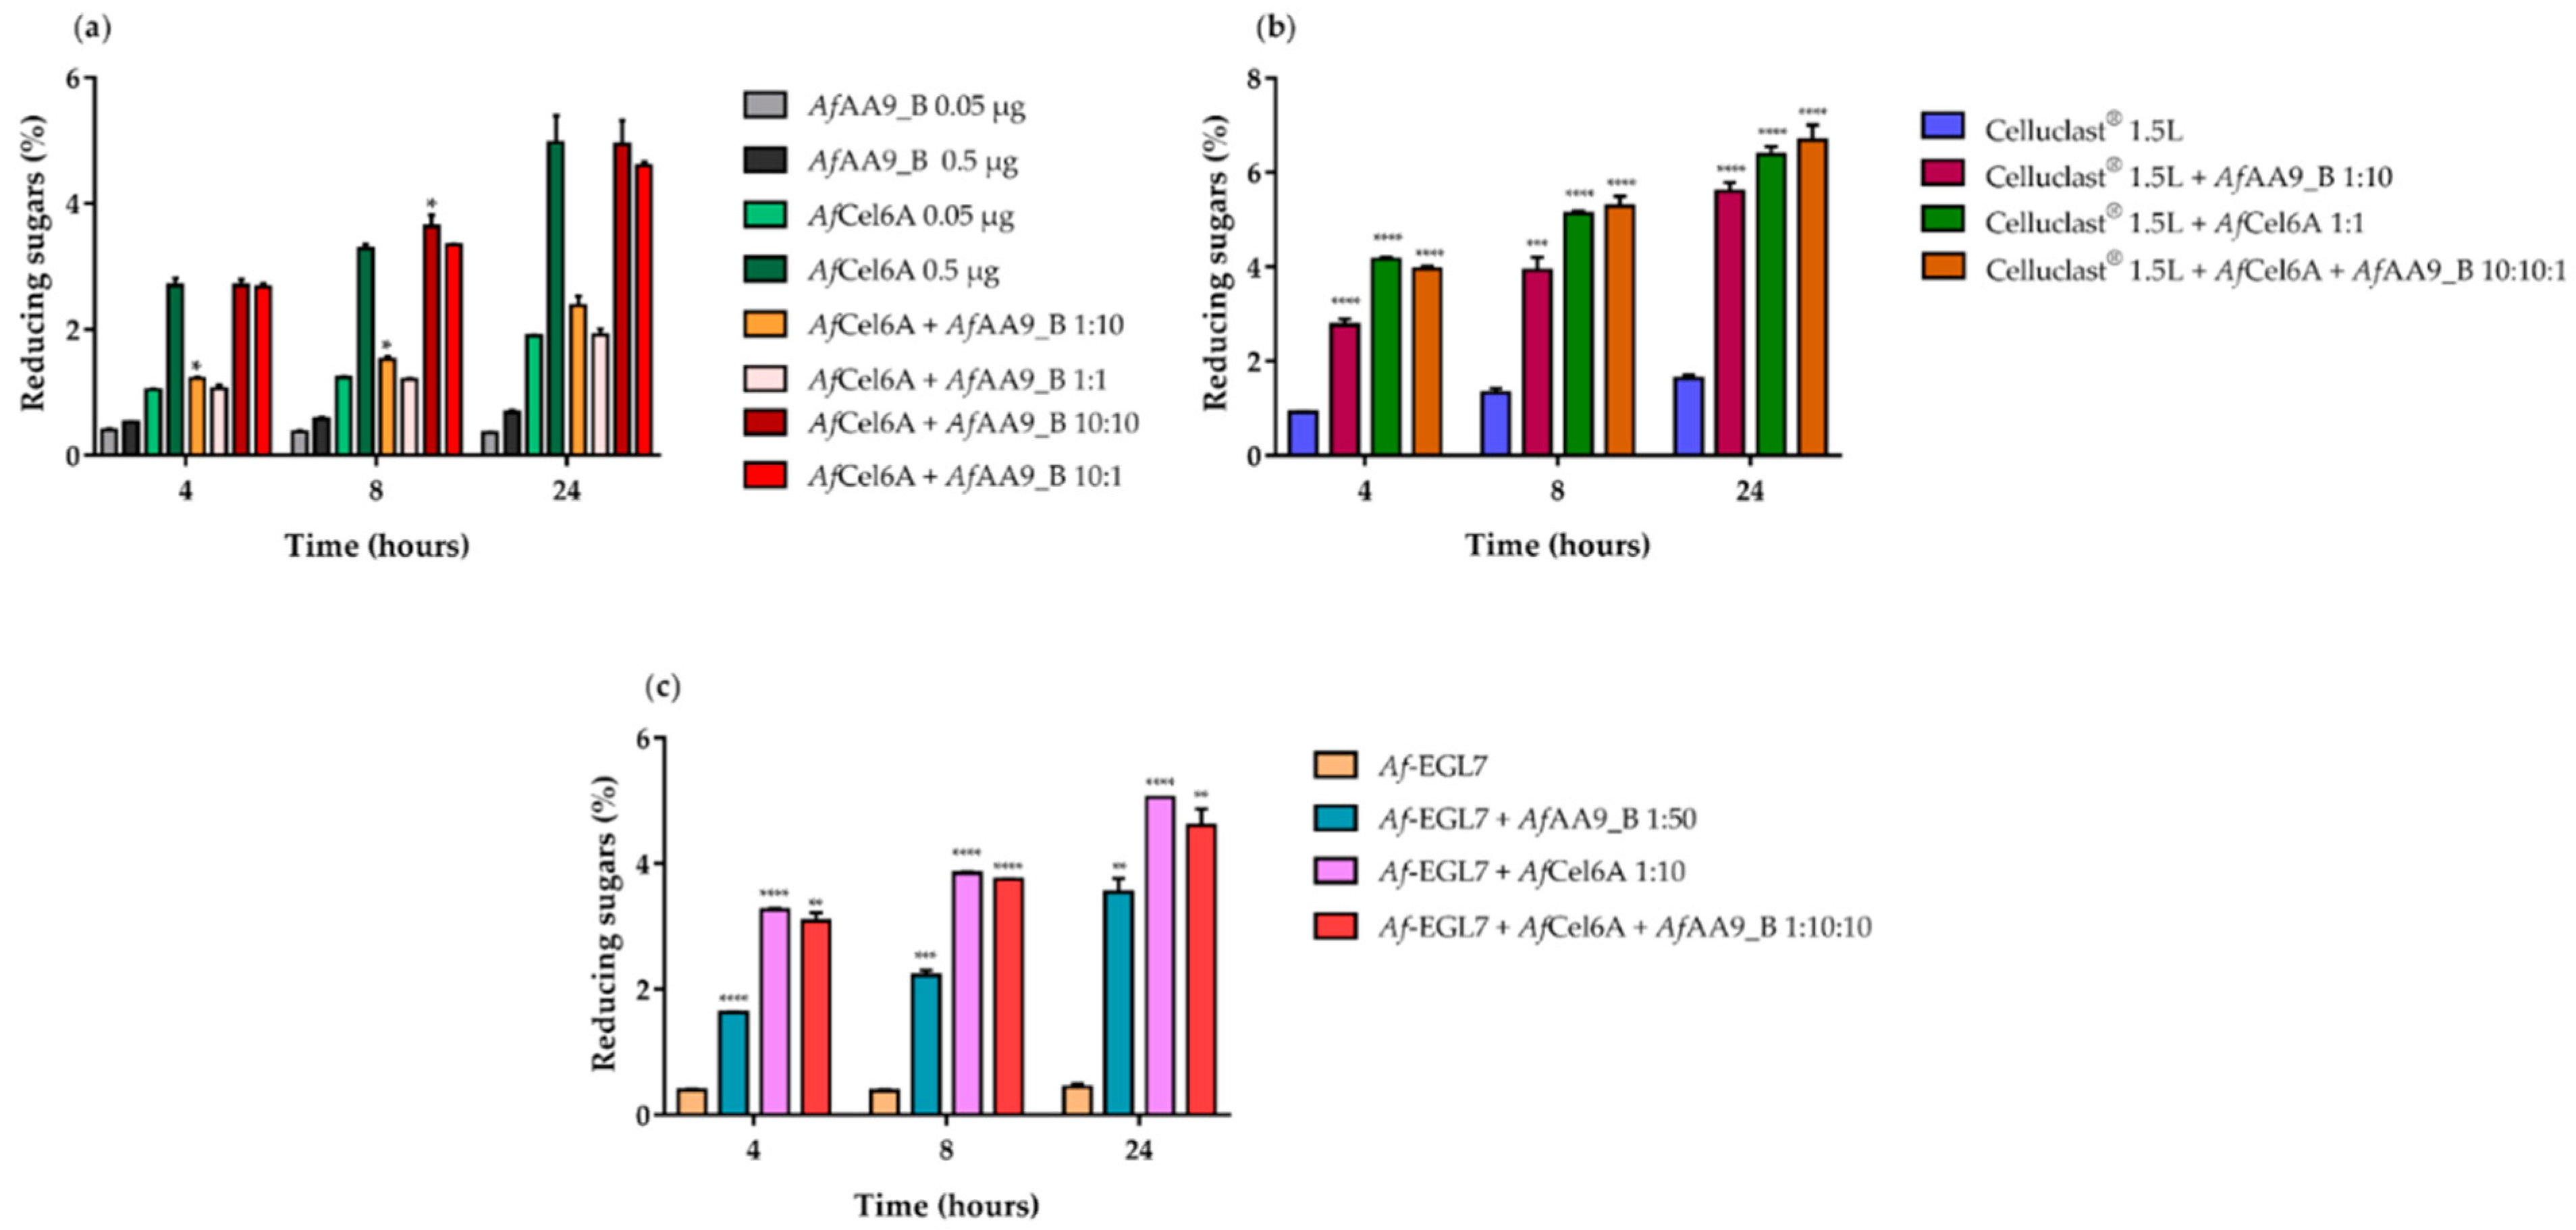
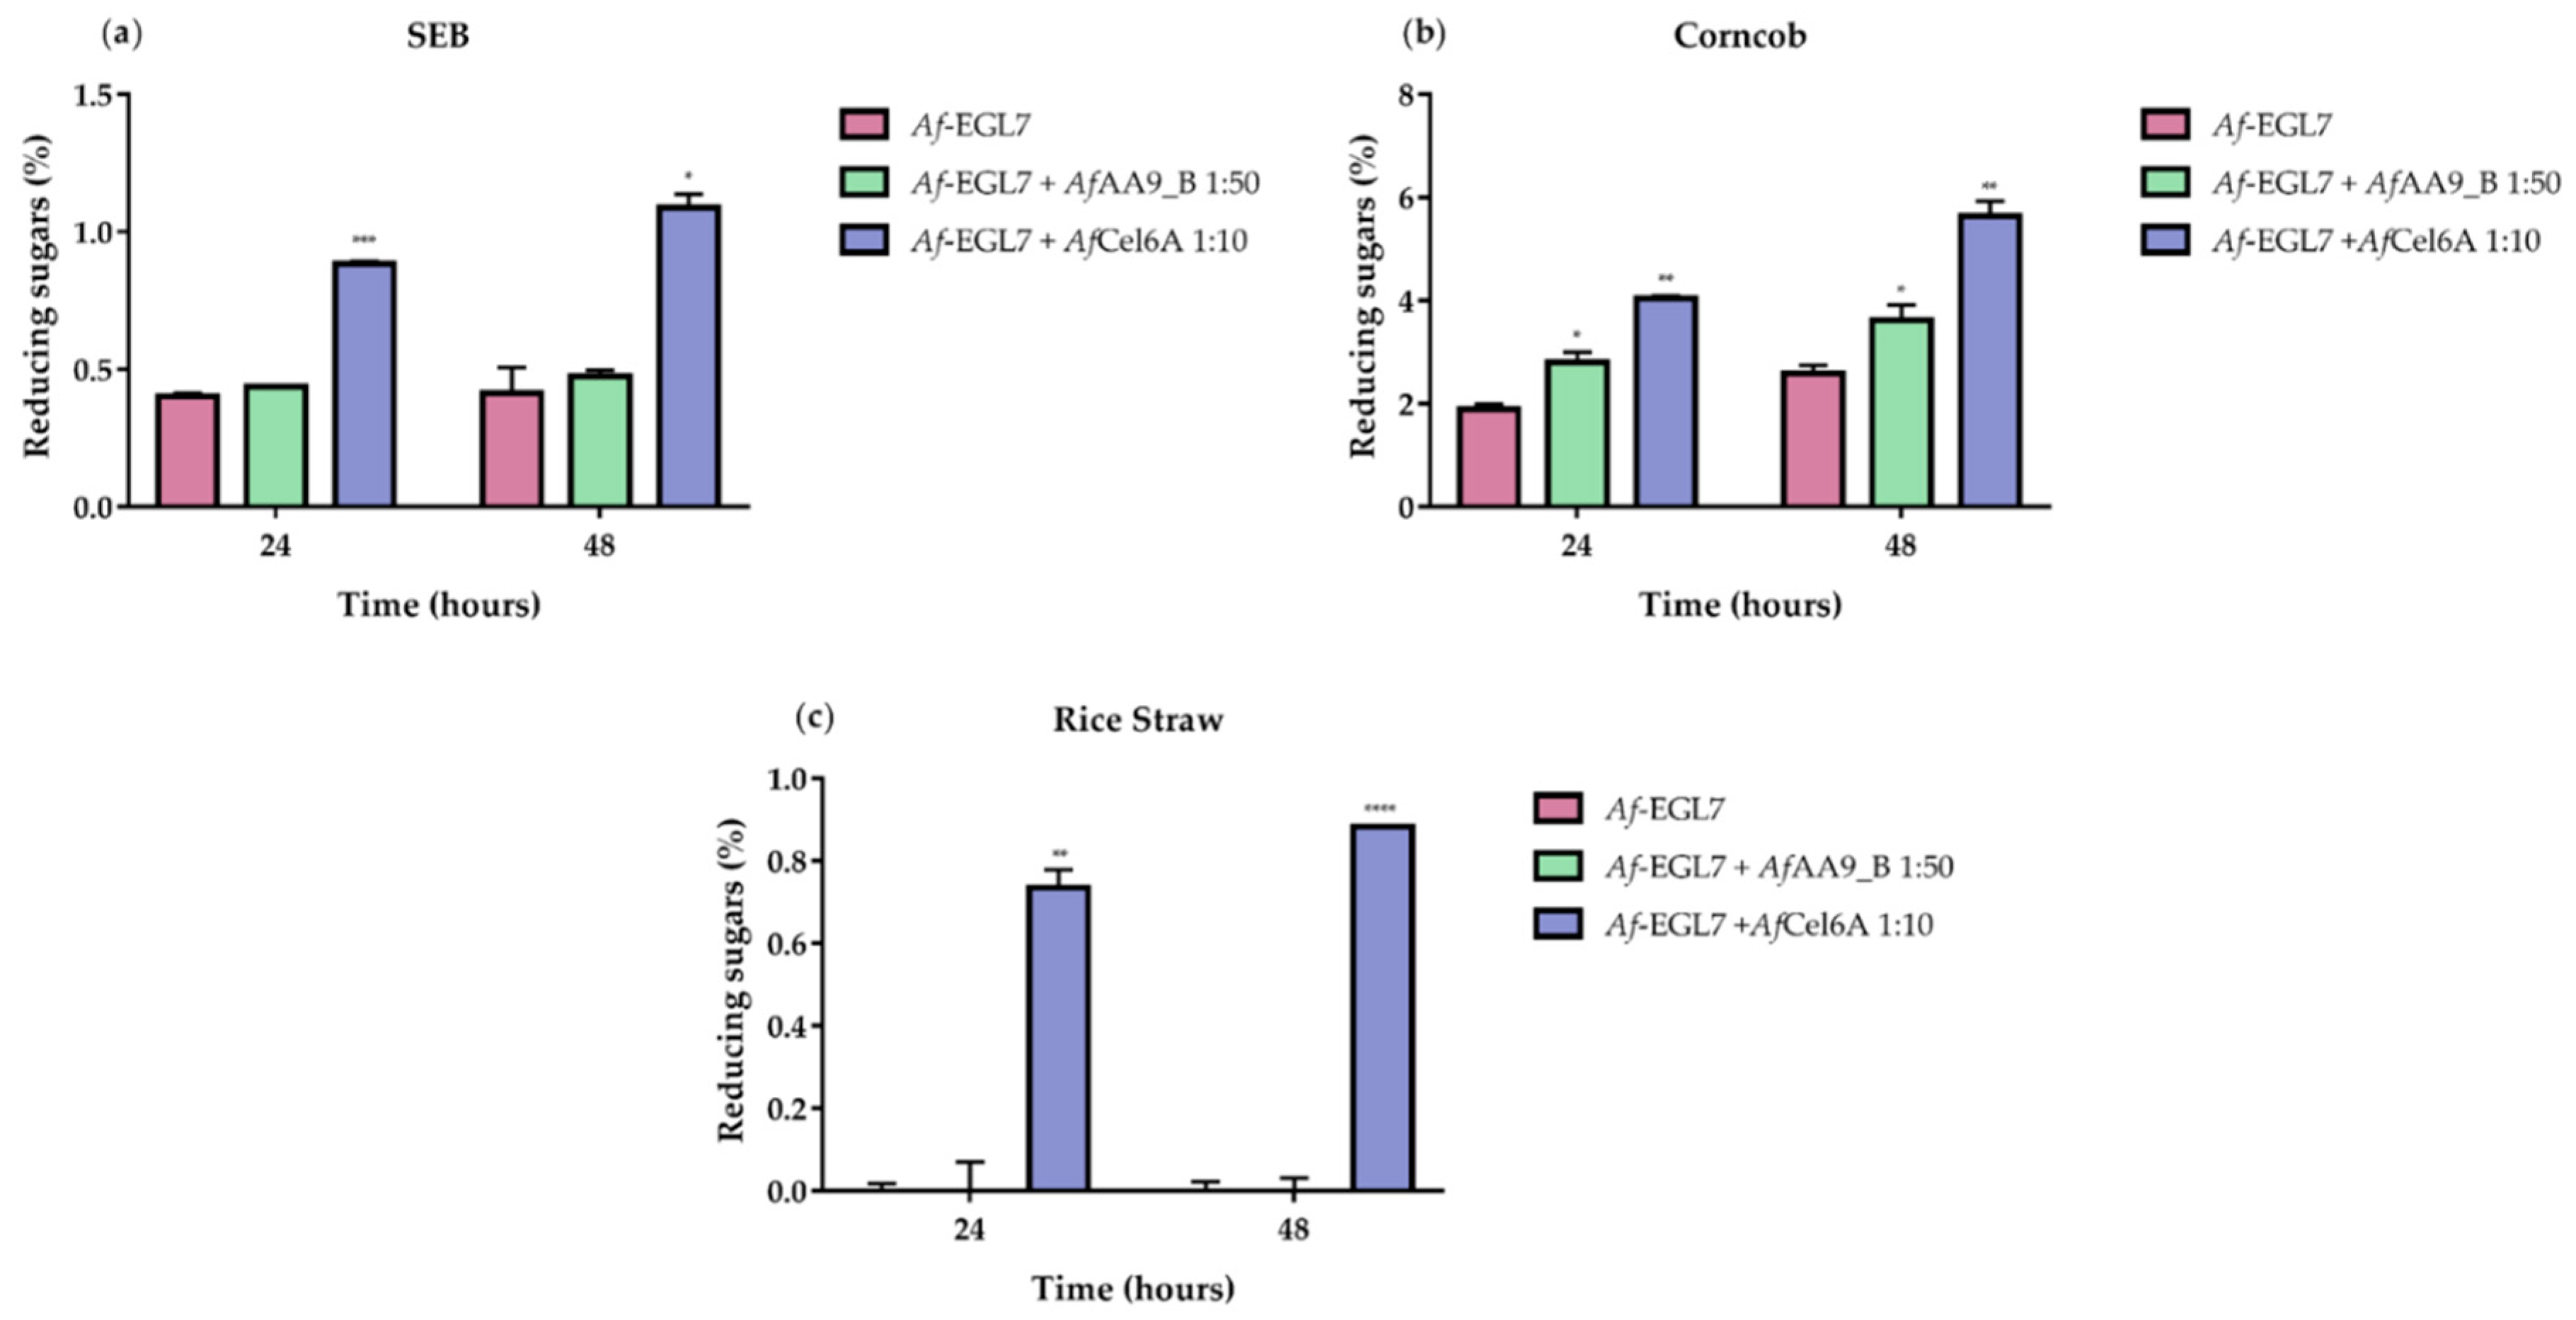
2.6. Synergistic Action on Cellulose Hydrolysis

To determine the synergistic effects of AfCel6A and AfAA9_B, we performed cellulose degradation experiments by using CMC as substrate. We conducted the reactions at different relative proportions and for different incubation times. Surprisingly, we observed no synergistic effect between AfCel6A and AfAA9_B (Figure 7a).
We also investigated the synergistic effects between AfCel6A and AfAA9_B and Celluclast® 1.5L at different incubation times. Hydrolysis increased over time, and the yield of reducing sugars peaked after 24 h. Compared to the cocktail alone, AfAA9_B or AfCel6A addition to the reaction mixture containing Celluclast® 1.5L increased the release of reducing sugars by approximately 3.5 and 4.0 times, respectively. When Celluclast® 1.5L cocktail was simultaneously associated with AfCel6A and AfAA9_B at a ratio of 1:1:10, the maximum release of reducing sugars was 4.5 times higher compared to the cocktail alone. We verified a slight synergistic degree for Celluclast® 1.5L cocktail, AfCel6A, and AfAA9_B during CM-Cellulose hydrolysis. No inhibitory effect arose, probably because AfAA9_B acted synergistically with other enzymes in Celluclast® 1.5L cocktail (Figure 7b).
LPMOs improve the efficiency of cellulase; i.e., endoglucanases and cellobiohydrolases, during cellulose hydrolysis, and they enhance cellulase adsorption and accessibility to cellulose [83,84]. We analyzed AfAA9_B and AfCel6A synergism with endoglucanase Af-EGL7, which had been previously characterized [32]. Compared to Af-EGL7 alone, combination of Af-EGL7 and AfAA9_B released eight-fold more reducing sugars, whilst combination of Af-EGL7 and AfCel6A increased hydrolyses by 11.5 times. When the three enzymes were associated at an Af-EGL7/AfAA9_B/AfCel6A ratio of 1:10:10, 12.5 times more reducing sugars was released (Figure 7c). Thus, AfAA9_B acted synergistically with Af-EGL7, but not with AfCel6A.
The efficiency of synergy among enzymes depends on the relative amount of crystalline to amorphous cellulose that is accessible within the substrate [85]. To evaluate how these enzymes acted on lignocellulosic biomass, we analyzed the associations of the enzymes in complex biomass, including SEB, rice straw, and corncob. SEB and corncob hydrolysis depended on time, but reducing sugars released from rice straw did not increase when we changed the reaction time from 24 to 48 h. Bernardi et al. (2019) [32] observed the same profile when they accomplished rice straw hydrolysis by a cocktail under similar conditions.
As shown in Figure 8a, compared to Celluclast® 1.5L cocktail alone, AfCel6A or AfAA9_B addition increased SEB hydrolysis by ~70% and ~95% after 24 and 48 h, respectively. Similarly, association between commercial cellulases and AfCel6A boosted corncob hydrolysis by ~90% and ~70% after 24 and 48 h, respectively. On the other hand, AfAA9_B addition seemed to affect hydrolysis negatively (Figure 8b). The same inhibitory effect of LPMOs has been observed on rice straw, while AfCel6A addition almost did not impact the release of reducing sugars (Figure 8c). The divergent results among the three agricultural residues pointed to the substrate-dependence and substrate specificity of AfCel6A and AfAA9_B synergism with cellulases [86].
Compared to Af-EGL7 alone, the association between Af-EGL7 and AfCel6A increased the amount of reducing sugars released from the three biomasses: ~163%, ~118%, and ~88% for SEB (Figure 9a), corncob (Figure 9b), and rice straw (Figure 9c), respectively, after 48 h. The Af-EGL7 AfAA9_B combination also improved SEB and corncob hydrolysis, but it did not affect rice straw degradation.

3. Materials and Methods

3.1. Strains, Culture Conditions, and Vectors

Mycelia of Aspergillus fumigatus Af293 (kindly donated by Professor Sérgio Akira Uyemura—University of São Paulo, Ribeirão Preto, Brazil) were obtained for RNA extraction. Fresh conidia (2 × 10⁶ per mL) were inoculated in YNB minimal medium (1× salt solution, 0.1% (v/v) trace elements, and 0.05% (w/v) yeast extract) containing 1% (w/v) fructose and incubated under shaking at 200 rpm and 37 °C for 16 h. The mycelia were harvested, washed, and transferred to YNB medium containing 1% (w/v) sugarcane exploded bagasse (SEB) at 200 rpm and 37 °C for 24 h.
E. coli DH10β was used to clone and to propagate the recombinant vectors. The strain was kept in Luria–Bertani medium supplemented with the appropriate antibiotic.
Pichia pastoris strain X-33 (Invitrogen, Carlsbad, CA, USA) was used to produce the heterologous proteins. The employed growth conditions are described in the EasySelect™ Pichia Expression Kit manual (Invitrogen, Carlsbad, CA, USA).
The plasmids pPICZB and pPICZαA (Invitrogen, Carlsbad, CA, USA) were used to clone, to sequence, and to express AfAA9_B and AfCel6A, respectively.
Xyloglucan from tamarind seed and xylan from beechwood were acquired from Megazyme (Megazyme International, Bray, Co., Wicklow, Ireland). Avicel® PH-101 and low-viscosity CM-Cellulose (CMC) were purchased from Sigma (Sigma–Aldrich, St. Louis, MO, USA).
Biomasses (rice straw and corncob) were provided by Professor Maria de Lourdes Teixeira de Moraes Polizeli (University of São Paulo, Ribeirão Preto, Brazil). Sugarcane exploded bagasse (SEB) was provided by Professor João Atílio Jorge (University of São Paulo, Ribeirão Preto, Brazil).

3.2. RNA Extraction, cDNA Synthesis, and Gene Amplification

Total RNA from A. fumigatus mycelia was isolated by using the Direct-zol™ RNA MiniPrep kit (Zymo Research, Irvine, CA, USA); the manufacturer’s instructions were followed. cDNA was synthesized by using SuperScript® II Reverse Transcriptase (Invitrogen, Carlsbad, CA, USA).
Table 5 describes the specific primer sequences obtained for AfAA9_B and AfCel6A amplification and cloning into the vectors pPICZB and pPICZαA, respectively:
The amplification reactions were performed with Phusion High-Fidelity DNA Polymerase (Thermo Fisher Scientific, Waltham, MS, USA), and the PCR product was analyzed by electrophoresis and purified from 1% (w/v) agarose gel by using the QIAquick Gel Extraction kit (Qiagen, Hilden, Germany).

3.3. Enzyme Production and Purification

AfAA9_B and AfCel6A ORFs (open reading frames) with and without predicted signal peptides, respectively, were cloned into the corresponding vectors pPICZB and pPICZαA (previously digested with the restriction enzymes EcoRI and XbaI) by the circular polymerase extension cloning (CPEC) method [87]. Both CPEC reactions were carried out with Phusion High-Fidelity DNA Polymerase (Thermo Scientific). The thermocycling conditions were as follows: 98 °C for 30 s; 35 cycles of 98 °C for 10 s, 55 °C for 30 s, and 72 °C for 2 min 30 s; and 72 °C for 10 min. The cloning products were transformed to E. coli DH10β, and the resistant transformants were selected with zeocin (50 µg mL−1). Next, the recombinant vectors pPICZB/AfAA9_B and pPICZαA/AfCel6A were linearized with PmeI and transformed into competent P. pastoris X-33 cells by electroporation according to the EasySelect™ Pichia Expression Kit manual (Invitrogen).
Zeocin-resistant P. pastoris transformants were selected to produce the enzymes. The recombinant yeasts were cultivated in buffered glycerol-complex medium (BMGY) at 240 rpm and 30 °C. For heterologous AfAA9_B expression, P. pastoris cells were resuspended in buffered methanol-complex medium (BMMY). Methanol (1% (v/v)) was added to the medium at 24-h intervals for six days, and the supernatant was harvested from the grown culture. The supernatant containing secreted recombinant enzyme (AfAA9_B) was concentrated 10 times by using an Amicon Ultra-15 Centrifugal Filter—10-kDa cutoff (Millipore, Burlington, MS, USA). Protein expression was verified by SDS-PAGE.
AfCel6A was expressed as described above, but 1.5% (v/v) methanol was added.
To purify the enzymes, the concentrates were resuspended in 20 mM sodium phosphate buffer containing 500 mM NaCl (pH 7.4) and loaded onto Ni+ Sepharose 6 Fast Flow resin (Ge Healthcare, Little Chalfont, UK). An imidazole gradient from 0 to 500 mM was applied to the columns to elute the recombinants His6-tagged AfAA9_B and His6-tagged AfCel6A. The fractions were collected, and the enzymes were analyzed by 10% (w/v) SDS-PAGE, stained with Comassie Brilliant Blue R-250 (Sigma–Aldrich, St. Louis, MO, USA). Fractions containing the recombinant enzymes were mixed and buffer-exchanged by using an Amicon Ultra-15 Centrifugal Filter—10 kDa cutoff (Millipore) to remove excess imidazole.
To coordinate copper to the AfAA9_B active site, the purified recombinant enzyme was incubated with CuSO4 at 1:3 molar ratio and 4 °C for 30 min. Then, the AfAA9_B solution was dialyzed against 20 mM sodium phosphate buffer containing 500 mM NaCl (pH 7.4) under shaking at 4 °C for 48 h, to remove traces of non-coordinated Cu2+. The purified AfAA9_B concentration was determined by the Greenberg method [88].
The AfAA9_B band from the SDS-PAGE gel was manually excised, reduced, alkylated, digested with trypsin, purified (Promega, Madison, WI, EUA—V5111), and analyzed by mass spectrometry according to a previously described method [89].

3.4. Glycosylation

N-glycosylation sites were predicted by employing NetNGlyc 1.0 (http://www.cbs.dtu.dk/services/NetNGlyc/), and O-glycosylation was analyzed by using NetOGlyc 4.0 (http://www.cbs.dtu.dk/services/NetOGlyc/). Deglycosylation of recombinant AfAA9_B and AfCel6A was accomplished by using Endoglycosidase H (Endo H, New England Biolabs, Ipswich, MA, USA) in non-denaturing conditions, as per the manufacturer’s procedure. The resulting enzymes were further analyzed by SDS-PAGE.

3.5. Structural Analysis by Circular Dichroism (CD)

Circular dichroism (CD) spectra of the enzymes were obtained between 190 and 250 nm (far-UV) on a JASCO-810 spectropolarimeter; quartz cuvettes with optical path of 0.1 cm were employed. AfAA9_B (0.021 mg mL−1) and AfCel6A (0.0026 mg mL−1) were diluted in 20 mM sodium phosphate (pH 7.4), and the readings were performed in quadruplicate at scanning speed, band width, and D.I.T. of 50 nm min−1, 3 nm, and 1 s, respectively. All the spectra were corrected for the buffer contributions and converted from millidegrees (mdeg) to Δε in M−1 cm−1 according to the following equation: Δε = θ [(0.1⋅MRW)/(d⋅c⋅3298)], where θ is the ellipticity value originally given by equipment (millidegrees), MRW is the enzyme mean residual weight, d is the optical path (cm), and c is the enzyme concentration (mg mL−1). All the secondary structures of the enzymes were predicted by using the BeStSel web server [53], and the results were compared with structures modeled on the Phyre2 [55] and Discovery Studio [90] web servers.

3.6. LPMO Activity Assay

Purified AfAA9_B activity was analyzed as reported by Breslmayr et al. (2018) [80]. The assay consisted of a reaction mixture containing 1 mM 2,6-dimethoxyphenol (2,6-DMP) (Sigma–Aldrich, St. Louis, MO, USA), 100 μM H2O2, and recombinant purified AfAA9_B in 50 mM sodium phosphate buffer (pH 8.0). For the blank, the enzyme was denatured by incubation at 99 °C for 30 min before the reaction mixture was added. After 5 min at 30 °C, absorbance was read at 469 nm to calculate the LPMO peroxidase activity.

3.7. AfCel6A Activity Assay

AfCel6A activity was determined by measuring reducing sugars from the reaction by the 3,5-dinitrosalicylic acid (DNS) method [91]. Briefly, the reaction mixture consisting of 1% CM-Cellulose (w/v) in 50 mM sodium phosphate buffer (pH 6.0) was incubated at 55 °C for 30–45 min. The enzymatic action was stopped by adding an equal volume of the DNS reagent. The mixture was boiled for 5 min and cooled, and absorbance was measured at 540 nm. One unit of AfCel6A was defined as the amount of enzyme that released 1 µmol of reducing sugar from the substrate per minute. Each assay was carried out in triplicate. Enzyme concentration was determined by the Greenberg method [88].

3.8. Enzymatic Properties of AfAA9_B and AfCel6A

The optimal pH for AfAA9_B activity was measured at pH ranging from 4.0 to 8.0 in McIlvaine buffer (citric acid-Na2HPO4) and at pH 9.0 and 10.0 in 100 mM Glycine-NaOH buffer at 30 °C. The relative activity was calculated with respect to the maximum activity of 100%; the aforementioned method was followed. The pH stability was estimated by measuring the residual enzymatic activity after the enzyme was incubated without substrate in the aforementioned buffers at pH ranging from 3.0 to 10.0 and 4 °C for up to 72 h. To determine the AfAA9_B thermal stability, the enzyme was preincubated without substrate at 50 and 60 °C for up to 72 h. To measure the residual activity, the enzymatic activity without preincubation was considered 100%.
The optimal pH for AfCel6A activity was measured from 3.0 to 8.0 in McIlvaine buffer (citric acid-Na2HPO4) at 55 °C. The optimal temperature was examined between 40 and 80 °C. The relative activity was calculated with respect to the maximum exhibited activity of 100%; the aforementioned method was followed.
The AfCel6A pH stability was estimated by measuring the residual enzymatic activity under standard conditions after the enzyme was incubated without substrate in Mcllvaine (citrate–phosphate) buffers pH 3.0–8.0 and in 100 mM Glycine-NaOH buffers pH 9.0 and 10.0 at 4 °C for up to 72 h. To determine the AfCel6A thermal stability, the enzyme was preincubated without substrate at temperatures ranging from 50 to 90 °C for different times. To measure the residual activity, the enzymatic activity without preincubation was considered 100%.

3.9. Effect of Additives

How various metal ions affected AfAA9_B and AfCel6A was determined by adding Mn2+, Co2+, Ca2+, Fe2+, Zn2+, Mg2+, Cu2+, NH4+, K+, or Ag+ at a final concentration of 5 mM to the reaction mixture. The effects of EDTA, SDS, Tween 20, Triton X-100, SLS, β-mercaptoethanol, DTT, and DMSO were also tested. For AfCel6A, the effect of ascorbic acid addition was also evaluated. Control reactions (100% activity) were performed without any additive. The relative activity was estimated as compared to the controls.

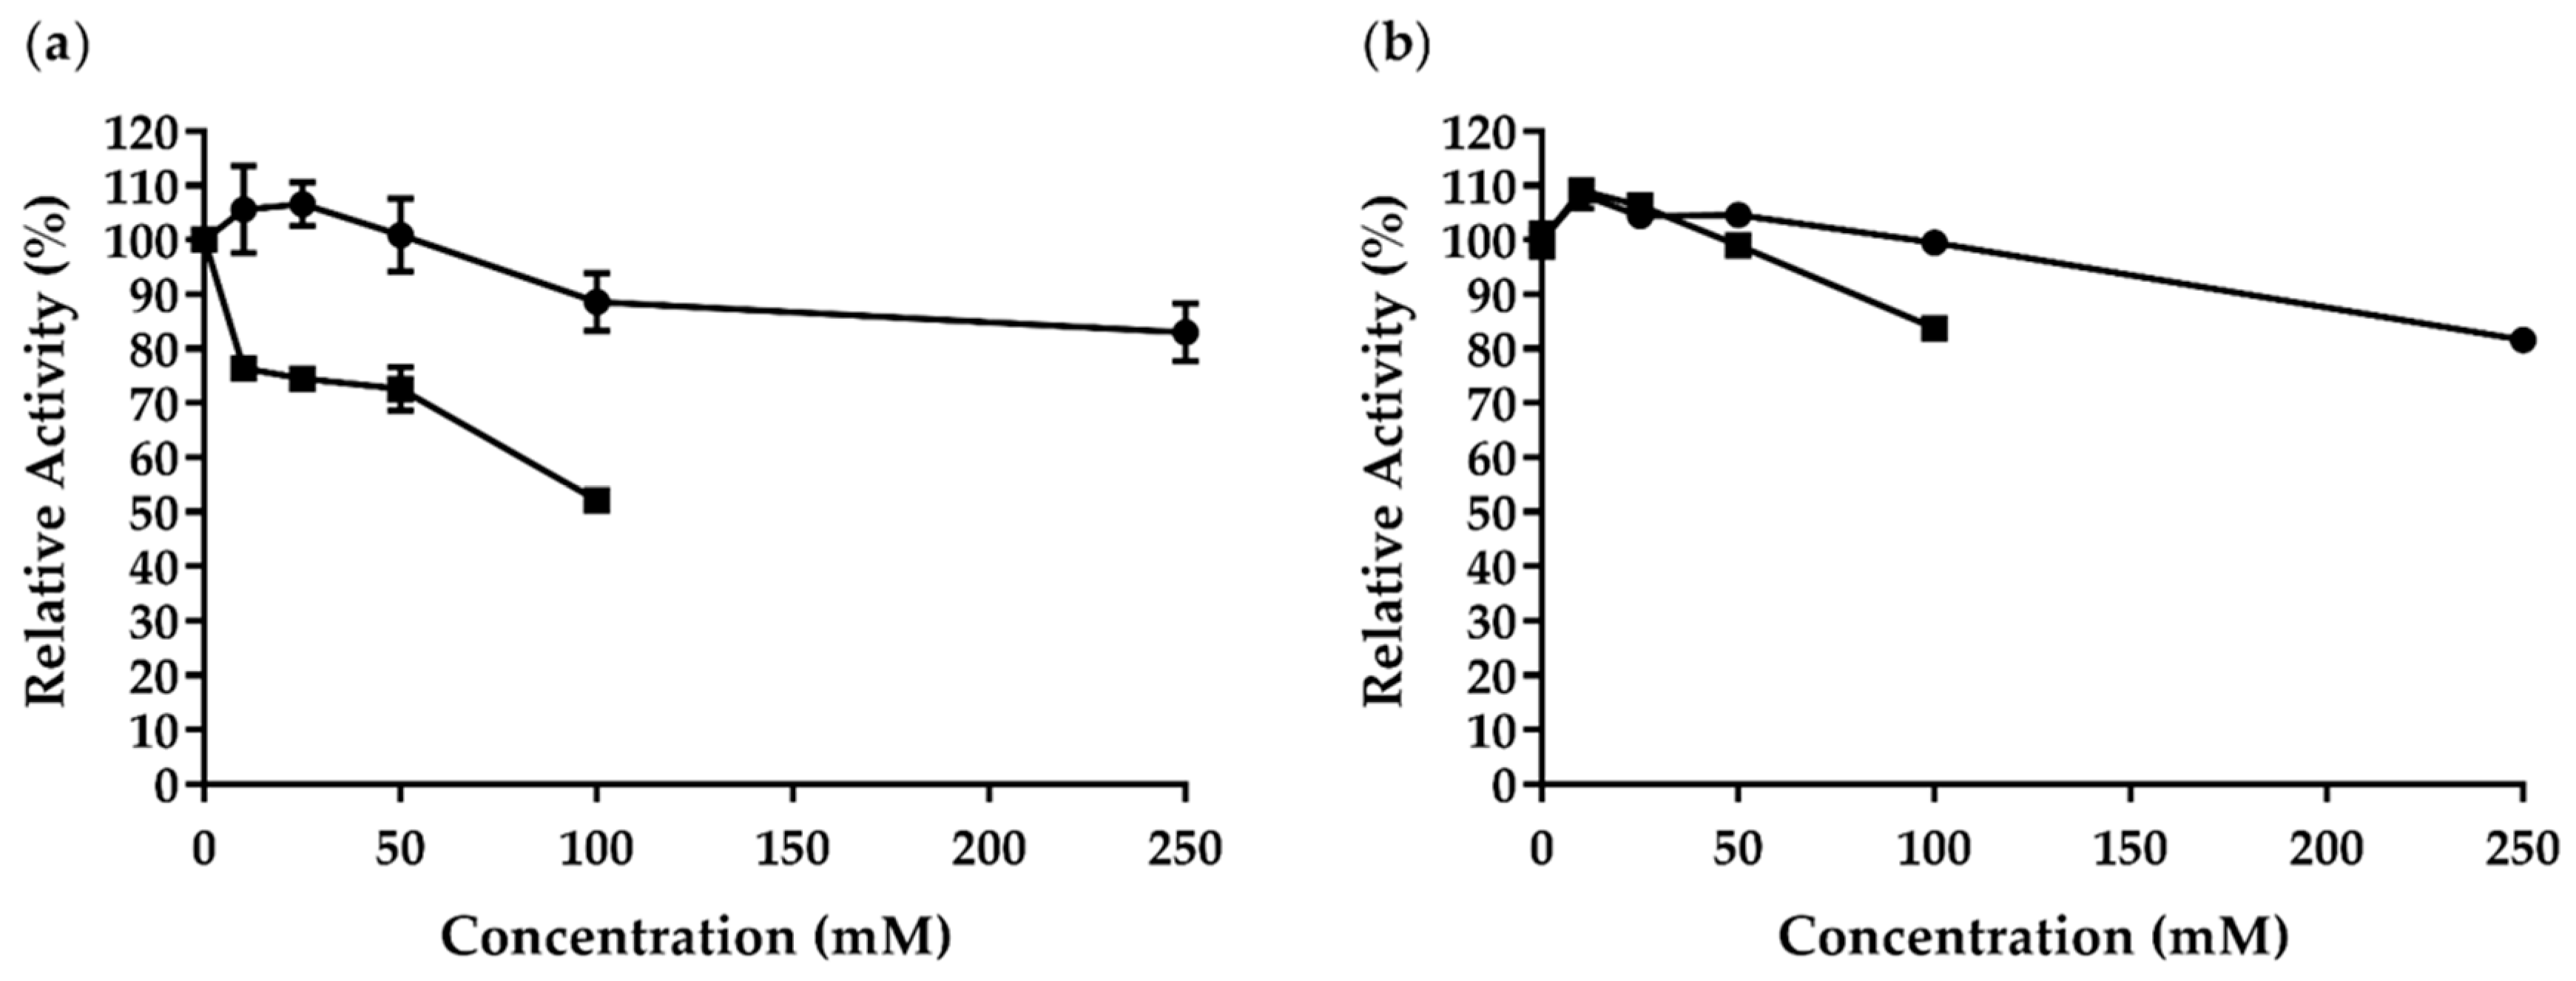
3.10. Glucose and Cellobiose Effects on AfCel6A and AfAA9_B Activity

The glucose (10–250 mM) and cellobiose (up to 100 mM) effects on the activity of AfAA9_B and AfCel6A were determined in the presence of increasing concentrations of both sugars by using the chromogenic substrates 2,6-DMP and 4-nitrophenyl β-D-cellobioside (Sigma–Aldrich, St. Louis, MO, USA), respectively.

3.11. Kinetic Assays

The AfAA9_B kinetic parameters (KM, Vmax, and kcat) were determined for the substrate 2,6-DMP (0.1 to 10 mM) and the co-substrate H2O2 (1 to 500 µM). The reactions were performed in 50 mM sodium phosphate buffer (pH 6.0) and 100 mM glycine-NaOH buffer (pH 9.0) at 50 °C. The parameters were calculated by Michaelis–Menten nonlinear regression.
The AfCel6A kinetic parameters were determined when CM-Cellulose (0.5–30 mg mL−1) was used as substrate. The reactions were performed in 50 mM sodium phosphate buffer (pH 6.0) as previously described. The parameters were calculated by the Michaelis-Menten nonlinear regression graphical method.

3.12. Combined Assays

AfAA9_B and AfCel6A enzymatic assays were carried out concomitantly with the recombinant endoglucanase Af-EGL7 as previously described [32]. The assays were performed by adding 1 µg of Af-EGL7 to 50 µg of AfAA9_B (1:50) or 10 µg of AfCel6A (1:10) per gram of substrate. The reaction mixtures consisted of CM-Cellulose (1% (w/v)) in 50 mM sodium phosphate buffer (pH 6.0) containing 1 mM ascorbic acid in a final volume of 1 mL. The reactions were performed in a thermomixer (Eppendorf) at 50 °C and 1000 rpm for 4, 8, or 24 h.
In the same way, AfAA9_B and AfCel6A were combined at different concentration proportions (10:1, 1:1, 10:10, or 1:10), where the minimum and maximum enzyme loading corresponded to 5 and 50 µg of added enzyme per gram of CM-Cellulose, respectively.
Finally, the effect of the simultaneous association of the three recombinant enzymes on the degradation of CM-Cellulose was evaluated. While the Af-EGL7 concentration was 1 µg g−1, the concentrations of both AfAA9_B and AfCel6A were 10 µg per gram of CM-Cellulose, generating the ratio 1:10:10. The reactions were carried out as described above.
The degradation efficiencies were assessed by estimating the released reducing sugars by the DNS method. The reported results represent the mean ± SD calculated from at least three experimental replicates.

3.13. Synergistic Activity with Celluclast® 1.5L

AfAA9_B and AfCel6A synergistic activity of during enzymatic hydrolysis was investigated in combination with Celluclast® 1.5L, a commercial cellulase cocktail from Trichoderma reesei.
To this end, 0.05 FPU of Celluclast® 1.5L cocktail was associated with 50 µg of AfAA9_B (ratio 1:10) or 5 µg of AfCel6A (ratio 1:1) per gram of CM-Cellulose (1% (w/v) in 50 mM sodium phosphate buffer (pH 6.0) containing 1 mM ascorbic acid. The reactions were conducted at 1000 rpm and 50 °C for up to 24 h in a final volume of 1 mL.
The effect of the simultaneous association between commercial cellulases and the two recombinant enzymes from A. fumigatus on the degradation of CM-Cellulose was also evaluated. While the Celluclast® 1.5 L cocktail loading was fixed at 0.05 FPU g−1, the AfCel6A and AfAA9_B concentrations were 5 and 0.5 µg of enzyme added per gram of CM-Cellulose, respectively. The reactions were carried out as described above.
The percent hydrolysis yields were determined by estimating the released reducing sugars by the DNS method [91]. The reported results represent the mean ± SD calculated from at least three experimental replicates.

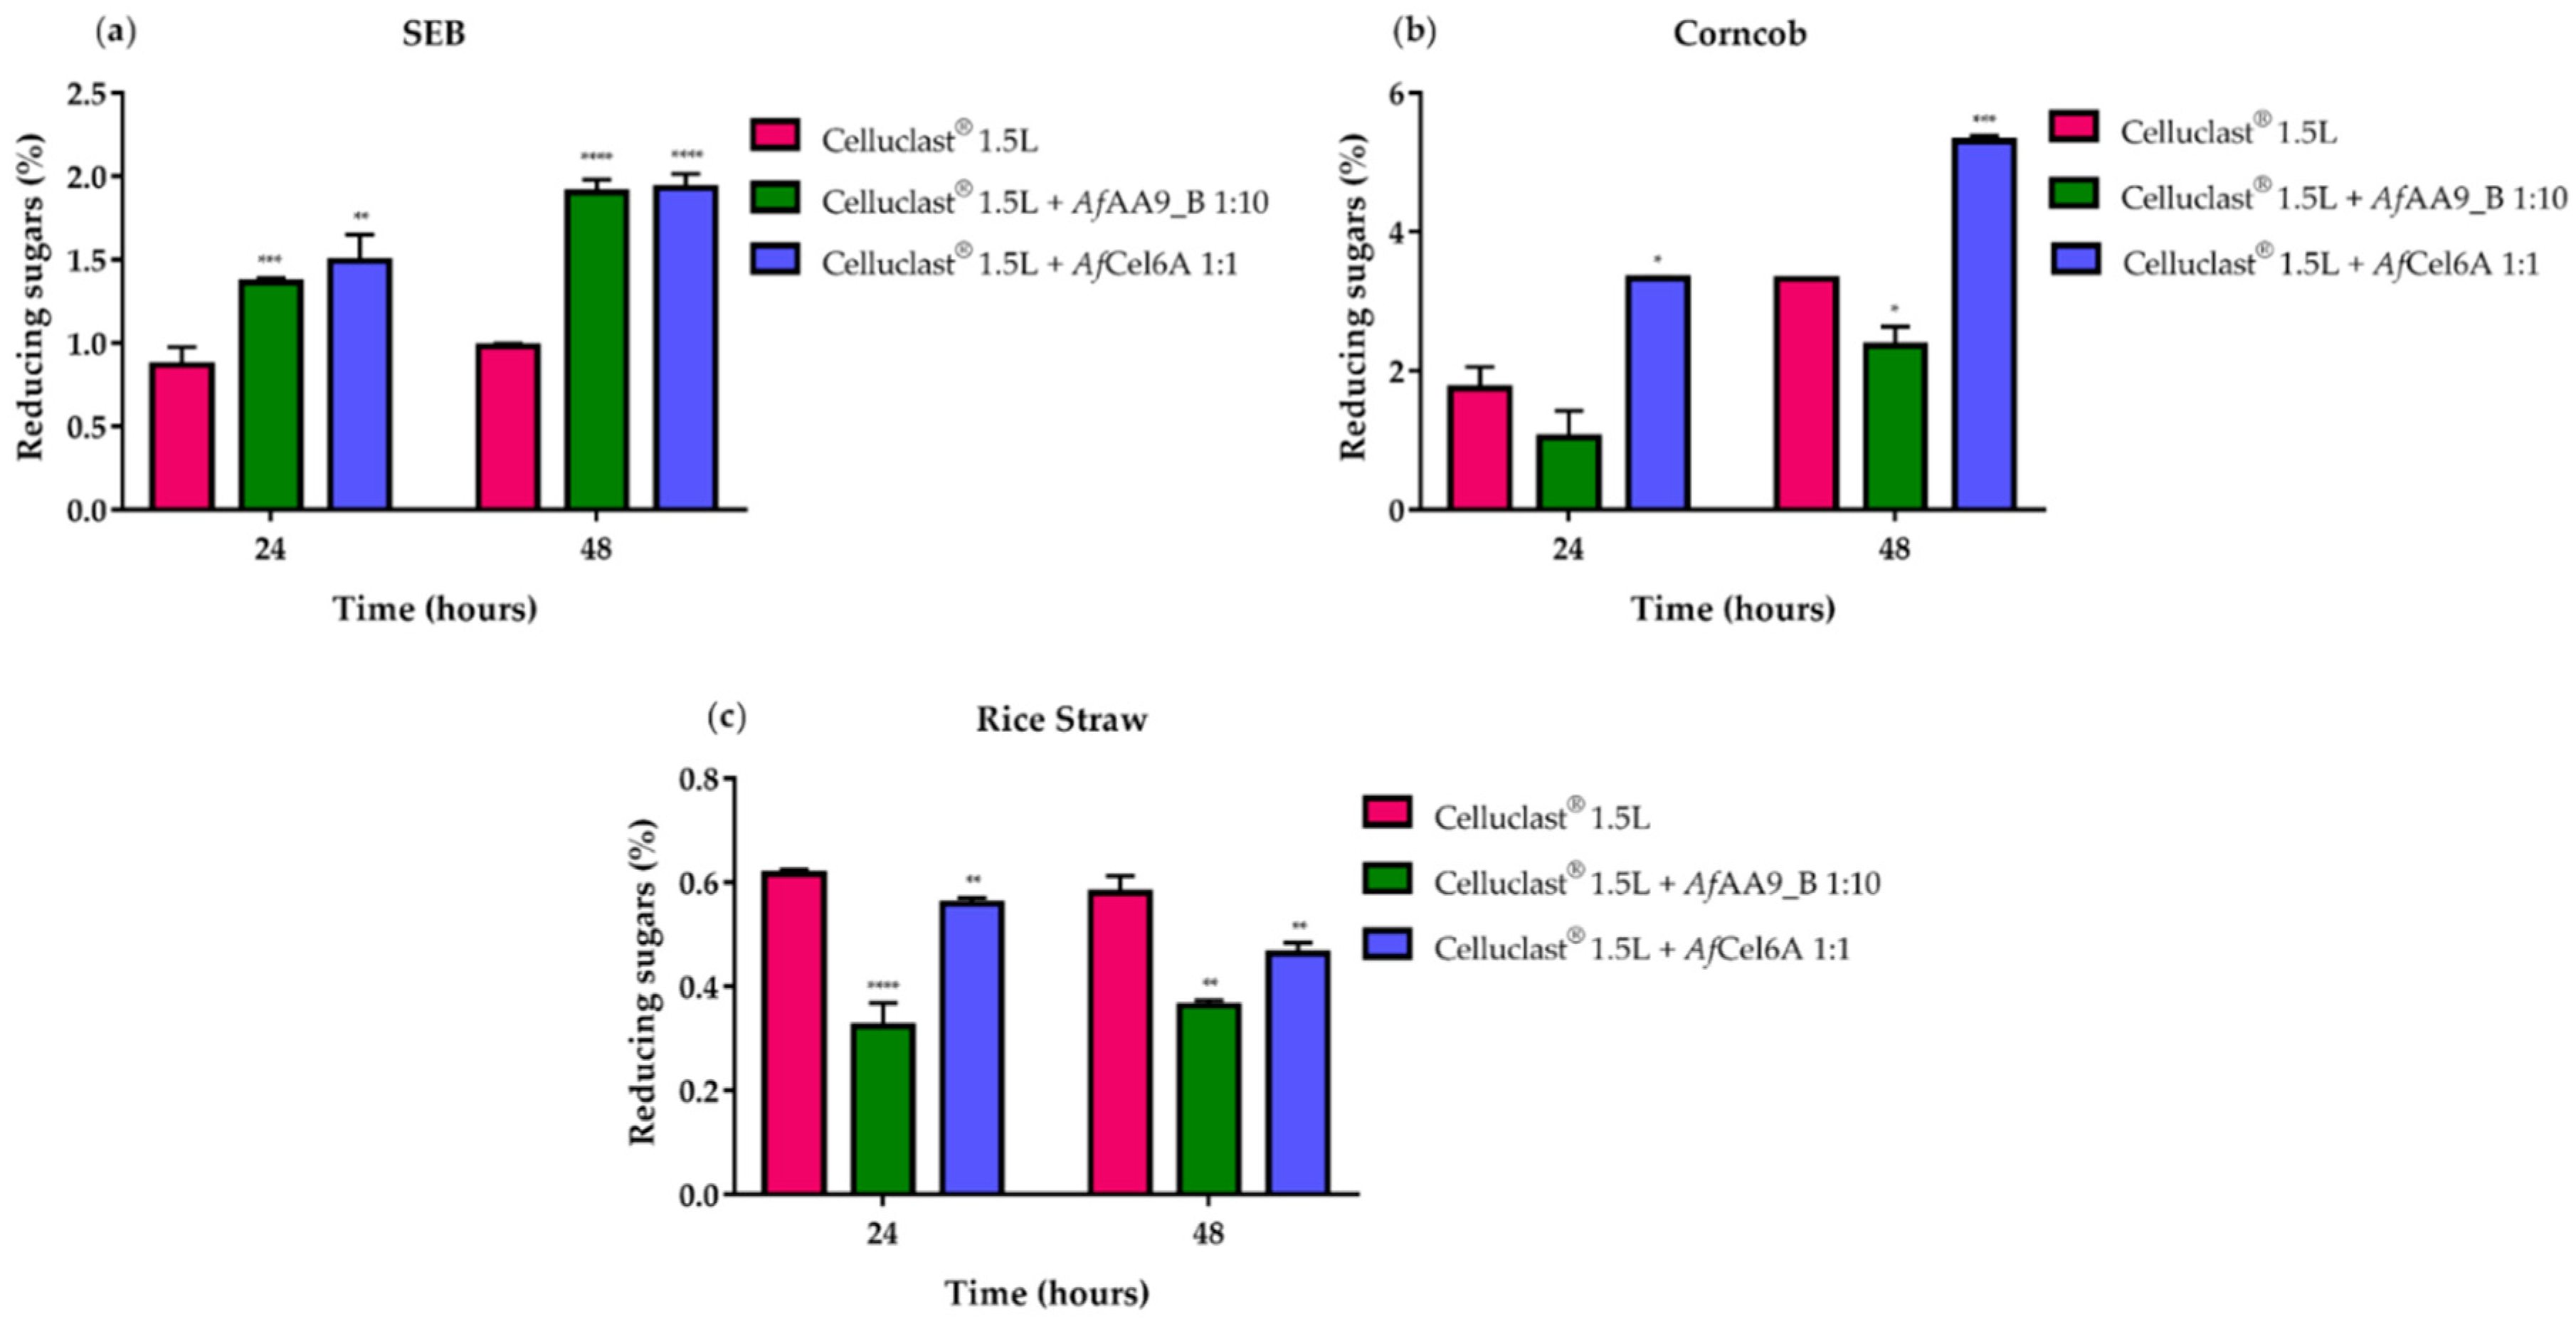
3.14. Lignocellulosic Biomass Saccharification

Enzymatic hydrolyses of some agro-industrial residues were carried out as described by Bernardi et al. (2019) with some modifications [32]. Saccharification was accomplished in 50 mM sodium phosphate buffer (pH 6.0) containing 1% (w/v) of one of the following biomasses: SEB (sugarcane exploded bagasse), rice straw, or corncob.
Different associations between the enzymes were used during biomass saccharifications. Af-EGL7 (18 µg g−1) was combined with AfAA9_B (900 µg g−1) or AfCel6A (180 µg g−1). Similarly, a fixed concentration of Celluclast 1.5L cocktail (0.9 FPU g−1) was associated with AfAA9_B (900 µg g−1) or AfCel6A (90 µg g−1). The reactions were conducted at 1000 rpm and 50 °C for up to 48 h in a final volume of 1 mL. DNS was added to stop the reactions and to measure the released reducing sugars. The reported results represent the mean ± SD calculated from at least three experimental replicates.

3.15. Reproducibility of the Results

All the data are the mean of at least three independent experiments and show consistent results.

4. Conclusions

Novel cellobiohydrolase and LPMO from Aspergillus fumigatus were characterized after they were expressed in P. pastoris. Supplementation of a cellulase cocktail with both enzymes improved the yield of saccharification of different biomasses, especially SEB. However, AfAA9_B did not have a positive effect on AfCel6A activity. On the other hand, AfAA9_B acted synergistically with endoglucanase Af-EGL7. These different synergistic effects are important to understand the action of LPMOs with cellulases and would help to design new commercial enzymatic cocktails. Considering the reduction of costs in lignocellulose conversion, we can conclude that supplementation of Celluclast® 1.5L with AfCel6A or AfAA9_B suffices to increase the hydrolytic activity, so the composition of cellulase cocktails may need to be reconsidered.

Supplementary Materials

Supplementary Materials can be found at https://0-www-mdpi-com.brum.beds.ac.uk/1422-0067/22/1/276/s1, Table S1: Secondary structure proportions of AfAA9_B and AfCel6A from literature and different prediction methods in comparison with the one determined by BeStSel based on the CD spectra.

Author Contributions

Conceptualization: A.V.B., L.E.G. and T.M.D.; data curation: A.V.B., L.E.G., P.F.d.G., L.M.S.P. and D.K.Y.; formal analysis: A.V.B., L.E.G., P.F.d.G., L.M.S.P. and D.K.Y.; methodology: A.V.B., L.E.G., P.F.d.G., L.M.S.P. and D.K.Y.; supervision: A.H.C.d.O., S.A.U. and T.M.D.; writing (original draft): A.V.B. and T.M.D.; writing (review and editing): A.V.B., A.H.C.d.O., S.A.U. and T.M.D.; project administration: T.M.D.; funding acquisition: T.M.D. All authors have read and agreed to the published version of the manuscript.

Funding

This research was funded by Fundação de Amparo à Pesquisa do Estado de São Paulo (FAPESP, 2016/190950-0) and Conselho Nacional de Desenvolvimento Científico e Tecnológico (CNPq: 425465/2016-0). AVB was funded by a scholarship granted by Coordenação de Aperfeiçoamento de Pessoal de Nível Superior—Brasil (CAPES), Finance Code 001. DKY was funded by a scholarship granted by Fundação de Amparo à Pesquisa do Estado de São Paulo (FAPESP, 2018/11231-7).

Institutional Review Board Statement

Not applicable.

Informed Consent Statement

Not applicable.

Data Availability Statement

Data sharing is not applicable to this article.

Conflicts of Interest

The authors declare no conflict of interest. The funders had no role in the study design; data collection, analyses, or interpretation; writing of the manuscript; or the decision to publish the results.

Abbreviations

2G ethanolSecond-generation ethanol
LPMOLytic Polysaccharide Monooxygenase
AAAuxiliary Activity
GHGlycoside Hydrolase
CDCircular Dichroism
CBMCarbohydrate Binding Module
CMC-NaSodium Carboxymethyl Cellulose
2,6-DMP2,6-Dimethoxyphenol
PASCPhosphoric-acid Swollen Cellulose
pNPC4(p)-nitrophenyl β-D-cellobioside
SEBSugarcane Exploded Bagasse
DNS3,5-Dinitrosalicylic acid
FPUFilter Paper Unit

References

  1. El-Tayeb, T.S.; Abdelhafez, A.A.; Ali, S.H.; Ramadan, E.M. Effect of acid hydrolysis and fungal biotreatment on agro-industrial wastes for obtainment of free sugars for bioethanol production. Braz. J. Microbiol. 2012, 43, 1523–1535. [Google Scholar] [PubMed]
  2. Anwar, M.; Lou, S.; Chen, L.; Li, H.; Hu, Z. Recent advancement and strategy on bio-hydrogen production from photosynthetic microalgae. Bioresour. Technol. 2019, 292, 121972. [Google Scholar] [PubMed]
  3. Ren, H.Y.; Kong, F.; Zhao, L.; Ren, N.Q.; Ma, J.; Nan, J.; Liu, B.F. Enhanced co-production of biohydrogen and algal lipids from agricultural biomass residues in long-term operation. Bioresour. Technol. 2019, 289, 121774. [Google Scholar]
  4. Boboescu, I.-Z.; Damay, J.; Chang, J.K.W.; Beigbeder, J.-B.; Duret, X.; Beauchemin, S.; Lalonde, O.; Lavoie, J.-M. Ethanol production from residual lignocellulosic fibers generated through the steam treatment of whole sorghum biomass. Bioresour. Technol. 2019, 292, 121975. [Google Scholar] [PubMed]
  5. Dhakate, S.R.; Pathak, A.K.; Jain, P.; Singh, M.; Singh, B.P.; Subhedar, K.M.; Sharda, S.S.; Seth, R.K. Rice straw biomass to high energy yield biocoal by torrefaction: Indian perspective. Curr. Sci. 2019, 116, 831–838. [Google Scholar]
  6. Hill, J.; Polasky, S.; Nelson, E.; Tilman, D.; Huo, H.; Ludwig, L.; Neumann, J.; Zheng, H.; Bonta, D. Climate change and health costs of air emissions from biofuels and gasoline. Proc. Natl. Acad. Sci. USA 2009, 106, 2077–2082. [Google Scholar] [PubMed] [Green Version]
  7. Mudinoor, A.R.; Goodwin, P.M.; Rao, R.U.; Karuna, N.; Hitomi, A.; Nill, J.; Jeoh, T. Interfacial molecular interactions of cellobiohydrolase Cel7A and its variants on cellulose. Biotechnol. Biofuels 2020, 13, 1–16. [Google Scholar]
  8. Kucharska, K.; Rybarczyk, P.; Hołowacz, I.; Łukajtis, R.; Glinka, M.; Kamiński, M. Pretreatment of lignocellulosic materials as substrates for fermentation processes. Molecules 2018, 23, 2937. [Google Scholar]
  9. Ravindran, R.; Jaiswal, A.K. A comprehensive review on pre-treatment strategy for lignocellulosic food industry waste: Challenges and opportunities. Bioresour. Technol. 2016, 199, 92–102. [Google Scholar]
  10. Nishiyama, Y. Structure and properties of the cellulose microfibril. J. Wood Sci. 2009, 55, 241–249. [Google Scholar]
  11. Payne, C.M.; Knott, B.C.; Mayes, H.B.; Hansson, H.; Himmel, M.E.; Sandgren, M.; Ståhlberg, J.; Beckham, G.T. Fungal cellulases. Chem. Rev. 2015, 115, 1308–1448. [Google Scholar] [PubMed] [Green Version]
  12. Medie, F.M.; Davies, G.J.; Drancourt, M.; Henrissat, B. Genome analyses highlight the different biological roles of cellulases. Nat. Rev. Microbiol. 2012, 10, 227–234. [Google Scholar]
  13. Blumer-Schuette, S.E.; Kataeva, I.; Westpheling, J.; Adams, M.W.; Kelly, R.M. Extremely thermophilic microorganisms for biomass conversion: Status and prospects. Curr. Opin. Biotechnol. 2008, 19, 210–217. [Google Scholar] [PubMed]
  14. Hu, J.; Chandra, R.; Arantes, V.; Gourlay, K.; van Dyk, J.S.; Saddler, J.N. The addition of accessory enzymes enhances the hydrolytic performance of cellulase enzymes at high solid loadings. Bioresour. Technol. 2015, 186, 149–153. [Google Scholar] [PubMed]
  15. Hu, J.; Arantes, V.; Pribowo, A.; Saddler, J.N. The synergistic action of accessory enzymes enhances the hydrolytic potential of a “cellulase mixture” but is highly substrate specific. Biotechnol. Biofuels 2013, 6, 112. [Google Scholar] [PubMed] [Green Version]
  16. Müller, G.; Várnai, A.; Johansen, K.S.; Eijsink, V.G.H.; Horn, S.J. Harnessing the potential of LPMO-containing cellulase cocktails poses new demands on processing conditions. Biotechnol. Biofuels 2015, 8, 1–9. [Google Scholar]
  17. Garcia-Santamarina, S.; Probst, C.; Festa, R.A.; Ding, C.; Smith, A.D.; Conklin, S.E.; Brander, S.; Kinch, L.N.; Grishin, N.V.; Franz, K.J.; et al. A lytic polysaccharide monooxygenase-like protein functions in fungal copper import and meningitis. Nat. Chem. Biol. 2020, 16, 337–344. [Google Scholar]
  18. Vaaje-Kolstad, G.; Horn, S.J.; Van Aalten, D.M.F.; Synstad, B.; Eijsink, V.G.H. The non-catalytic chitin-binding protein CBP21 from Serratia marcescens is essential for chitin degradation. J. Biol. Chem. 2005, 280, 28492–28497. [Google Scholar]
  19. Merino, S.T.; Cherry, J. Progress and challenges in enzyme development for biomass utilization. Adv. Biochem. Eng. Biotechnol. 2007, 108, 95–120. [Google Scholar]
  20. Vaaje-kolstad, G.; Westereng, B.; Horn, S.J.; Liu, Z.; Zhai, H.; Sørlie, M.; Eijsink, V.G.H. An oxidative enzyme boosting the enzymatic conversion of recalcitrant polysaccharides. Science 2010, 330, 219–222. [Google Scholar]
  21. Frandsen, K.E.H.; Tovborg, M.; Jørgensen, C.I.; Spodsberg, N.; Rosso, M.N.; Hemsworth, G.R.; Garman, E.F.; Grime, G.W.; Poulsen, J.C.N.; Batth, T.S.; et al. Insights into an unusual Auxiliary Activity 9 family member lacking the histidine brace motif of lytic polysaccharide monooxygenases. J. Biol. Chem. 2019, 294, 17117–17130. [Google Scholar] [CrossRef] [PubMed] [Green Version]
  22. Bertini, L.; Breglia, R.; Lambrughi, M.; Fantucci, P.; De Gioia, L.; Borsari, M.; Sola, M.; Bortolotti, C.A.; Bruschi, M. Catalytic Mechanism of Fungal Lytic Polysaccharide Monooxygenases Investigated by First-Principles Calculations. Inorg. Chem. 2018, 57, 86–97. [Google Scholar] [CrossRef]
  23. Dimarogona, M.; Topakas, E.; Christakopoulos, P. Cellulose degradation by oxidative enzymes. Comput. Struct. Biotechnol. J. 2012, 2, e201209015. [Google Scholar] [CrossRef] [PubMed] [Green Version]
  24. Vaaje-Kolstad, G.; Forsberg, Z.; Loose, J.S.; Bissaro, B.; Eijsink, V.G. Structural diversity of lytic polysaccharide monooxygenases. Curr. Opin. Struct. Biol. 2017, 44, 67–76. [Google Scholar] [CrossRef] [PubMed]
  25. Hemsworth, G.R.; Henrissat, B.; Davies, G.J.; Walton, P.H. Discovery and characterization of a new family of lytic polysaccharide monooxygenases. Nat. Chem. Biol. 2014, 10, 122–126. [Google Scholar] [CrossRef] [PubMed]
  26. Quinlan, R.J.; Sweeney, M.D.; Leggio, L.L.; Otten, H.; Poulsen, J.-C.N.; Johansen, K.S.; Krogh, K.B.R.M.; Jorgensen, C.I.; Tovborg, M.; Anthonsen, A.; et al. Insights into the oxidative degradation of cellulose by a copper metalloenzyme that exploits biomass components. Proc. Natl. Acad. Sci. USA 2011, 108, 15079–15084. [Google Scholar] [CrossRef] [Green Version]
  27. Eijsink, V.G.H.; Petrovic, D.; Forsberg, Z.; Mekasha, S.; Røhr, Å.K.; Várnai, A.; Bissaro, B.; Vaaje-Kolstad, G. On the functional characterization of lytic polysaccharide monooxygenases (LPMOs). Biotechnol. Biofuels 2019, 12, 58. [Google Scholar] [CrossRef] [Green Version]
  28. Bissaro, B.; Røhr, Å.K.; Müller, G.; Chylenski, P.; Skaugen, M.; Forsberg, Z.; Horn, S.J.; Vaaje-Kolstad, G.; Eijsink, V.G.H. Oxidative cleavage of polysaccharides by monocopper enzymes depends on H2O2. Nat. Chem. Biol. 2017, 13, 1123–1128. [Google Scholar] [CrossRef]
  29. Walton, P.H.; Davies, G.J. On the catalytic mechanisms of lytic polysaccharide monooxygenases. Curr. Opin. Chem. Biol. 2016, 31, 195–207. [Google Scholar] [CrossRef]
  30. Danneels, B.; Tanghe, M.; Desmet, T. Structural Features on the Substrate-Binding Surface of Fungal Lytic Polysaccharide Monooxygenases Determine Their Oxidative Regioselectivity. Biotechnol. J. 2019, 14, e1800211. [Google Scholar] [CrossRef]
  31. Eibinger, M.; Ganner, T.; Bubner, P.; Rošker, S.; Kracher, D.; Haltrich, D.; Ludwig, R.; Plank, H.; Nidetzky, B. Cellulose surface degradation by a lytic polysaccharide monooxygenase and its effect on cellulase hydrolytic efficiency. J. Biol. Chem. 2014, 289, 35929–35938. [Google Scholar] [CrossRef] [PubMed] [Green Version]
  32. Bernardi, A.V.; Yonamine, D.K.; Uyemura, S.A.; Dinamarco, T.M. A Thermostable Aspergillus fumigatus GH7 Endoglucanase Over-Expressed in Pichia pastoris Stimulates Lignocellulosic Biomass Hydrolysis. Int. J. Mol. Sci. 2019, 20, 2261. [Google Scholar] [CrossRef] [Green Version]
  33. Paul, S.; Zhang, A.; Ludeña, Y.; Villena, G.K.; Yu, F.; Sherman, D.H.; Gutiérrez-Correa, M. Insights from the genome of a high alkaline cellulase producing Aspergillus fumigatus strain obtained from Peruvian Amazon rainforest. J. Biotechnol. 2017, 251, 53–58. [Google Scholar] [CrossRef] [PubMed] [Green Version]
  34. Liu, D.; Zhang, R.; Yang, X.; Wu, H.; Xu, D.; Tang, Z.; Shen, Q. Thermostable cellulase production of Aspergillus fumigatus Z5 under solid-state fermentation and its application in degradation of agricultural wastes. Int. Biodeterior. Biodegrad. 2011, 65, 717–725. [Google Scholar] [CrossRef]
  35. Christensen, S.J.; Bertel, K.; Mørkeberg, R.; Spodsberg, N.; Borch, K.; Westh, P. A biochemical comparison of fungal GH6 cellobiohydrolases. Biochem. J. 2019, 6, 2157–2172. [Google Scholar] [CrossRef] [PubMed]
  36. Bernardi, A.V.; De Gouvêa, P.F.; Gerolamo, L.E.; Yonamine, D.K.; De Lourdes, L.; Balico, D.L.; Uyemura, S.A. Functional characterization of GH7 endo-1,4-β-glucanase from Aspergillus fumigatus and its potential industrial application. Protein Expr. Purif. 2018, 150, 1–11. [Google Scholar] [CrossRef] [PubMed]
  37. Adsul, M.G.; Gokhale, D.V. The conundrum of making biomass-to-biofuels economic. Biofuels 2012, 3, 383–386. [Google Scholar] [CrossRef]
  38. Jin, M.; Sousa, L.D.C.; Schwartz, C.; He, Y.; Sarks, C.; Gunawan, C.; Balan, V.; Dale, B.E. Toward lower cost cellulosic biofuel production using ammonia based pretreatment technologies. Green Chem. 2016, 18, 957–966. [Google Scholar] [CrossRef]
  39. Chandel, A.K.; Chandrasekhar, G.; Silva, M.B.; Silva, S.D.S. The realm of cellulases in biorefinery development. Crit. Rev. Biotechnol. 2012, 32, 187–202. [Google Scholar] [CrossRef]
  40. Puri, D.J.; Heaven, S.; Banks, C.J. Improving the performance of enzymes in hydrolysis of high solids paper pulp derived from MSW. Biotechnol. Biofuels 2013, 6, 107. [Google Scholar] [CrossRef] [Green Version]
  41. Adsul, M.; Sandhu, S.K.; Singhania, R.R.; Gupta, R.; Puri, S.K. Enzyme and Microbial Technology Designing a cellulolytic enzyme cocktail for the e ffi cient and economical conversion of lignocellulosic biomass to biofuels. Enzyme Microb. Technol. 2020, 133, 109442. [Google Scholar] [CrossRef] [PubMed]
  42. Brooks, D.; Tchelet, R. Next Generation Enzymes. Biofuels Int. 2014, 12, 49–50. [Google Scholar]
  43. De Gouvêa, P.F.; Gerolamo, L.E.; Bernardi, A.V.; Matheus, L.; Pereira, S.; Uyemura, S.A.; Dinamarco, T.M. Lytic Polysaccharide Monooxygenase from Aspergillus fumigatus can Improve Enzymatic Cocktail Activity During Sugarcane Bagasse Hydrolysis. Protein Pept. Lett. 2019, 126, 377–385. [Google Scholar] [CrossRef] [PubMed]
  44. Rubio, M.V.; Zubieta, M.P.; Cairo, J.P.L.F.; Calzado, F.; Leme, A.F.P.; Squina, F.M.; Prade, R.A.; Damásio, A.R.D.L. Mapping N-linked glycosylation of carbohydrate-active enzymes in the secretome of Aspergillus nidulans grown on lignocellulose. Biotechnol. Biofuels 2016, 9, 1–19. [Google Scholar] [CrossRef] [Green Version]
  45. Bissaro, B.; Kommedal, E.; Røhr, Å.K.; Eijsink, V.G.H. Controlled depolymerization of cellulose by light-driven lytic polysaccharide oxygenases. Nat. Commun. 2020, 11, 1–12. [Google Scholar] [CrossRef]
  46. Chylenski, P.; Petrović, D.M.; Müller, G.; Dahlström, M.; Bengtsson, O.; Lersch, M.; Siika-Aho, M.; Horn, S.J.; Eijsink, V.G.H. Enzymatic degradation of sulfite-pulped softwoods and the role of LPMOs. Biotechnol. Biofuels 2017, 10, 1–13. [Google Scholar] [CrossRef] [Green Version]
  47. Courtade, G.; Wimmer, R.; Røhr, Å.K.; Preims, M.; Felice, A.K.G.; Dimarogona, M.; Vaaje-Kolstad, G.; Sørlie, M.; Sandgren, M.; Ludwig, R.; et al. Interactions of a fungal lytic polysaccharide monooxygenase with β-glucan substrates and cellobiose dehydrogenase. Proc. Natl. Acad. Sci. USA 2016, 113, 5922–5927. [Google Scholar] [CrossRef] [Green Version]
  48. Dodda, S.R.; Sarkar, N.; Aikat, K.; Krishnaraj, N.R.; Bhattacharjee, S.; Bagchi, A.; Mukhopadhyay, S. Insights from the Molecular Dynamics Simulation of Cellobiohydrolase Cel6A Molecular Structural Model from Aspergillus fumigatus NITDGPKA3. Comb. Chem. High Throughput Screen. 2016, 19, 325–333. [Google Scholar] [CrossRef]
  49. Thompson, A.J.; Heu, T.; Shaghasi, T.; Jones, A.; Friis, E.P.; Wilson, K.S.; Davies, G.J. research papers Structure of the catalytic core module of the Chaetomium thermophilum family GH6 cellobiohydrolase Cel6A. Acta Crystallogr. Sect. D Biol. Crystallogr. 2012, 68, 875–882. [Google Scholar] [CrossRef]
  50. Mertz, B.; Kuczenski, R.S.; Larsen, R.T.; Hill, A.D.; Reilly, P.J. Phylogenetic Analysis of Family 6 Glycoside Hydrolases. Biopolymers 2005, 79, 197–206. [Google Scholar] [CrossRef]
  51. Sonnhammer, E.L.L.; Eddy, S.R.; Durbin, R. Pfam: A comprehensive database of protein domain families based on seed alignments. Proteins Struct. Funct. Genet. 1997, 28, 405–420. [Google Scholar] [CrossRef]
  52. Kelly, S.M.; Jess, T.J.; Price, N.C. How to study proteins by circular dichroism. Biochim. et Biophys. Acta (BBA) Proteins Proteom. 2005, 1751, 119–139. [Google Scholar] [CrossRef] [PubMed]
  53. Micsonai, A.; Wien, F.; Bulyáki, É.; Kun, J.; Moussong, É.; Lee, Y.-H.; Goto, Y.; Réfrégiers, M.; Kardos, J. BeStSel: A web server for accurate protein secondary structure prediction and fold recognition from the circular dichroism spectra. Nucleic Acids Res. 2018, 46, W315–W322. [Google Scholar] [CrossRef] [PubMed]
  54. Lo Leggio, L.; Weihe, C.D.; Poulsen, J.C.N.; Sweeney, M.; Rasmussen, F.; Lin, J.; De Maria, L.; Wogulis, M. Structure of a lytic polysaccharide monooxygenase from Aspergillus fumigatus and an engineered thermostable variant. Carbohydr. Res. 2018, 469, 55–59. [Google Scholar] [CrossRef] [PubMed]
  55. Kelley, L.A.; Mezulis, S.; Yates, C.M.; Wass, M.N.; Sternberg, M.J.E. The Phyre2 web portal for protein modeling, prediction and analysis. Nat. Protoc. 2015, 10, 845–858. [Google Scholar] [CrossRef] [PubMed] [Green Version]
  56. Wallace, B.A.; Janes, R.W. Modern Techniques for Circular Dichroism and Synchrotron Radiation Circular Dichroism Spectroscopy; IOS Press: Amsterdam, NY, USA, 2009; Volume 1, ISBN 9781607500001. [Google Scholar]
  57. Kabsch, W.; Sander, C. Dictionary of protein secondary structure: Pattern recognition of hydrogen-bonded and geometrical features. Biopolymers 1983, 22, 2577–2637. [Google Scholar] [CrossRef] [PubMed]
  58. Teugjas, H.; Väljamäe, P. Product inhibition of cellulases studied with 14C-labeled cellulose substrates. Biotechnol. Biofuels 2013, 6, 1–14. [Google Scholar] [CrossRef] [Green Version]
  59. Fuelbiol, F.; Bai, R.; Yang, H.; Wang, F.; He, J.; Wang, C.; Tu, M. Enzyme and Microbial Technology Heterologous expression of codon optimized Trichoderma reesei Cel6A in Pichia pastoris. Enzyme Microb. Technol. 2016, 92, 107–116. [Google Scholar]
  60. Boonvitthya, N.; Bozonnet, S. Comparison of the Heterologous Expression of Trichoderma reesei Endoglucanase II and Cellobiohydrolase II in the Yeasts Pichia pastoris and Yarrowia lipolytica. Mol. Biotechnol. 2013, 54, 158–169. [Google Scholar] [CrossRef]
  61. Okada, H.; Sekiya, T.; Yokoyama, K.; Tohda, H.; Kumagai, H.; Morikawa, Y. Efficient secretion of Trichoderma reesei cellobiohydrolase II in Schizosaccharomyces pombe and characterization of its products. Appl. Microbiol. Biotechnol. 1998, 49, 301–308. [Google Scholar] [CrossRef]
  62. Takahashi, M.; Takahashi, H.; Nakano, Y.; Konishi, T.; Terauchi, R.; Takeda, T. Characterization of a Cellobiohydrolase ( MoCel6A) Produced by Magnaporthe oryzae. Appl. Environ. Microbiol. 2010, 76, 6583–6590. [Google Scholar] [CrossRef] [PubMed] [Green Version]
  63. Riyadh, S.K.; Vipin, I.A.I.K.; Kalia, C.; Lee, J. Characterization of Cellobiohydrolases from Schizophyllum commune KMJ820. Indian J. Microbiol. 2020, 60, 160–166. [Google Scholar]
  64. Limam, F.; Chaabouni, S.E.; Ghrir, R.; Marzouki, N. Two cellobiohydrolases of Penicillium occitanis mutant Pol 6: Purification and properties. Enzym. Microb. Technol. 1995, 0229, 340–346. [Google Scholar] [CrossRef]
  65. Tuohy, M.G.; Walsh, D.J.; Murray, P.G.; Claeyssens, M.; Cuffe, M.M.; Savage, A.V.; Coughlan, M.P. Kinetic parameters and mode of action of the cellobiohydrolases produced by Talaromyces emersonii. Biochim. et Biophys. Acta (BBA) Protein Struct. Mol. Enzym. 2002, 1596, 366–380. [Google Scholar] [CrossRef]
  66. Song, J.; Liu, B.; Liu, Z. Cloning of two cellobiohydrolase genes from Trichoderma viride and heterogenous expression in yeast Saccharomyces cerevisiae. Mol. Biol. Rep. 2010, 37, 2135–2140. [Google Scholar] [CrossRef]
  67. Wang, H.; Chen, Y.; Huang, C.; Hseu, R. Cloning and characterization of a thermostable and pH-stable cellobiohydrolase from Neocallimastix patriciarum J11. Protein Expr. Purif. 2013, 90, 153–159. [Google Scholar] [CrossRef]
  68. Toda, H.; Nagahata, N.; Amano, Y.; Nozaki, K.; Kanda, T.; Okazaki, M.; Shimosaka, M. Gene Cloning of Cellobiohydrolase II from the White Rot Fungus Irpex lacteus MC-2 and Its Expression in Pichia pastoris. Biosci. Biotechnol. Biochem. 2008, 72, 3142–3147. [Google Scholar] [CrossRef]
  69. Wang, X.; Peng, Y.; Zhang, L. Directed evolution and structural prediction of cellobiohydrolase II from the thermophilic fungus Chaetomium thermophilum. Appl. Microbiol. Biotechnol. 2012, 95, 1469–1478. [Google Scholar] [CrossRef]
  70. Agrawal, D.; Basotra, N.; Balan, V.; Tsang, A.; Chadha, B.S. Discovery and Expression of Thermostable LPMOs from Thermophilic Fungi for Producing Efficient Lignocellulolytic Enzyme Cocktails. Appl. Biochem. Biotechnol. 2019, 191, 463–481. [Google Scholar] [CrossRef]
  71. Keller, M.B.; Felby, C.; Labate, C.A.; Pellegrini, V.O.A.; Higasi, P.; Singh, R.K.; Polikarpov, I.; Blossom, B.M. A simple enzymatic assay for the quantification of C1-specific cellulose oxidation by lytic polysaccharide monooxygenases. Biotechnol. Lett. 2020, 42, 93–102. [Google Scholar] [CrossRef] [Green Version]
  72. Hangasky, J.A.; Iavarone, A.T.; Marletta, M.A. Reactivity of O 2 versus H 2 O 2 with polysaccharide monooxygenases. Proc. Natl. Acad. Sci. USA 2018, 115, 4915–4920. [Google Scholar] [CrossRef] [PubMed] [Green Version]
  73. Forsberg, Z.; Sørlie, M.; Petrović, D.; Courtade, G.; Aachmann, F.L.; Vaaje-Kolstad, G.; Bissaro, B.; Røhr, Å.K.; Eijsink, V.G. Polysaccharide degradation by lytic polysaccharide monooxygenases. Curr. Opin. Struct. Biol. 2019, 59, 54–64. [Google Scholar] [CrossRef] [PubMed]
  74. Kuusk, S.; Bissaro, B.; Kuusk, P.; Forsberg, Z.; Eijsink, V.G.H.; Sørlie, M.; Valjamae, P. Kinetics of H2O2-driven degradation of chitin by a bacterial lytic polysaccharide monooxygenase. J. Biol. Chem. 2018, 293, 523–531. [Google Scholar] [CrossRef] [PubMed] [Green Version]
  75. Frandsen, K.E.H.; Simmons, T.J.; Dupree, P.; Poulsen, J.C.N.; Hemsworth, G.R.; Ciano, L.; Johnston, E.M.; Tovborg, M.; Johansen, K.S.; Von Freiesleben, P.; et al. The molecular basis of polysaccharide cleavage by lytic polysaccharide monooxygenases. Nat. Chem. Biol. 2016, 12, 298–303. [Google Scholar] [CrossRef] [Green Version]
  76. Musaddique, H.; Reddy Dodda, S.; Kapoor, B.S.; Aikat, K.; Mukhopadhyay, S.S. Investigation the biomass conversion efficiency, biochemical characterisation and structural insights of the newly isolated AA16 family of Lytic Polysaccharide Monooxygenase (LPMO) from Aspergillus fumigatus. bioRxiv 2020. [Google Scholar] [CrossRef] [Green Version]
  77. Frommhagen, M.; Westphal, A.H.; Hilgers, R.; Koetsier, M.J.; Hinz, S.W.A.; Visser, J.; Gruppen, H.; van Berkel, W.J.H.; Kabel, M.A. Quantification of the catalytic performance of C1-cellulose-specific lytic polysaccharide monooxygenases. Appl. Microbiol. Biotechnol. 2018, 102, 1281–1295. [Google Scholar] [CrossRef] [Green Version]
  78. Kadowaki, M.A.S.; Várnai, A.; Jameson, J.K.; Leite, A.E.T.; Costa-Filho, A.J.; Kumagai, P.S.; Prade, R.A.; Polikarpov, I.; Eijsink, V.G.H. Functional characterization of a lytic polysaccharide monooxygenase from the thermophilic fungus Myceliophthora thermophila. PLoS ONE 2018, 13, e0202148. [Google Scholar] [CrossRef]
  79. Singh, R.K.; Blossom, B.M.; Russo, D.A.; Van Oort, B.; Croce, R.; Jensen, P.E.; Felby, C.; Bjerrum, M.J. Thermal unfolding and refolding of a lytic polysaccharide monooxygenase from: Thermoascus aurantiacus. RSC Adv. 2019, 9, 29734–29742. [Google Scholar] [CrossRef] [Green Version]
  80. Breslmayr, E.; Hanžek, M.; Hanrahan, A.; Leitner, C.; Kittl, R.; Šantek, B.; Oostenbrink, C.; Ludwig, R. A fast and sensitive activity assay for lytic polysaccharide monooxygenase. Biotechnol. Biofuels 2018, 11, 79. [Google Scholar] [CrossRef]
  81. Meleiro, L.P.; Carli, S.; Fonseca-Maldonado, R.; Torricillas, M.d.S.; Zimbardi, A.L.R.L.; Ward, R.J.; Jorge, J.A.; Furriel, R.P.M. Overexpression of a Cellobiose-Glucose-Halotolerant Endoglucanase from Scytalidium thermophilum. Appl. Biochem. Biotechnol. 2018, 185, 316–333. [Google Scholar] [CrossRef]
  82. Atreya, M.E.; Strobel, K.L.; Clark, D.S. Alleviating product inhibition in cellulase enzyme Cel7A. Biotechnol. Bioeng. 2016, 113, 330–338. [Google Scholar] [CrossRef] [PubMed] [Green Version]
  83. Kostylev, M.; Wilson, D. A distinct model of synergism between a processive endocellulase (TfCel9A) and an exocellulase (TfCel9A) from Thermobifida fusca. Appl. Environ. Microbiol. 2014, 80, 339–344. [Google Scholar] [CrossRef] [PubMed] [Green Version]
  84. Song, B.; Li, B.; Wang, X.; Shen, W.; Park, S.; Collings, C.; Feng, A.; Smith, S.J.; Walton, J.D.; Ding, S.Y. Real-time imaging reveals that lytic polysaccharide monooxygenase promotes cellulase activity by increasing cellulose accessibility. Biotechnol. Biofuels 2018, 11, 1–11. [Google Scholar] [CrossRef] [PubMed]
  85. Hu, J.; Arantes, V.; Pribowo, A.; Gourlay, K.; Saddler, J.N.; Stephen, J.D.; Mabee, W.E.; Saddler, J.N.; Hu, J.; Arantes, V.; et al. Substrate factors that influence the synergistic interaction of AA9 and cellulases during the enzymatic hydrolysis of biomass. Energy Environ. Sci. 2014, 7, 2308. [Google Scholar] [CrossRef]
  86. Tokin, R.; Ipsen, J.Ø.; Westh, P.; Johansen, K.S. The synergy between LPMOs and cellulases in enzymatic saccharification of cellulose is both enzyme- and substrate-dependent. Biotechnol. Lett. 2020, 42, 1975–1984. [Google Scholar] [CrossRef]
  87. Quan, J.; Tian, J. Circular polymerase extension cloning for high-throughput cloning of complex and combinatorial DNA libraries. Nat. Protoc. 2011, 6, 242–251. [Google Scholar] [CrossRef]
  88. Greenberg, C.S.; Craddock, P.R. Rapid single-step membrane protein assay. Clin. Chem. 1982, 28, 1725–1726. [Google Scholar] [CrossRef]
  89. Shevchenko, A.; Jensen, O.N.; Podtelejnikov, A.V.; Sagliocco, F.; Wilm, M.; Vorm, O.; Mortensen, P.; Shevchenko, A.; Boucherie, H.; Mann, M. Linking genome and proteome by mass spectrometry: Large-scale identification of yeast proteins from two dimensional gels. Proc. Natl. Acad. Sci. USA 1996, 93, 14440–14445. [Google Scholar] [CrossRef] [Green Version]
  90. BIOVIA Discovery Studio Visualisation; Accelrys Software Inc.: San Diego, CA, USA, 2017.
  91. Miller, G.L. Use of Dinitrosalicylic Acid Reagent for Determination of Reducing Sugar. Anal. Chem. 1959, 31, 426–428. [Google Scholar] [CrossRef]
Figure 1. SDS-PAGE (10% polyacrylamide gel) analysis of the purified recombinant AfCel6A and AfAA9_B. Lane M, molecular mass standards (Precision™ Protein Standards Dual Color—BioRad); lane 1, purified recombinant AfCel6A; lane 2, deglycosylated AfCel6A; lane 3, purified recombinant AfAA9_B; lane 4, deglycosylated AfAA9_B.
Ijms 22 00276 g001
Figure 2. Ribbon representation of the enzymes AfAA9_B (a) and AfCel6A (c) and their main conserved residues and structures. Active site residues are represented in yellow, and disulfide bonds are represented in orange. AfAA9_B loops are represented by LC (C-terminus), LS (short), L3, and L2. CBM1 residues are indicated by a brace in AfCel6A. Circular dichroism spectra obtained from 190 to 250 nm (UV-distant) for AfAA9_B with Cu(II) (b) and AfCel6A (d) at 25 °C. Both enzymes were in 20 mM sodium phosphate buffer (pH = 7.4), and the spectra were read by using a quartz cuvette with an optical path of 0.1 cm. The mean spectra for each sample were normalized by subtracting the buffer spectrum.
Ijms 22 00276 g002
Figure 3. Temperature effects on AfCel6A and AfAA9_B activity and stability. (a) AfCel6A temperature-activity profiles at optimal pH for 45 min. (b) AfCel6A thermostability at ● 50, ■ 60, ▲ 70, × 80, and ♦ 90 °C for different times. (c) AfCel6A thermostability at 50 °C for up to 72 h. (d) AfAA9_B thermostability at ● 50 and ■ 60 °C for 72 h. Each value in the panel represents the mean of three experiments.
Ijms 22 00276 g003
Figure 4. pH effects on the enzymatic activity and stability of purified recombinant AfCel6A and AfAA9_B. (a) AfCel6A pH-activity profile. (b) pH stability of AfCel6A after ● 24, ■ 48, and ▲ 72 h of preincubation at 4 °C. The enzyme activities were measured under standard conditions. (c) AfAA9_B pH-activity profile. (d) pH stability of AfAA9_B after ● 24, ■ 48, and ▲ 72 h of preincubation at 4 °C. Each value in the panel represents the mean of three experiments.
Ijms 22 00276 g004
Figure 5. AfCel6A specific activity (U mg−1) toward CM-Cellulose, Avicel, xyloglucan, and xylan. Each reaction was performed in 50 mM phosphate bufer (pH 6.0) containing 0.5% (w/v) of each substrate at 55 °C for 30 min. Values are the mean ± SD of three replicates.
Ijms 22 00276 g005
Figure 6. ● Glucose and ■ cellobiose effects on (a) AfCel6A and (b) AfAA9_B activity.
Ijms 22 00276 g006
Figure 7. Synergistic action on 1% (w/v) CM-Cellulose of (a) AfCel6A and AfAA9_B; (b) AfCel6A, or AfAA9_B, or both with Celluclast® 1.5 L cocktail; and (c) AfCel6A, or AfAA9_B, or both with Af-EGL7. All reactions were incubated in 50 mM sodium phosphate buffer (pH 6.0) at 1000 rpm and 50 °C for 4, 8, or 24 h. At the end of each reaction, the measured reducing sugars were plotted as a function of the relative proportions among the added enzymes. Asterisks indicate significant difference (p < 0.05) in relation to the control system (AfCel6A, Af-EGL7, or cocktail alone).
Ijms 22 00276 g007
Figure 8. Effect of Celluclast® 1.5L cocktail supplementation with AfCel6A or AfAA9_B on hydrolysis of (a) SEB, (b) corncob, and (c) rice straw. All reactions were incubated in 50 mM sodium phosphate buffer (pH 6.0) containing 1% (w/v) of each biomass at 1000 rpm and 50 °C for 24 and 48 h. At the end of each reaction, the measured reducing sugars was plotted as a function of the relative proportions between the recombinant enzymes and commercial cellulases. Asterisks indicate significant difference (p < 0.05) in relation to the cocktail alone.
Ijms 22 00276 g008
Figure 9. Combined activities of Af-EGL7 and AfCel6A or AfAA9_B on the hydrolysis of (a) SEB; (b) corncob; and (c) rice straw. All reactions were incubated in 50 mM sodium phosphate buffer (pH 6.0) containing 1% (w/v) of each biomass for 24 and 48 h at 50 °C and 1000 rpm. At the end of each reaction, the measured reducing sugars were plotted in function of the relative proportions between the recombinant enzymes. Asterisks indicate significant difference (p < 0.05) in relation to the Af-EGL7 alone.
Ijms 22 00276 g009
Table 1. Peptide sequences.
Protein GenePeptide SequencePrecursor MZPrecursor ChargeProduct MZProduct Charge
AFUA_4G07850ITSIAGLLASASLVAGHGFVSGIVADGK871.67522631049.5625861
AFUA_4G07850ITSIAGLLASASLVAGHGFVSGIVADGK871.6752263992.5411221
AFUA_4G07850ITSIAGLLASASLVAGHGFVSGIVADGK871.6752263845.4727081
AFUA_4G07850ITSIAGLLASASLVAGHGFVSGIVADGK871.6752263746.4042941
AFUA_4G07850ITSIAGLLASASLVAGHGFVSGIVADGK871.6752263659.3722661
AFUA_4G07850ITSIAGLLASASLVAGHGFVSGIVADGK871.6752263602.3508021
AFUA_4G07850NTDPGIK372.9124112630.3457171
AFUA_4G07850NTDPGIK372.9124112529.2980381
AFUA_4G07850NTDPGIK372.9124112414.2710951
AFUA_4G07850NTDPGIK372.9124112317.2183321
Table 2. Comparison among catalytic and biochemical properties of GH6 cellobiohydrolases.
Source OrganismEnzyme NameExpression SystemSubstrateVmaxKMkcatkcat/KMOptimal TOptimal pHThermal StabilitypH StabilityRef.
Aspergillus fumigatus Af293AfCel6APichia pastorisCMC-Na195.2 ± 4.65 U mg−17.44 ± 0.51 g/L147.9 s−119.9 mL mg−1 s−155–60 °CpH 5.5–6.5>70% after 24 h at 50 °C; about 40% after 90 min at 60–80 °C; more than 25% after 30 min at 90 °CMore than 70% at pH 3.0–10.0 after 72 hThis study
Aspergillus fumigatusAfCel6AAspergillus oryzaeAvicel PH101-48.6 ± 14.8 g L−10.9 ± 0.1 s−1-70 °C-No loss at 60 °C after 1 h-[35]
Aspergillus terreusAtCel6AAspergillus oryzaeAvicel PH101----50 °C->90% after 1 h at 50 °C-[35]
Talaromyces funiculosusTfCel6AAspergillus oryzaeAvicel PH101-21.6 ± 3.2 g L−10.5 ± 0.02 s−1-60 °C-No loss at 50 °C after 1 h-[35]
Colletotrichum graminicolaCgCel6AAspergillus oryzaeAvicel PH101----40 ° C->90% after 1 h at 40 °C-[35]
CgCel6B89.0 ± 13.2 g L−11.8 ± 0.2 s−150 °C>90% after 1 h at 50 °C
Trichoderma reeseiTrCel6AAspergillus oryzaeAvicel PH101-24.3 ± 4.0 g L−10.6 ± 0.04 s−1-70 °C-No loss at 50 °C after 1 h-[35]
Cel6A1Pichia pastorisCMC-Na10.7 mmol min−1 mg−10.31 mg mL−1--60 °CpH 5.590% after 30 min at 60 °C-[59]
Cel6A2Pichia pastorisPASC----55 °CpH 5.5–6.0100% at 40 °C and 50% at 60 °C, after 30 minNo loss at pH 5.0–6.0; rapid inactivation at more alkaline pH; and some instability at more acidic pH after 30 min[60]
CBHII-PASC10 U mg−13.8 mg mL−1--60 °CpH 5.080% after 30 min at 60 °CStable at pH 3.5–6.0 after 30 min[61]
Magnaporthe oryzae Ina72MoCel6AMagnaporthe oryzaeCellotetraose454.5 µg min−1 mg−124.3 mM--40 °CpH 9.0--[62]
Cellopentaose63.3 µg min−1 mg−13.3 mM
Schizophyllum commune KMJ820CBH IIEscherichia colipNPC20.8 U mg−11.4 mM--50 °CpH 5.0--[63]
Penicillium occitanis Pol 6CBH II-pNPC-5 mM--65 °CpH 4.0–5.0Almost 100% at 30–50 °C; 50% at 60 °C; and complete inactivation at 70 °C, after 30 minStable at pH 2.0–9.0 after 24 h[64]
Talaromyces emersoniiCBH II-CNPG39.1 U mg−14.5 mM8.9 s−11.9 mM−1 s−168 °CpH 3.8t1/2 = 38 min at 80 °C (pH 5.0)t1/2 = 38 min at pH 5.0 (80 °C)[65]
Trichoderma viride CICC13038CBH IISaccharomyces cerevisiaeCMC-Na----70 °CpH 5.0--[66]
Neocallimastix patriciarum J11J11 CelAEscherichia coliBarley β-glucan----50 °CpH 6.0More than 70% at up to 50 °C and approximately 50% at 70 °C, after 1 hMore than 80% at pH 5.2–11.3; and approximately 70% at pH 3.0, 4.2, and 12.3, after 1 h[67]
Irpex lacteus MC-2Ex-4Pichia pastorisPASC----50 °CpH 5.0More than 80% at 60 °C (pH 3.0–8.0) after 1 hMore than 80% at pH 3.0–8.0 (60 °C) after 1 h[68]
Chaetomium thermophilum HSAUP072651CBH IIPichia pastorispNPC----50 °CpH 4.0No loss at 50 °C; approximately 20% at 60 °C; and complete inactivation at 80 °C, after 1 h-[69]
Table 3. Comparison among catalytic and biochemical properties of LPMOs.
Source OrganismProtein NameExpression SystemSubstrateCo-SubstrateVmaxKMkcatkcat/KMOptimal TOptimal pHThermostabilitypH StabilityRef
Aspergillus fumigatus Af293AfAA9_BPichia pastoris X332,6-DMP§
a H2O2
78.52 ± 3.33 U g−12.04 ± 0.24 µM0.034 s−10.017 µM−1 s−1-***
9
--This study
§
b H2O2
1481 ± 72.19 U g−10.79 ± 0.12 µM0.64 s−10.81 µM−1 s−1-60 °C: 50 % after 48 h
50 °C: almost 100% of activity after 48 h
No loss of activity at pH 5.0–10.0
§
2,6-DMP
a H2O249.26 ± 4.48 U g−1106.3 ± 27.9 µM0.021 s−11,98 × 10⁻⁴ µM−1 s−1----
b H2O2972.5 ± 28.31 U g−112.15 ± 1.76 µM 0.42 s−10.035 µM−1 s−1----
Scytalidium thermophilumPMO9D_SCYTHPichia pastoris X33Avicel§
H2O2
0.36 U mg−14.54 mg mL−12.99 × 10⁻² min−16.58 × 10⁻³ mg−1 mL min−1----[70]
CMC14.96 U mg−110.6 mg mL−11.61 min−11.52 × 10⁻¹ mg−1 mL min−160 °C760 °C (t1/2 = 60.58 h, pH 7.0)Above 90% after 48 h at pH 7.0
2,6-DMP0.13 U mg−10.51 mM1.84 × 10−1 min−13.57 × 10⁻¹ mM−1 min−1 ---
Malbranchea cinnamomeaPMO9D_MALCIAvicel0.17 U mg−15.87 mg mL−11.05 × 10⁻² min−11.79 × 10⁻³ mg−1 mL min−1 ---
CMC9.59 U mg−129.27 mg mL−10.76 min−12.62 × 10⁻² mg−1 mL min−150 °C950 °C (t1/2 = 144 h, pH 7.0)Above 80% after 72 h at pH 9.0
2,6-DMP0.12 U mg−11.17 mM1.21 min−11.03 × 10⁻¹ mM−1 min−1 ---
Thielavia terrestrisTtLPMO9E-PWS§
O2
-49.80 g L−13.8 min−1* 1.85 × 103 M−1 min−1----[71]
Myceliophthora thermophilaMtPMO9ENeurospora crassacellohexaose§
O2
-32 µM10.1 min−10.30 µM−1 min−1----[72,73]
§
cellohexaose
O2-230 µM17 min−17.4 × 10⁻² µM−1 min−1----
H2O2-53 µM# 15.9 s−13.0 × 10⁵ M−1 s−1----
Serratia marcescensCBP21Escherichia coli BL21(DE3) StarCNW§
H2O2
1.11 µM s−10.58 mg mL−16.7 s−1≅106 M−1 s−1----[74]
§
CNW
H2O2-2.8 µM------
Lentinus similisLs(AA9)AAspergillus oryzae MT3568cellotetraose§
O2
-43 µM0.11 s−12.6 × 10³ M−1 s−1----[75]
Aspergillus fumigatus NITDGPKA3**
CAF32158.1
Pichia pastoris X332,6-DMP§
H2O2
1.11 µM min−111.23 µM0.642 min−15.7 × 10⁻² µM min−1----[76]
Myceliophthora thermophilaMtLPMO9DMyceliophthora thermophila C1--------****
Tmapp at pH 7.0 = 68 °C
-[77]
Myceliophthora thermophilaMtLPMO9JAspergillus nidulans--------****
Tmapp at pH 6.0 = 58 °C
-[78]
Thermoascus aurantiacusTaLPMO9AAspergillus oryzae--------****
Tmapp at pH 7.0 = 69 °C
-[79]
Notations: (§) fixed concentration; (*) kcat/KM calculated for this paper considering the molecular weight of 24.2 kDa for TtLPMO9E; (**) this enzyme has no name yet, the provided code is its codifying gene; (***) pH stability not correlated with analyzed pH values; (****) apparent midpoint transition temperatures (Tmapp) calculated on the basis of CD (MtLPMO9D and TaLPMO9A) and Intrinsic Trp fluorescence emission (ITFE) (MtLPMO9J) analysis; (#) kcat estimated based on previous kcat/KM and KM values for MtPMO9E. Kinetic studies were conducted at (a) pH = 6.0 and (b) pH = 9.0. Abbreviations: PWS—Pretreated wheat straw; CNW—Chitin nanowhisker. For more details, see the corresponding references.
Table 4. Effects of additives on AfCel6A and AfAA9_B activity.
AfAA9_BAfCel6A
Additive% Relative Activity
None100.0 ± 1.0100.0 ± 0.9
SDS107.8 ± 4.853.72 ± 0.31
Tween 20103.7 ± 9.693.24 ± 2.11
EDTA091.88 ± 1.56
Ascorbic Acid-121.40 ± 2.55
DMSO108.3 ± 1.5101.03 ± 3.58
β-mercaptoethanol36.7 ± 0.6134.24 ± 1.02
ZnSO436.8 ± 6.183.67 ± 0.65
MnCl282.2 ± 0.7189.25 ± 2.33
CoCl20116.75 ± 1.36
CaCl293.6 ± 3.3101.1 ± 2.4
FeSO40125.83 ± 3.61
MgSO4113.9 ± 1.995.92 ± 2.13
CuSO435.2 ± 4.685.08 ± 0.65
AgNO30179.27 ± 20.04
KCl107.5 ± 2.198.87 ± 2.44
(NH4)2SO488.9 ± 3.299.9 ± 2.1
DTT0150.68 ± 5.29
Triton X-10084.8 ± 2.391.55 ± 1.19
SLS115.3 ± 0.793.80 ± 1.60
Table 5. Primer sequences used to amplify and to clone genes.
Primer NameSequence (5′-3′)
AfAA9_B FwCAAAAAACAACTAATTATTCGAAACGAGGAATTCCATGACTTTGTCCAAGATCAC
AfAA9_B RvCAGATCCTCTTCTGAGATGAGTTTTTGTTCTAGAGCGTTGAACAGTGCAGGAC
AfCel6A FwGAGAAAAGAGAGGCTGAAGCTGAATTCCAGCAGACCGTATGG
AfCel6A RvATCCTCTTCTGAGATGAGTTTTTGTTCTAGAAAGGACGGGTTAGC
Notation: The overlapping regions between the vector and the insert are in bold.
Publisher’s Note: MDPI stays neutral with regard to jurisdictional claims in published maps and institutional affiliations.

