
LINC01133 Inhibits Invasion and Promotes Proliferation in an Endometriosis Epithelial Cell Line

 , , , , and
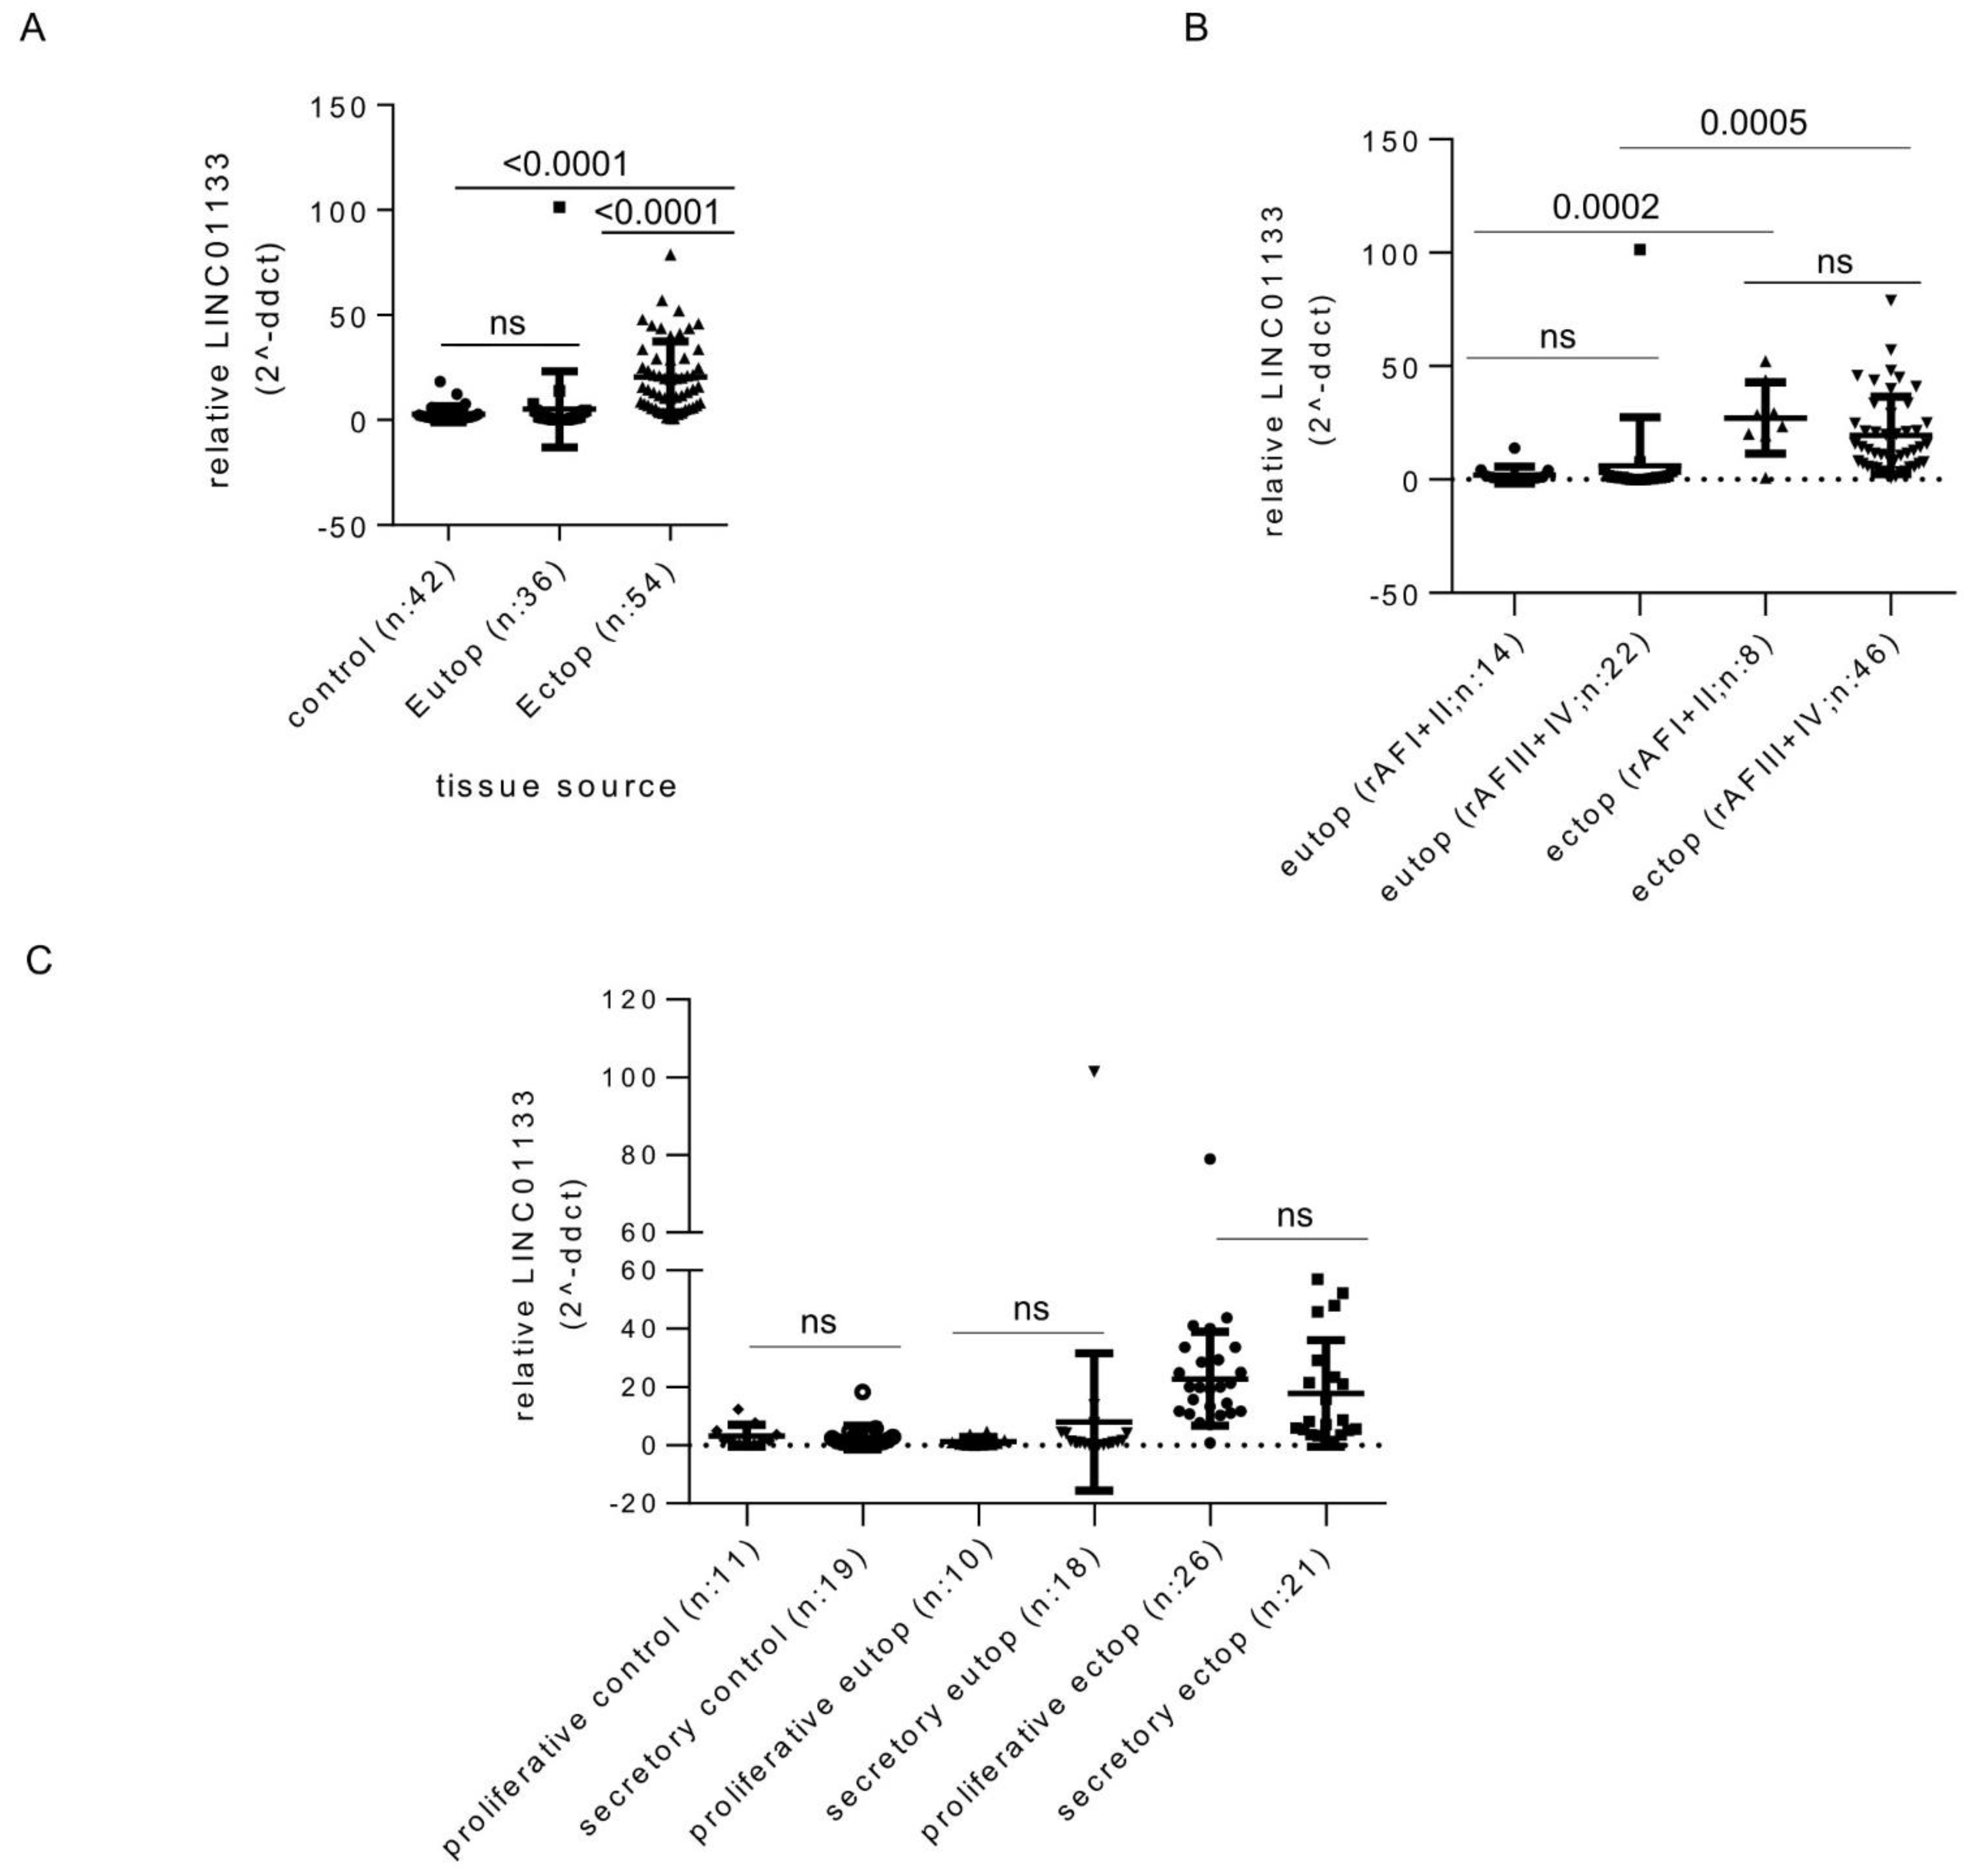
Abstract
:1. Introduction
2. Results
2.1. LINC01133 Is Upregulated in Ectopic Endometriosis Lesions
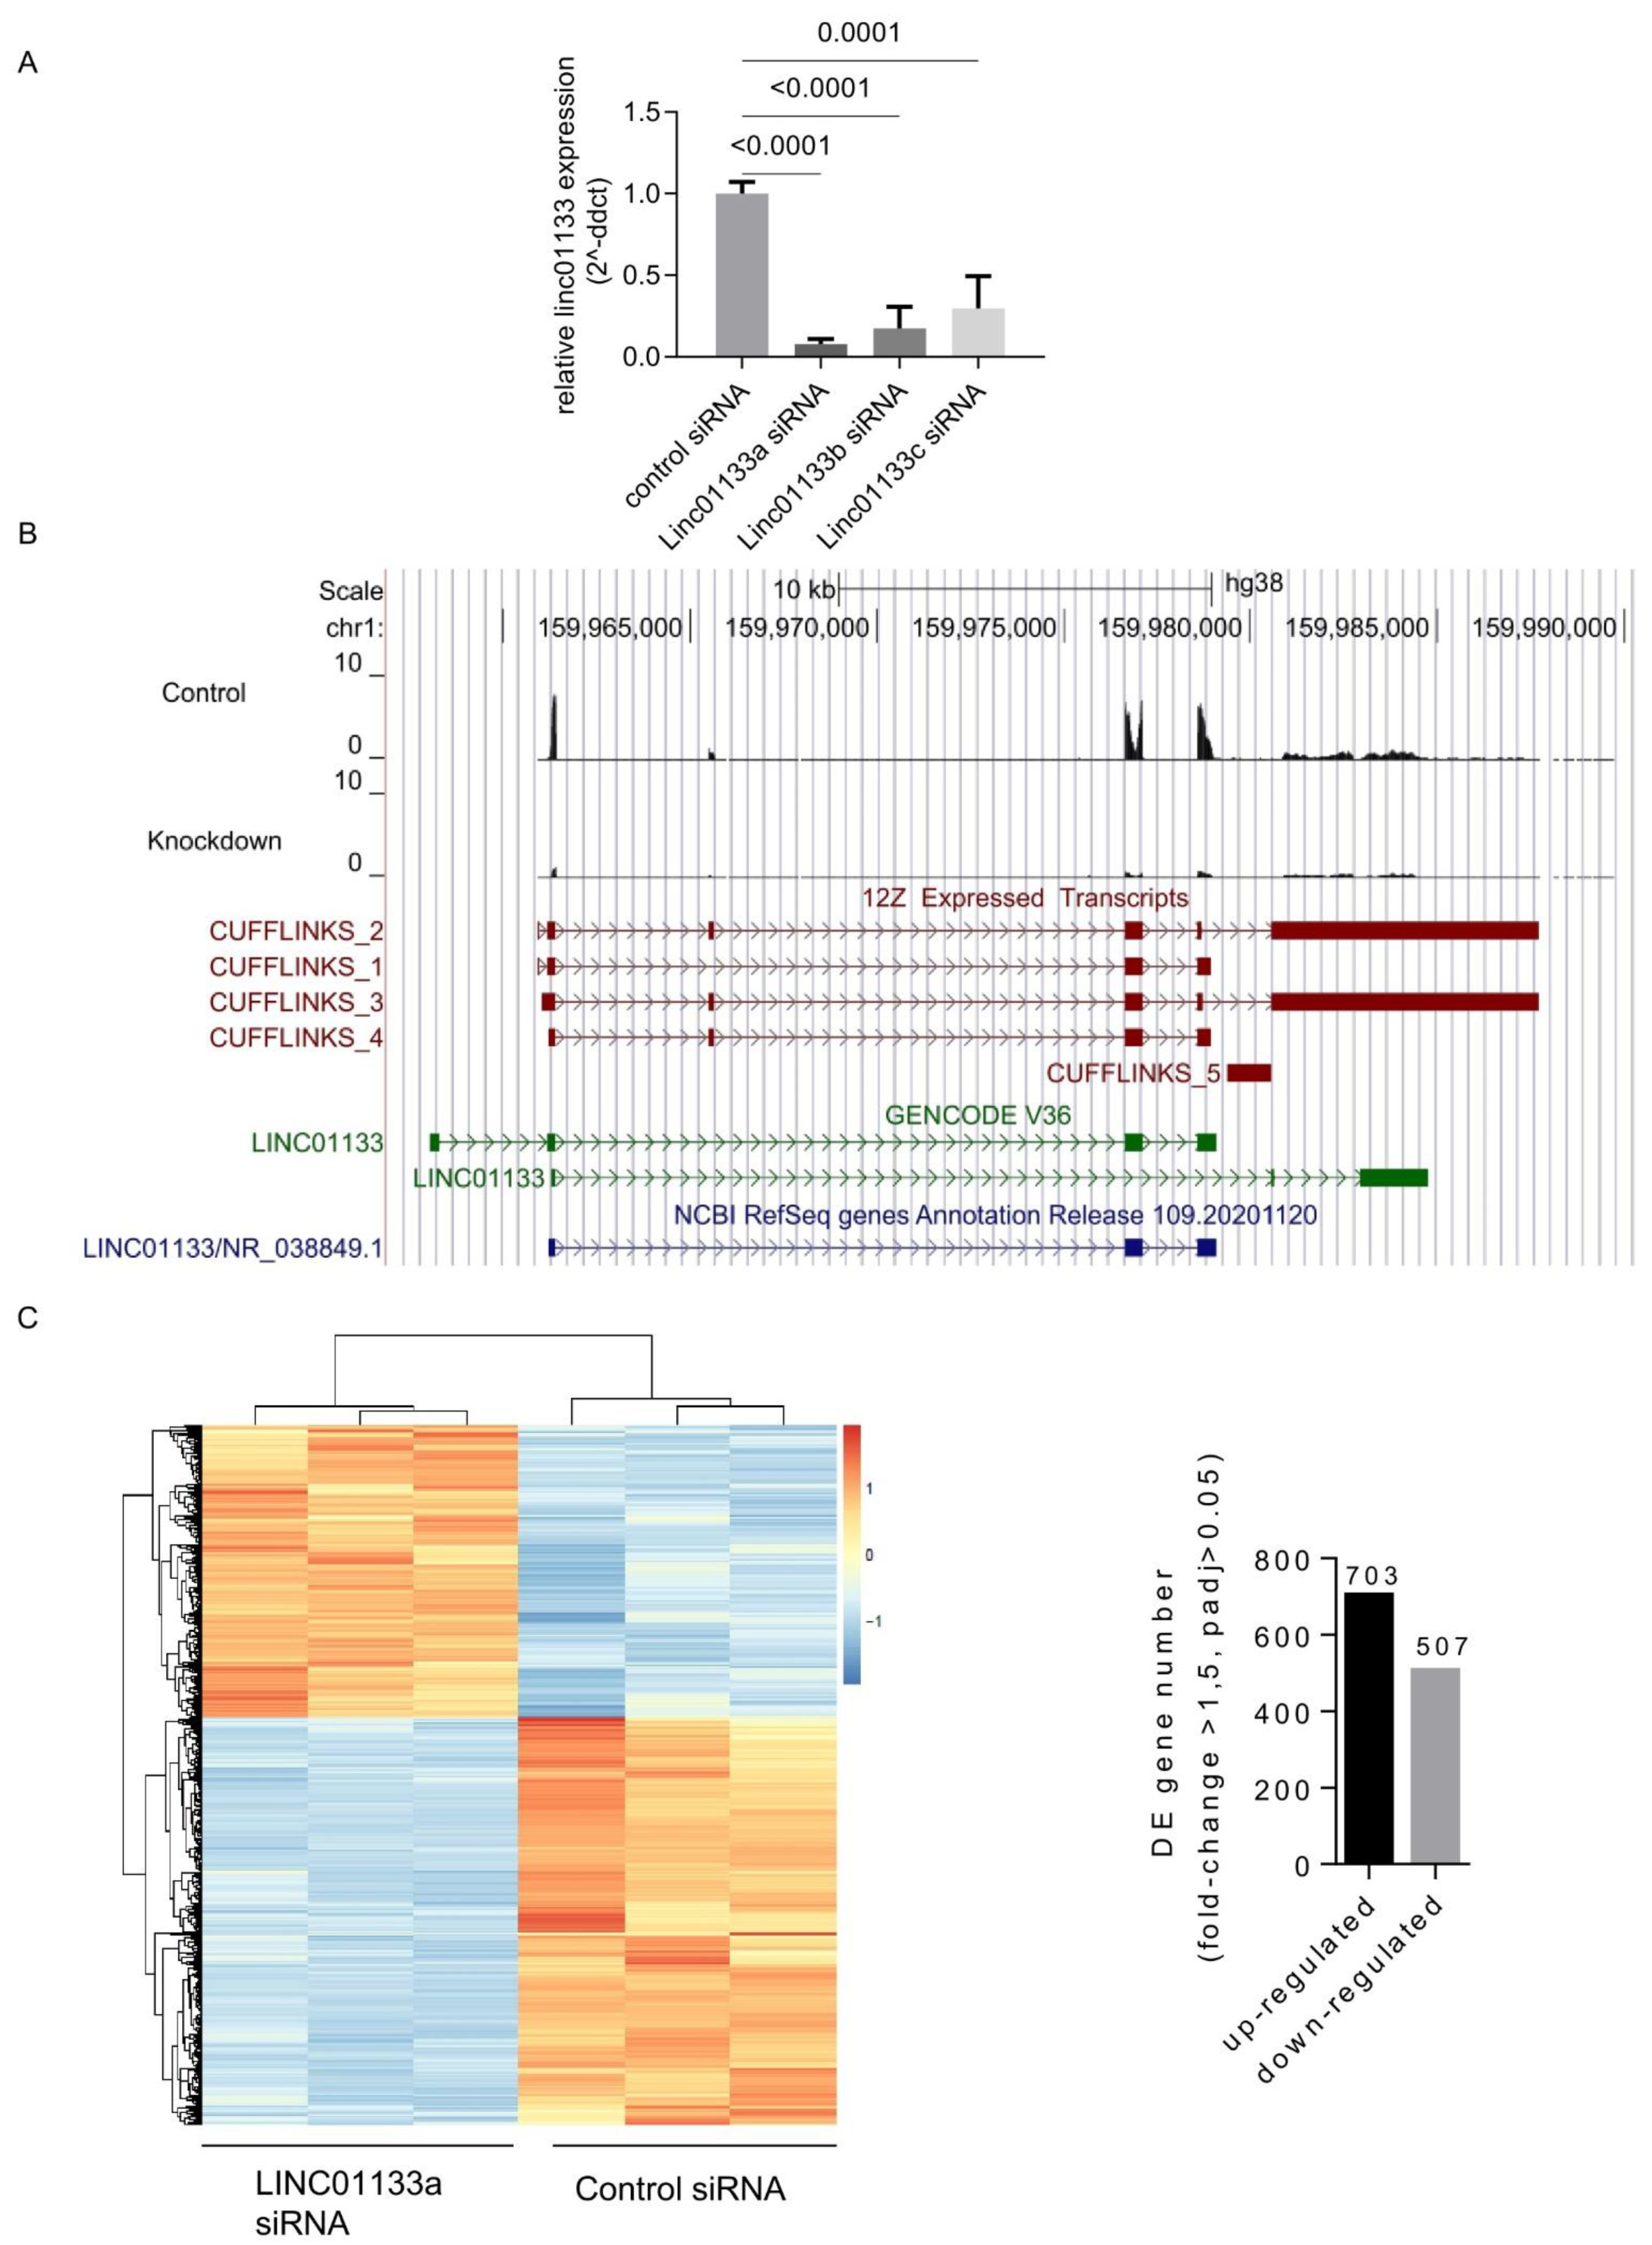
2.2. LINC01133 siRNA Knockdown in 12Z Endometriosis Epithelial Cells Leads to Transcriptional Deregulation of 1210 Genes
2.3. The Knockdown of LINC01133 in 12Z Cells Effects Genes and Pathways with a Known Function in Endometriosis Lesion Formation
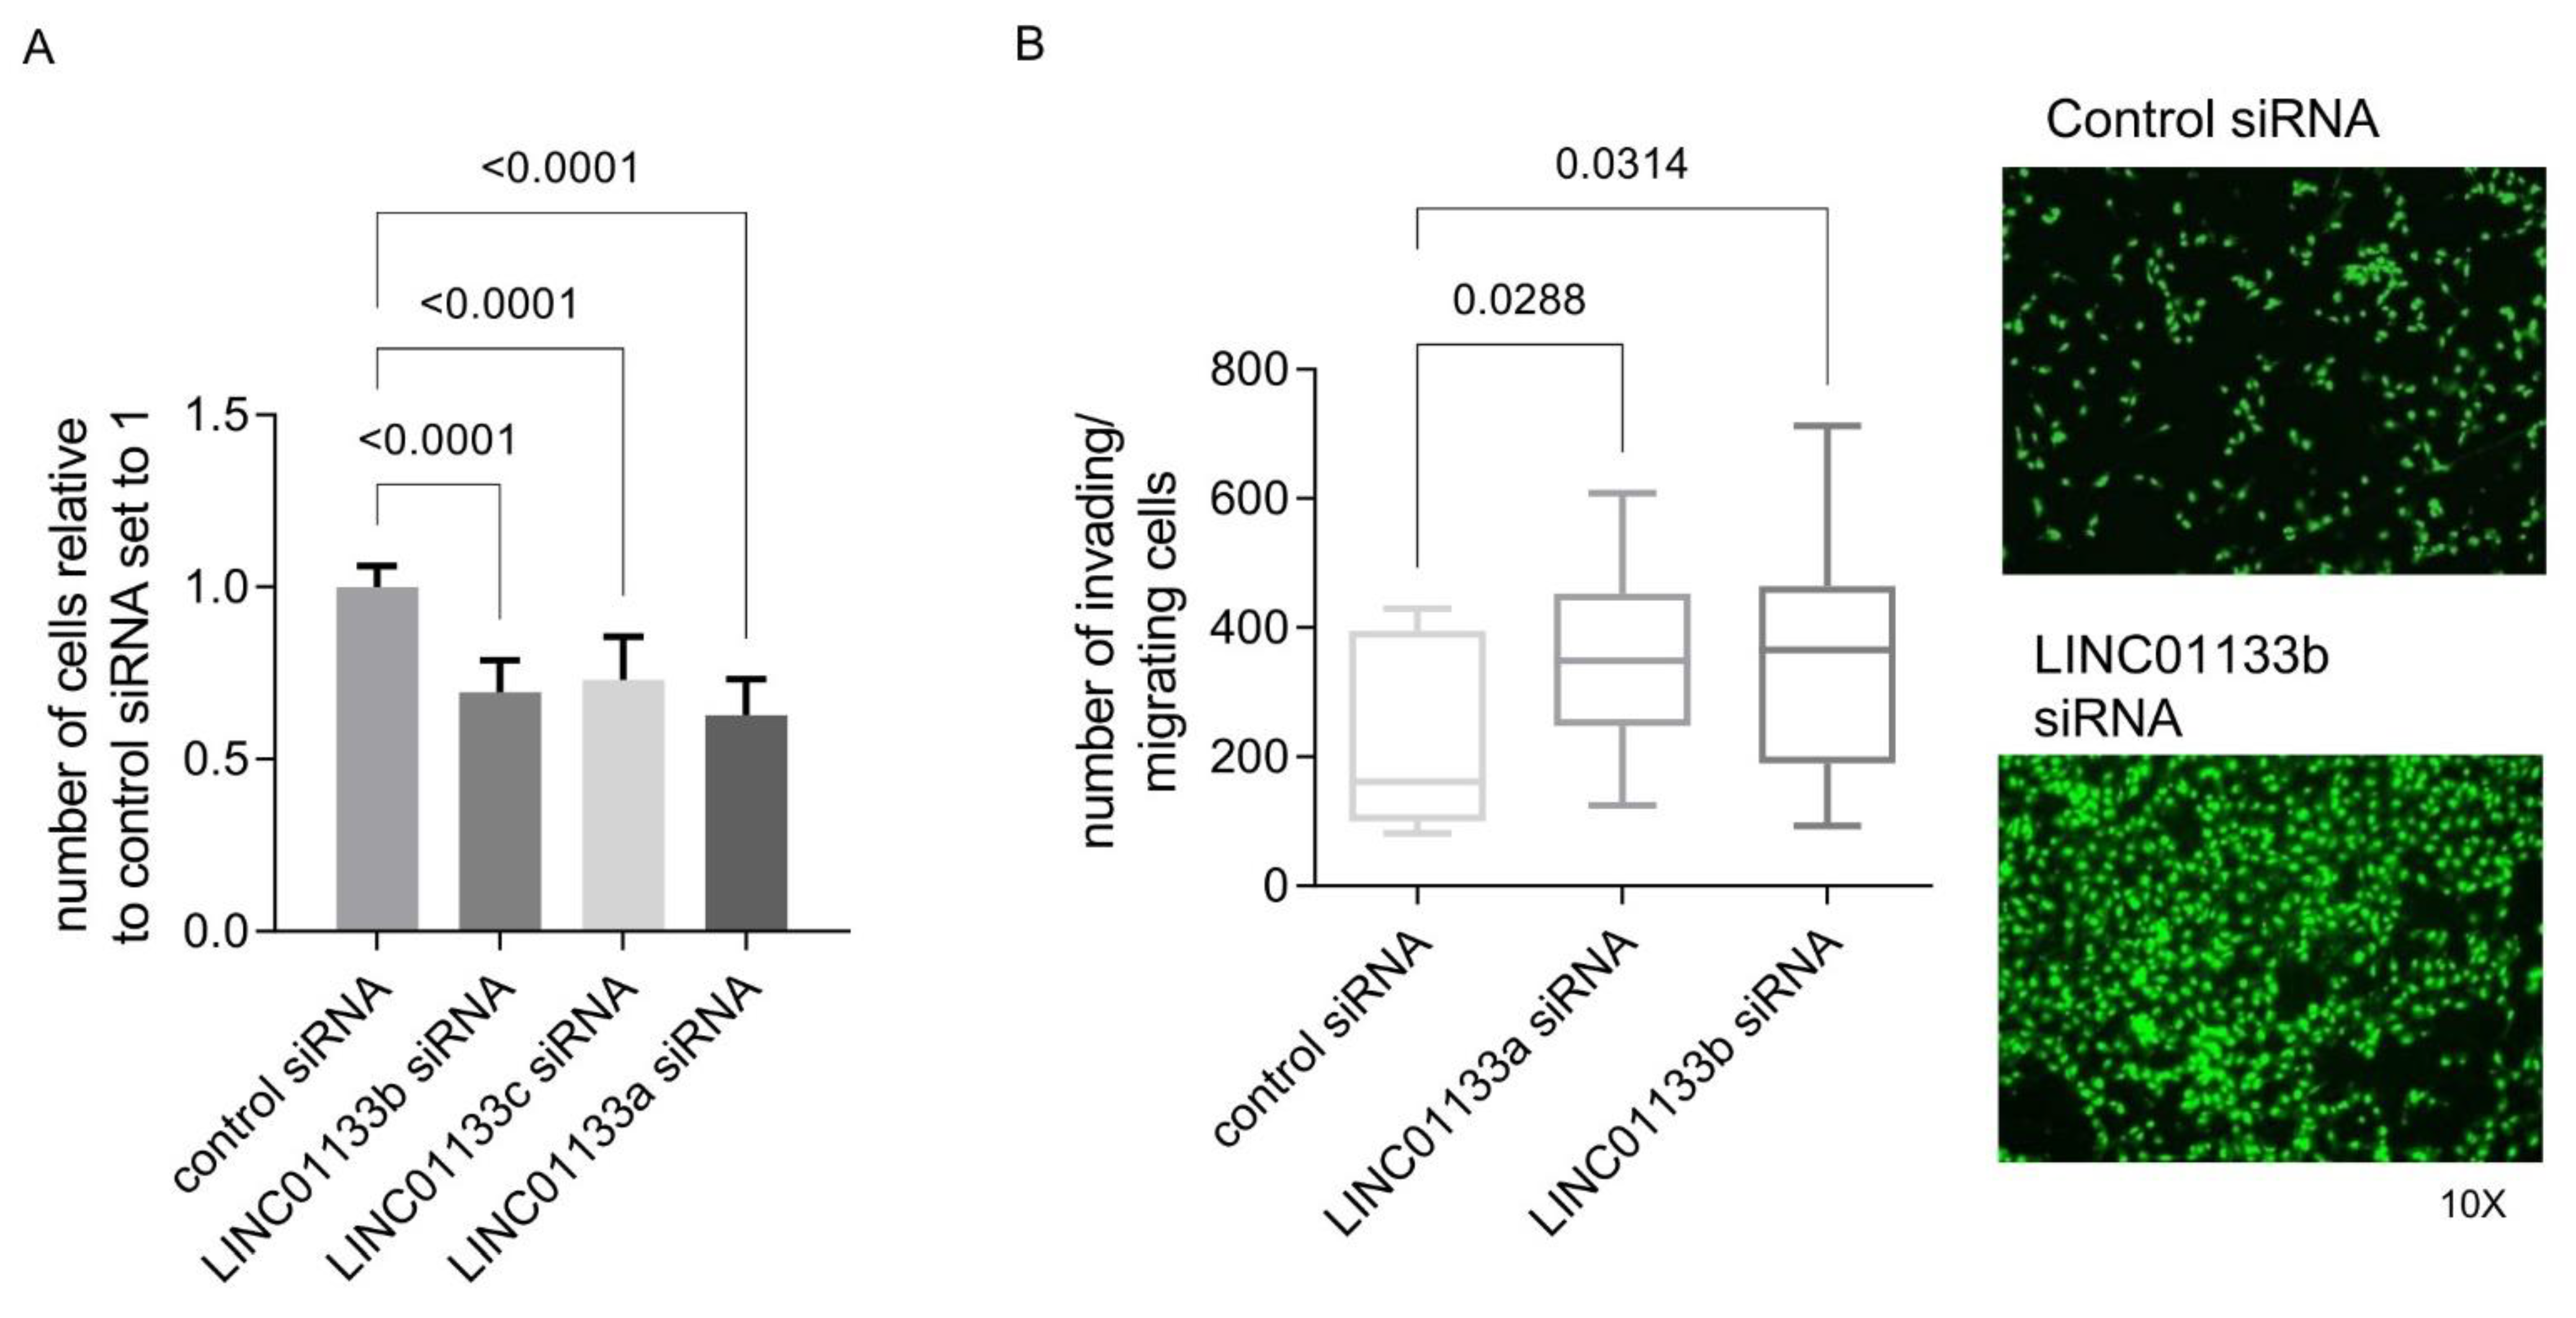
2.4. LINC01133 Regulates Proliferation and Invasion of Endometriosis Epithelial Cells In Vitro
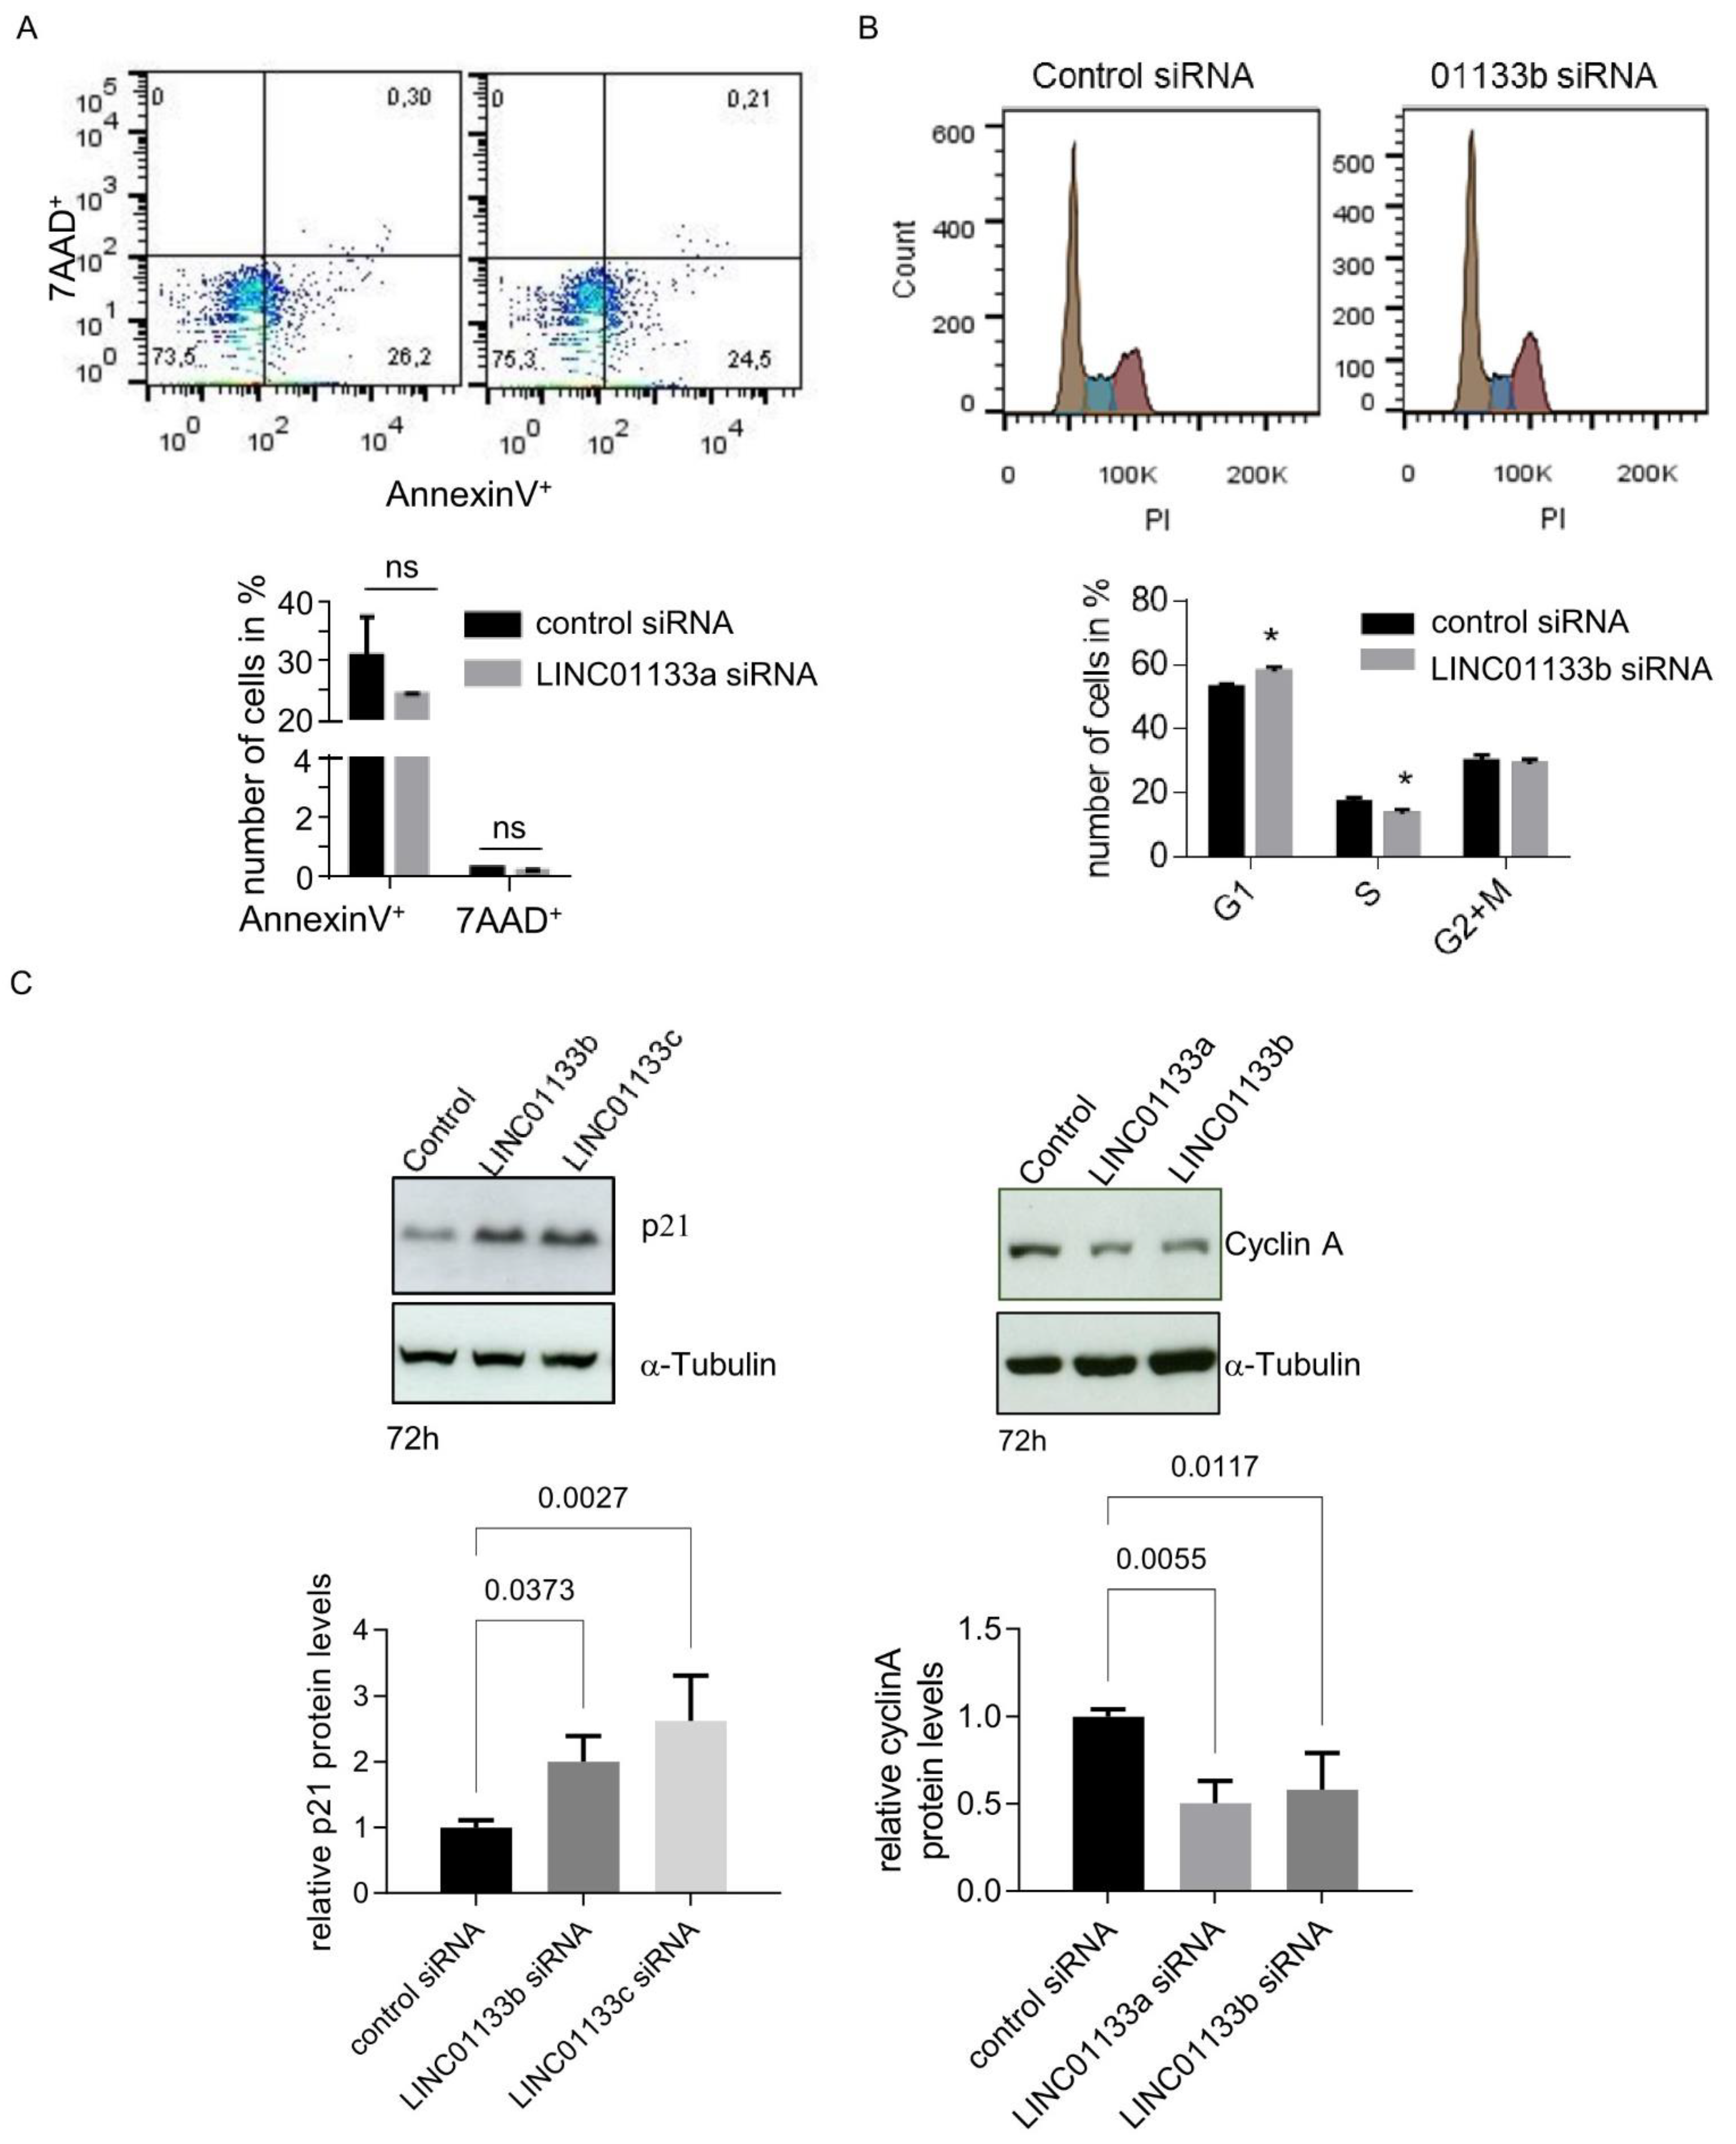
2.5. LINC01133 Regulates Cell Cycle and the Levels of Expression of Cell Cycle Regulatory Proteins p21 and Cyclin A
2.6. LINC01133 Is Not a Regulator of EMT in 12Z Endometriosis Epithelial Cells
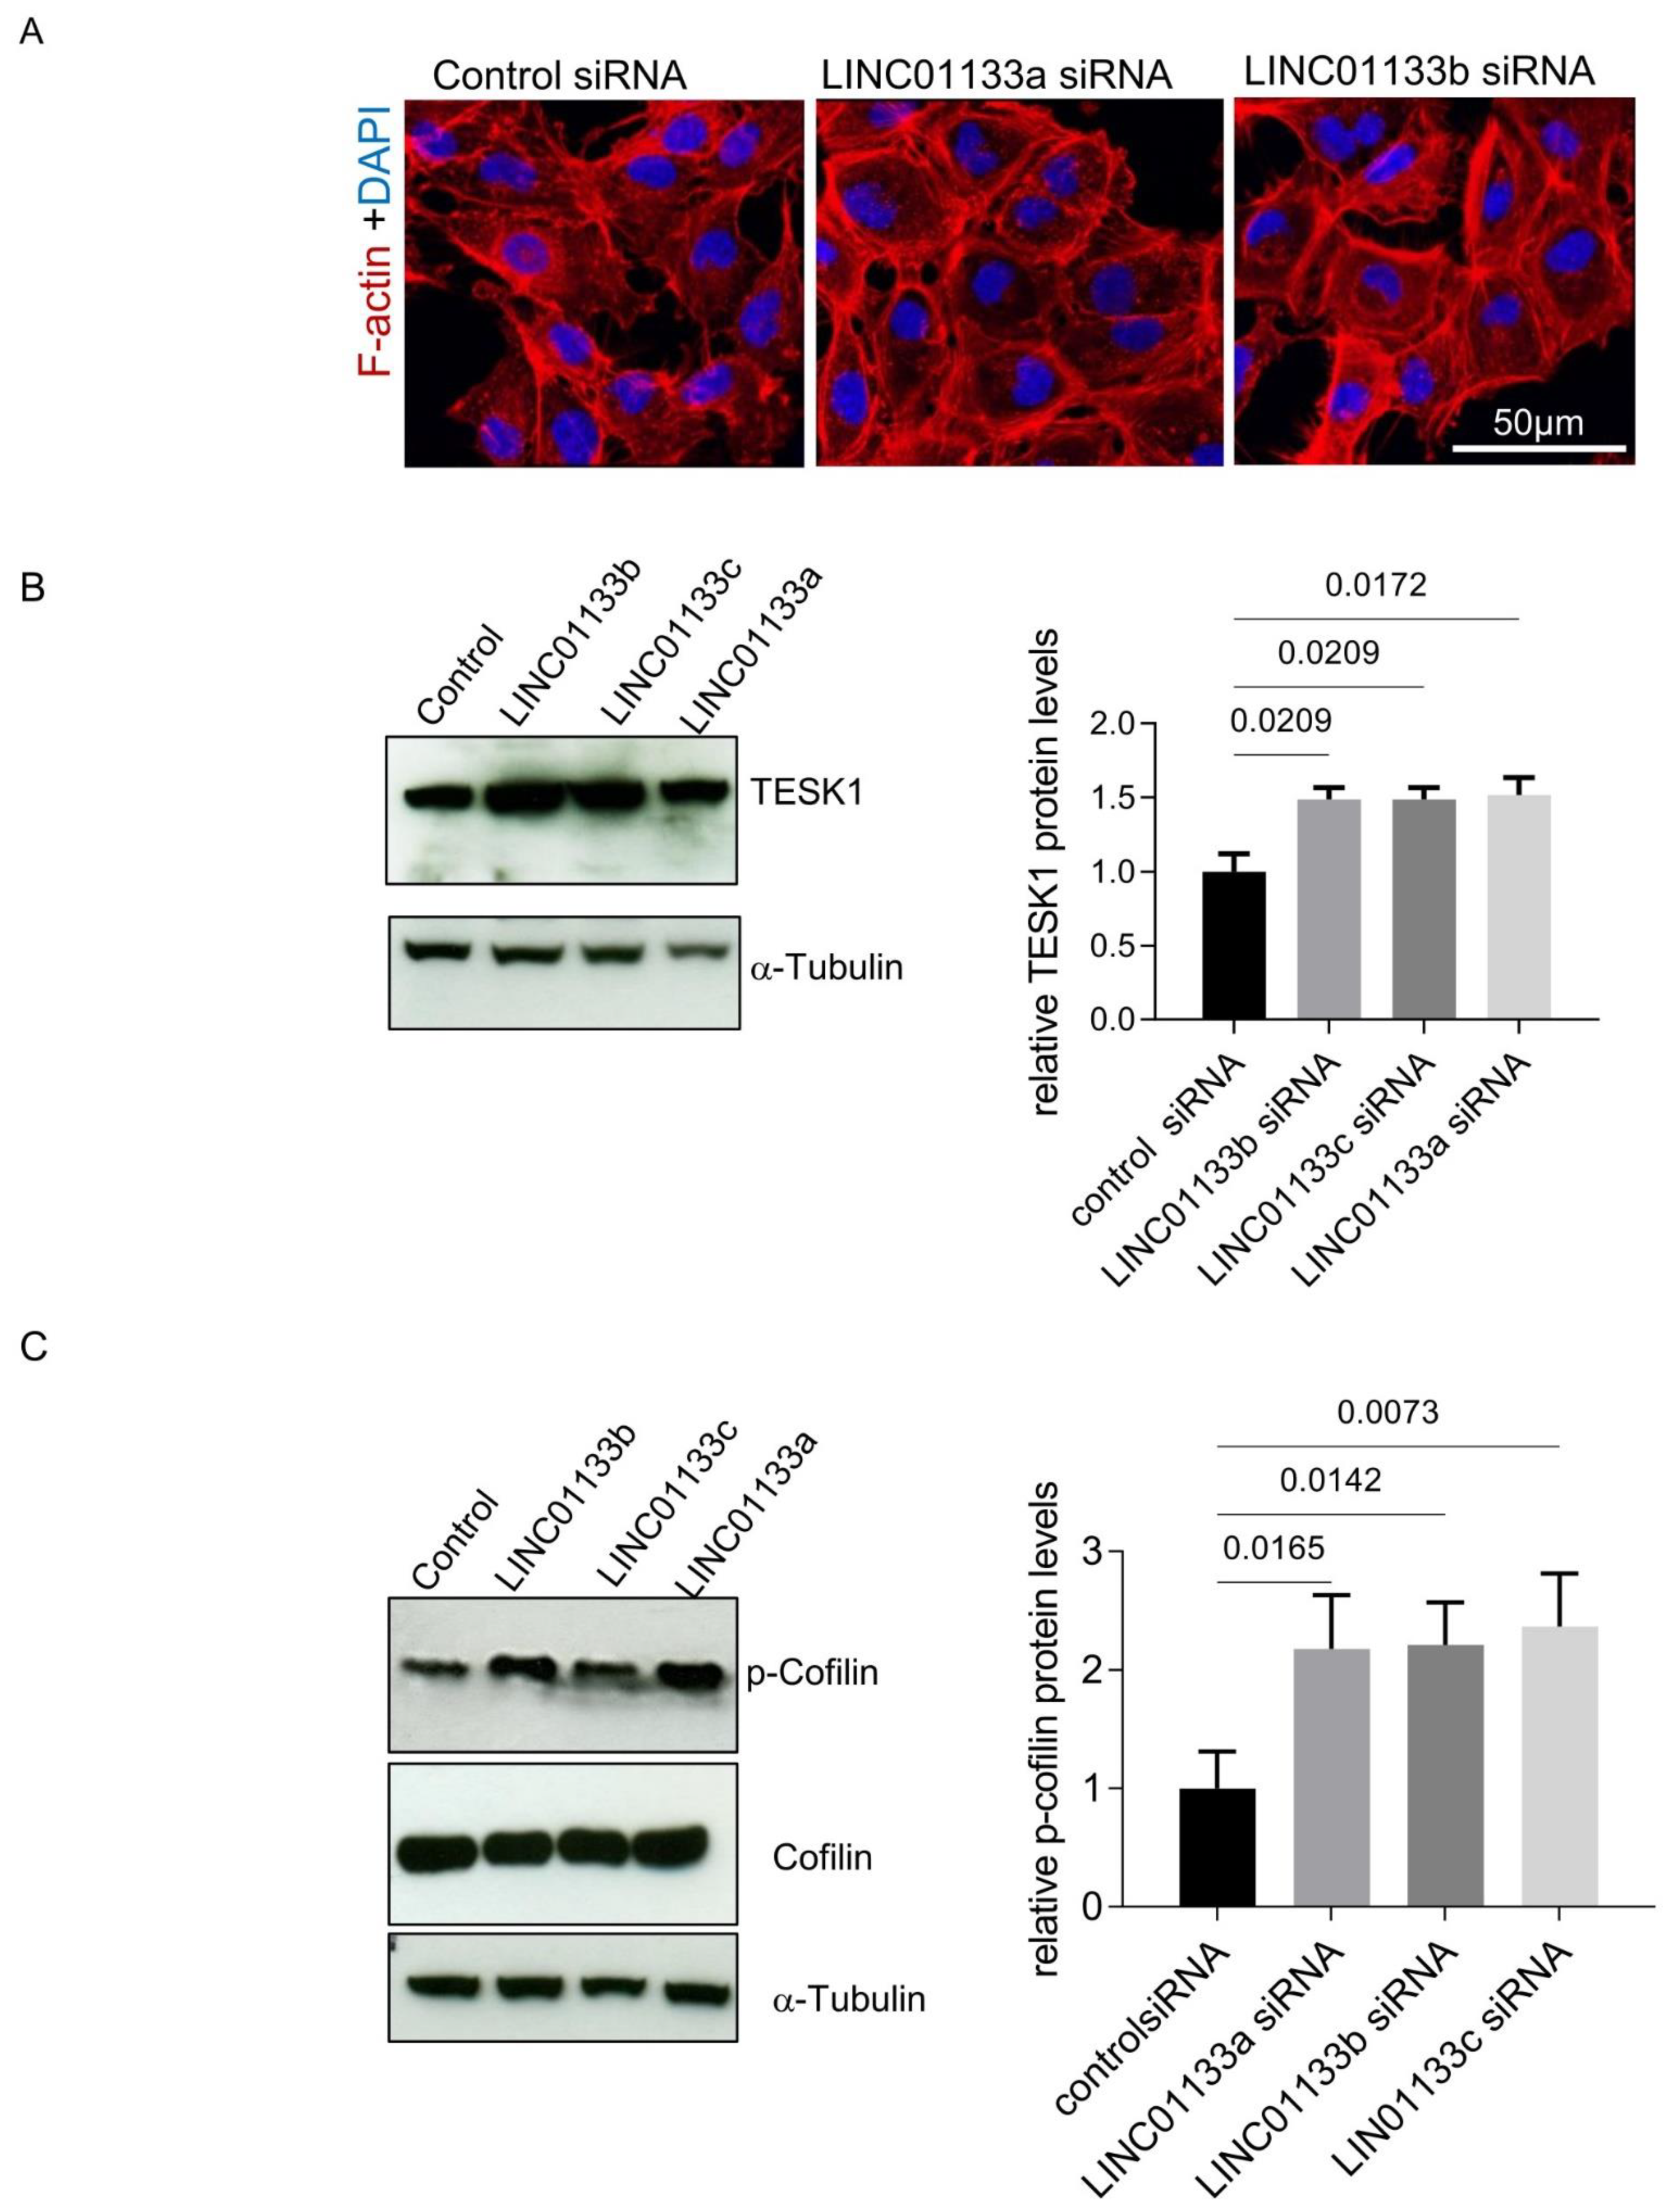
2.7. Active Cytoskeleton Remodeling in 12Z Cells Following LINC01133 Knockdown
3. Discussion
4. Materials and Methods
4.1. Study Population
4.2. Cell Line for In Vitro Evaluation of LINC01133 Function
4.3. RNA-Scope
4.4. LINC01133 Knockdown
4.5. RNA Isolation
4.6. RNA-Sequencing and Data Analysis
4.7. Assembly of LINC01133 Isoforms Expressed in the 12Z Cell Line
4.8. Gene Set Enrichment Analysis (GSEA) and Gene Ontology Enrichment Analysis (GOEA)
4.9. Quantitative Reverse Transcription PCR (qRT-PCR) for Measuring mRNA Expression
4.10. Protein Isolation and Western Blot
4.11. Analysis of Cell Cycle and Cell Death Using Fluorescence-Activated Cell Scanning (FACS) Flow Cytometry
4.12. Proliferation Assay
4.13. Matrigel-Invasion Assay
4.14. Immunofluorescence, Cell Size and Stress Fiber Analysis
4.15. Statistics
4.16. Websites and Software
Supplementary Materials
Author Contributions
Funding
Institutional Review Board Statement
Informed Consent Statement
Data Availability Statement
Acknowledgments
Conflicts of Interest
References
- Zondervan, K.T.; Becker, C.M.; Missmer, S.A. Endometriosis. N. Engl. J. Med. 2020, 382, 1244–1256. [Google Scholar] [CrossRef] [PubMed]
- Hogg, C.; Horne, A.W.; Greaves, E. Endometriosis-Associated Macrophages: Origin, Phenotype, and Function. Front. Endocrinol. 2020, 11, 7. [Google Scholar] [CrossRef]
- Kapranov, P.; Cheng, J.; Dike, S.; Nix, D.A.; Duttagupta, R.; Willingham, A.T.; Stadler, P.F.; Hertel, J.; Hackermuller, J.; Hofacker, I.L.; et al. RNA maps reveal new RNA classes and a possible function for pervasive transcription. Science 2007, 316, 1484–1488. [Google Scholar] [CrossRef] [Green Version]
- Frankish, A.; Diekhans, M.; Ferreira, A.M.; Johnson, R.; Jungreis, I.; Loveland, J.; Mudge, J.M.; Sisu, C.; Wright, J.; Armstrong, J.; et al. GENCODE reference annotation for the human and mouse genomes. Nucleic Acids Res. 2019, 47, D766–D773. [Google Scholar] [CrossRef] [Green Version]
- Ponting, C.P.; Oliver, P.L.; Reik, W. Evolution and functions of long noncoding RNAs. Cell 2009, 136, 629–641. [Google Scholar] [CrossRef] [PubMed] [Green Version]
- Wang, K.C.; Chang, H.Y. Molecular mechanisms of long noncoding RNAs. Mol. Cell 2011, 43, 904–914. [Google Scholar] [CrossRef] [PubMed] [Green Version]
- Uszczynska-Ratajczak, B.; Lagarde, J.; Frankish, A.; Guigo, R.; Johnson, R. Towards a complete map of the human long non-coding RNA transcriptome. Nat. Rev. Genet. 2018, 19, 535–548. [Google Scholar] [CrossRef]
- Statello, L.; Guo, C.J.; Chen, L.L.; Huarte, M. Gene regulation by long non-coding RNAs and its biological functions. Nat. Rev. Mol. Cell Biol. 2021, 22, 96–118. [Google Scholar] [CrossRef] [PubMed]
- Geisler, S.; Coller, J. RNA in unexpected places: Long non-coding RNA functions in diverse cellular contexts. Nat. Rev. Mol. Cell Biol. 2013, 14, 699–712. [Google Scholar] [CrossRef] [PubMed] [Green Version]
- Sun, P.R.; Jia, S.Z.; Lin, H.; Leng, J.H.; Lang, J.H. Genome-wide profiling of long noncoding ribonucleic acid expression patterns in ovarian endometriosis by microarray. Fertil. Steril. 2014, 101, 1038–1046 e7. [Google Scholar] [CrossRef]
- Cai, H.; Zhu, X.; Li, Z.; Zhu, Y.; Lang, J. lncRNA/mRNA profiling of endometriosis rat uterine tissues during the implantation window. Int. J. Mol. Med. 2019, 44, 2145–2160. [Google Scholar] [CrossRef] [PubMed] [Green Version]
- Li, Y.; Liu, Y.D.; Chen, S.L.; Chen, X.; Ye, D.S.; Zhou, X.Y.; Zhe, J.; Zhang, J. Down-regulation of long non-coding RNA MALAT1 inhibits granulosa cell proliferation in endometriosis by up-regulating P21 via activation of the ERK/MAPK pathway. Mol. Hum. Reprod. 2019, 25, 17–29. [Google Scholar] [CrossRef] [PubMed]
- Liu, Y.; Ma, J.; Cui, D.; Fei, X.; Lv, Y.; Lin, J. LncRNA MEG3-210 regulates endometrial stromal cells migration, invasion and apoptosis through p38 MAPK and PKA/SERCA2 signalling via interaction with Galectin-1 in endometriosis. Mol. Cell. Endocrinol. 2020, 513, 110870. [Google Scholar] [CrossRef]
- Zhang, C.; Wu, W.; Zhu, H.; Yu, X.; Zhang, Y.; Ye, X.; Cheng, H.; Ma, R.; Cui, H.; Luo, J.; et al. Knockdown of long noncoding RNA CCDC144NL-AS1 attenuates migration and invasion phenotypes in endometrial stromal cells from endometriosisdagger. Biol. Reprod. 2019, 100, 939–949. [Google Scholar] [CrossRef]
- Qiu, J.J.; Lin, X.J.; Zheng, T.T.; Tang, X.Y.; Zhang, Y.; Hua, K.Q. The Exosomal Long Noncoding RNA aHIF is Upregulated in Serum From Patients With Endometriosis and Promotes Angiogenesis in Endometriosis. Reprod. Sci. 2019, 26, 1590–1602. [Google Scholar] [CrossRef]
- Wang, X.; Zhang, J.; Liu, X.; Wei, B.; Zhan, L. Long noncoding RNAs in endometriosis: Biological functions, expressions, and mechanisms. J. Cell. Physiol. 2021, 236, 6–14. [Google Scholar] [CrossRef]
- Proestling, K.; Birner, P.; Gamperl, S.; Nirtl, N.; Marton, E.; Yerlikaya, G.; Wenzl, R.; Streubel, B.; Husslein, H. Enhanced epithelial to mesenchymal transition (EMT) and upregulated MYC in ectopic lesions contribute independently to endometriosis. Reprod. Biol. Endocrinol. 2015, 13, 75. [Google Scholar] [CrossRef] [Green Version]
- Zondervan, K.T.; Becker, C.M.; Koga, K.; Missmer, S.A.; Taylor, R.N.; Vigano, P. Endometriosis. Nat. Rev. Dis. Primers 2018, 4, 9. [Google Scholar] [CrossRef] [PubMed]
- Konrad, L.; Dietze, R.; Riaz, M.A.; Scheiner-Bobis, G.; Behnke, J.; Horne, F.; Hoerscher, A.; Reising, C.; Meinhold-Heerlein, I. Epithelial-Mesenchymal Transition in Endometriosis-When Does It Happen? J. Clin. Med. 2020, 9, 1915. [Google Scholar] [CrossRef]
- Yang, W.; Yue, Y.; Yin, F.; Qi, Z.; Guo, R.; Xu, Y. LINC01133 and LINC01243 are positively correlated with endometrial carcinoma pathogenesis. Arch. Gynecol. Obstet. 2021, 303, 207–215. [Google Scholar] [CrossRef] [PubMed]
- Feng, Y.; Qu, L.; Wang, X.; Liu, C. LINC01133 promotes the progression of cervical cancer by sponging miR-4784 to up-regulate AHDC1. Cancer Biol. Ther. 2019, 20, 1453–1461. [Google Scholar] [CrossRef]
- Song, Z.; Zhang, X.; Lin, Y.; Wei, Y.; Liang, S.; Dong, C. LINC01133 inhibits breast cancer invasion and metastasis by negatively regulating SOX4 expression through EZH2. J. Cell Mol. Med. 2019, 23, 7554–7565. [Google Scholar] [CrossRef] [PubMed] [Green Version]
- Kong, J.; Sun, W.; Li, C.; Wan, L.; Wang, S.; Wu, Y.; Xu, E.; Zhang, H.; Lai, M. Long non-coding RNA LINC01133 inhibits epithelial-mesenchymal transition and metastasis in colorectal cancer by interacting with SRSF6. Cancer Lett. 2016, 380, 476–484. [Google Scholar] [CrossRef]
- Yang, X.Z.; Cheng, T.T.; He, Q.J.; Lei, Z.Y.; Chi, J.; Tang, Z.; Liao, Q.X.; Zhang, H.; Zeng, L.S.; Cui, S.Z. LINC01133 as ceRNA inhibits gastric cancer progression by sponging miR-106a-3p to regulate APC expression and the Wnt/beta-catenin pathway. Mol. Cancer 2018, 17, 126. [Google Scholar] [CrossRef] [PubMed]
- Yang, Y.-M.; Yang, W.-X. Epithelial-to-mesenchymal transition in the development of endometriosis. Oncotarget 2017, 8, 41679–41689. [Google Scholar] [CrossRef] [Green Version]
- Ge, S.X.; Jung, D.; Yao, R. ShinyGO: A graphical gene-set enrichment tool for animals and plants. Bioinformatics 2020, 36, 2628–2629. [Google Scholar] [CrossRef] [PubMed]
- Subramanian, A.; Tamayo, P.; Mootha, V.K.; Mukherjee, S.; Ebert, B.L.; Gillette, M.A.; Paulovich, A.; Pomeroy, S.L.; Golub, T.R.; Lander, E.S.; et al. Gene set enrichment analysis: A knowledge-based approach for interpreting genome-wide expression profiles. Proc. Natl. Acad. Sci. USA 2005, 102, 15545–15550. [Google Scholar] [CrossRef] [Green Version]
- Mootha, V.K.; Lindgren, C.M.; Eriksson, K.F.; Subramanian, A.; Sihag, S.; Lehar, J.; Puigserver, P.; Carlsson, E.; Ridderstrale, M.; Laurila, E.; et al. PGC-1alpha-responsive genes involved in oxidative phosphorylation are coordinately downregulated in human diabetes. Nat. Genet. 2003, 34, 267–273. [Google Scholar] [CrossRef]
- Toshima, J.; Toshima, J.Y.; Amano, T.; Yang, N.; Narumiya, S.; Mizuno, K. Cofilin phosphorylation by protein kinase testicular protein kinase 1 and its role in integrin-mediated actin reorganization and focal adhesion formation. Mol. Biol. Cell 2001, 12, 1131–1145. [Google Scholar] [CrossRef] [Green Version]
- Klemmt, P.A.B.; Starzinski-Powitz, A. Molecular and Cellular Pathogenesis of Endometriosis. Curr. Womens Health Rev. 2018, 14, 106–116. [Google Scholar] [CrossRef]
- Zang, C.; Nie, F.Q.; Wang, Q.; Sun, M.; Li, W.; He, J.; Zhang, M.; Lu, K.H. Long non-coding RNA LINC01133 represses KLF2, P21 and E-cadherin transcription through binding with EZH2, LSD1 in non small cell lung cancer. Oncotarget 2016, 7, 11696–11707. [Google Scholar] [CrossRef] [Green Version]
- Liu, Y.; Tang, T.; Yang, X.; Qin, P.; Wang, P.; Zhang, H.; Bai, M.; Wu, R.; Li, F. Tumor-derived exosomal long noncoding RNA LINC01133, regulated by Periostin, contributes to pancreatic ductal adenocarcinoma epithelial-mesenchymal transition through the Wnt/beta-catenin pathway by silencing AXIN2. Oncogene 2021, 40, 3164–3179. [Google Scholar] [CrossRef] [PubMed]
- Hanieh, H.; Ahmed, E.A.; Vishnubalaji, R.; Alajez, N.M. SOX4: Epigenetic regulation and role in tumorigenesis. Semin. Cancer Biol. 2020, 67 Pt 1, 91–104. [Google Scholar] [CrossRef]
- Tiwari, N.; Tiwari, V.K.; Waldmeier, L.; Balwierz, P.J.; Arnold, P.; Pachkov, M.; Meyer-Schaller, N.; Schubeler, D.; van Nimwegen, E.; Christofori, G. Sox4 is a master regulator of epithelial-mesenchymal transition by controlling Ezh2 expression and epigenetic reprogramming. Cancer Cell 2013, 23, 768–783. [Google Scholar] [CrossRef] [PubMed] [Green Version]
- Hazan, R.B.; Qiao, R.; Keren, R.; Badano, I.; Suyama, K. Cadherin switch in tumor progression. Ann. N. Y. Acad. Sci. 2004, 1014, 155–163. [Google Scholar] [CrossRef] [PubMed]
- Thiery, J.P.; Acloque, H.; Huang, R.Y.; Nieto, M.A. Epithelial-mesenchymal transitions in development and disease. Cell 2009, 139, 871–890. [Google Scholar] [CrossRef]
- Wheelock, M.J.; Jensen, P.J. Regulation of keratinocyte intercellular junction organization and epidermal morphogenesis by E-cadherin. J. Cell Biol. 1992, 117, 415–425. [Google Scholar] [CrossRef] [Green Version]
- Matsuzaki, S.; Darcha, C. Epithelial to mesenchymal transition-like and mesenchymal to epithelial transition-like processes might be involved in the pathogenesis of pelvic endometriosis. Hum. Reprod. 2012, 27, 712–721. [Google Scholar] [CrossRef]
- Van Patten, K.; Parkash, V.; Jain, D. Cadherin expression in gastrointestinal tract endometriosis: Possible role in deep tissue invasion and development of malignancy. Mod. Pathol. 2010, 23, 38–44. [Google Scholar] [CrossRef] [PubMed] [Green Version]
- Kuessel, L.; Wenzl, R.; Proestling, K.; Balendran, S.; Pateisky, P.; Yotova, S.; Yerlikaya, G.; Streubel, B.; Husslein, H. Soluble VCAM-1/soluble ICAM-1 ratio is a promising biomarker for diagnosing endometriosis. Hum. Reprod. 2017, 32, 770–779. [Google Scholar] [CrossRef] [Green Version]
- Zhang, J.; Li, H.; Yi, D.; Lai, C.; Wang, H.; Zou, W.; Cao, B. Knockdown of vascular cell adhesion molecule 1 impedes transforming growth factor beta 1-mediated proliferation, migration, and invasion of endometriotic cyst stromal cells. Reprod. Biol. Endocrinol. 2019, 17, 69. [Google Scholar] [CrossRef] [Green Version]
- Wu, T.C. The role of vascular cell adhesion molecule-1 in tumor immune evasion. Cancer Res. 2007, 67, 6003–6006. [Google Scholar] [CrossRef] [PubMed] [Green Version]
- Schlesinger, M.; Bendas, G. Vascular cell adhesion molecule-1 (VCAM-1)--an increasing insight into its role in tumorigenicity and metastasis. Int. J. Cancer 2015, 136, 2504–2514. [Google Scholar] [CrossRef]
- Yotova, I.; Quan, P.; Gaba, A.; Leditznig, N.; Pateisky, P.; Kurz, C.; Tschugguel, W. Raf-1 levels determine the migration rate of primary endometrial stromal cells of patients with endometriosis. J. Cell. Mol. Med. 2012, 16, 2127–2139. [Google Scholar] [CrossRef]
- Morris, K.; Ihnatovych, I.; Ionetz, E.; Reed, J.; Braundmeier, A.; Strakova, Z. Cofilin and slingshot localization in the epithelium of uterine endometrium changes during the menstrual cycle and in endometriosis. Reprod. Sci. 2011, 18, 1014–1024. [Google Scholar] [CrossRef]
- Yuge, A.; Nasu, K.; Matsumoto, H.; Nishida, M.; Narahara, H. Collagen gel contractility is enhanced in human endometriotic stromal cells: A possible mechanism underlying the pathogenesis of endometriosis-associated fibrosis. Hum. Reprod. 2007, 22, 938–944. [Google Scholar] [CrossRef]
- Toshima, J.; Ohashi, K.; Okano, I.; Nunoue, K.; Kishioka, M.; Kuma, K.; Miyata, T.; Hirai, M.; Baba, T.; Mizuno, K. Identification and characterization of a novel protein kinase, TESK1, specifically expressed in testicular germ cells. J. Biol. Chem. 1995, 270, 31331–31337. [Google Scholar] [CrossRef] [Green Version]
- Bamburg, J.R.; McGough, A.; Ono, S. Putting a new twist on actin: ADF/cofilins modulate actin dynamics. Trends Cell Biol. 1999, 9, 364–370. [Google Scholar] [CrossRef]
- Sander, E.E.; ten Klooster, J.P.; van Delft, S.; van der Kammen, R.A.; Collard, J.G. Rac downregulates Rho activity: Reciprocal balance between both GTPases determines cellular morphology and migratory behavior. J. Cell. Biol. 1999, 147, 1009–1022. [Google Scholar] [CrossRef]
- Fassbender, A.; Rahmioglu, N.; Vitonis, A.F.; Vigano, P.; Giudice, L.C.; D’Hooghe, T.M.; Hummelshoj, L.; Adamson, G.D.; Becker, C.M.; Missmer, S.A.; et al. World Endometriosis Research Foundation Endometriosis Phenome and Biobanking Harmonisation Project: IV. Tissue collection, processing, and storage in endometriosis research. Fertil. Steril. 2014, 102, 1244–1253. [Google Scholar] [CrossRef]
- Zeitvogel, A.; Baumann, R.; Starzinski-Powitz, A. Identification of an invasive, N-cadherin-expressing epithelial cell type in endometriosis using a new cell culture model. Am. J. Pathol. 2001, 159, 1839–1852. [Google Scholar] [CrossRef] [Green Version]
- Banu, S.K.; Lee, J.; Starzinski-Powitz, A.; Arosh, J.A. Gene expression profiles and functional characterization of human immortalized endometriotic epithelial and stromal cells. Fertil. Steril. 2008, 90, 972–987. [Google Scholar] [CrossRef]
- Dobin, A.; Davis, C.A.; Schlesinger, F.; Drenkow, J.; Zaleski, C.; Jha, S.; Batut, P.; Chaisson, M.; Gingeras, T.R. STAR: Ultrafast universal RNA-seq aligner. Bioinformatics 2013, 29, 15–21. [Google Scholar] [CrossRef]
- R Core Team. R: A Language and Environment for Statistical Computing; R Foundation for Statistical Computing: Vienna, Austria, 2020. [Google Scholar]
- Love, M.I.; Huber, W.; Anders, S. Moderated estimation of fold change and dispersion for RNA-seq data with DESeq2. Genome Biol. 2014, 15, 550. [Google Scholar] [CrossRef] [PubMed] [Green Version]
- Li, H.; Handsaker, B.; Wysoker, A.; Fennell, T.; Ruan, J.; Homer, N.; Marth, G.; Abecasis, G.; Durbin, R. The Sequence Alignment/Map format and SAMtools. Bioinformatics 2009, 25, 2078–2079. [Google Scholar] [CrossRef] [Green Version]
- Trapnell, C.; Roberts, A.; Goff, L.; Pertea, G.; Kim, D.; Kelley, D.R.; Pimentel, H.; Salzberg, S.L.; Rinn, J.L.; Pachter, L. Differential gene and transcript expression analysis of RNA-seq experiments with TopHat and Cufflinks. Nat. Protoc. 2012, 7, 562–578. [Google Scholar] [CrossRef] [PubMed] [Green Version]
- Livak, K.J.; Schmittgen, T.D. Analysis of relative gene expression data using real-time quantitative PCR and the 2(-Delta Delta C(T)) Method. Methods 2001, 25, 402–408. [Google Scholar] [CrossRef]
- Rubiolo, C.; Piazzolla, D.; Meissl, K.; Beug, H.; Huber, J.C.; Kolbus, A.; Baccarini, M. A balance between Raf-1 and Fas expression sets the pace of erythroid differentiation. Blood 2006, 108, 152–159. [Google Scholar] [CrossRef] [PubMed] [Green Version]
- Yotova, I.; Hsu, E.; Do, C.; Gaba, A.; Sczabolcs, M.; Dekan, S.; Kenner, L.; Wenzl, R.; Tycko, B. Epigenetic alterations affecting transcription factors and signaling pathways in stromal cells of endometriosis. PLoS ONE 2017, 12, e0170859. [Google Scholar] [CrossRef]
- Hammond, L. Measuring cell fluoresecence using ImageJ. In The Open Lab Book, Release 1.0; Fitzpatrick, M., Ed.; The University of Queensland: Brisbane, Australia, 2020; pp. 50–53. [Google Scholar]


Publisher’s Note: MDPI stays neutral with regard to jurisdictional claims in published maps and institutional affiliations. |
© 2021 by the authors. Licensee MDPI, Basel, Switzerland. This article is an open access article distributed under the terms and conditions of the Creative Commons Attribution (CC BY) license (https://creativecommons.org/licenses/by/4.0/).
Share and Cite
Yotova, I.; Hudson, Q.J.; Pauler, F.M.; Proestling, K.; Haslinger, I.; Kuessel, L.; Perricos, A.; Husslein, H.; Wenzl, R. LINC01133 Inhibits Invasion and Promotes Proliferation in an Endometriosis Epithelial Cell Line. Int. J. Mol. Sci. 2021, 22, 8385. https://0-doi-org.brum.beds.ac.uk/10.3390/ijms22168385
Yotova I, Hudson QJ, Pauler FM, Proestling K, Haslinger I, Kuessel L, Perricos A, Husslein H, Wenzl R. LINC01133 Inhibits Invasion and Promotes Proliferation in an Endometriosis Epithelial Cell Line. International Journal of Molecular Sciences. 2021; 22(16):8385. https://0-doi-org.brum.beds.ac.uk/10.3390/ijms22168385
Chicago/Turabian StyleYotova, Iveta, Quanah J. Hudson, Florian M. Pauler, Katharina Proestling, Isabella Haslinger, Lorenz Kuessel, Alexandra Perricos, Heinrich Husslein, and René Wenzl. 2021. "LINC01133 Inhibits Invasion and Promotes Proliferation in an Endometriosis Epithelial Cell Line" International Journal of Molecular Sciences 22, no. 16: 8385. https://0-doi-org.brum.beds.ac.uk/10.3390/ijms22168385