
Insights into the Mechanisms of Heat Priming and Thermotolerance in Tobacco Pollen

 , , and
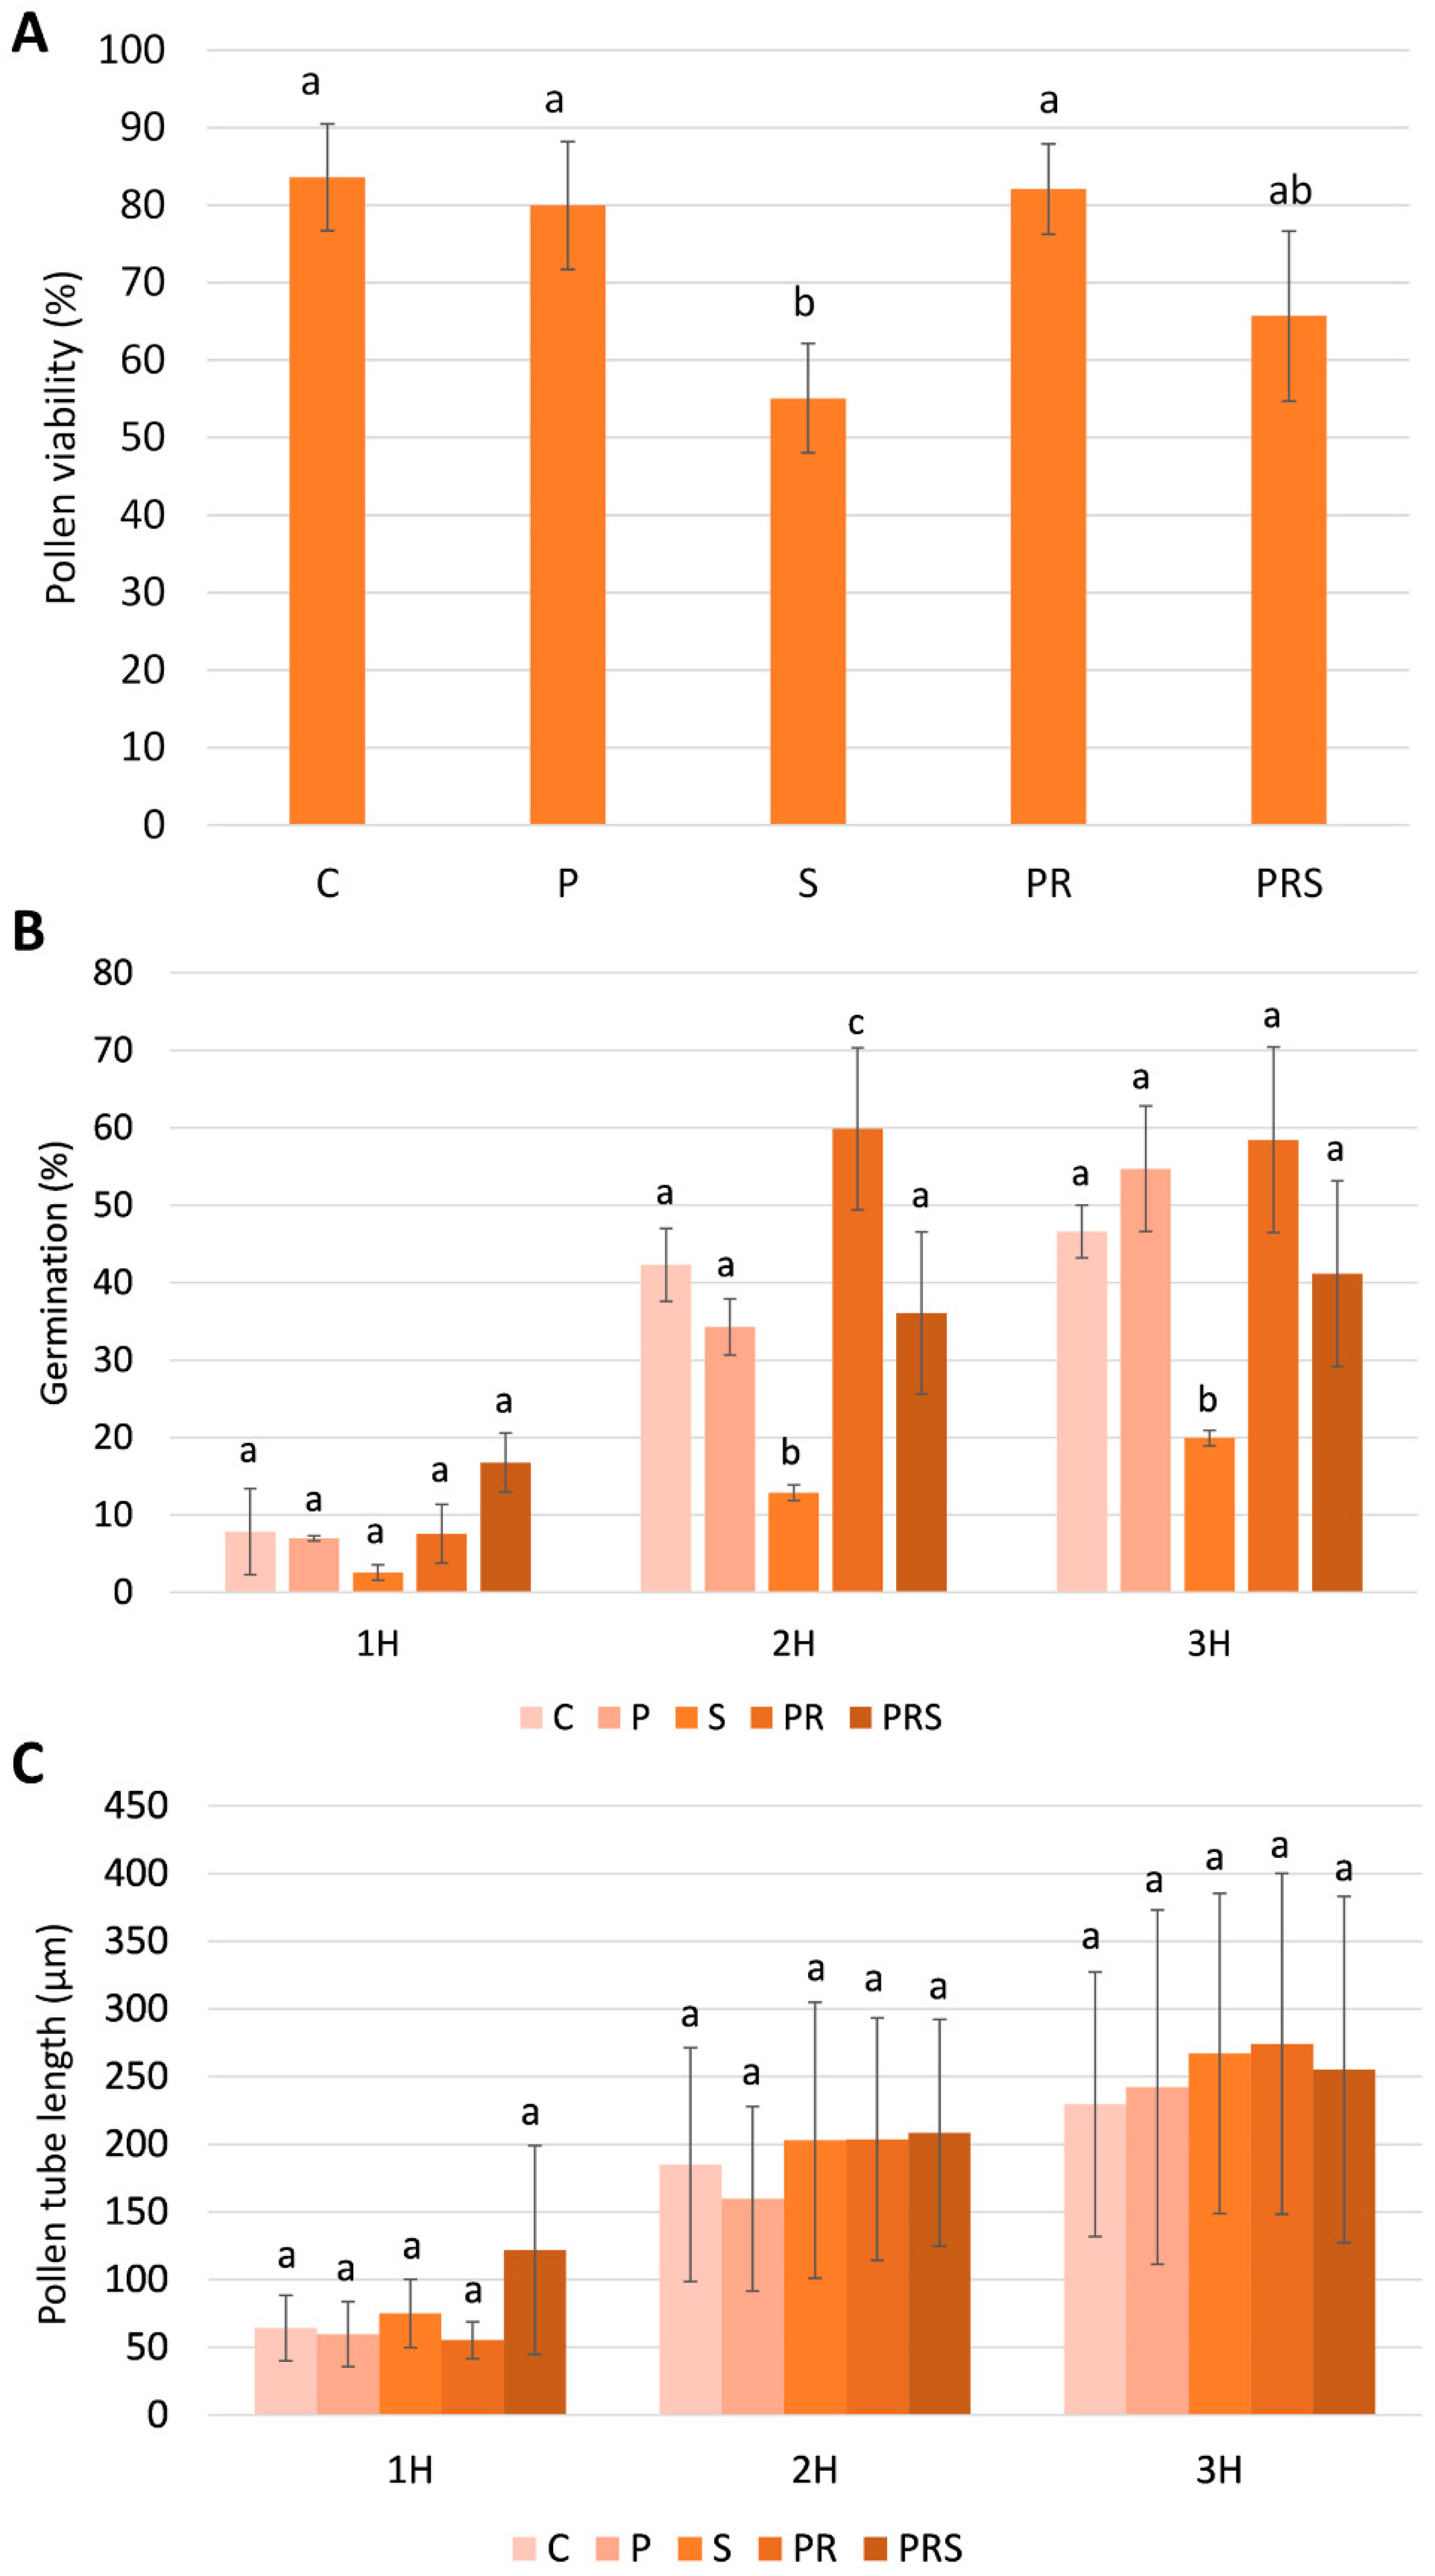
Abstract
:1. Introduction
2. Results
2.1. Pollen Viability, Germination, and Pollen Tube Elongation
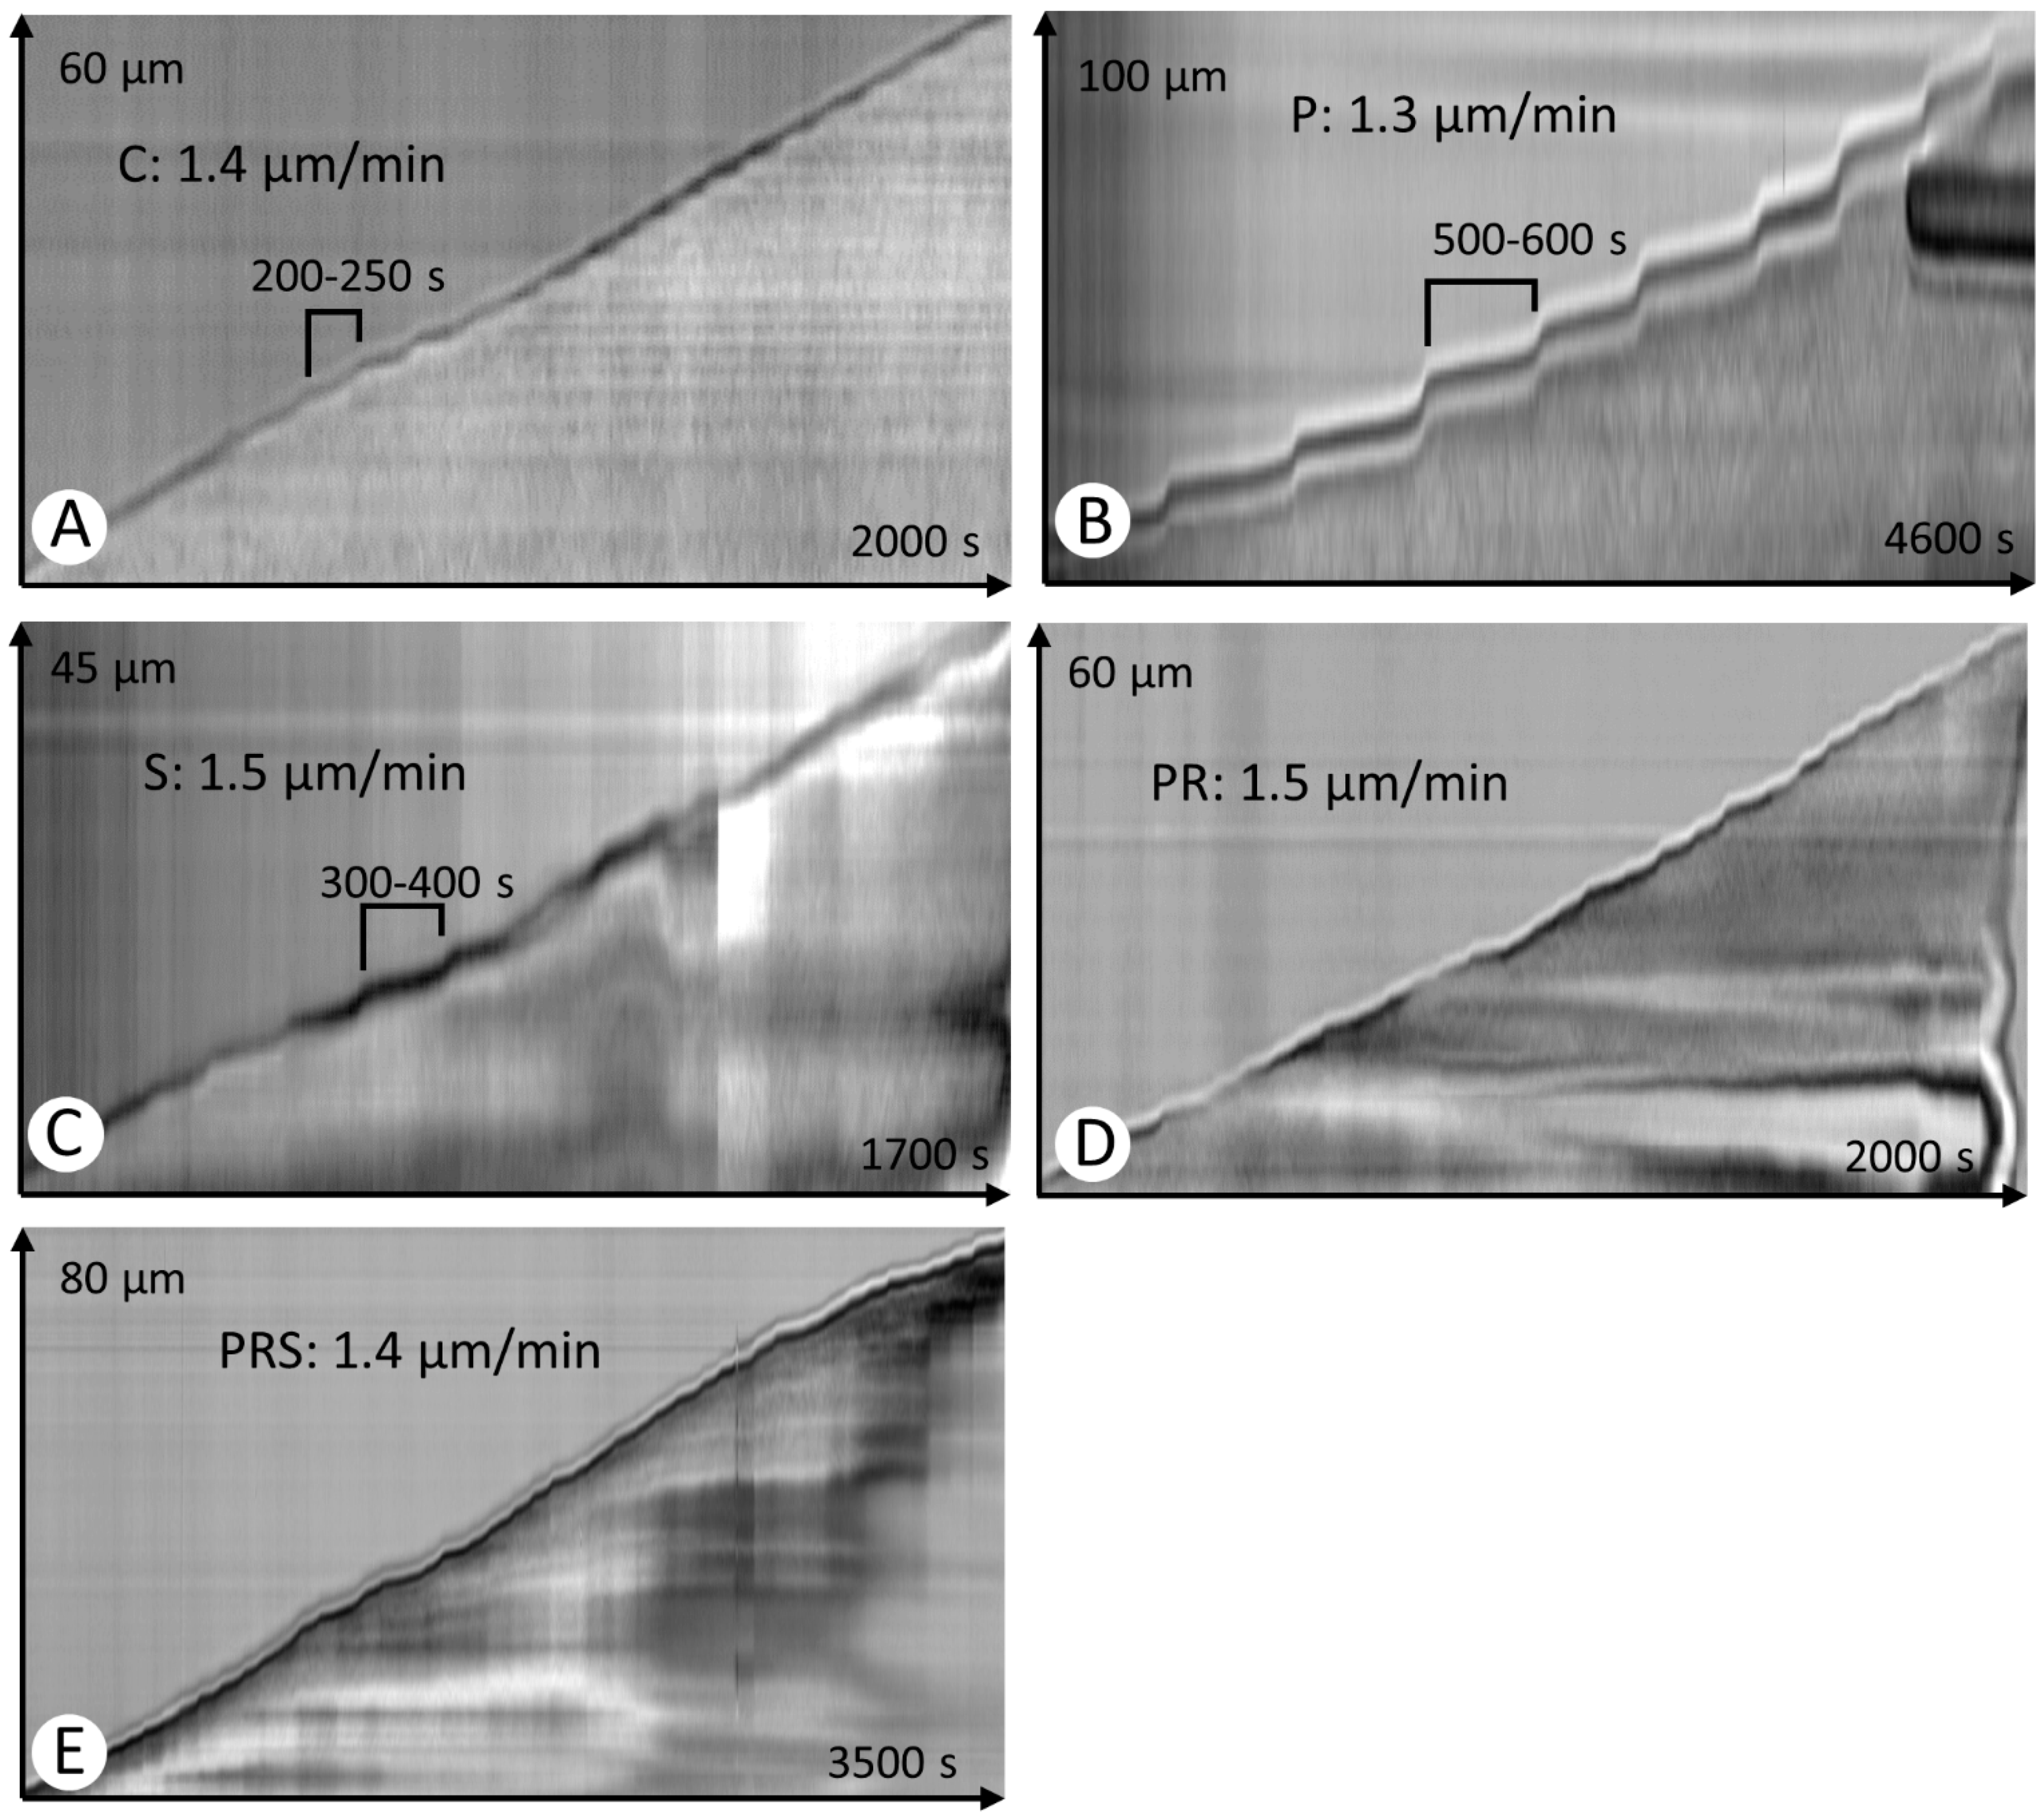
2.2. Kymograph Analysis of Pollen Tubes Revealed Differences among Experimental Groups
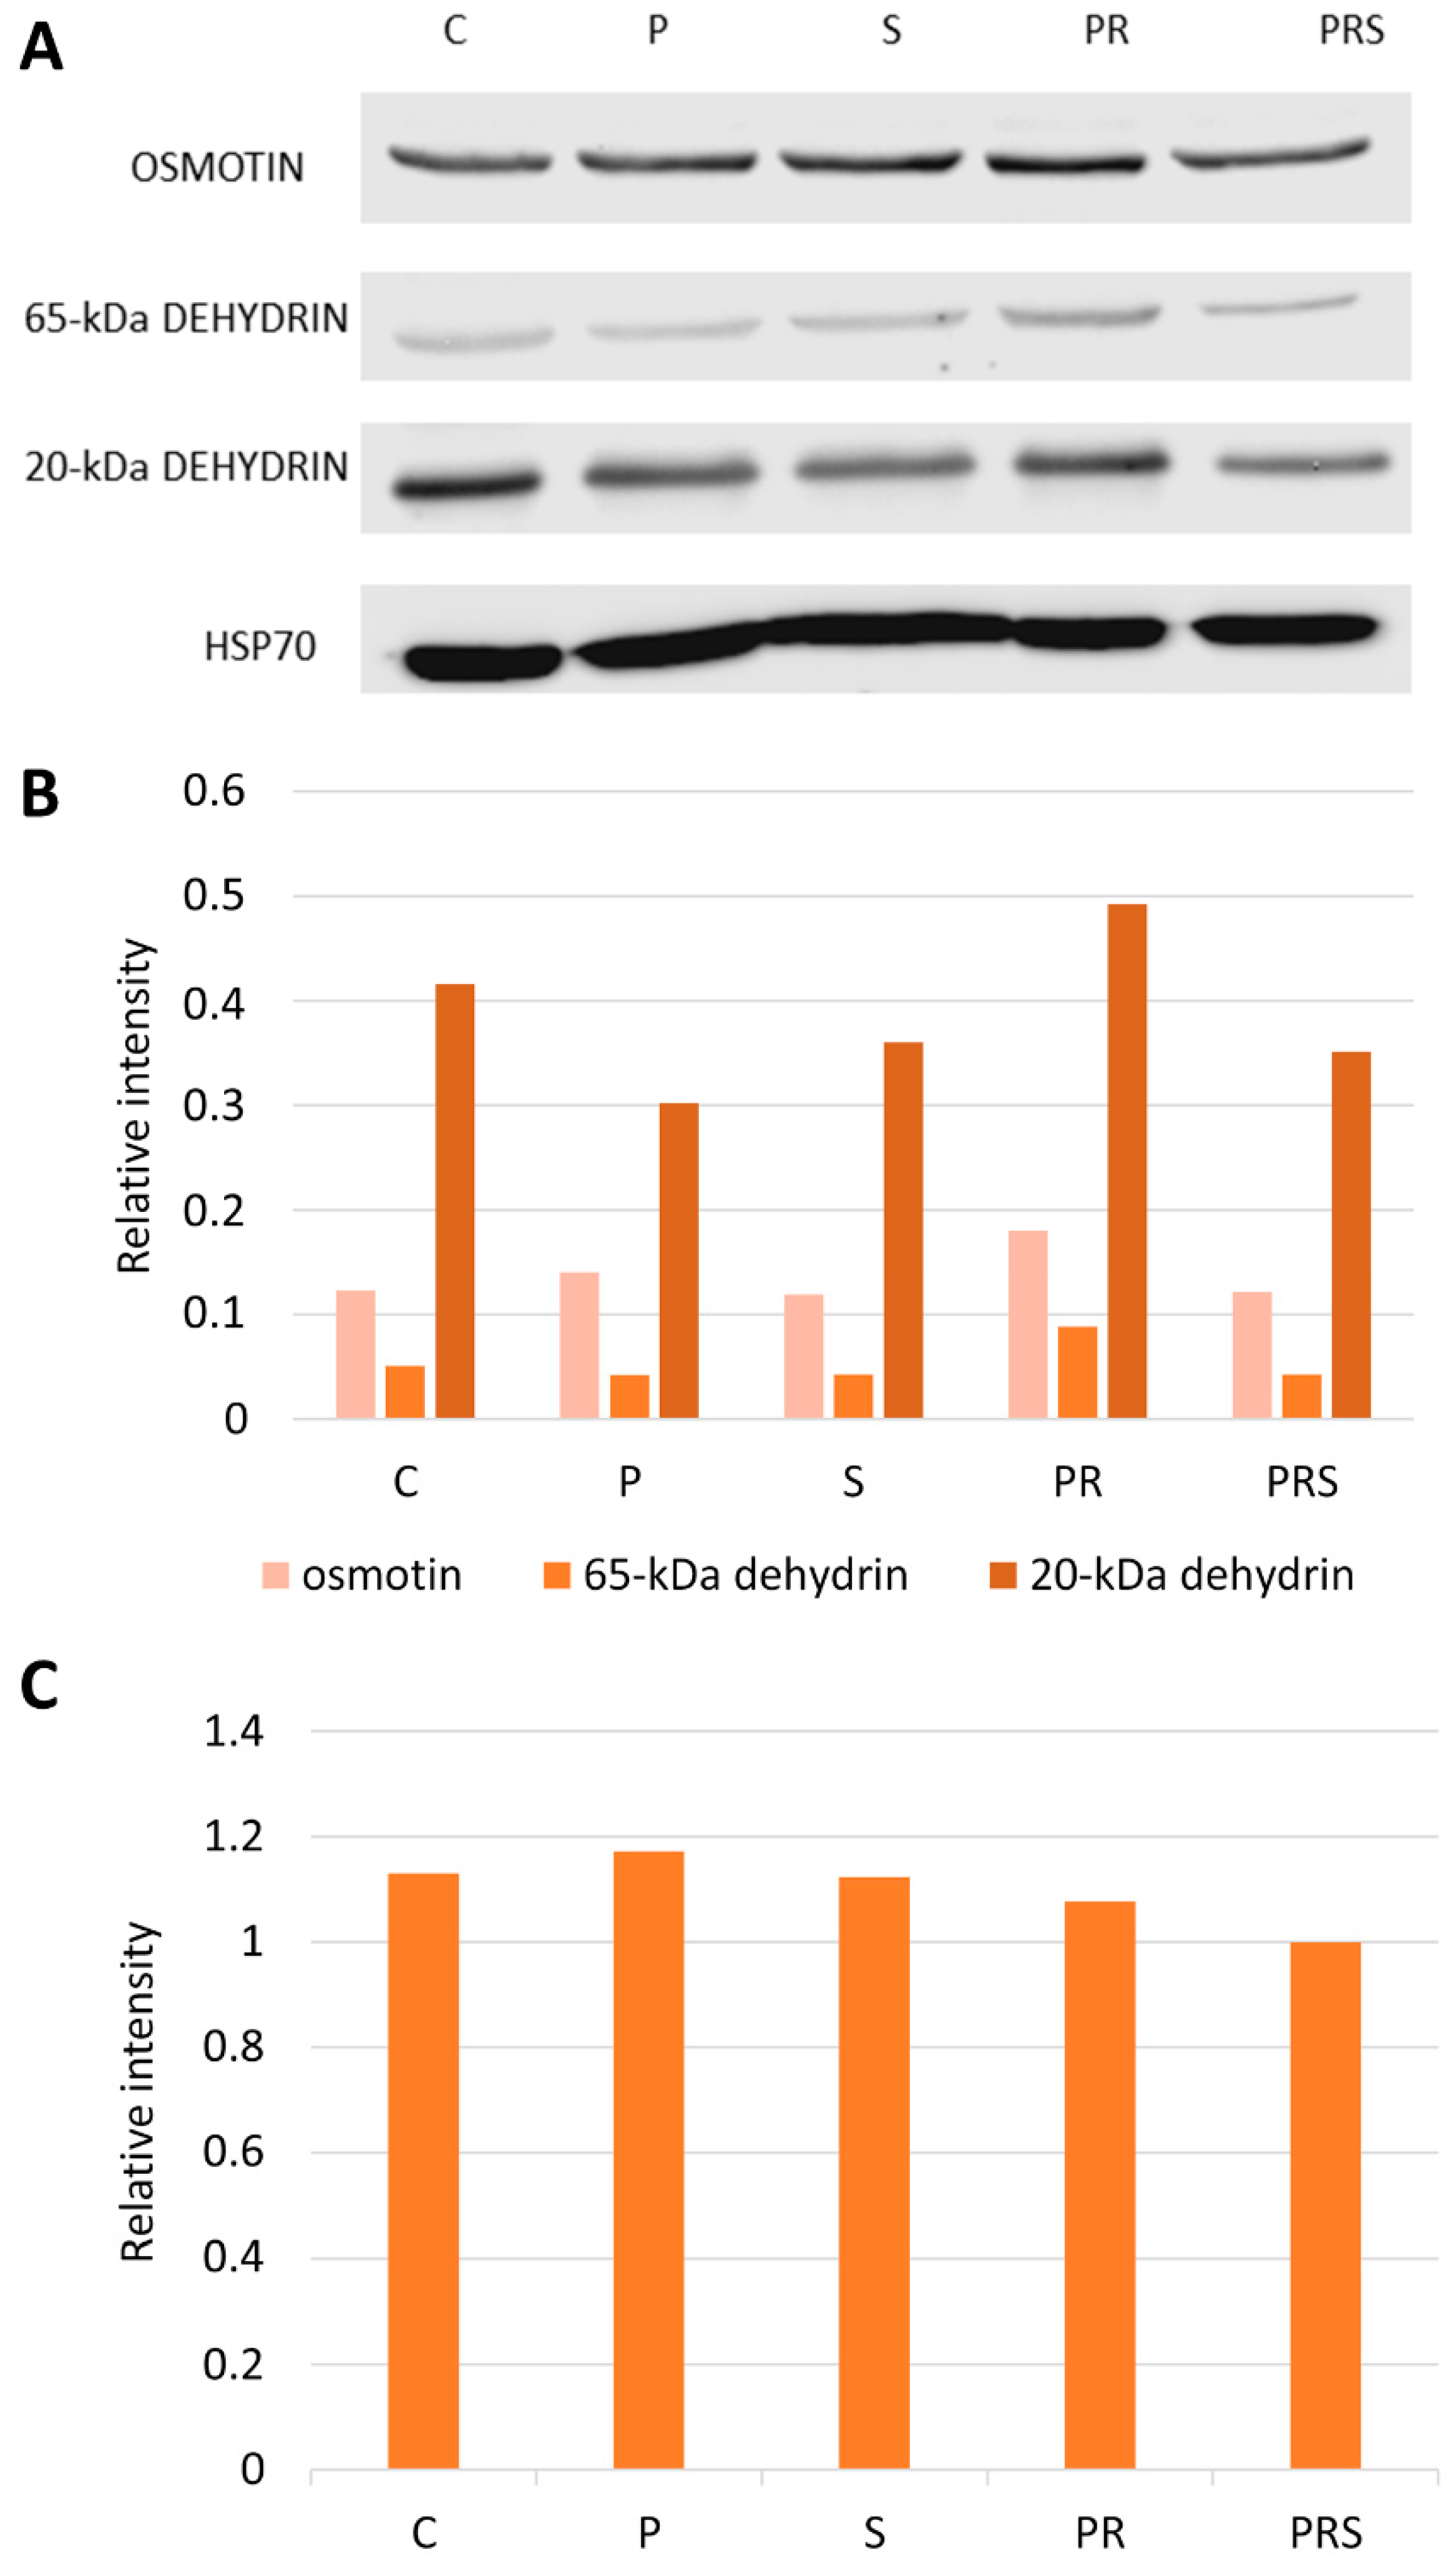
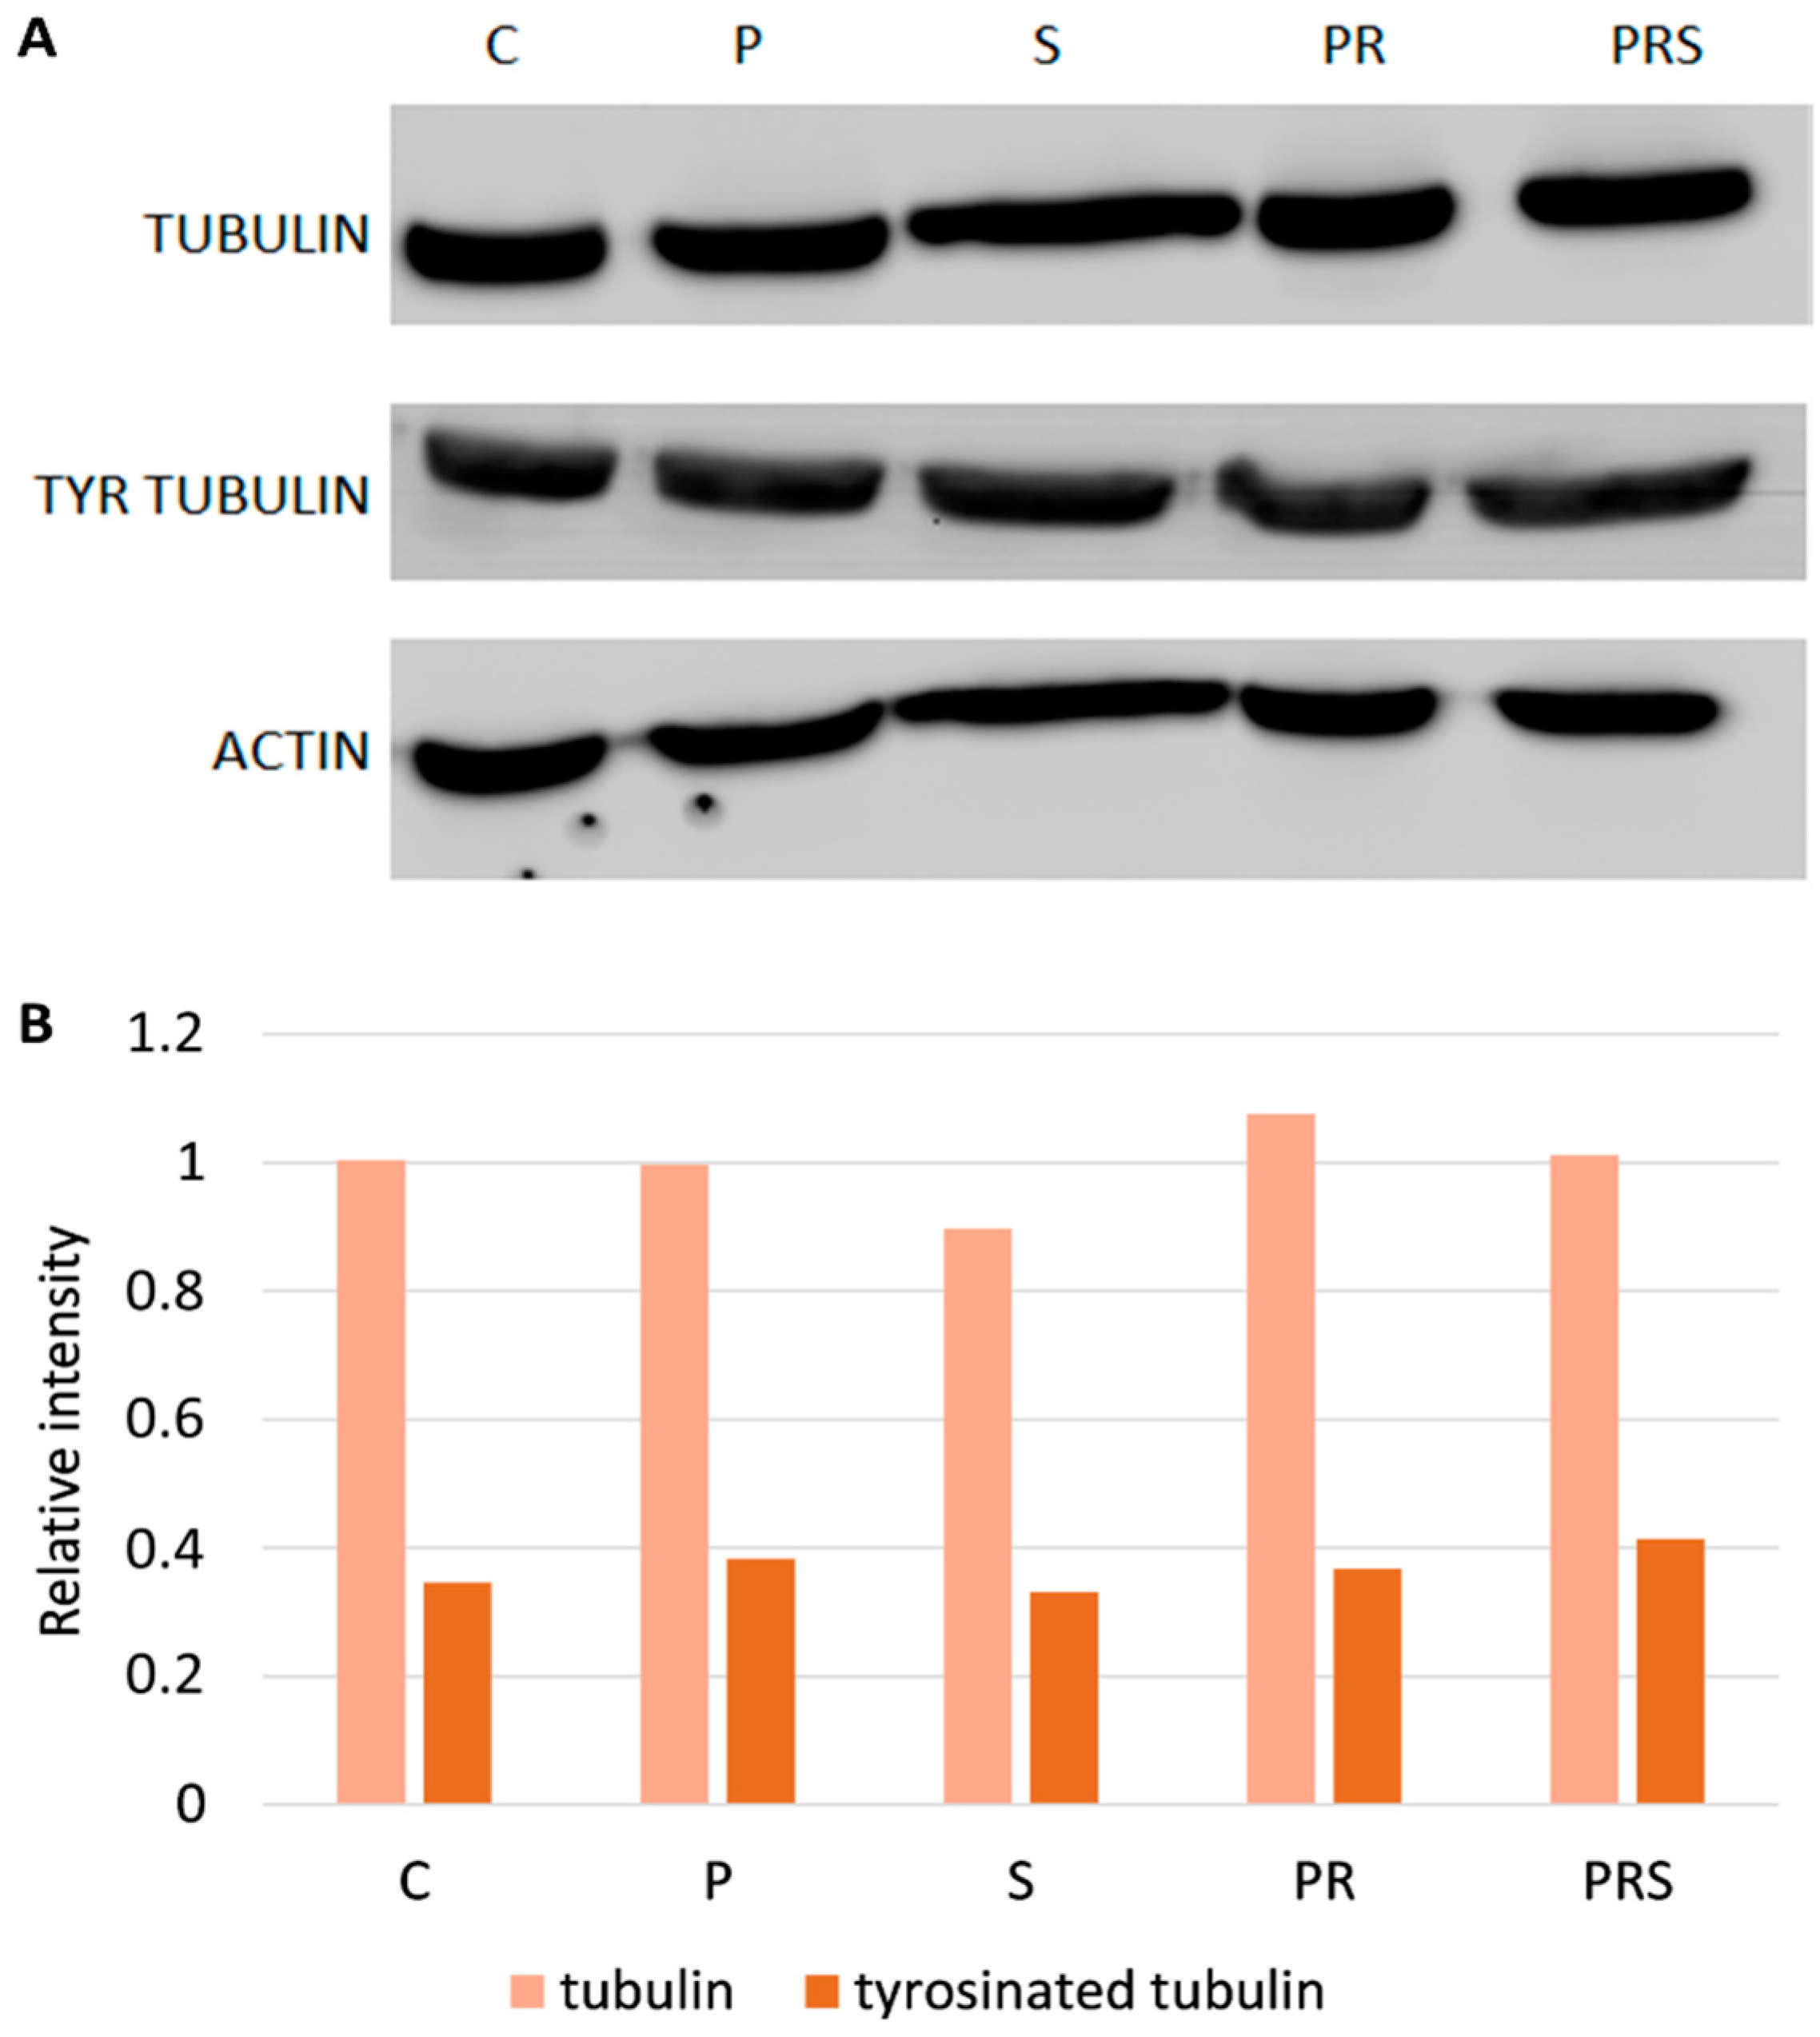
2.3. Stress-Related Proteins Do Not Vary among Pollen Samples
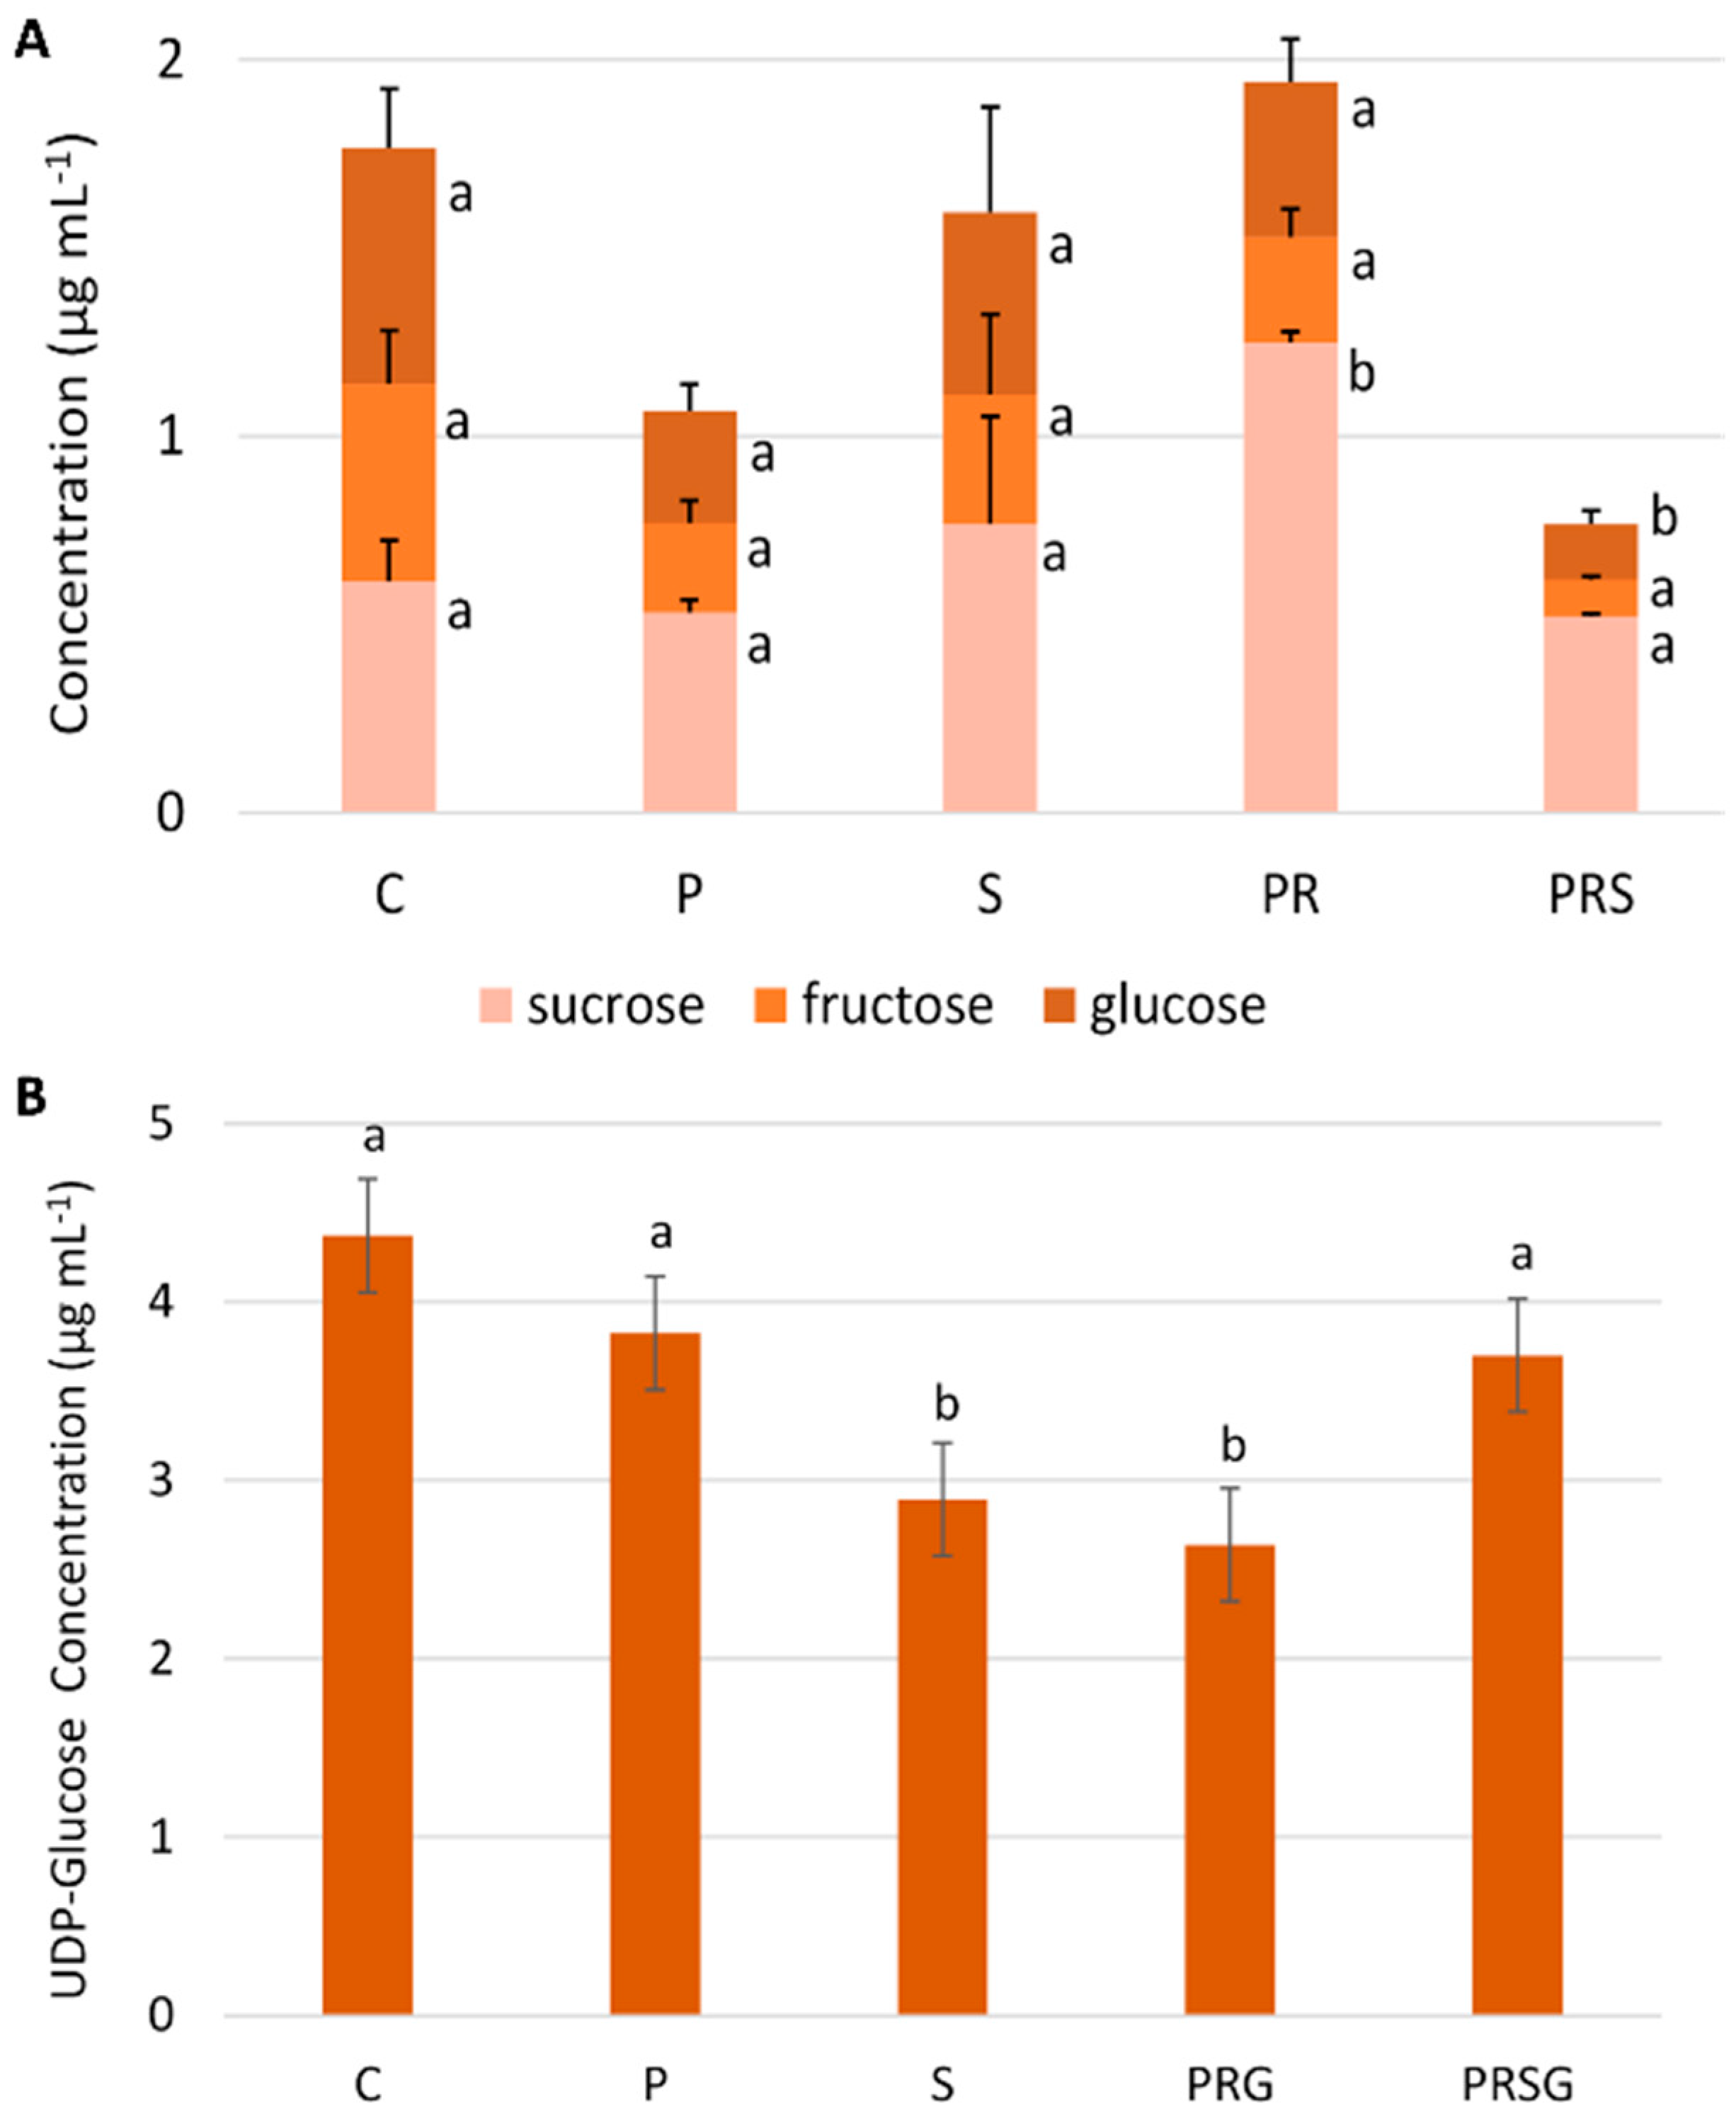
2.4. The Content of Main Sugars Changes at Specific Treatments
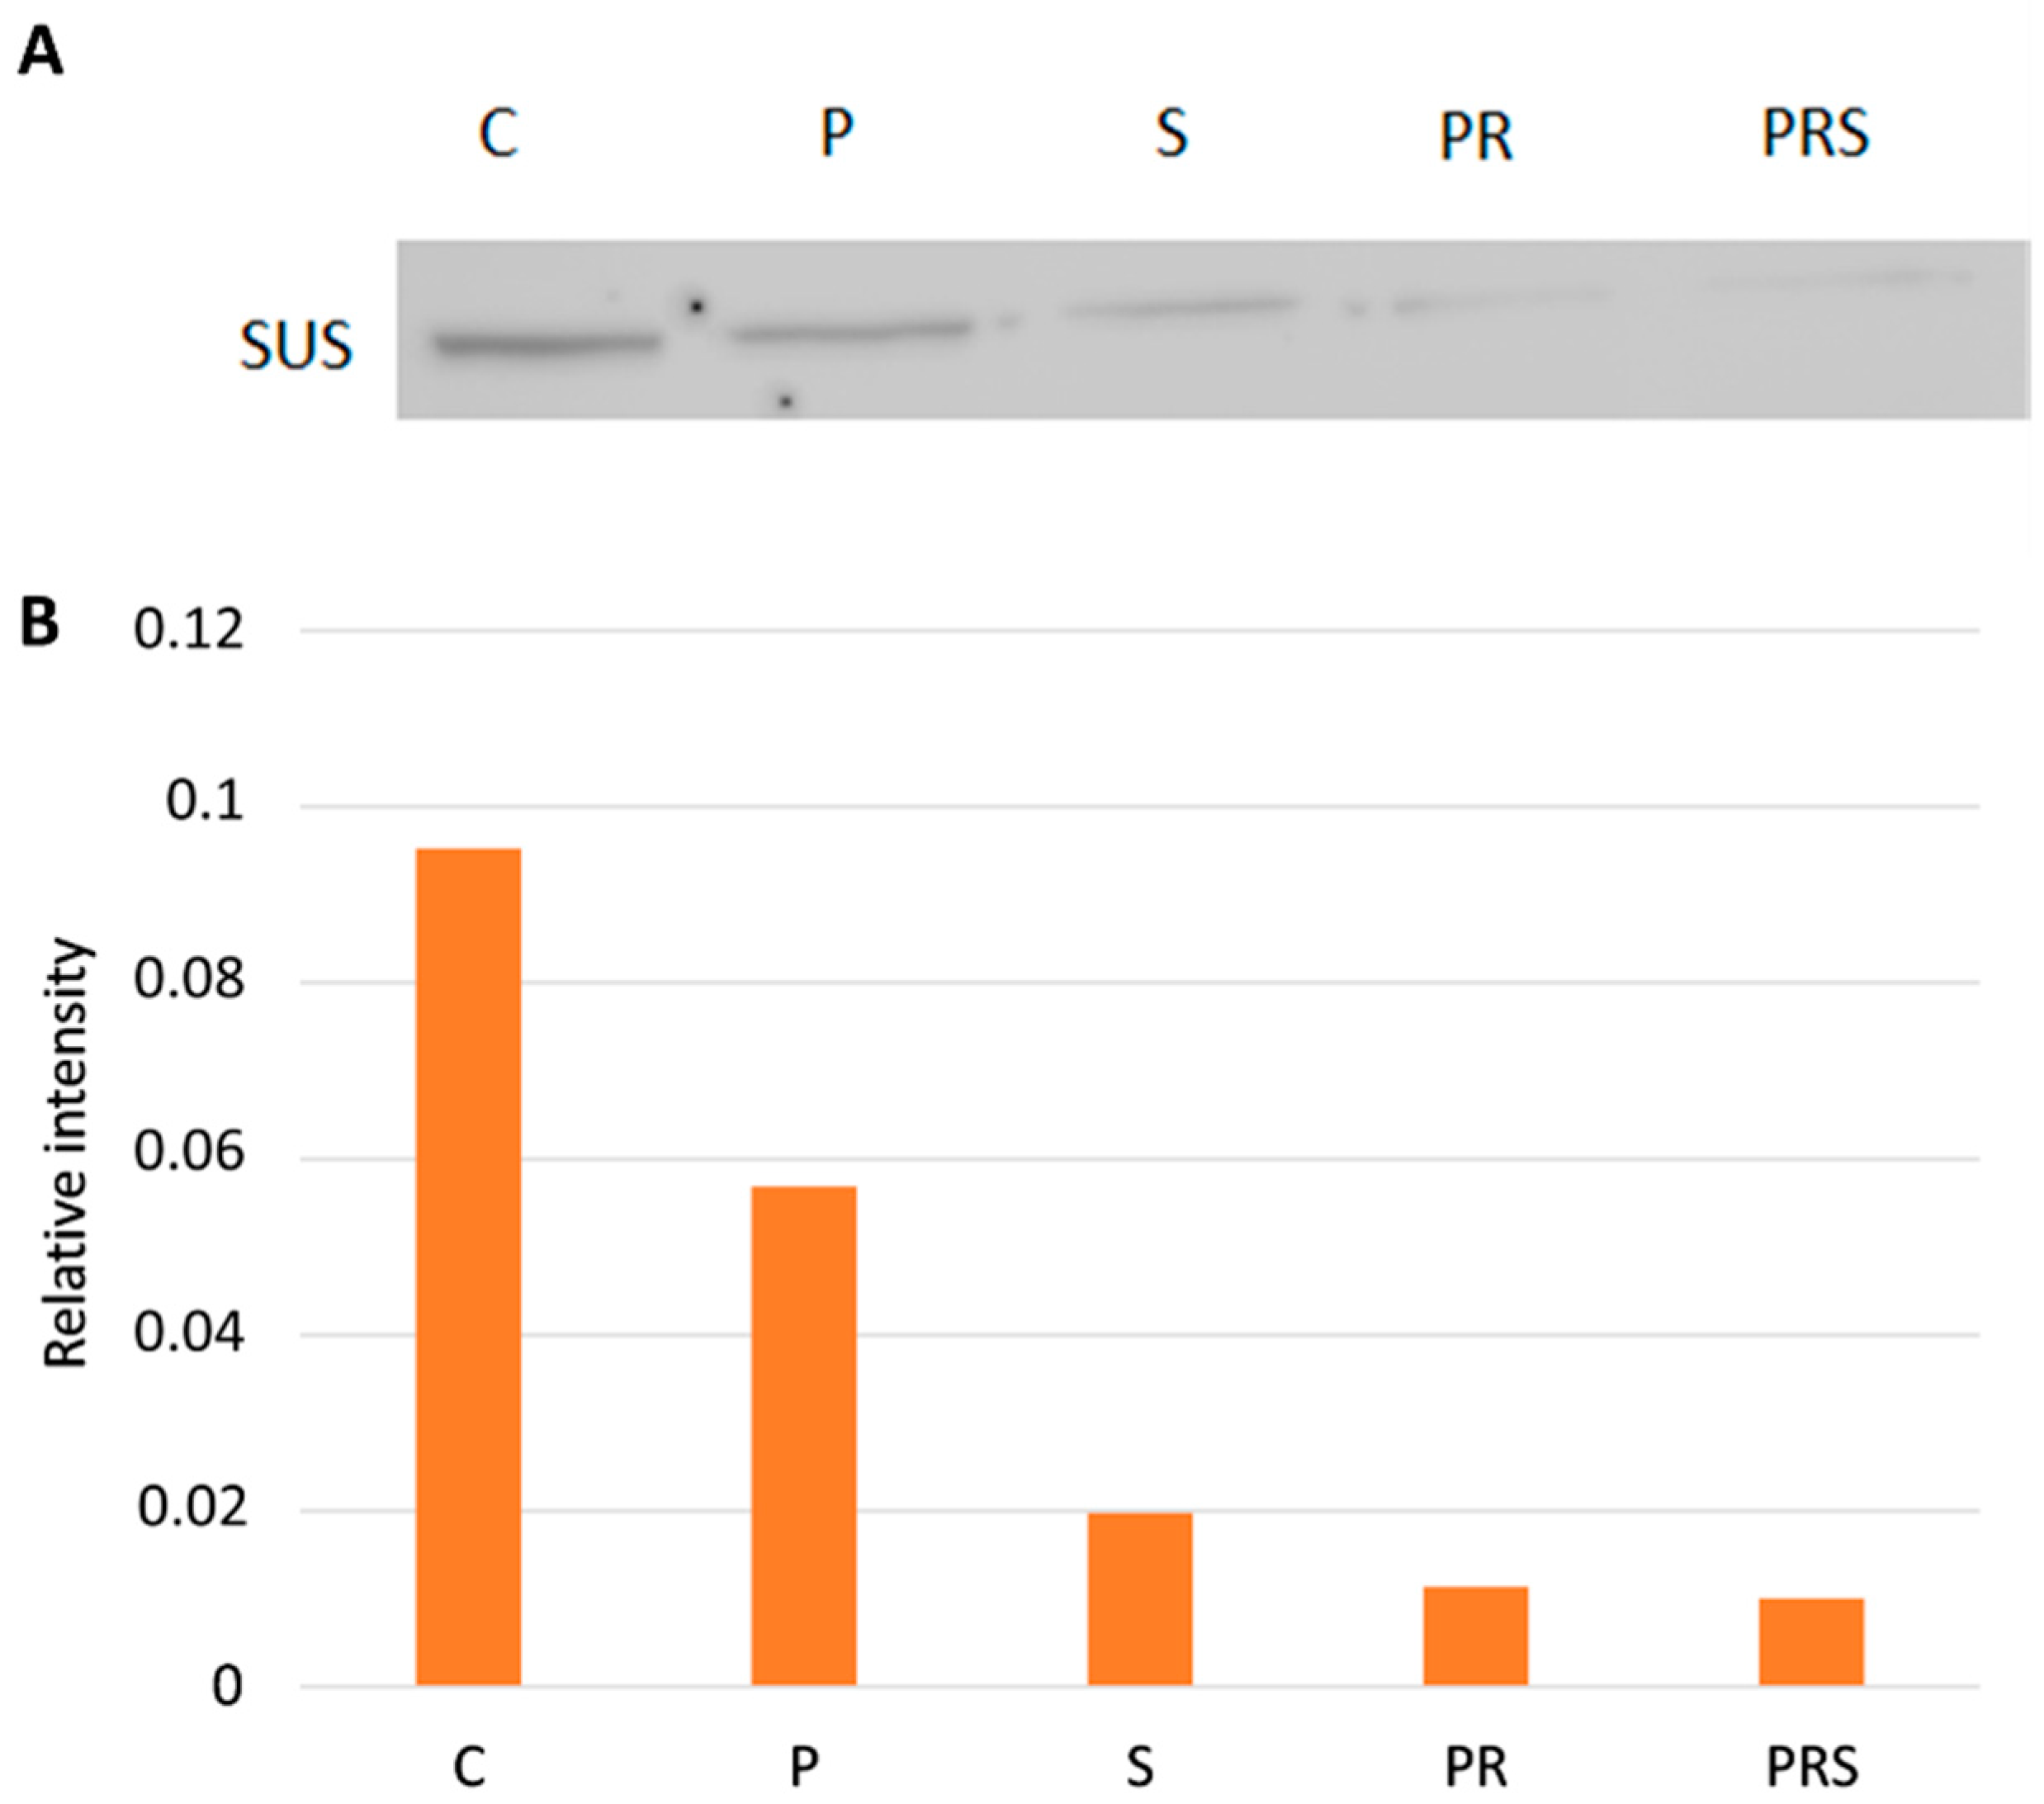
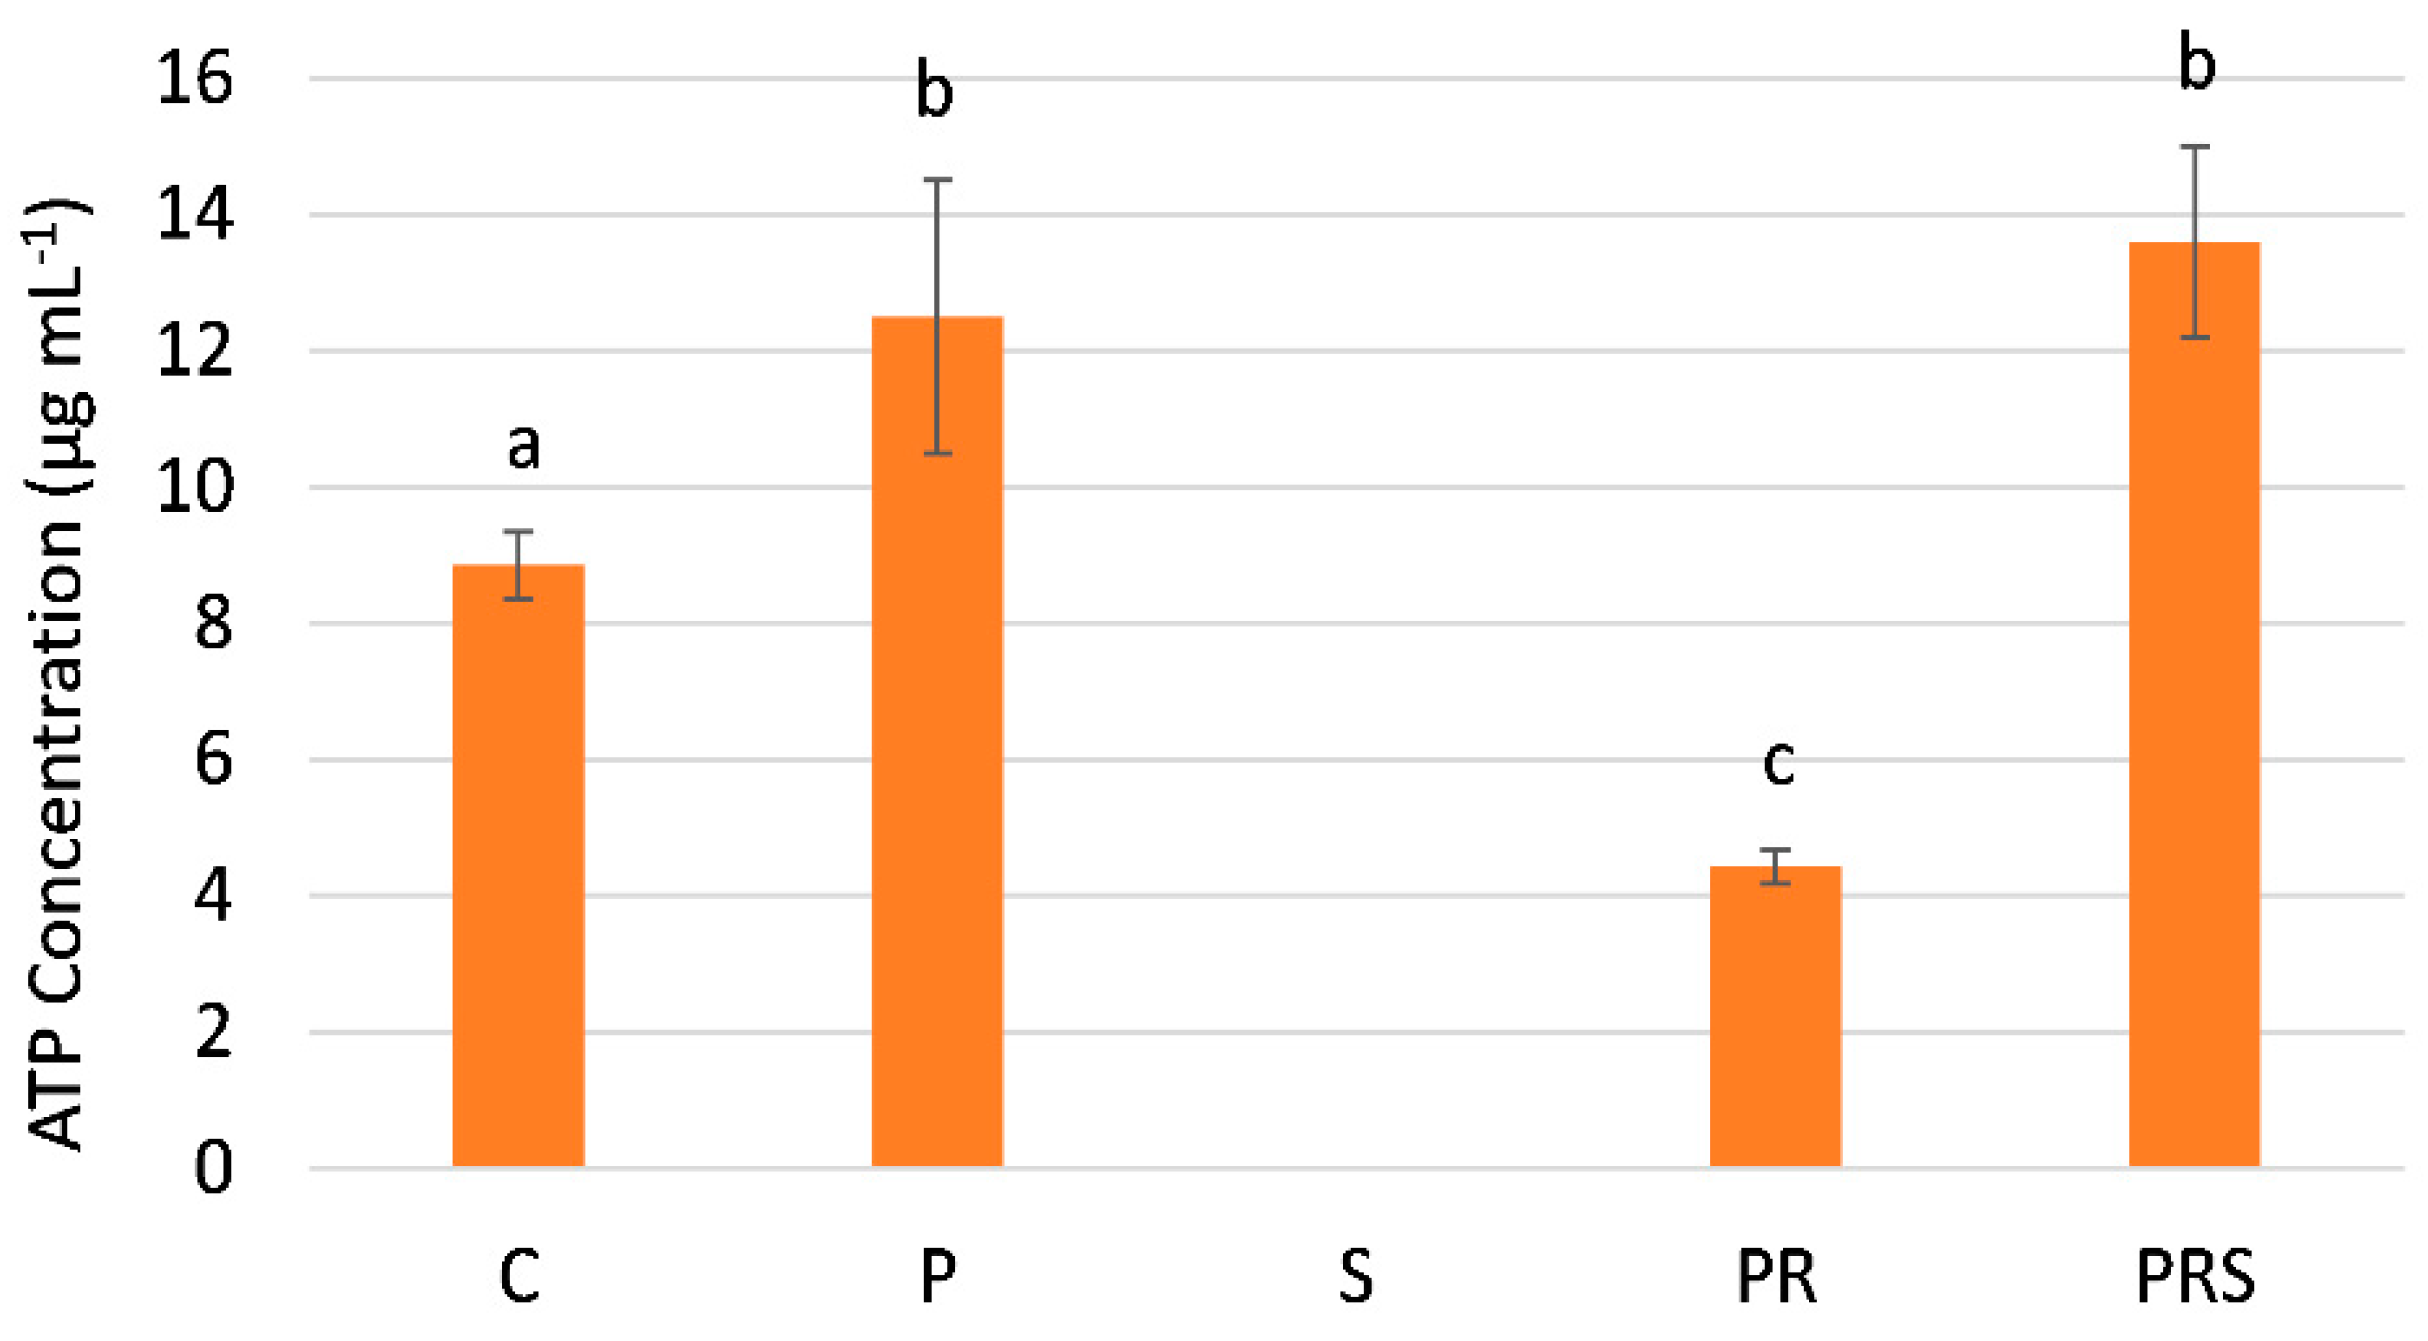
2.5. The Content of Sus Declines Following Priming and Stress while ATP Content Increases
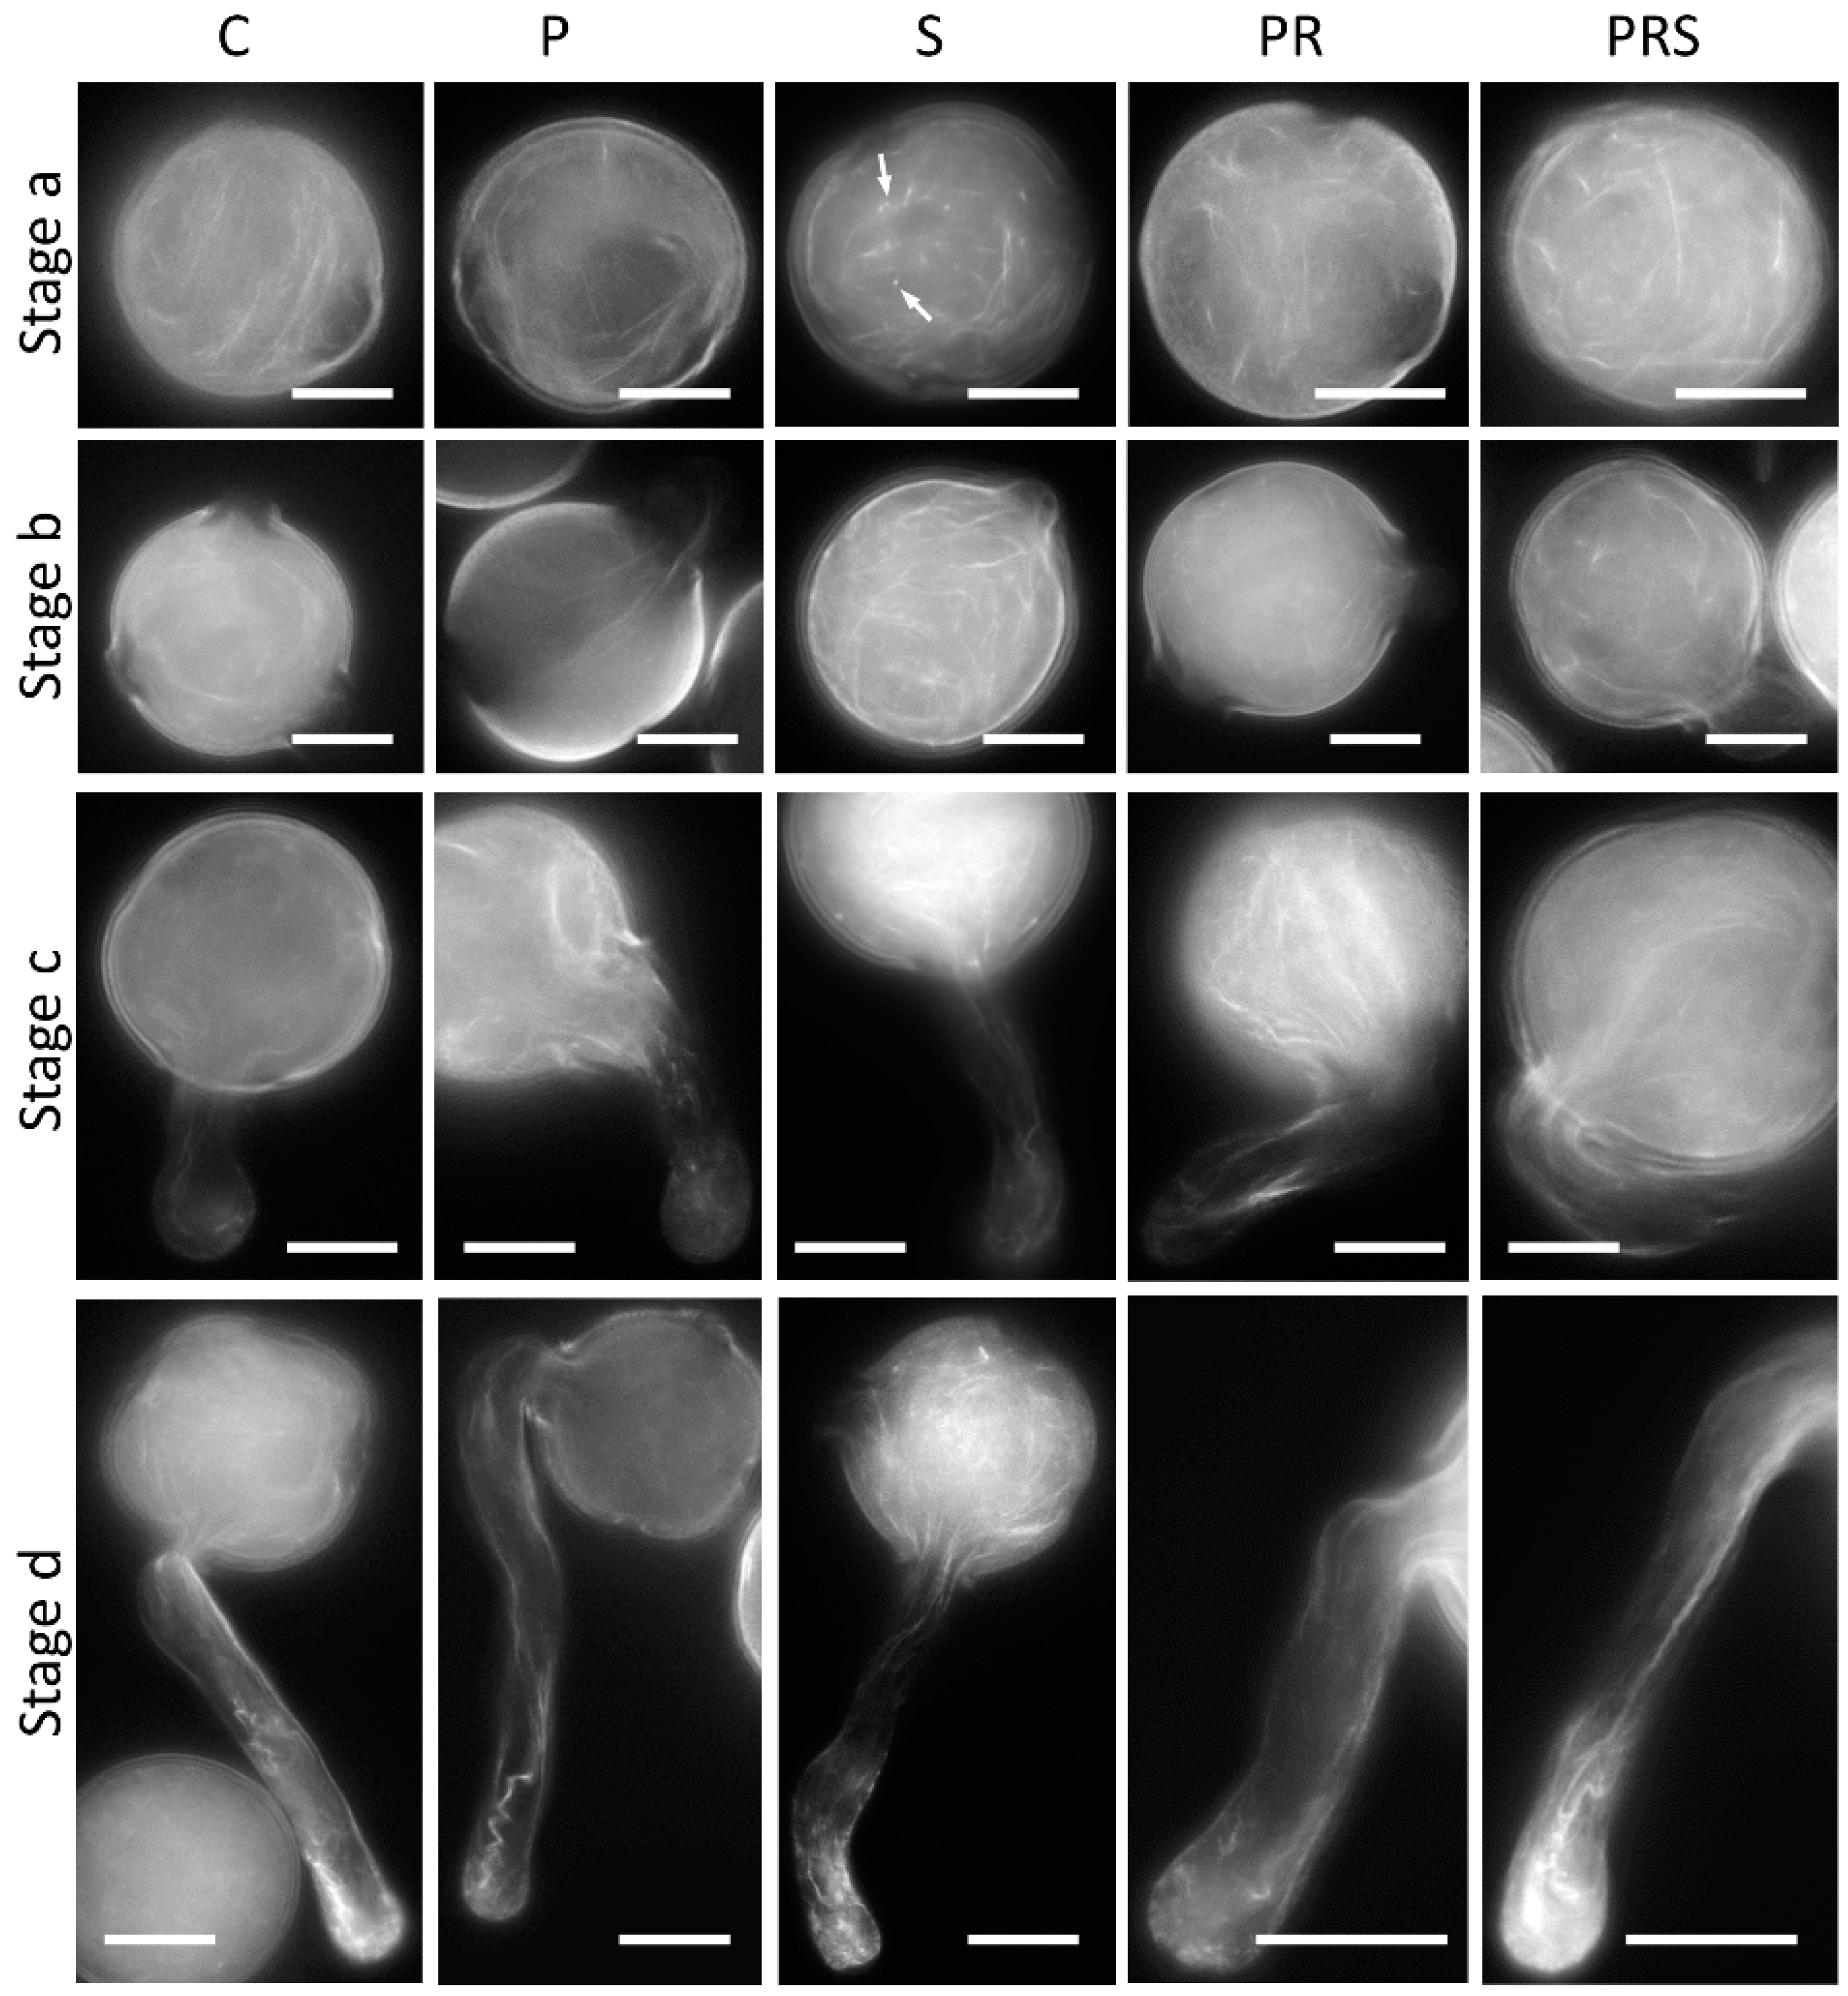
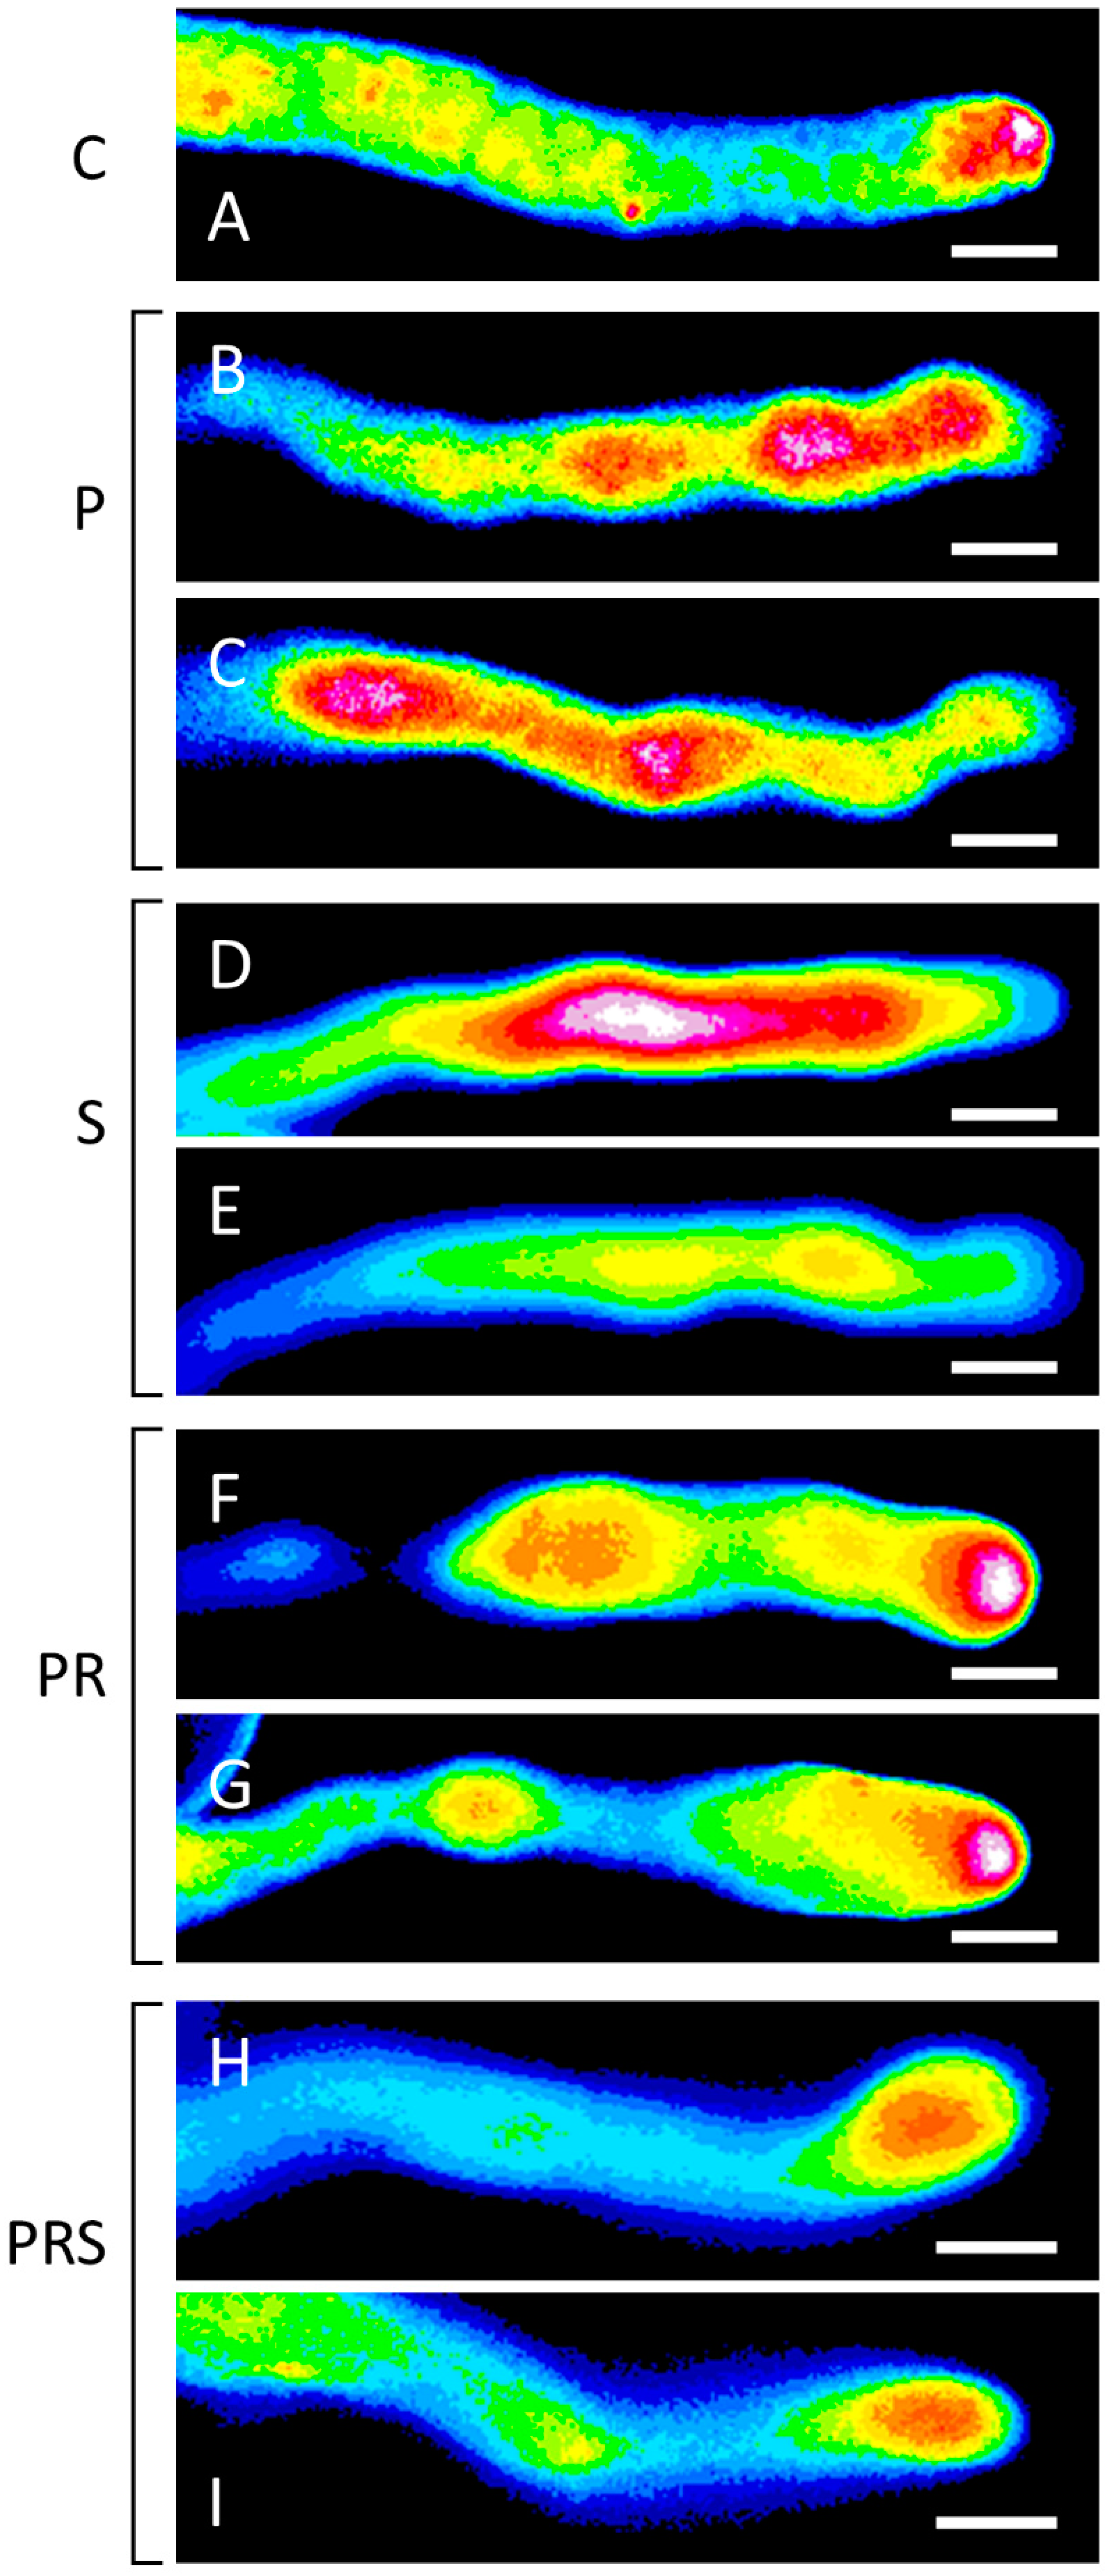
2.6. The Distribution of Actin Filaments Is Not Particularly Affected by Priming and Heat Stress
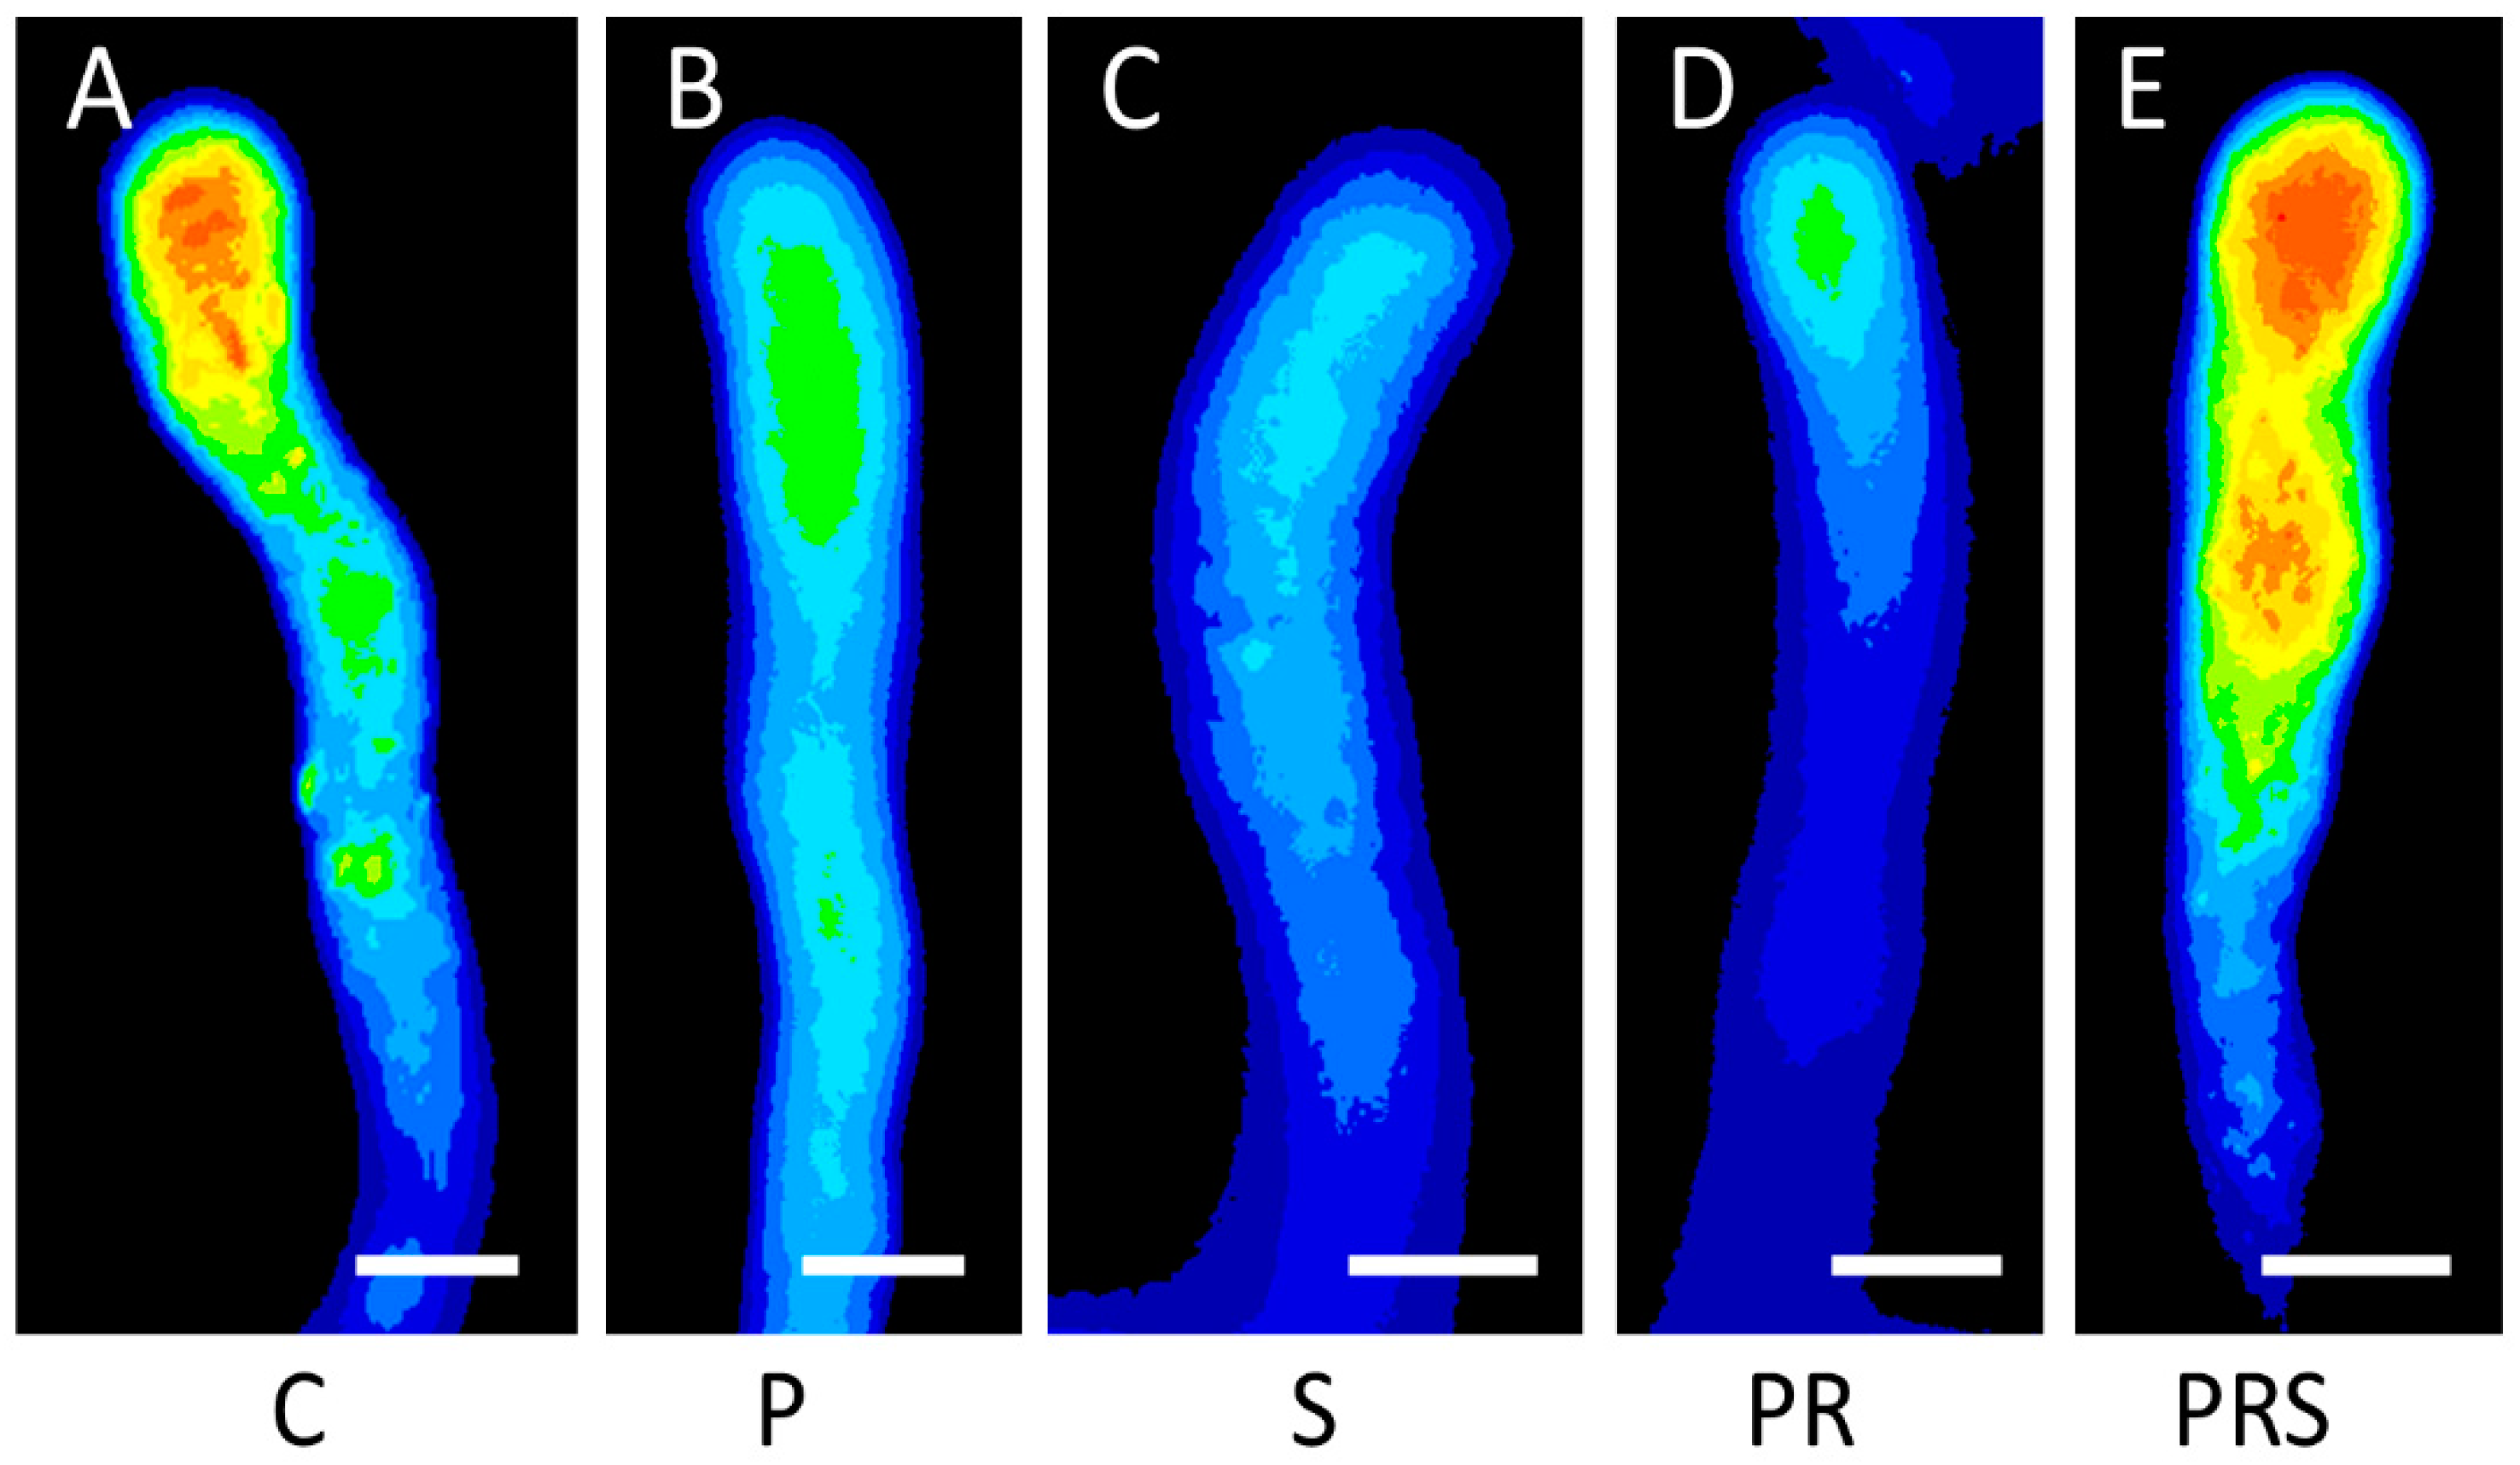
2.7. Proper Distribution of ROS in Pollen Tubes Is Restored Following Priming
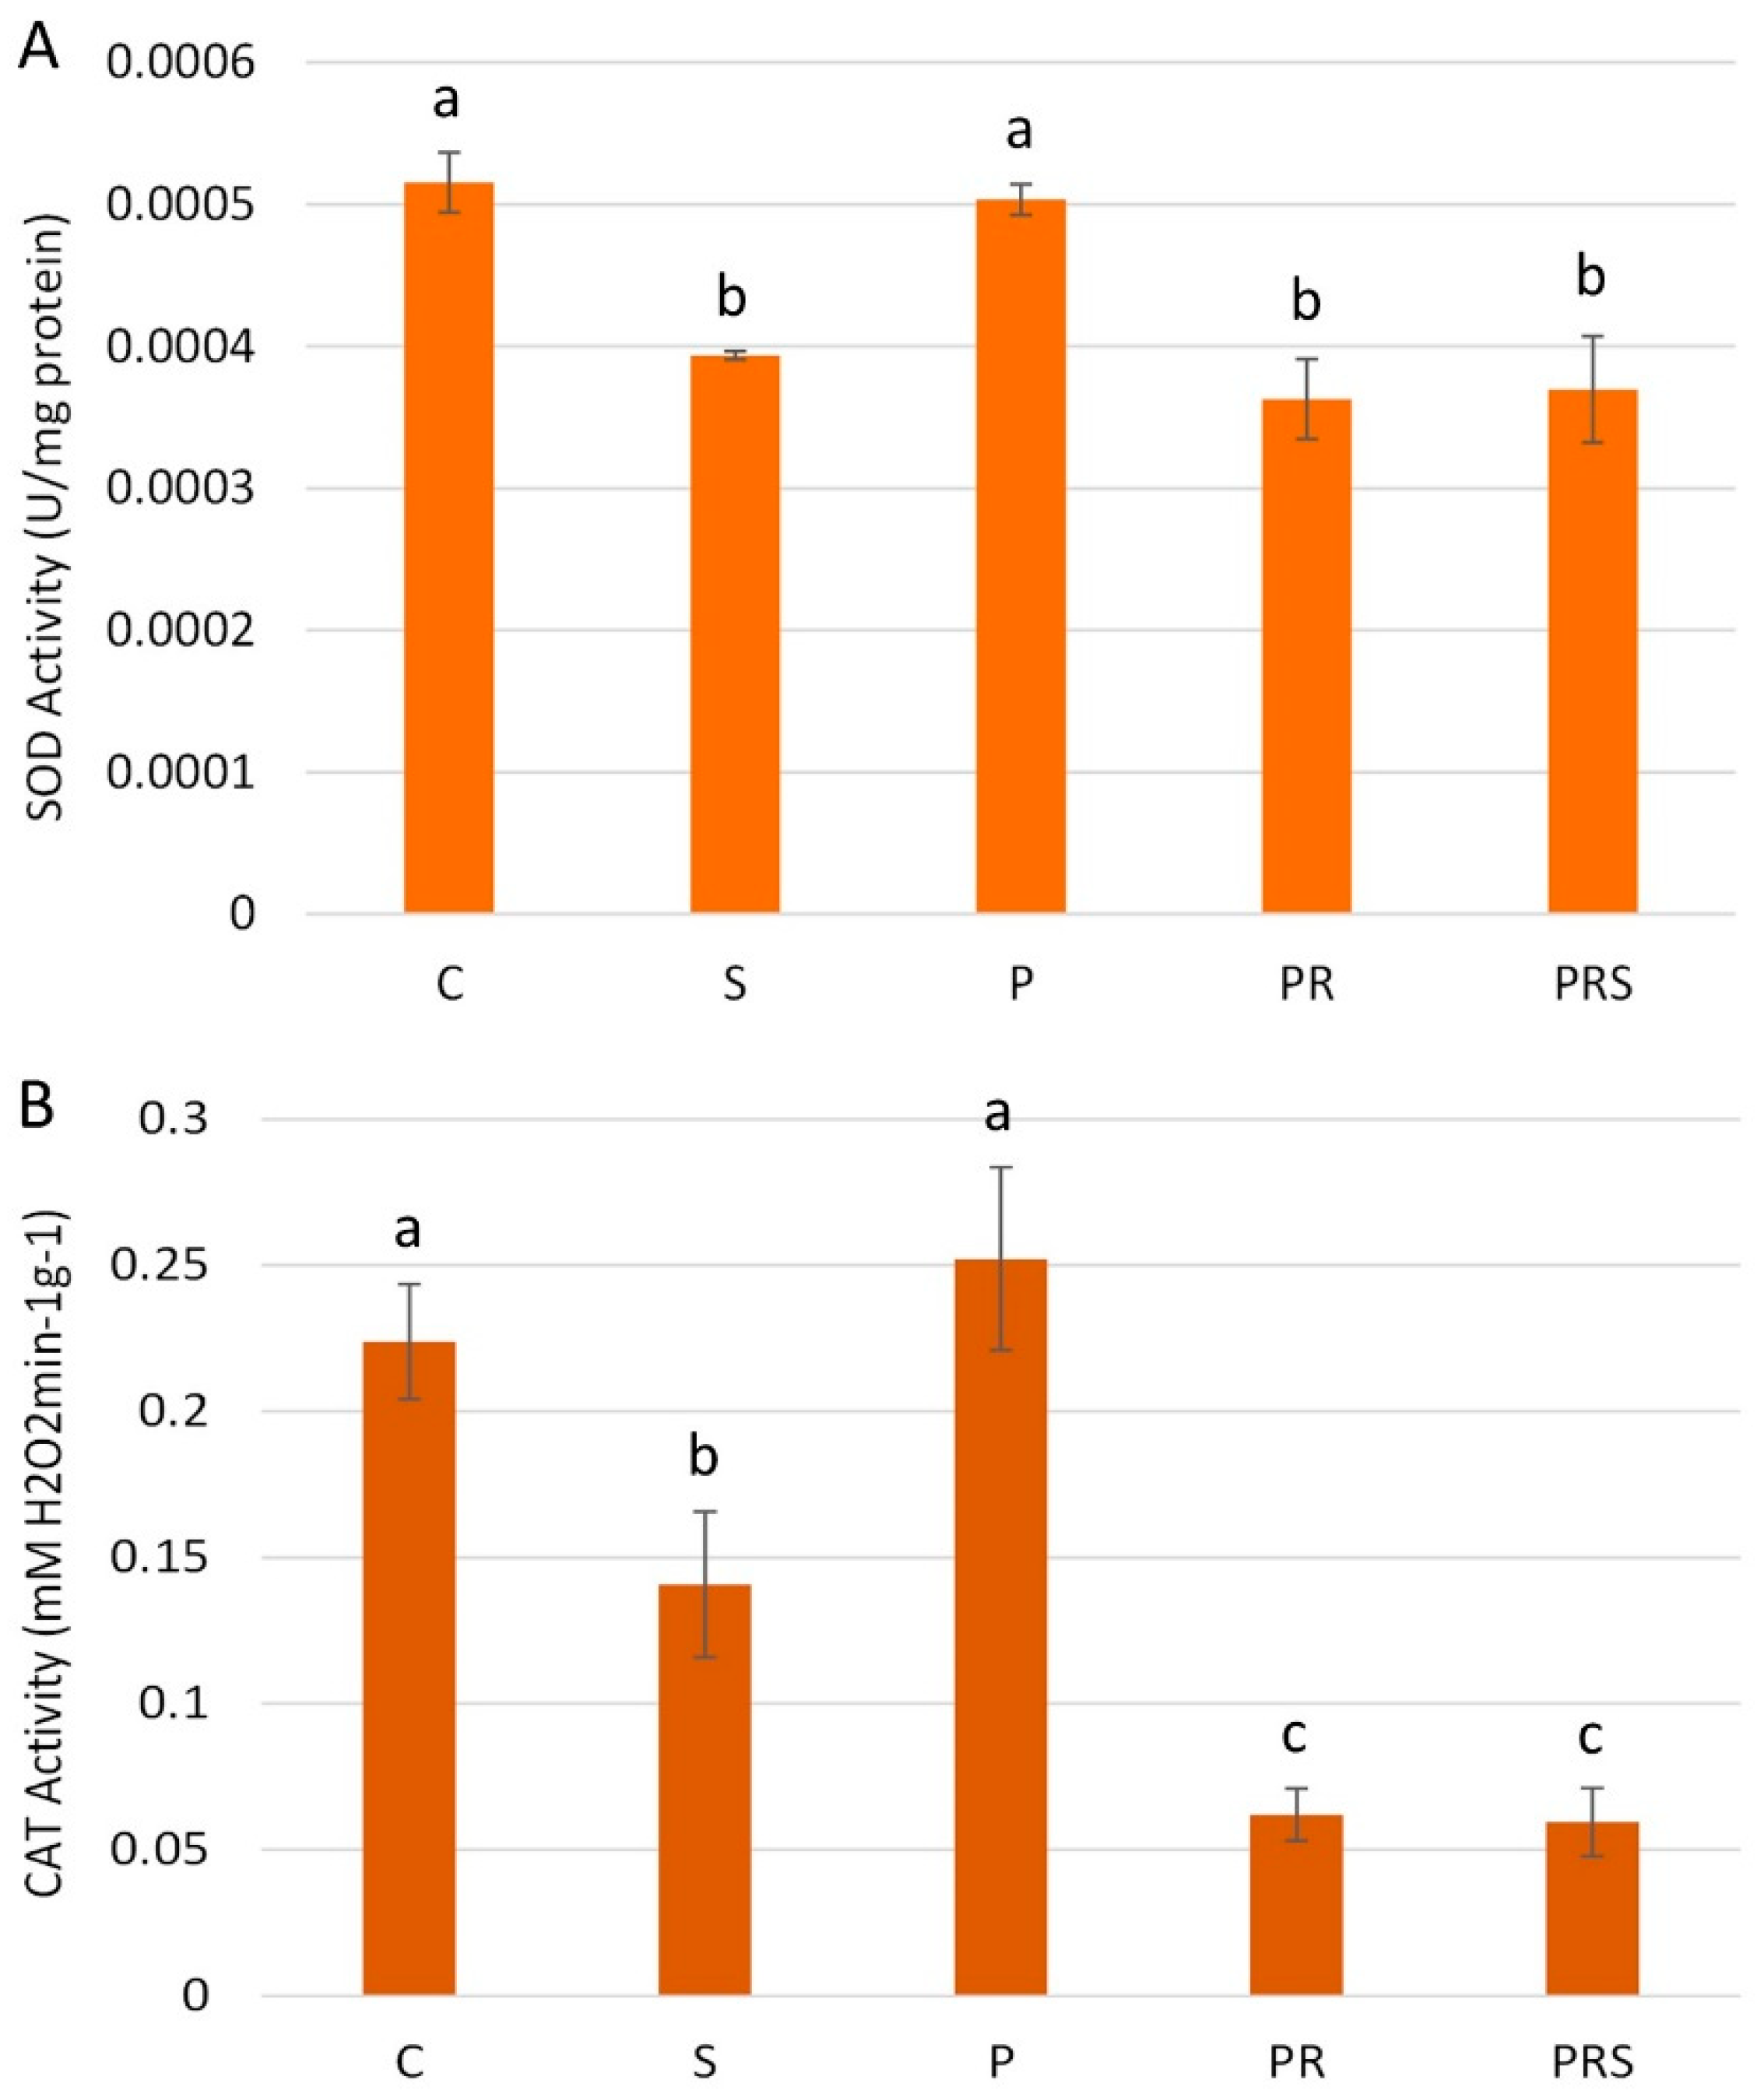
2.8. Stress and Priming Affect Pollen Antioxidant Machinery
2.9. Distribution of Cytosolic Ca2+ Changes upon Heat Treatment
3. Discussion
4. Materials and Methods
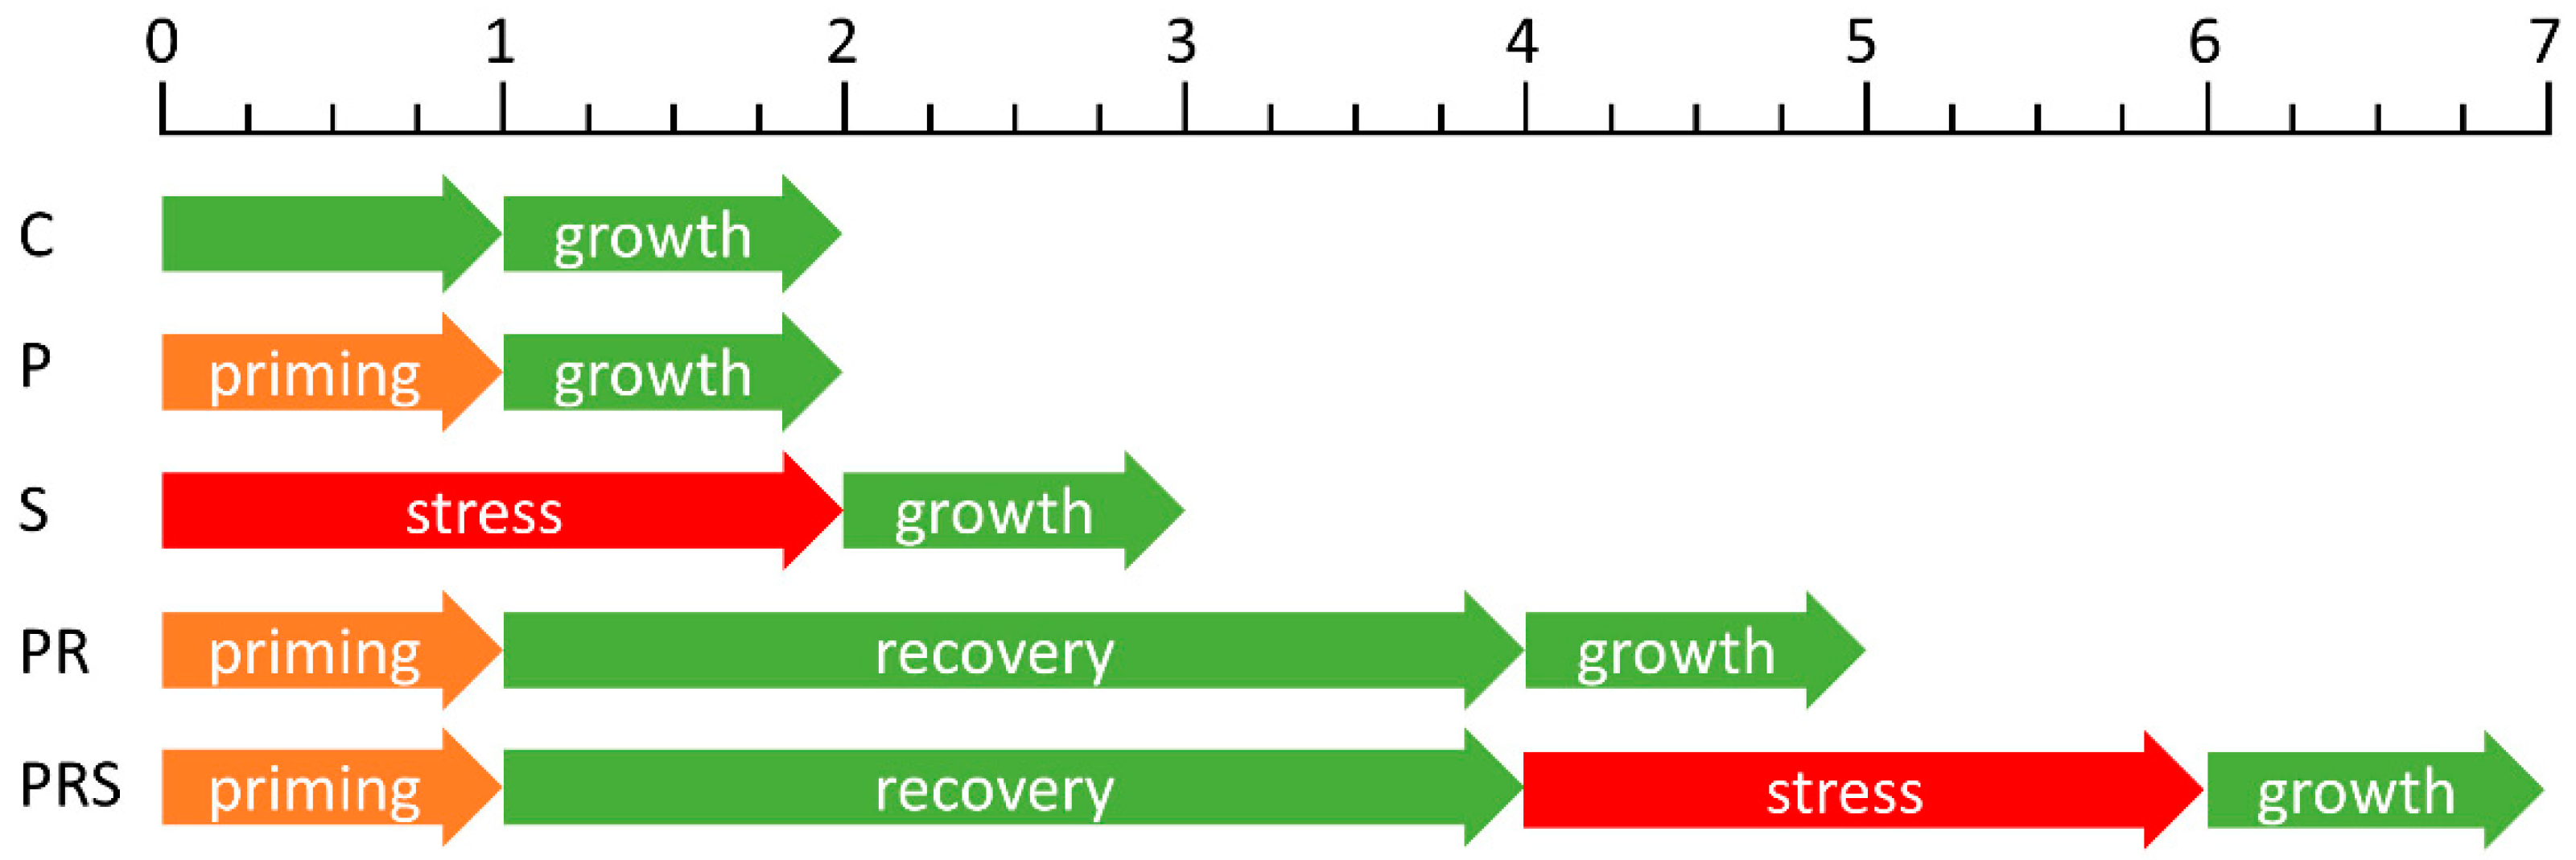
4.1. Pollen Growth and Stress Treatment
4.2. Protein Extraction
4.3. Determination of Protein Concentration
4.4. 1-D Electrophoresis and Immunoblotting
4.5. Fluorescence Imaging
4.6. Kymograph Analysis
4.7. Analysis of ATP and Sugars by High-Performance Liquid Chromatography (HPLC)
4.8. Catalase and Superoxide Dismutase Spectrophotometric Assays
4.9. Statistical Analysis
Supplementary Materials
Author Contributions
Funding
Institutional Review Board Statement
Informed Consent Statement
Data Availability Statement
Acknowledgments
Conflicts of Interest
Abbreviations
| Ca2+ | Calcium |
| ROS | Reactive oxygen species |
| HS | Heat stress |
| BTT | Basal thermotolerance |
| ATT | Acquired thermotolerance |
| HSPs | Heat shock proteins |
| APX | Ascorbate peroxidase |
| CAT | Catalase |
| SOD | Superoxide dismutase |
| RT | Room temperature |
| C | Control Group |
| P | Primed Group |
| S | Stressed Group |
| PR | Primed and Recovered Group |
| PRS | Primed, Recovered and Stresses Group |
| Sus | Sucrose synthase |
| UPR | Unfold protein response |
| TUB | Tubulin |
| TYR TUB | Tyrosinated tubulin |
References
- Li, W.; Ma, H. Gametophyte development. Curr. Biol. 2002, 12, R718–R721. [Google Scholar] [CrossRef] [Green Version]
- Cheung, A.Y.; Wu, H.-M. Structural and Signaling Networks for the Polar Cell Growth Machinery in Pollen Tubes. Annu. Rev. Plant Biol. 2008, 59, 547–572. [Google Scholar] [CrossRef] [PubMed]
- Michard, E.; Alves, F.; Feijó, J.A. The Role of Ion Fluxes in Polarized Cell Growth and Morphogenesis: The Pollen Tube as an Experimental Paradigm. Int. J. Dev. Biol. 2009, 53, 1609–1622. [Google Scholar] [CrossRef]
- Fu, Y. The Actin Cytoskeleton and Signaling Network during Pollen Tube Tip Growth. J. Integr. Plant Biol. 2010, 52, 131–137. [Google Scholar] [CrossRef]
- Hepler, P.K.; Rounds, C.M.; Winship, L.J. Control of Cell Wall Extensibility during Pollen Tube Growth. Mol. Plant 2013, 6, 998–1017. [Google Scholar] [CrossRef] [Green Version]
- Rojas, E.R.; Hotton, S.; Dumais, J. Chemically Mediated Mechanical Expansion of the Pollen Tube Cell Wall. Biophys. J. 2011, 101, 1844–1853. [Google Scholar] [CrossRef] [Green Version]
- Da Costa, M.L.; Pereira, L.G.; Coimbra, S. Growth Media Induces Variation in Cell Wall Associated Gene Expression in Arabidopsis Thaliana Pollen Tube. Plants 2013, 2, 429–440. [Google Scholar] [CrossRef]
- Persia, D.; Cai, G.; Del Casino, C.; Faleri, C.; Willemse, M.T.M.; Cresti, M. Sucrose Synthase Is Associated with the Cell Wall of Tobacco Pollen Tubes. Plant Physiol. 2008, 147, 1603–1618. [Google Scholar] [CrossRef] [PubMed] [Green Version]
- De Storme, N.; Geelen, D. The Impact of Environmental Stress on Male Reproductive Development in Plants: Biological Processes and Molecular Mechanisms. Plant Cell Environ. 2014, 37, 1–18. [Google Scholar] [CrossRef]
- Mesihovic, A.; Iannacone, R.; Firon, N.; Fragkostefanakis, S. Heat Stress Regimes for the Investigation of Pollen Thermotolerance in Crop Plants. Plant Reprod. 2016, 29, 93–105. [Google Scholar] [CrossRef] [PubMed]
- Firon, N.; Pressman, E.; Meir, S.; Khoury, R.; Altahan, L. Ethylene Is Involved in Maintaining Tomato (Solanum Lycopersicum) Pollen Quality under Heat-Stress Conditions. AoB Plants 2012, 2012, pls024. [Google Scholar] [CrossRef] [PubMed]
- Scharf, K.-D.; Berberich, T.; Ebersberger, I.; Nover, L. The Plant Heat Stress Transcription Factor (Hsf) Family: Structure, Function and Evolution. Biochim. Biophys. Acta 2012, 1819, 104–119. [Google Scholar] [CrossRef] [PubMed]
- Ohama, N.; Sato, H.; Shinozaki, K.; Yamaguchi-Shinozaki, K. Transcriptional Regulatory Network of Plant Heat Stress Response. Trends Plant Sci. 2017, 22, 53–65. [Google Scholar] [CrossRef]
- Vierling, E. The Roles of Heat Shock Proteins in Plants. Annu. Rev. Plant Physiol. Plant Mol. Biol. 1991, 42, 579–620. [Google Scholar] [CrossRef]
- Hartl, F.U.; Bracher, A.; Hayer-Hartl, M. Molecular Chaperones in Protein Folding and Proteostasis. Nature 2011, 475, 324–332. [Google Scholar] [CrossRef]
- Priya, M.; Dhanker, O.P.; Siddique, K.H.; HanumanthaRao, B.; Nair, R.M.; Pandey, S.; Singh, S.; Varshney, R.K.; Prasad, P.V.V.; Nayyar, H. Drought and heat stress-related proteins: An update about their functional relevance in imparting stress tolerance in agricultural crops. Theor. Appl. Genet. 2019, 132, 1607–1638. [Google Scholar] [CrossRef]
- Datta, R.; Chamusco, K.C.; Chourey, P.S. Starch Biosynthesis during Pollen Maturation Is Associated with Altered Patterns of Gene Expression in Maize. Plant Physiol. 2002, 130, 1645–1656. [Google Scholar] [CrossRef] [Green Version]
- Sakata, T.; Oshino, T.; Miura, S.; Tomabechi, M.; Tsunaga, Y.; Higashitani, N.; Miyazawa, Y.; Takahashi, H.; Watanabe, M.; Higashitani, A. Auxins Reverse Plant Male Sterility Caused by High Temperatures. Proc. Natl. Acad. Sci. USA 2010, 107, 8569–8574. [Google Scholar] [CrossRef] [Green Version]
- Jain, M.; Prasad, P.V.V.; Boote, K.J.; Hartwell, A.L.; Chourey, P.S. Effects of Season-Long High Temperature Growth Conditions on Sugar-to-Starch Metabolism in Developing Microspores of Grain Sorghum (Sorghum Bicolor L. Moench). Planta 2007, 227, 67–79. [Google Scholar] [CrossRef]
- Djanaguiraman, M.; Prasad, P.V.V.; Boyle, D.L.; Schapaugh, W.T. Soybean Pollen Anatomy, Viability and Pod Set under High Temperature Stress. J. Agron. Crop Sci. 2013, 199, 171–177. [Google Scholar] [CrossRef]
- Devasirvatham, V.; Gaur, P.M.; Mallikarjuna, N.; Raju, T.N.; Trethowan, R.M.; Tan, D.K.Y. Reproductive Biology of Chickpea Response to Heat Stress in the Field Is Associated with the Performance in Controlled Environments. Field Crop. Res. 2013, 142, 9–19. [Google Scholar] [CrossRef] [Green Version]
- Baxter, A.; Mittler, R.; Suzuki, N. ROS as Key Players in Plant Stress Signalling. J. Exp. Bot. 2014, 65, 1229–1240. [Google Scholar] [CrossRef] [PubMed]
- Mittler, R.; Vanderauwera, S.; Gollery, M.; Van Breusegem, F. Reactive Oxygen Gene Network of Plants. Trends Plant Sci. 2004, 9, 490–498. [Google Scholar] [CrossRef] [PubMed]
- Hu, X.; Bidney, D.L.; Yalpani, N.; Duvick, J.P.; Crasta, O.; Folkerts, O.; Lu, G. Overexpression of a Gene Encoding Hydrogen Peroxide-Generating Oxalate Oxidase Evokes Defense Responses in Sunflower. Plant Physiol. 2003, 133, 170–181. [Google Scholar] [CrossRef] [PubMed] [Green Version]
- Raja, M.M.; Vijayalakshmi, G.; Naik, M.L.; Basha, P.O.; Sergeant, K.; Hausman, J.F.; Khan, P.S.S.V. Pollen development and function under heat stress: From effects to responses. Acta Physiol. Plant. 2019, 41, 47. [Google Scholar] [CrossRef]
- Jegadeesan, S.; Chaturvedi, P.; Ghatak, A.; Pressman, E.; Meir, S.; Faigenboim, A.; Rutley, N.; Beery, A.; Harel, A.; Weckwerth, W.; et al. Proteomics of Heat-Stress and Ethylene-Mediated Thermotolerance Mechanisms in Tomato Pollen Grains. Front. Plant Sci. 2018, 9, 1558. [Google Scholar] [CrossRef] [PubMed] [Green Version]
- Keller, M.; Hu, Y.; Mesihovic, A.; Fragkostefanakis, S.; Schleiff, E.; Simm, S. Alternative Splicing in Tomato Pollen in Response to Heat Stress. DNA Res. 2017, 24, 205–217. [Google Scholar] [CrossRef] [Green Version]
- Keller, M.; Schleiff, E.; Simm, S. MiRNAs Involved in Transcriptome Remodeling during Pollen Development and Heat Stress Response in Solanum Lycopersicum. Sci. Rep. 2020, 10, 10694. [Google Scholar] [CrossRef] [PubMed]
- Shivanna, K.R.; Linskens, H.F.; Cresti, M. Responses of Tobacco Pollen to High Humidity and Heat Stress: Viability and Germinability in Vitro and in Vivo. Sex. Plant Reprod. 1991, 4, 104–109. [Google Scholar] [CrossRef]
- Potocký, M.; Jones, M.A.; Bezvoda, R.; Smirnoff, N.; Žárský, V. Reactive Oxygen Species Produced by NADPH Oxidase Are Involved in Pollen Tube Growth. New Phytol. 2007, 174, 742–751. [Google Scholar] [CrossRef]
- Iwano, M.; Entani, T.; Shiba, H.; Kakita, M.; Nagai, T.; Mizuno, H.; Miyawaki, A.; Shoji, T.; Kubo, K.; Isogai, A.; et al. Fine-Tuning of the Cytoplasmic Ca2+ Concentration Is Essential for Pollen Tube Growth. Plant Physiol. 2009, 150, 1322–1334. [Google Scholar] [CrossRef] [PubMed] [Green Version]
- Kaya, H.; Nakajima, R.; Iwano, M.; Kanaoka, M.M.; Kimura, S.; Takeda, S.; Kawarazaki, T.; Senzaki, E.; Hamamura, Y.; Higashiyama, T.; et al. Ca2+-Activated Reactive Oxygen Species Production by Arabidopsis RbohH and RbohJ Is Essential for Proper Pollen Tube Tip Growth[W]. Plant Cell 2014, 26, 1069–1080. [Google Scholar] [CrossRef] [Green Version]
- Do, T.H.T.; Choi, H.; Palmgren, M.; Martinoia, E.; Hwang, J.-U.; Lee, Y. Arabidopsis ABCG28 Is Required for the Apical Accumulation of Reactive Oxygen Species in Growing Pollen Tubes. Proc. Natl. Acad. Sci. USA 2019, 116, 12540–12549. [Google Scholar] [CrossRef] [Green Version]
- Gutermuth, T.; Herbell, S.; Lassig, R.; Brosché, M.; Romeis, T.; Feijó, J.A.; Hedrich, R.; Konrad, K.R. Tip-Localized Ca2+ -Permeable Channels Control Pollen Tube Growth via Kinase-Dependent R- and S-Type Anion Channel Regulation. New Phytol. 2018, 218, 1089–1105. [Google Scholar] [CrossRef] [PubMed] [Green Version]
- Wu, J.; Shang, Z.; Wu, J.; Jiang, X.; Moschou, P.N.; Sun, W.; Roubelakis-Angelakis, K.A.; Zhang, S. Spermidine Oxidase-Derived H₂O₂ Regulates Pollen Plasma Membrane Hyperpolarization-Activated Ca(2+)-Permeable Channels and Pollen Tube Growth. Plant J. Cell Mol. Biol. 2010, 63, 1042–1053. [Google Scholar] [CrossRef]
- Schiøtt, M.; Romanowsky, S.M.; Bækgaard, L.; Jakobsen, M.K.; Palmgren, M.G.; Harper, J.F. A Plant Plasma Membrane Ca2+ Pump Is Required for Normal Pollen Tube Growth and Fertilization. Proc. Natl. Acad. Sci. USA 2004, 101, 9502–9507. [Google Scholar] [CrossRef] [Green Version]
- Damineli, D.S.C.; Portes, M.T.; Feijó, J.A. Oscillatory Signatures Underlie Growth Regimes in Arabidopsis Pollen Tubes: Computational Methods to Estimate Tip Location, Periodicity, and Synchronization in Growing Cells. J. Exp. Bot. 2017, 68, 3267–3281. [Google Scholar] [CrossRef] [Green Version]
- Suzuki, N.; Mittler, R. Reactive Oxygen Species and Temperature Stresses: A Delicate Balance between Signaling and Destruction. Physiol. Plant. 2006, 126, 45–51. [Google Scholar] [CrossRef]
- Çetinbaş-Genç, A.; Cai, G.; Duca, S.D.; Vardar, F.; Ünal, M. The Effect of Putrescine on Pollen Performance in Hazelnut (Corylus Avellana L.). Sci. Hortic. 2020, 261, 108971. [Google Scholar] [CrossRef]
- Liu, H.; Yu, C.; Li, H.; Ouyang, B.; Wang, T.; Zhang, J.; Wang, X.; Ye, Z. Overexpression of ShDHN, a dehydrin gene from Solanum habrochaites enhances tolerance to multiple abiotic stresses in tomato. Plant Sci. 2015, 231, 198–211. [Google Scholar] [CrossRef]
- Subramanyam, K.; Sailaja, K.V.; Subramanyam, K.; Rao, D.M.; Lakshmidevi, K. Ectopic expression of an osmotin gene leads to enhanced salt tolerance in transgenic chilli pepper (Capsicum annum L.). Plant Cell Tissue Organ Cult. 2011, 105, 181–192. [Google Scholar] [CrossRef]
- Dasgupta, M.G.; Dharanishanthi, V. Identification of PEG-induced water stress responsive transcripts using co-expression network in Eucalyptus grandis. Gene 2017, 627, 393–407. [Google Scholar] [CrossRef] [PubMed]
- George, K.J.; Malik, N.; Kumar, I.V.; Krishnamurthy, K.S. Gene expression analysis in drought tolerant and susceptible black pepper (Piper nigrum L.) in response to water deficit stress. Acta Physiol. Plant 2017, 39, 104. [Google Scholar] [CrossRef]
- Fragkostefanakis, S.; Mesihovic, A.; Hu, Y.; Schleiff, E. Unfolded Protein Response in Pollen Development and Heat Stress Tolerance. Plant Reprod. 2016, 29, 81–91. [Google Scholar] [CrossRef]
- Singh, M.B.; Lohani, N.; Bhalla, P.L. The Role of Endoplasmic Reticulum Stress Response in Pollen Development and Heat Stress Tolerance. Front. Plant Sci. 2021, 12, 661062. [Google Scholar] [CrossRef]
- Volkov, R.A.; Panchuk, I.I.; Schöffl, F. Small Heat Shock Proteins Are Differentially Regulated during Pollen Development and Following Heat Stress in Tobacco. Plant Mol. Biol. 2005, 57, 487–502. [Google Scholar] [CrossRef]
- Burke, J.J.; Chen, J. Enhancement of reproductive heat tolerance in plants. PLoS ONE 2015, 10, e0122933. [Google Scholar] [CrossRef] [Green Version]
- Chaturvedi, P.; Ghatak, A.; Weckwerth, W. Pollen proteomics: From stress physiology to developmental priming. Plant Reprod. 2016, 29, 119–132. [Google Scholar] [CrossRef] [Green Version]
- Parrotta, L.; Faleri, C.; Cresti, M.; Cai, G. Heat Stress Affects the Cytoskeleton and the Delivery of Sucrose Synthase in Tobacco Pollen Tubes. Planta 2016, 243, 43–63. [Google Scholar] [CrossRef]
- McLoughlin, F.; Kim, M.; Marshall, R.S.; Vierstra, R.D.; Vierling, E. HSP101 interacts with the proteasome and promotes the clearance of ubiquitylated protein aggregates. Plant Physiol. 2019, 180, 1829–1847. [Google Scholar] [CrossRef] [PubMed] [Green Version]
- Mounier, N.; Arrigo, A.P. Actin cytoskeleton and small heat shock proteins: How do they interact? Cell Stress Chaperones 2002, 7, 167. [Google Scholar] [CrossRef] [Green Version]
- Aloisi, I.; Cai, G.; Faleri, C.; Navazio, L.; Serafini-Fracassini, D.; Del Duca, S. Spermine Regulates Pollen Tube Growth by Modulating Ca2+-Dependent Actin Organization and Cell Wall Structure. Front. Plant Sci. 2017, 8, 1701. [Google Scholar] [CrossRef] [Green Version]
- Röckel, N.; Wolf, S.; Kost, B.; Rausch, T.; Greiner, S. Elaborate Spatial Patterning of Cell-Wall PME and PMEI at the Pollen Tube Tip Involves PMEI Endocytosis, and Reflects the Distribution of Esterified and de-Esterified Pectins. Plant J. Cell Mol. Biol. 2008, 53, 133–143. [Google Scholar] [CrossRef]
- Kroeger, J.H.; Geitmann, A.; Grant, M. Model for Calcium Dependent Oscillatory Growth in Pollen Tubes. J. Theor. Biol. 2008, 253, 363–374. [Google Scholar] [CrossRef]
- Rounds, C.M.; Winship, L.J.; Hepler, P.K. Pollen Tube Energetics: Respiration, Fermentation and the Race to the Ovule. AoB Plants 2011, 2011, plr019. [Google Scholar] [CrossRef] [PubMed] [Green Version]
- Gadadhar, S.; Bodakuntla, S.; Natarajan, K.; Janke, C. The Tubulin Code at a Glance. J. Cell Sci. 2017, 130, 1347–1353. [Google Scholar] [CrossRef] [PubMed] [Green Version]
- Jovanović, A.M.; Durst, S.; Nick, P. Plant Cell Division Is Specifically Affected by Nitrotyrosine. J. Exp. Bot. 2010, 61, 901–909. [Google Scholar] [CrossRef] [PubMed] [Green Version]
- Aström, H. Acetylated Alpha-Tubulin in the Pollen Tube Microtubules. Cell Biol. Int. Rep. 1992, 16, 871–881. [Google Scholar] [CrossRef]
- Gardiner, J.; Barton, D.; Marc, J.; Overall, R. Potential Role of Tubulin Acetylation and Microtubule-Based Protein Trafficking in Familial Dysautonomia. Traffic 2007, 8, 1145–1149. [Google Scholar] [CrossRef] [PubMed]
- Firon, N.; Shaked, R.; Peet, M.M.; Pharr, D.M.; Zamski, E.; Rosenfeld, K.; Althan, L.; Pressman, E. Pollen Grains of Heat Tolerant Tomato Cultivars Retain Higher Carbohydrate Concentration under Heat Stress Conditions. Sci. Hortic. 2006, 109, 212–217. [Google Scholar] [CrossRef]
- Lahlali, R.; Jiang, Y.; Kumar, S.; Karunakaran, C.; Liu, X.; Borondics, F.; Hallin, E.; Bueckert, R. ATR–FTIR Spectroscopy Reveals Involvement of Lipids and Proteins of Intact Pea Pollen Grains to Heat Stress Tolerance. Front. Plant Sci. 2014, 5, 747. [Google Scholar] [CrossRef] [Green Version]
- Subbaiah, C.C.; Huber, S.C.; Sachs, M.M.; Rhoads, D. Sucrose Synthase: Expanding Protein Function. Plant Signal. Behav. 2007, 2, 28–29. [Google Scholar] [CrossRef] [Green Version]
- Cai, G.; Faleri, C.; Del Casino, C.; Emons, A.M.C.; Cresti, M. Distribution of Callose Synthase, Cellulose Synthase, and Sucrose Synthase in Tobacco Pollen Tube Is Controlled in Dissimilar Ways by Actin Filaments and Microtubules. Plant Physiol. 2011, 155, 1169–1190. [Google Scholar] [CrossRef] [Green Version]
- Sangu, E.; Tibazarwa, F.I.; Nyomora, A.; Symonds, R.C. Expression of Genes for the Biosynthesis of Compatible Solutes during Pollen Development under Heat Stress in Tomato (Solanum Lycopersicum). J. Plant Physiol. 2015, 178, 10–16. [Google Scholar] [CrossRef] [PubMed]
- Brewbaker, J.L.; Kwack, B.H. The Essential Role of Calcium Ion in Pollen Germination and Pollen Tube Growth. Am. J. Bot. 1963, 50, 859–865. [Google Scholar] [CrossRef]
- Heinlein, M.; Starlinger, P. Tissue- and cell-specific expression of the two sucrose synthase isoenzymes in developing maize kernels. Mol. Gen. Genet. 1989, 215, 441–446. [Google Scholar] [CrossRef]
- Lovy-Wheeler, A.; Wilsen, K.L.; Baskin, T.I.; Hepler, P.K. Enhanced Fixation Reveals the Apical Cortical Fringe of Actin Filaments as a Consistent Feature of the Pollen Tube. Planta 2005, 221, 95–104. [Google Scholar] [CrossRef] [Green Version]
- Aloisi, I.; Cai, G.; Tumiatti, V.; Minarini, A.; Del Duca, S. Natural Polyamines and Synthetic Analogs Modify the Growth and the Morphology of Pyrus Communis Pollen Tubes Affecting ROS Levels and Causing Cell Death. Plant Sci. Int. J. Exp. Plant Biol. 2015, 239, 92–105. [Google Scholar] [CrossRef] [PubMed]
- Parrotta, L.; Aloisi, I.; Suanno, C.; Faleri, C.; Kiełbowicz-Matuk, A.; Bini, L.; Cai, G.; Del Duca, S. A Low Molecular-Weight Cyclophilin Localizes in Different Cell Compartments of Pyrus Communis Pollen and Is Released in Vitro under Ca2+ Depletion. Plant Physiol. Biochem. 2019, 144, 197–206. [Google Scholar] [CrossRef]
- Liu, H.; Jiang, Y.; Luo, Y.; Jiang, W. A Simple and Rapid Determination of ATP, ADP and AMP Concentrations in Pericarp Tissue of Litchi Fruit by High Performance Liquid Chromatography. Food Technol. Biotechnol. 2006, 44, 531–534. [Google Scholar]
- Elavarthi, S.; Martin, B. Spectrophotometric Assays for Antioxidant Enzymes in Plants. Methods Mol. Biol. 2010, 639, 273–280. [Google Scholar] [CrossRef] [PubMed]


Publisher’s Note: MDPI stays neutral with regard to jurisdictional claims in published maps and institutional affiliations. |
© 2021 by the authors. Licensee MDPI, Basel, Switzerland. This article is an open access article distributed under the terms and conditions of the Creative Commons Attribution (CC BY) license (https://creativecommons.org/licenses/by/4.0/).
Share and Cite
Mareri, L.; Faleri, C.; Aloisi, I.; Parrotta, L.; Del Duca, S.; Cai, G. Insights into the Mechanisms of Heat Priming and Thermotolerance in Tobacco Pollen. Int. J. Mol. Sci. 2021, 22, 8535. https://0-doi-org.brum.beds.ac.uk/10.3390/ijms22168535
Mareri L, Faleri C, Aloisi I, Parrotta L, Del Duca S, Cai G. Insights into the Mechanisms of Heat Priming and Thermotolerance in Tobacco Pollen. International Journal of Molecular Sciences. 2021; 22(16):8535. https://0-doi-org.brum.beds.ac.uk/10.3390/ijms22168535
Chicago/Turabian StyleMareri, Lavinia, Claudia Faleri, Iris Aloisi, Luigi Parrotta, Stefano Del Duca, and Giampiero Cai. 2021. "Insights into the Mechanisms of Heat Priming and Thermotolerance in Tobacco Pollen" International Journal of Molecular Sciences 22, no. 16: 8535. https://0-doi-org.brum.beds.ac.uk/10.3390/ijms22168535