Toward Tailoring the Degradation Rate of Magnesium-Based Biomaterials for Various Medical Applications: Assessing Corrosion, Cytocompatibility and Immunological Effects

 , , ,
, , ,  and
and 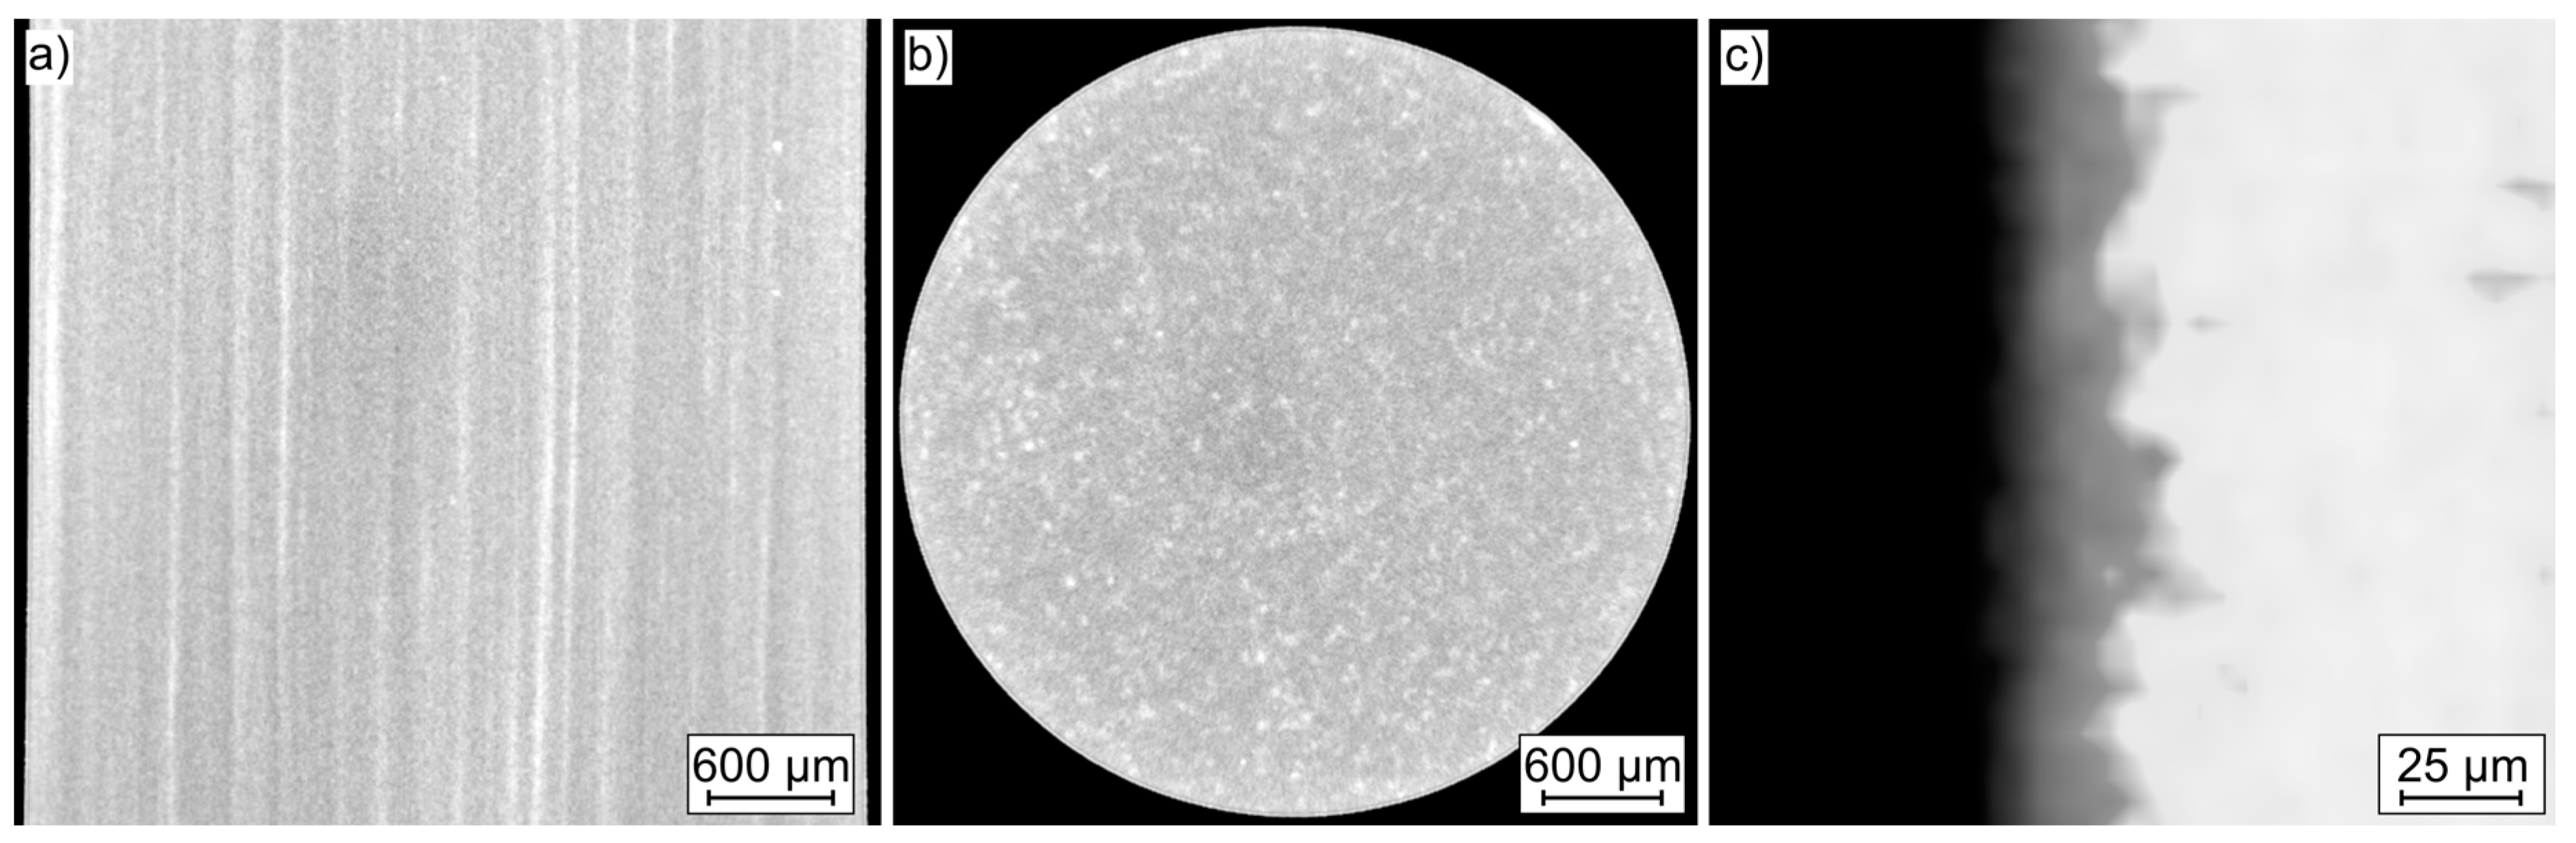
Abstract
:1. Introduction
2. Results
2.1. Macro- and Microstructure
2.1.1. Mg WE43 MEO
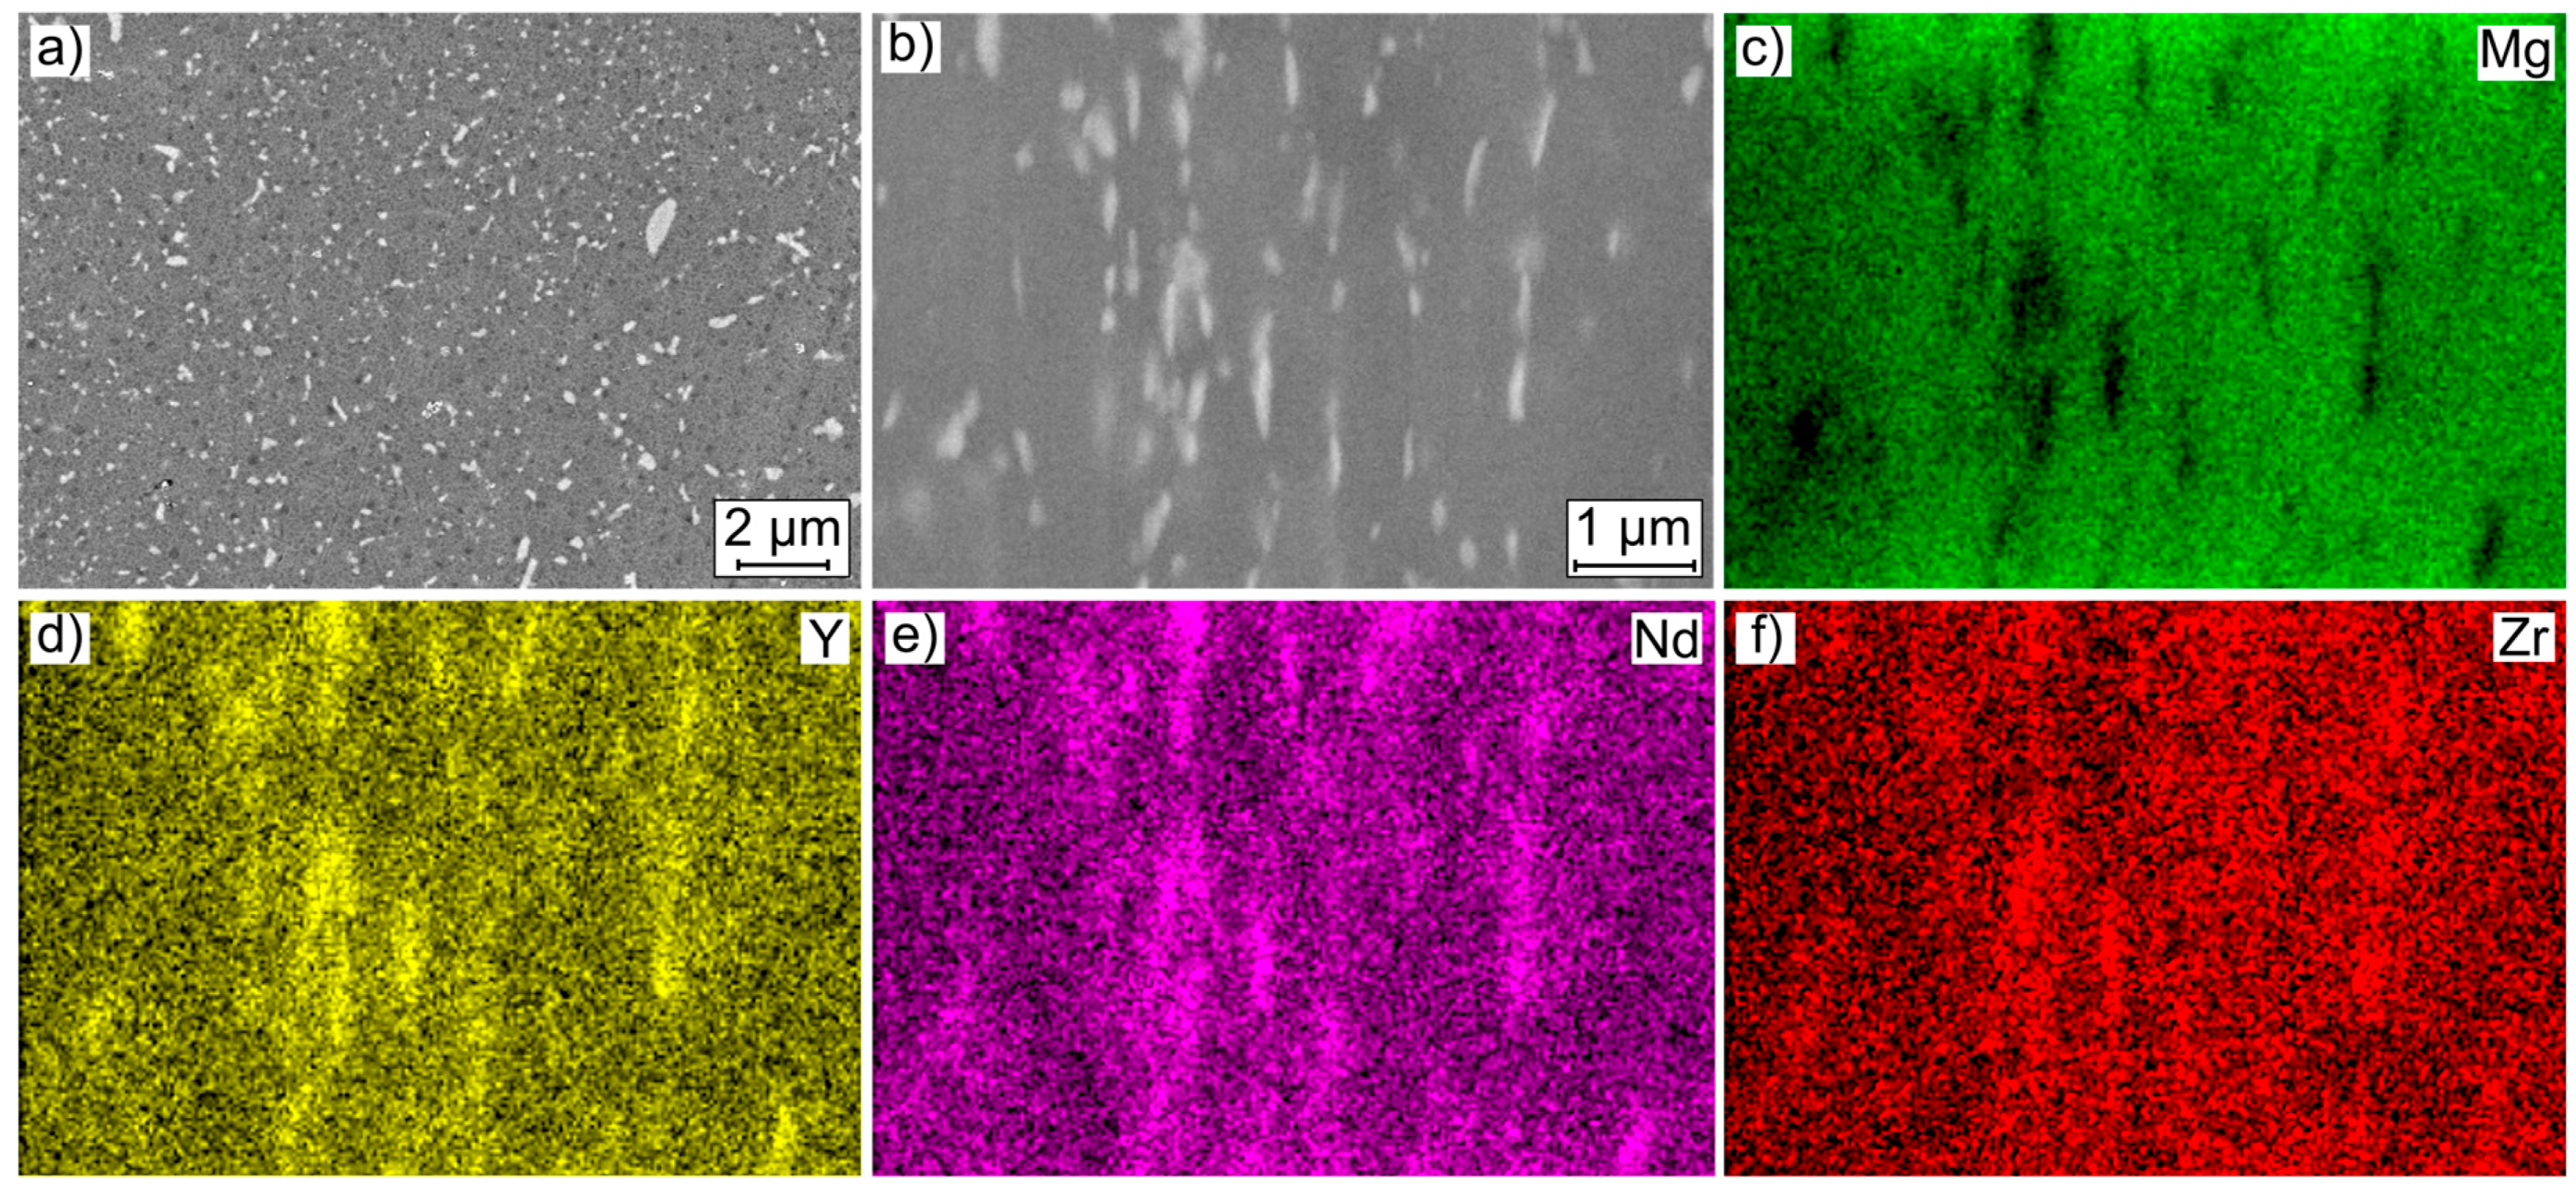
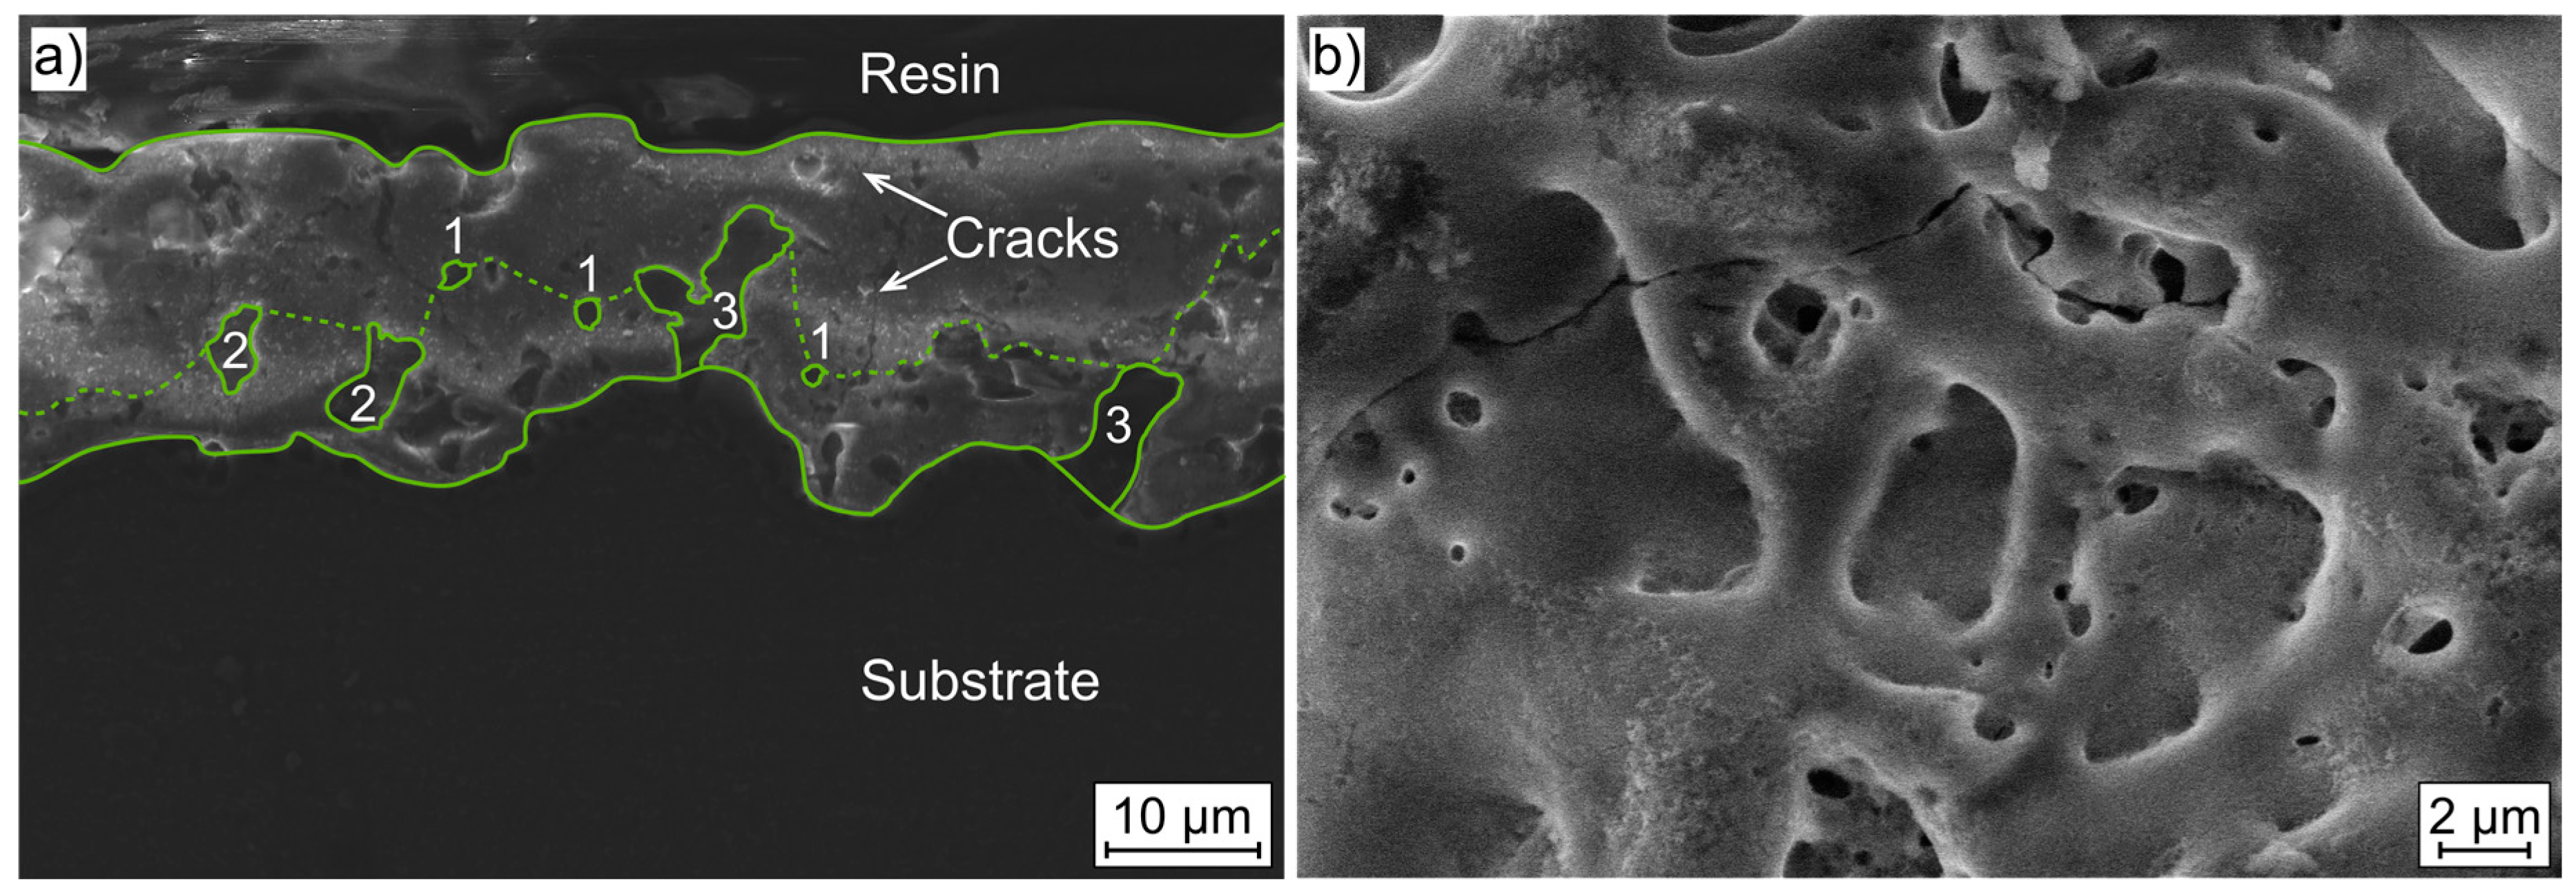
2.1.2. Plasma Electrolytic Oxidation Coating
2.1.3. Corrosion Behavior
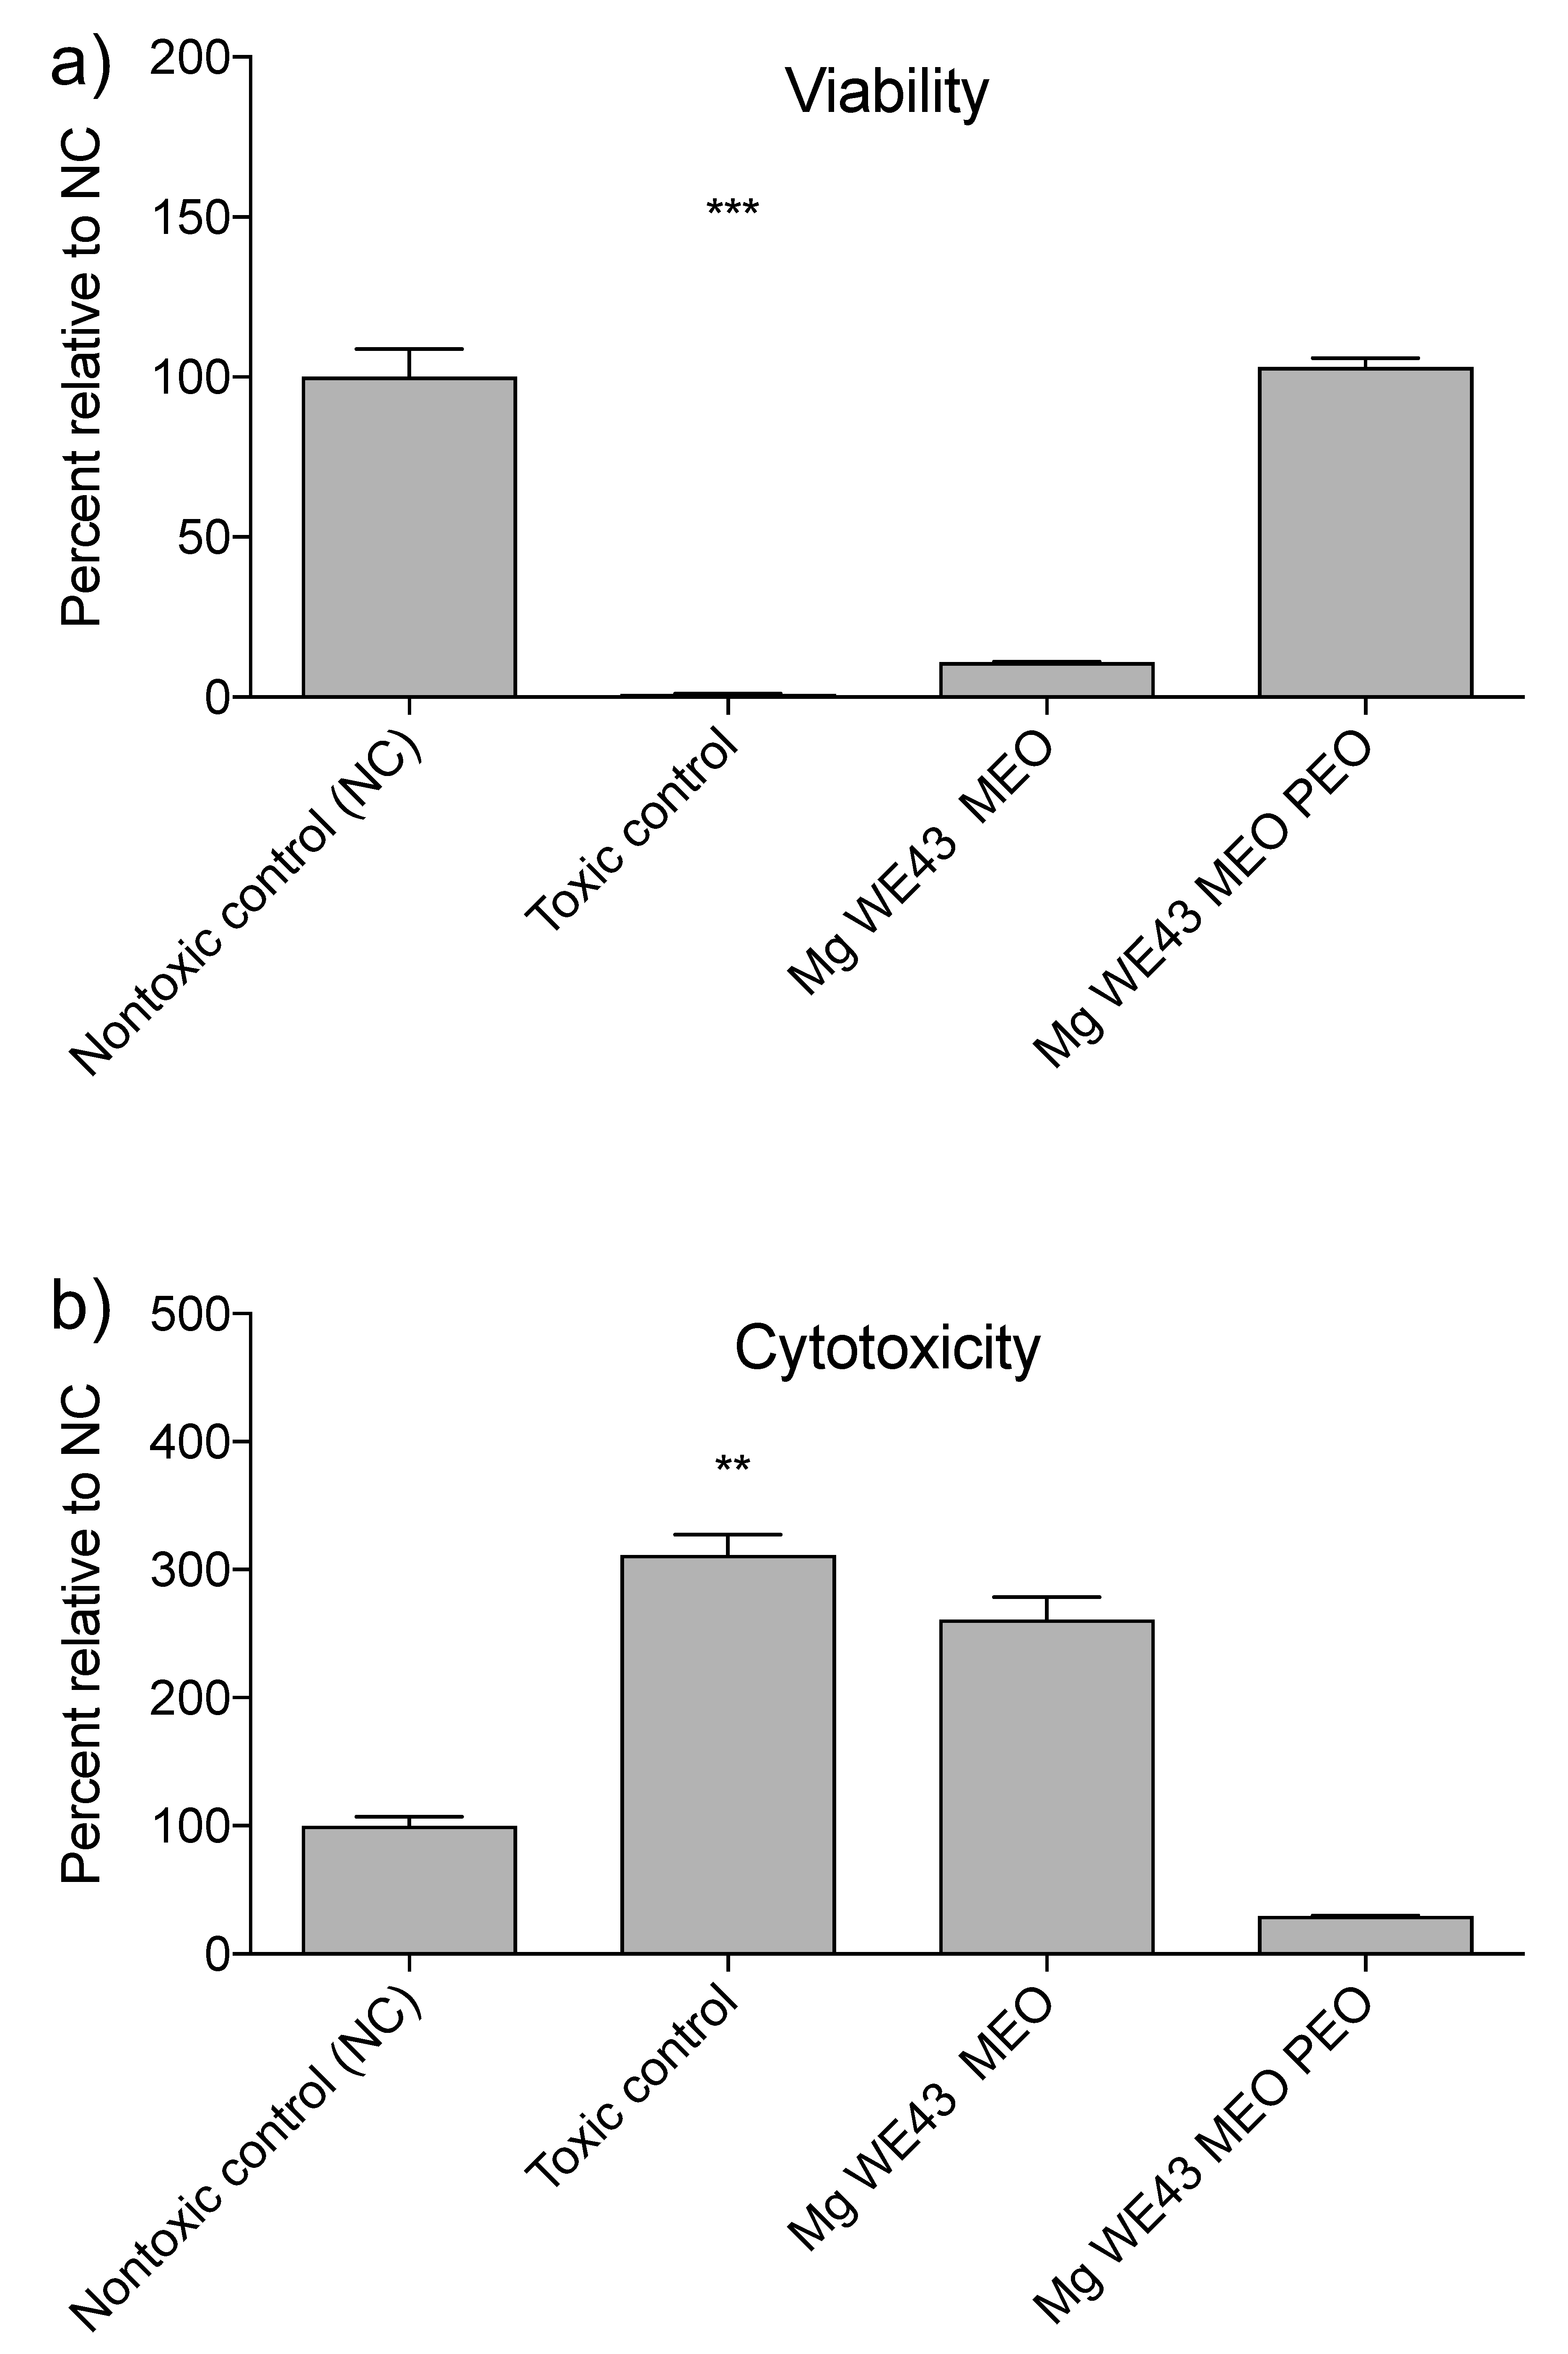
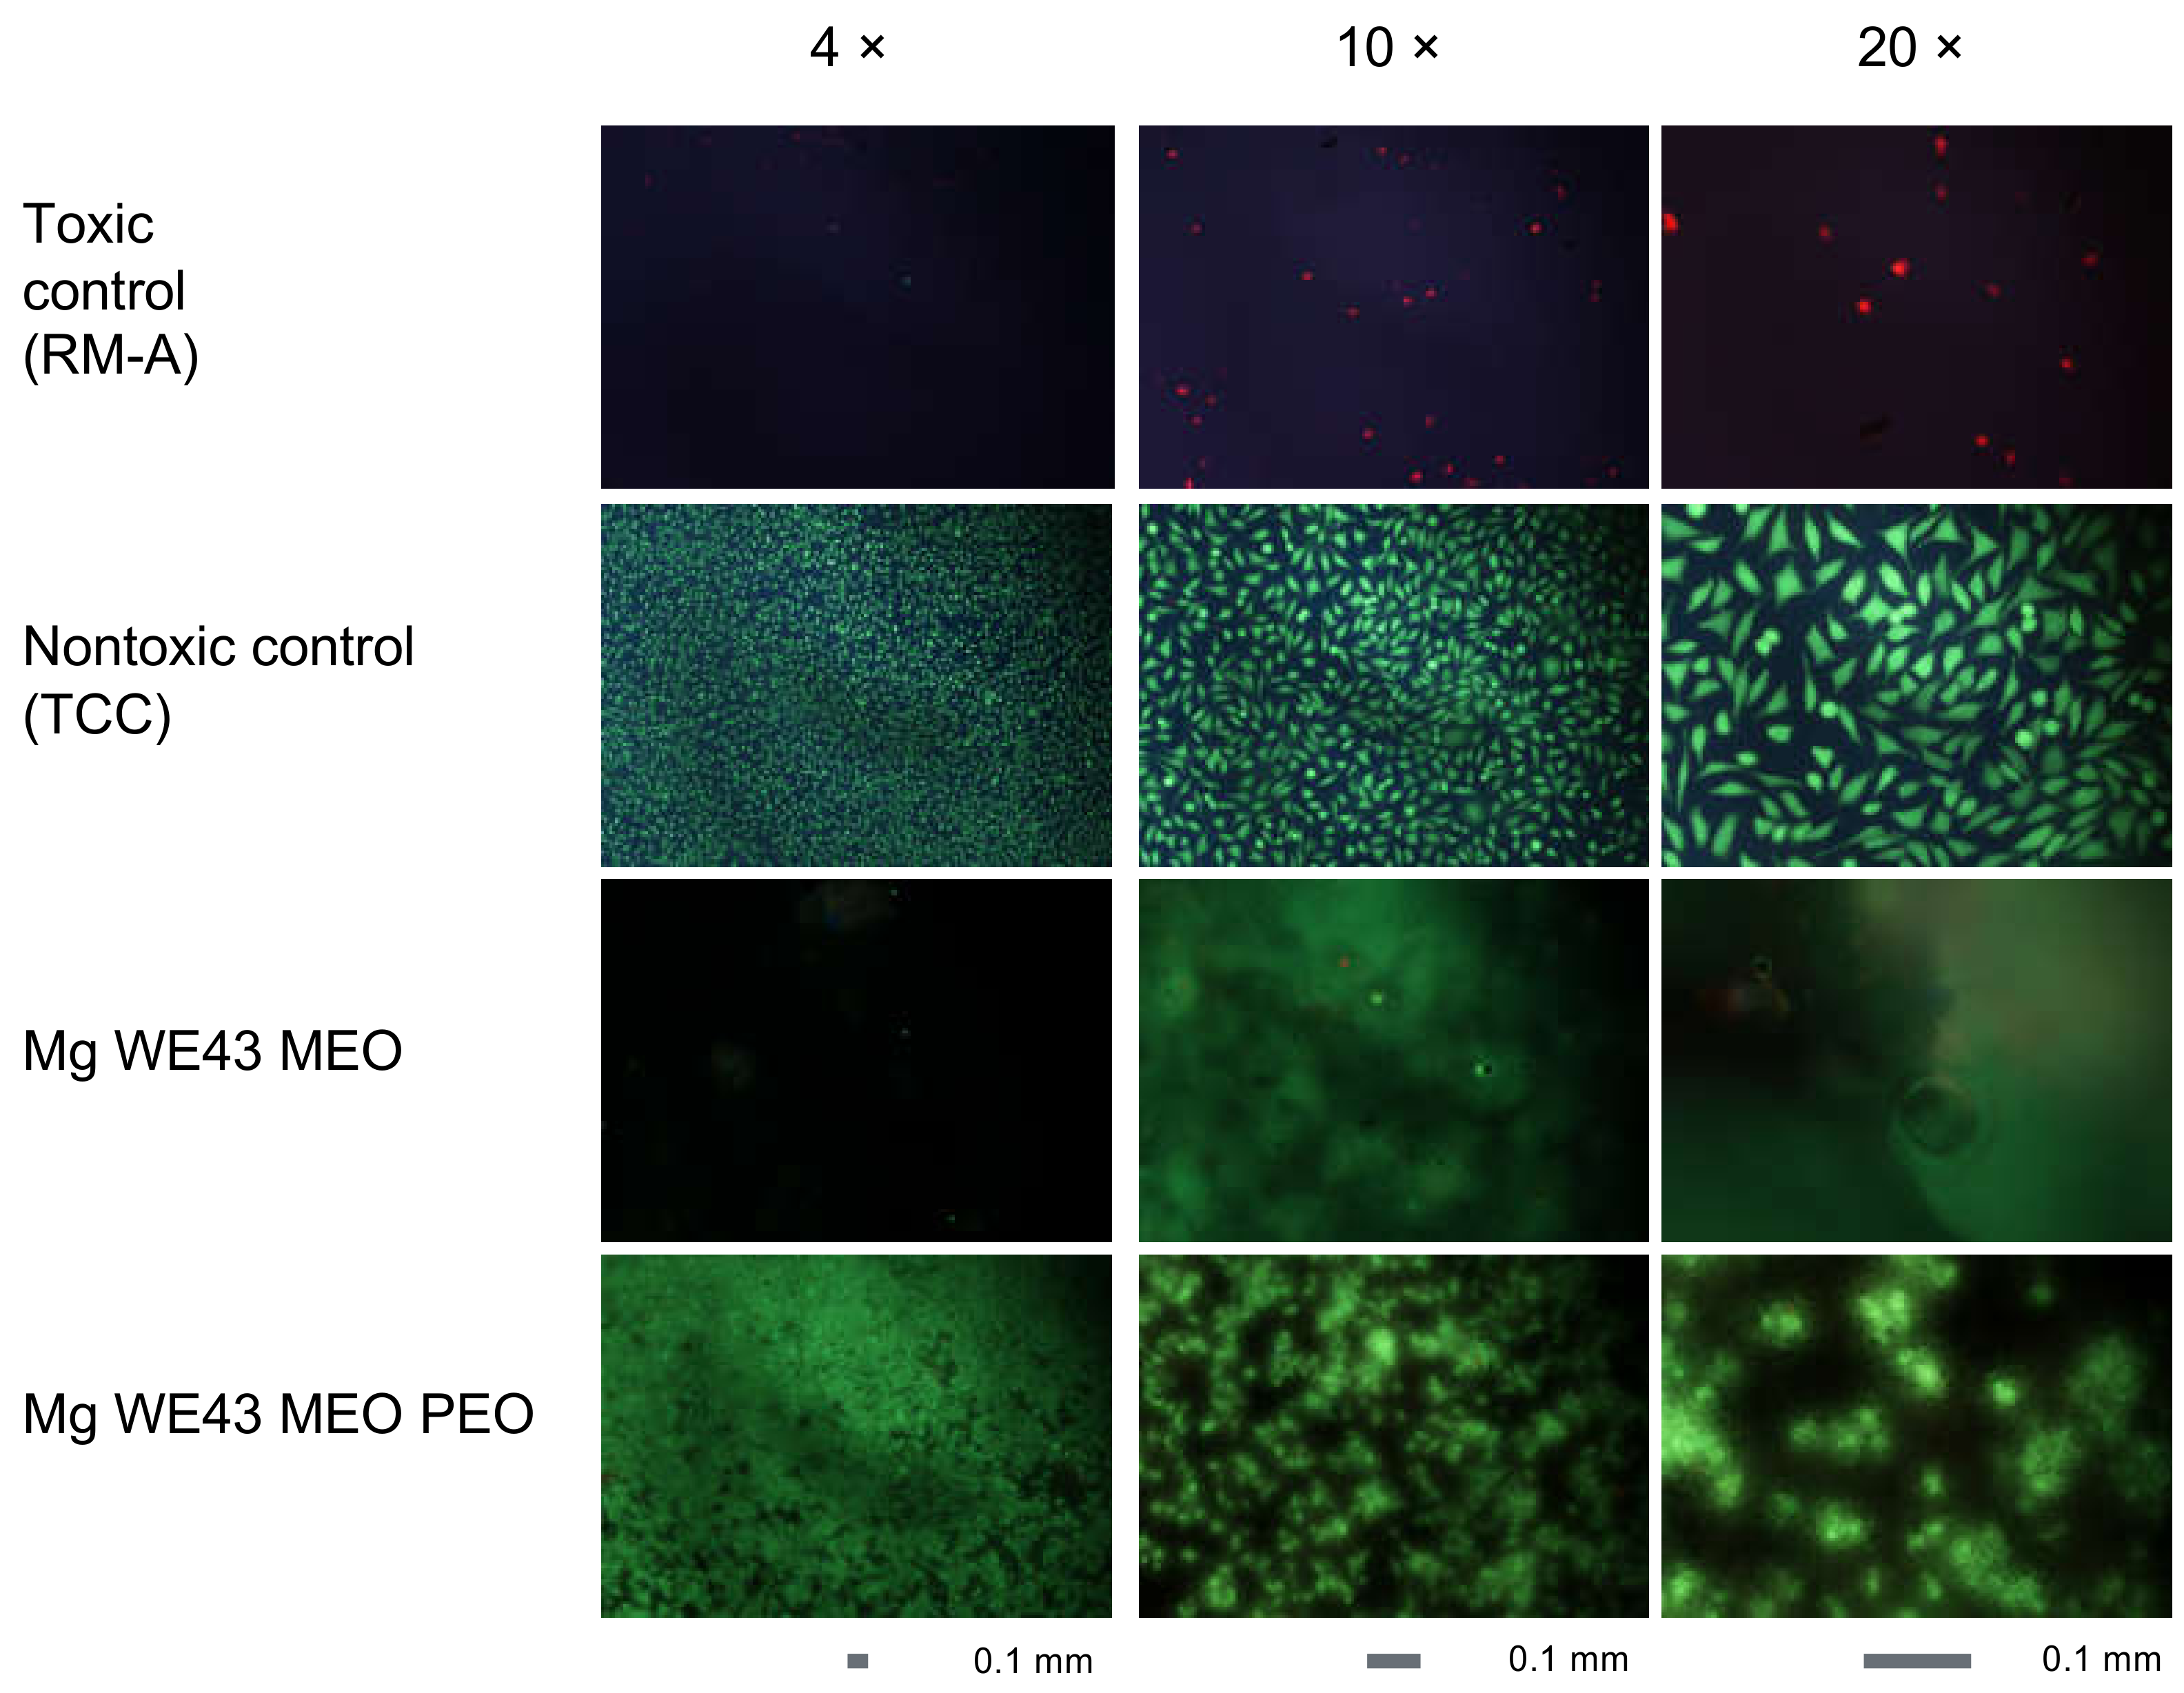
2.1.4. Cytocompatibility
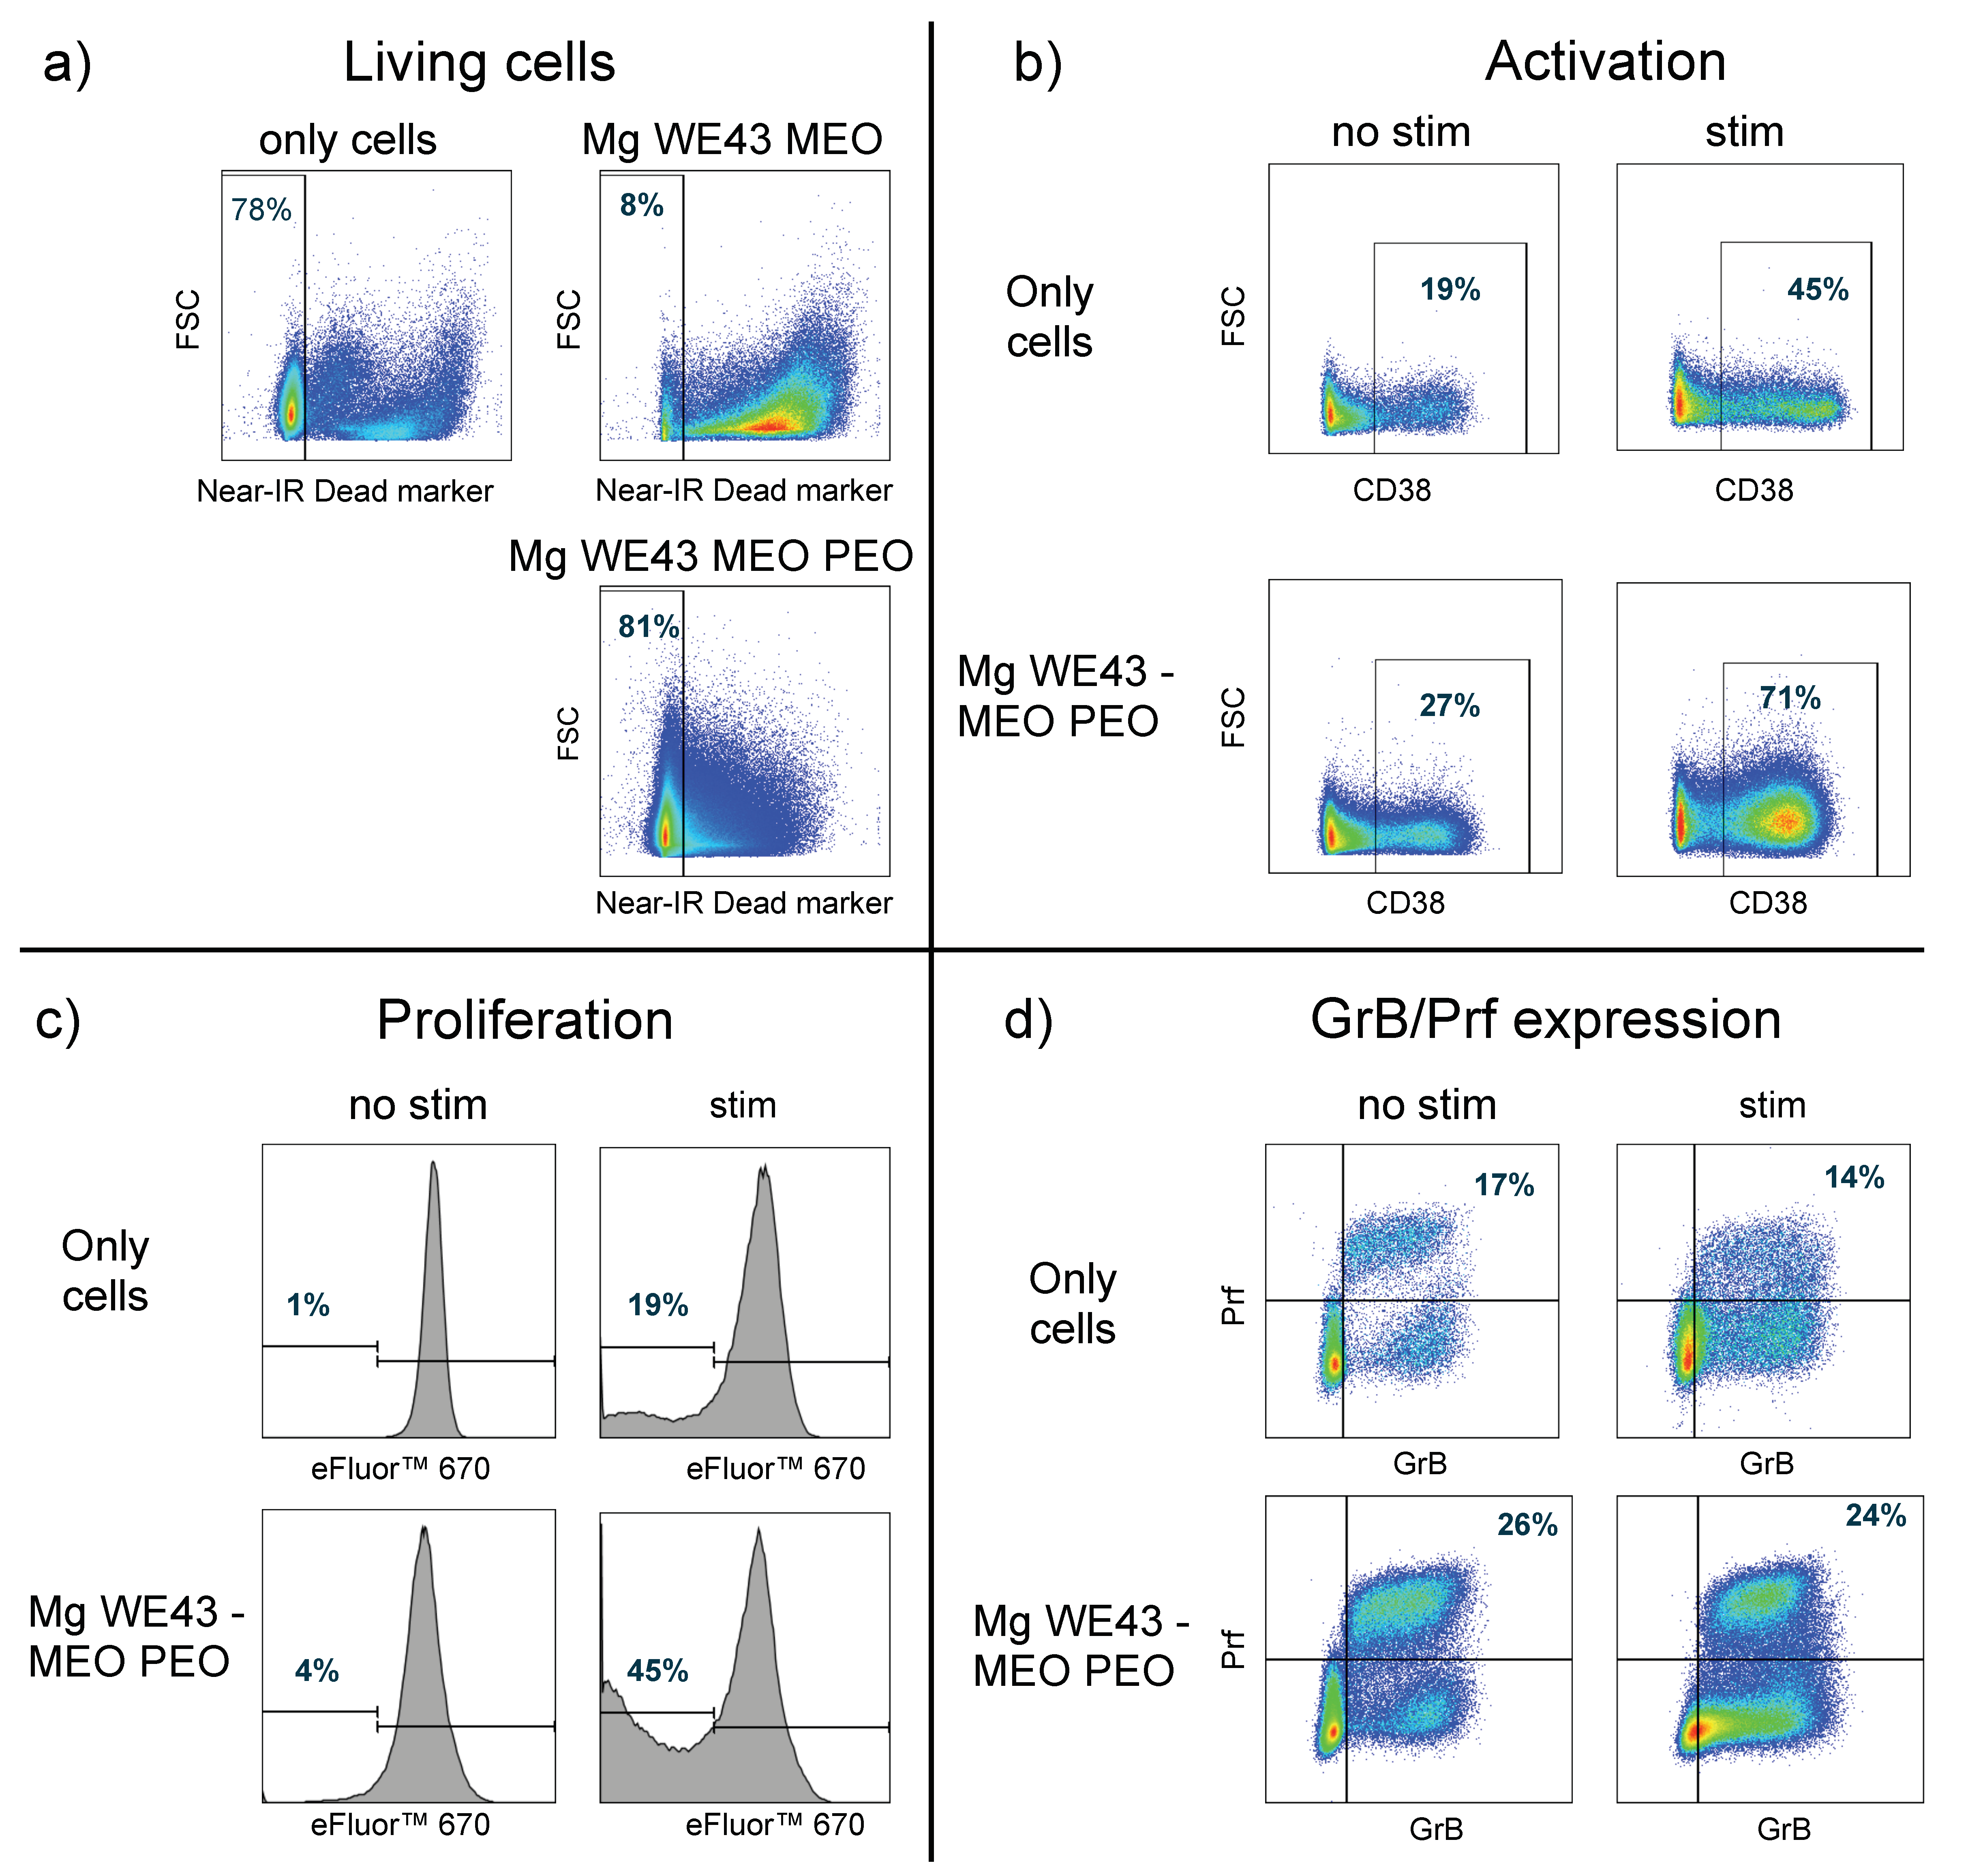
2.1.5. Effects on Primary Human Lymphocytes
3. Discussion
4. Materials and Methods
4.1. Preparation of Material Specimens
4.2. Assessment of Macro- and Microstructure
4.3. Immersion Test
4.4. Cell Culture
4.5. Reference Materials for the Cytocompatibility Assessment
4.6. Cytocompatibility Assessment
4.7. Assessment of Effects on Primary Human Lymphocytes
4.8. Statistical Analysis
5. Conclusions
Author Contributions
Funding
Acknowledgments
Conflicts of Interest
Abbreviations
| EDS | Energy dispersive X-ray spectroscopy |
| GrB | Granzyme B |
| HER | Hydrogen evolution rate |
| MEM | Minimum essential medium |
| PBR | Pilling-Bedworth ratio |
| PEO | Plasma electrolytic oxidation |
| Prf | Perforin |
| SEM | Scanning electron microscope |
References
- Staiger, M.P.; Pietak, A.M.; Huadmai, J.; Dias, G. Magnesium and its alloys as orthopedic biomaterials: A review. Biomaterials 2006, 27, 1728–1734. [Google Scholar] [CrossRef] [PubMed]
- Wang, J.; Tang, J.; Zhang, P.; Li, Y.; Wang, J.; Lai, Y.; Qin, L. Surface modification of magnesium alloys developed for bioabsorbable orthopedic implants: A general review. J. Biomed. Mater. Res. B Appl. Biomater. 2012, 100, 1691–1701. [Google Scholar] [CrossRef] [PubMed]
- Fischerauer, S.F.; Kraus, T.; Wu, X.; Tangl, S.; Sorantin, E.; Hanzi, A.C.; Loffler, J.F.; Uggowitzer, P.J.; Weinberg, A.M. In vivo degradation performance of micro-arc-oxidized magnesium implants: A micro-CT study in rats. Acta Biomater. 2013, 9, 5411–5420. [Google Scholar] [CrossRef] [PubMed]
- Guo, K.W. A Review of Magnesium/Magnesium Alloys Corrosion and its Protection. Recent Pat. Corros. Sci. 2010, 2, 13–21. [Google Scholar] [CrossRef] [Green Version]
- Mueller, W.D.; Lucia Nascimento, M.; Lorenzo de Mele, M.F. Critical discussion of the results from different corrosion studies of Mg and Mg alloys for biomaterial applications. Acta Biomater. 2010, 6, 1749–1755. [Google Scholar] [CrossRef]
- Song, G.; Atrens, A. Understanding Magnesium Corrosion. Adv. Eng. Mater. 2003, 5, 837–858. [Google Scholar] [CrossRef]
- Xin, Y.; Hu, T.; Chu, P.K. In vitro studies of biomedical magnesium alloys in a simulated physiological environment: A review. Acta Biomater. 2011, 7, 1452–1459. [Google Scholar] [CrossRef]
- Persaud-Sharma, D.; McGoron, A. Biodegradable Magnesium Alloys: A Review of Material Development and Applications. J. Biomim. Biomater. Tissue Eng. 2012, 12, 25–39. [Google Scholar] [CrossRef] [Green Version]
- Song, G.L.; Song, S.Z. A possible biodegradable magnesium implant material. Adv. Eng. Mater. 2007, 9, 298–302. [Google Scholar] [CrossRef]
- Gray, J.E.; Luan, B. Protective coatings on magnesium and its alloys—A critical review. J. Alloy. Compd. 2002, 336, 88–113. [Google Scholar] [CrossRef]
- Jung, O.; Smeets, R.; Porchetta, D.; Kopp, A.; Ptock, C.; Muller, U.; Heiland, M.; Schwade, M.; Behr, B.; Kroger, N.; et al. Optimized in vitro procedure for assessing the cytocompatibility of magnesium-based biomaterials. Acta Biomater. 2015, 23, 354–363. [Google Scholar] [CrossRef] [PubMed]
- Imwinkelried, T.; Beck, S.; Iizuka, T.; Schaller, B. Effect of a plasmaelectrolytic coating on the strength retention of in vivo and in vitro degraded magnesium implants. Acta Biomater. 2013, 9, 8643–8649. [Google Scholar] [CrossRef] [PubMed]
- Zhang, Z.Q.; Wang, L.; Zeng, M.Q.; Zeng, R.C.; Kannan, M.B.; Lin, C.G.; Zheng, Y.F. Biodegradation behavior of micro-arc oxidation coating on magnesium alloy-from a protein perspective. Bioact. Mater. 2020, 5, 398–409. [Google Scholar] [CrossRef] [PubMed]
- Tang, H.; Wang, M.K.; Zhu, B.; He, L. Growth Process and Dielectric Breakdown of Micro Arc Oxidation Coating on AZ31 Mg Alloy Pretreated by Alkali Treatment. Prot. Met. Phys. Chem. 2020, 56, 156–163. [Google Scholar] [CrossRef]
- Soliman, H.; Ahmed, M.K.; Elbadewy, R. Enhanced corrosion resistance of plasma electrolytic oxidation coatings prepared on Mg alloy ZX using nano-Al(2)O(3)and NaF incorporated electrolyte. Surf. Eng. 2020, 1–7. [Google Scholar] [CrossRef]
- Hartjen, P.; Hoffmann, A.; Henningsen, A.; Barbeck, M.; Kopp, A.; Kluwe, L.; Precht, C.; Quatela, O.; Gaudin, R.; Heiland, M.; et al. Plasma Electrolytic Oxidation of Titanium Implant Surfaces: Microgroove-Structures Improve Cellular Adhesion and Viability. Vivo 2018, 32, 241–247. [Google Scholar] [CrossRef]
- Zumdick, N.A.; Jauer, L.; Kersting, L.C.; Kutz, T.N.; Schleifenbaum, J.H.; Zander, D. Additive manufactured WE43 magnesium: A comparative study of the microstructure and mechanical properties with those of powder extruded and as-cast WE43. Mater. Charact. 2019, 147, 384–397. [Google Scholar] [CrossRef]
- Goldstein, J.; Newbury, D.E.; Joy, D.C.; Lyman, C.E.; Echlin, P.; Lifshin, E.; Sawyer, L.; Michel, J.R. Scanning Electron Microscopy and X-Ray Microanalysis; Springer: New York, NY, USA, 2003. [Google Scholar]
- Esmaily, M.; Zeng, Z.; Mortazavi, A.N.; Gullino, A.; Choudhary, S.; Derra, T.; Benn, F.; D’Elia, F.; Muther, M.; Thomas, S.; et al. A detailed microstructural and corrosion analysis of magnesium alloy WE43 manufactured by selective laser melting. Addit. Manuf. 2020, 35, 101321. [Google Scholar] [CrossRef]
- Arrabal, R.; Matykina, E.; Viejo, F.; Skeldon, P.; Thompson, G.E. Corrosion resistance of WE43 and AZ91D magnesium alloys with phosphate PEO coatings. Corros. Sci. 2008, 50, 1744–1752. [Google Scholar] [CrossRef]
- Coy, A.E.; Viejo, F.; Skeldon, P.; Thompson, G.E. Susceptibility of rare-earth-magnesium alloys to micro-galvanic corrosion. Corros. Sci. 2010, 52, 3896–3906. [Google Scholar] [CrossRef]
- Chen, Y.J.; Xu, Z.G.; Smith, C.; Sankar, J. Recent advances on the development of magnesium alloys for biodegradable implants. Acta Biomater. 2014, 10, 4561–4573. [Google Scholar] [CrossRef] [PubMed]
- Yerokhin, A.L.; Nie, X.; Leyland, A.; Matthews, A.; Dowey, S.J. Plasma electrolysis for surface engineering. Surf. Coat. Technol. 1999, 122, 73–93. [Google Scholar] [CrossRef]
- Darband, G.B.; Aliofkhazraei, M.; Hamghalam, P.; Valizade, N. Plasma electrolytic oxidation of magnesium and its alloys: Mechanism, properties and applications. J. Magnes. Alloy. 2017, 5, 74–132. [Google Scholar] [CrossRef]
- Duan, H.P.; Yan, C.W.; Wang, F.H. Effect of electrolyte additives on performance of plasma electrolytic oxidation films formed on magnesium alloy AZ91D. Electrochim. Acta 2007, 52, 3785–3793. [Google Scholar] [CrossRef]
- Liang, J.; Srinivasan, P.B.; Blawert, C.; Stormer, M.; Dietzel, W. Electrochemical corrosion behaviour of plasma electrolytic oxidation coatings on AM50 magnesium alloy formed in silicate and phosphate based electrolytes. Electrochim. Acta 2009, 54, 3842–3850. [Google Scholar] [CrossRef]
- Hussein, R.; Northwood, D.; Nie, X. Processing-Microstructure relationships in the plasma electrolytic oxidation (PEO) coating of a magnesium alloy. Mater. Sci. Appl. 2014, 5, 124–139. [Google Scholar] [CrossRef] [Green Version]
- Leleu, S.; Rives, B.; Bour, J.; Causse, N.; Pebere, N. On the stability of the oxides film formed on a magnesium alloy containing rare-earth elements. Electrochim. Acta 2018, 290, 586–594. [Google Scholar] [CrossRef] [Green Version]
- Xu, C.H.; Gao, W. Pilling-Bedworth ratio for oxidation of alloys. Mater. Res. Innov. 2000, 3, 231–235. [Google Scholar] [CrossRef]
- Ocal, E.B.; Esen, Z.; Aydinol, K.; Dericioglu, A.F. Comparison of the short and long-term degradation behaviors of as-cast pure Mg, AZ91 and WE43 alloys. Mater. Chem. Phys. 2020, 241, 122350. [Google Scholar] [CrossRef]
- Ascencio, M.; Pekguleryuz, M.; Omanovic, S. An investigation of the corrosion mechanisms of WE43 Mg alloy in a modified simulated body fluid solution: The influence of immersion time. Corros. Sci. 2014, 87, 489–503. [Google Scholar] [CrossRef]
- Jung, O.; Porchetta, D.; Schroeder, M.L.; Klein, M.; Wegner, N.; Walther, F.; Feyerabend, F.; Barbeck, M.; Kopp, A. In Vivo Simulation of Magnesium Degradability Using a New Fluid Dynamic Bench Testing Approach. Int. J. Mol. Sci. 2019, 20, 4859. [Google Scholar] [CrossRef] [PubMed] [Green Version]
- Jung, O.; Smeets, R.; Hartjen, P.; Schnettler, R.; Feyerabend, F.; Klein, M.; Wegner, N.; Walther, F.; Stangier, D.; Henningsen, A.; et al. Improved In Vitro Test Procedure for Full Assessment of the Cytocompatibility of Degradable Magnesium Based on ISO 10993-5/-12. Int. J. Mol. Sci. 2019, 20, 255. [Google Scholar] [CrossRef] [PubMed] [Green Version]
- Ahmadi, P.; Hartjen, P.; Kohsar, M.; Kummer, S.; Schmiedel, S.; Bockmann, J.H.; Fathi, A.; Huber, S.; Haag, F.; zur Wiesch, J.S. Defining the CD39/CD73 Axis in SARS-CoV-2 Infection: The CD73(-)Phenotype Identifies Polyfunctional Cytotoxic Lymphocytes. Cells 2020, 9, 1750. [Google Scholar] [CrossRef] [PubMed]


Publisher’s Note: MDPI stays neutral with regard to jurisdictional claims in published maps and institutional affiliations. |
© 2021 by the authors. Licensee MDPI, Basel, Switzerland. This article is an open access article distributed under the terms and conditions of the Creative Commons Attribution (CC BY) license (http://creativecommons.org/licenses/by/4.0/).
Share and Cite
Hartjen, P.; Wegner, N.; Ahmadi, P.; Matthies, L.; Nada, O.; Fuest, S.; Yan, M.; Knipfer, C.; Gosau, M.; Walther, F.; et al. Toward Tailoring the Degradation Rate of Magnesium-Based Biomaterials for Various Medical Applications: Assessing Corrosion, Cytocompatibility and Immunological Effects. Int. J. Mol. Sci. 2021, 22, 971. https://0-doi-org.brum.beds.ac.uk/10.3390/ijms22020971
Hartjen P, Wegner N, Ahmadi P, Matthies L, Nada O, Fuest S, Yan M, Knipfer C, Gosau M, Walther F, et al. Toward Tailoring the Degradation Rate of Magnesium-Based Biomaterials for Various Medical Applications: Assessing Corrosion, Cytocompatibility and Immunological Effects. International Journal of Molecular Sciences. 2021; 22(2):971. https://0-doi-org.brum.beds.ac.uk/10.3390/ijms22020971
Chicago/Turabian StyleHartjen, Philip, Nils Wegner, Parimah Ahmadi, Levi Matthies, Ola Nada, Sandra Fuest, Ming Yan, Christian Knipfer, Martin Gosau, Frank Walther, and et al. 2021. "Toward Tailoring the Degradation Rate of Magnesium-Based Biomaterials for Various Medical Applications: Assessing Corrosion, Cytocompatibility and Immunological Effects" International Journal of Molecular Sciences 22, no. 2: 971. https://0-doi-org.brum.beds.ac.uk/10.3390/ijms22020971