Article

Substrate-Dependent Trans-Stimulation of Organic Cation Transporter 2 Activity

1
CHU Rennes, Inserm, EHESP, Irset (Institut de Recherche en Santé, Environnement et Travail)-UMR_S 1085, University Rennes, 35043 Rennes, France
2
Inserm, EHESP, Irset (Institut de Recherche en Santé, Environnement et Travail)-UMR_S 1085, University Rennes, 35043 Rennes, France
*
Author to whom correspondence should be addressed.
Int. J. Mol. Sci. 2021, 22(23), 12926; https://0-doi-org.brum.beds.ac.uk/10.3390/ijms222312926
Submission received: 31 October 2021 / Revised: 23 November 2021 / Accepted: 24 November 2021 / Published: 29 November 2021

Abstract

:
The search of substrates for solute carriers (SLCs) constitutes a major issue, owing notably to the role played by some SLCs, such as the renal electrogenic organic cation transporter (OCT) 2 (SLC22A2), in pharmacokinetics, drug–drug interactions and drug toxicity. For this purpose, substrates have been proposed to be identified by their cis-inhibition and trans-stimulation properties towards transporter activity. To get insights on the sensitivity of this approach for identifying SLC substrates, 15 various exogenous and endogenous OCT2 substrates were analysed in the present study, using 4-(4-(dimethylamino)styryl)-N-methylpyridinium iodide (DiASP) as a fluorescent OCT2 tracer substrate. All OCT2 substrates cis-inhibited DiASP uptake in OCT2-overexpressing HEK293 cells, with IC50 values ranging from 0.24 µM (for ipratropium) to 2.39 mM (for dopamine). By contrast, only 4/15 substrates, i.e., acetylcholine, agmatine, choline and metformin, trans-stimulated DiASP uptake, with a full suppression of the trans-stimulating effect of metformin by the reference OCT2 inhibitor amitriptyline. An analysis of molecular descriptors next indicated that trans-stimulating OCT2 substrates exhibit lower molecular weight, volume, polarizability and lipophilicity than non-trans-stimulating counterparts. Overall, these data indicated a rather low sensitivity (26.7%) of the trans-stimulation assay for identifying OCT2 substrates, and caution with respect to the use of such assay may therefore be considered.

1. Introduction

Solute carriers (SLCs) constitute a superfamily of more than 450 membrane proteins, acting as transporters of a large spectrum of molecules, including nutrients, metabolites, xenobiotics (such as phytochemicals), small molecule drugs and metal ions [1]. SLCs handling drugs are notably expressed by detoxifying organs, such as the liver and the kidney, and have been shown to play a major role in pharmacokinetics, drug–drug interactions and drug toxicity [2,3,4]. Some of them have consequently to be regulatorily studied during the pharmaceutical development of new molecular entities [5]. This is notably the case for organic cation transporter (OCT) 2 (SLC22A2), a uniporter expressed at the basolateral pole of proximal tubular cells [4]. The human OCT2 gene is located on chromosome 6 and contains 11 exons [6]. OCT2 has 12 predicted membrane-spanning domains and exhibits three glycosylated sites [7]. The driving force for this bi-directional facilitative diffusional transporter is believed to be the electrochemical gradient of the transported compounds [8]. Consequently, in cells with normal inside-negative membrane potential, cation uptake is energetically preferred, whereas cation efflux can only occur in depolarized cells or in the presence of a large outwardly directed cation gradient that overcomes the membrane potential [9]. In the kidney, OCT2 mediates uptake of cationic drugs such as metformin and cimetidine from the blood into renal cells [10]; it functions in conjunction with multidrug and toxin extrusion protein (MATE) 1 (SLC47A1) and MATE2-K (SLC47A2), which expel OCT2 substrates into the urine at the apical pole of proximal cells [11]. In this way, OCT2 plays a major role in the renal secretion of cationic drugs [12]; it is also involved in the nephrotoxicity of cisplatin [13]. For anionic drugs, organic anion transporter (OAT) 1 (SLC22A6) and OAT3 (SLC22A8), also expressed at the basolateral pole of renal proximal cells, such as OCT2, are implicated in their renal secretion [14].
Identification of substrates for SLCs constitutes an important issue. This is commonly addressed through comparing uptake of putative substrates in cellular models overexpressing or not the transporter of interest, in the absence or presence of specific transporter inhibitors [15]. Such studies require precisely quantifying the cellular accumulation of investigated compounds, through scintillation counting (if the compound is radiolabelled) or through sensitive liquid chromatography-tandem mass spectrometry (LC-MS/MS). Such approaches can however be extremely consuming either in time, money, or both, and may be difficult to integrate into high throughput processes. The use of trans-stimulation assays may represent an interesting alternative for the identification of SLC substrates, without the need of measuring intracellular concentrations of the candidate substrates [16]. In these assays, substrates are commonly identified by their ability to (1) cis-inhibit accumulation of a reference tracer substrate of the SLC and (2) trans-stimulate uptake or efflux of the reference tracer substrate [17,18,19]. The trans-stimulation process is based on the hypothesis that the rate constant for reorientation of a loaded carrier is faster than that for the empty, in particular for uniporters such as OCT2 [7]. For uptake trans-stimulation assays, SLC-overexpressing cells are first loaded with the candidate substrate; after washing, they are secondly incubated with the reference tracer substrate, in a candidate substrate-free medium. If the loaded compound is a substrate, it is postulated to be reverse-transported outside the cells by the SLC during the second phase of the assay. This results in a conformational switch of the transporter toward a state receptive to the handling of substrates at the extracellular face of the membrane, which finally causes an increased uptake of the tracer substrate [20]. For efflux trans-stimulation assays, SLC-overexpressing cells are first incubated with the reference tracer substrate, and, after washing, they are next incubated with the candidate substrate in reference tracer-free medium; the SLC-mediated transport of the candidate compound inside the cells is finally associated with an increased SLC-mediated efflux of the tracer substrate [21,22]. A variant of the efflux trans-stimulation assay corresponds to competitive counterflow, in which the reference tracer substrate remains present at the same concentration in the extracellular medium during both the loading and the efflux phases [23,24]. Finally, it is noteworthy that trans-stimulation assays can be performed with SLC-expressing membrane vesicles instead of cells [25]. Thus, rat renal membrane vesicles have been used for investigating trans-stimulation of peptide transporter (PEPT) activity by β-lactam antibiotics [26] and for studying basolateral OCT activity [27]. trans-stimulation assays have also been performed in situ at the mouse blood–brain barrier [28] and blood–retinal barrier [29].
Trans-stimulation assays have permitted to characterize substrates of various SLCs handling drugs, including OCT1 (SLC22A1) [30], OCT2 [16], MATE1 [22], OAT1 [18,31], organic anion transporting polypeptide (OATP) 2B1 (SLCO2B1) [24], sodium-taurocholate cotransporting polypeptide (NTCP/SLC10A1) [32] and an influx drug/proton antiporter expressed at the blood-brain barrier [33]. The sensitivity of trans-stimulation assays, i.e., their ability to correctly identify substrates, remains however yet rather elusive, although likely important to consider for the use of trans-stimulations assays. To get insights about this point in the present study, we have analysed the trans-stimulating properties of 15 structurally-diverse substrates of OCT2 towards transport of the OCT2 tracer substrate 4-(4-(dimethylamino)styryl)-N-methylpyridinium iodide (DiASP) in OCT2-overexpressing HEK293 cells. Our data demonstrated that, if all OCT2 substrates (n = 15) displayed cis-inhibitory effects towards OCT2 activity, only a few of them (n = 4) trans-stimulated OCT2-mediated uptake of DiASP, suggesting, therefore, a rather low sensitivity of this trans-stimulation assay for the identification of OCT2 substrates.

2. Results

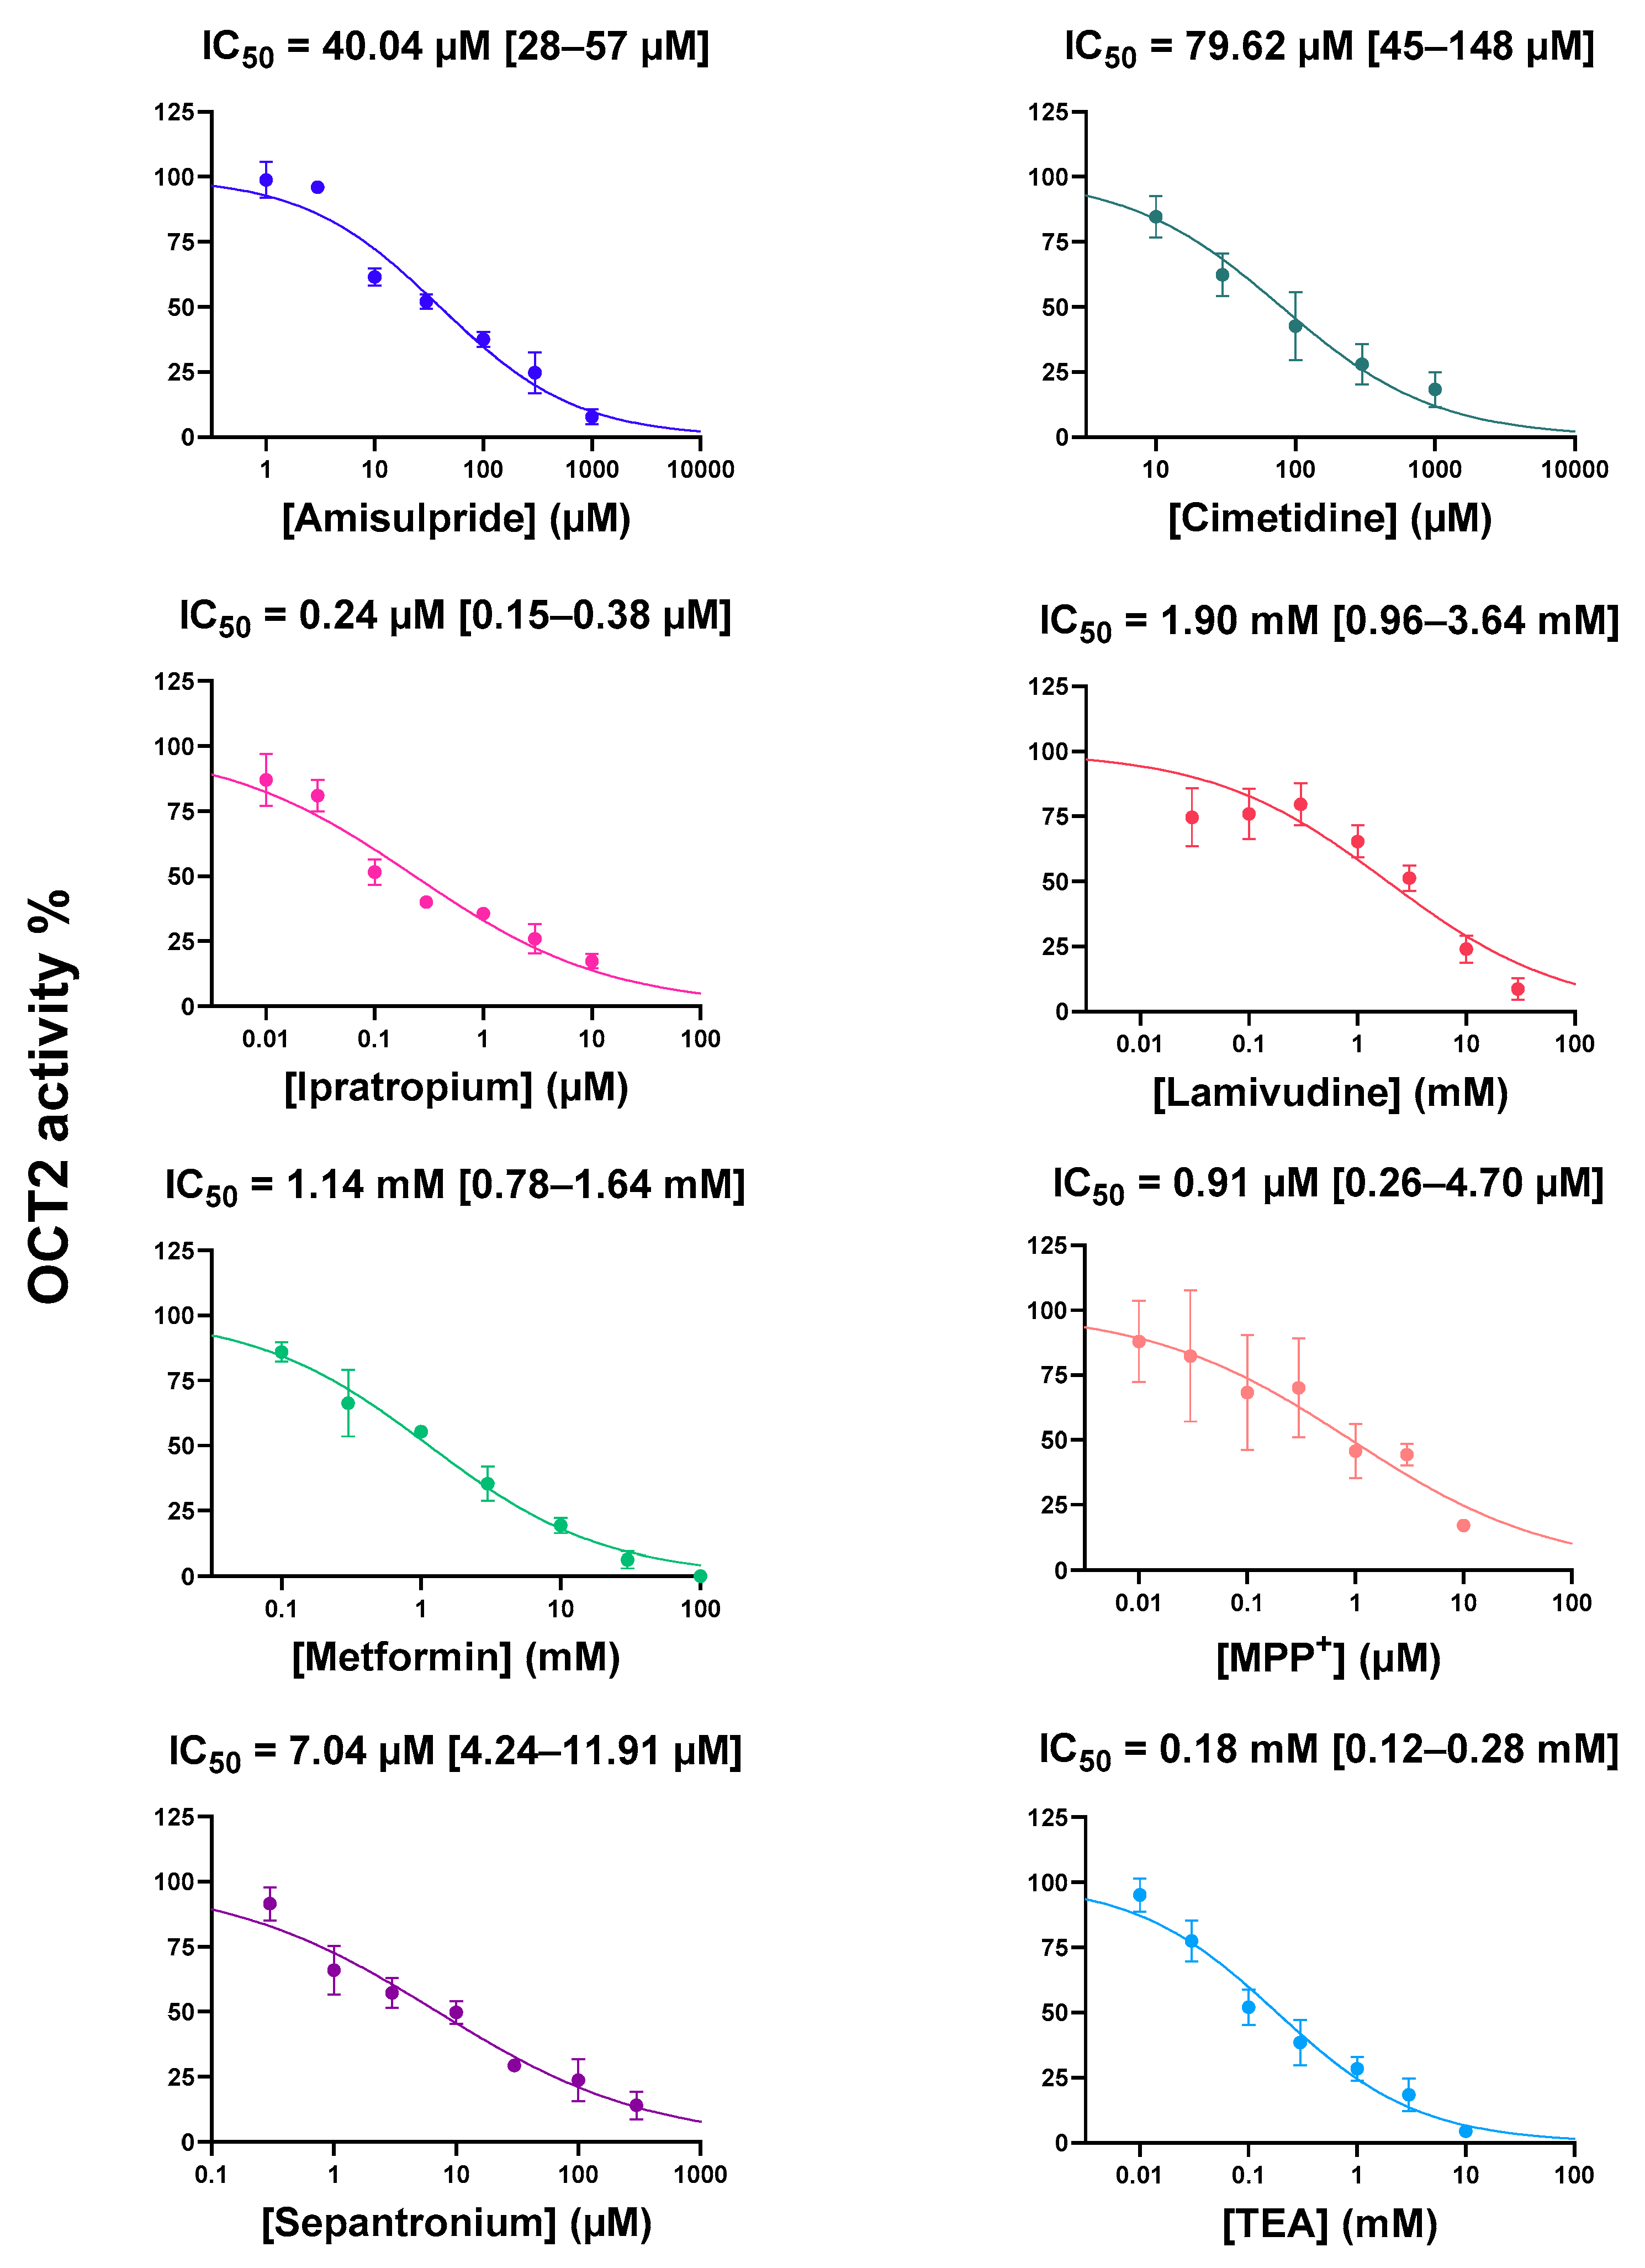
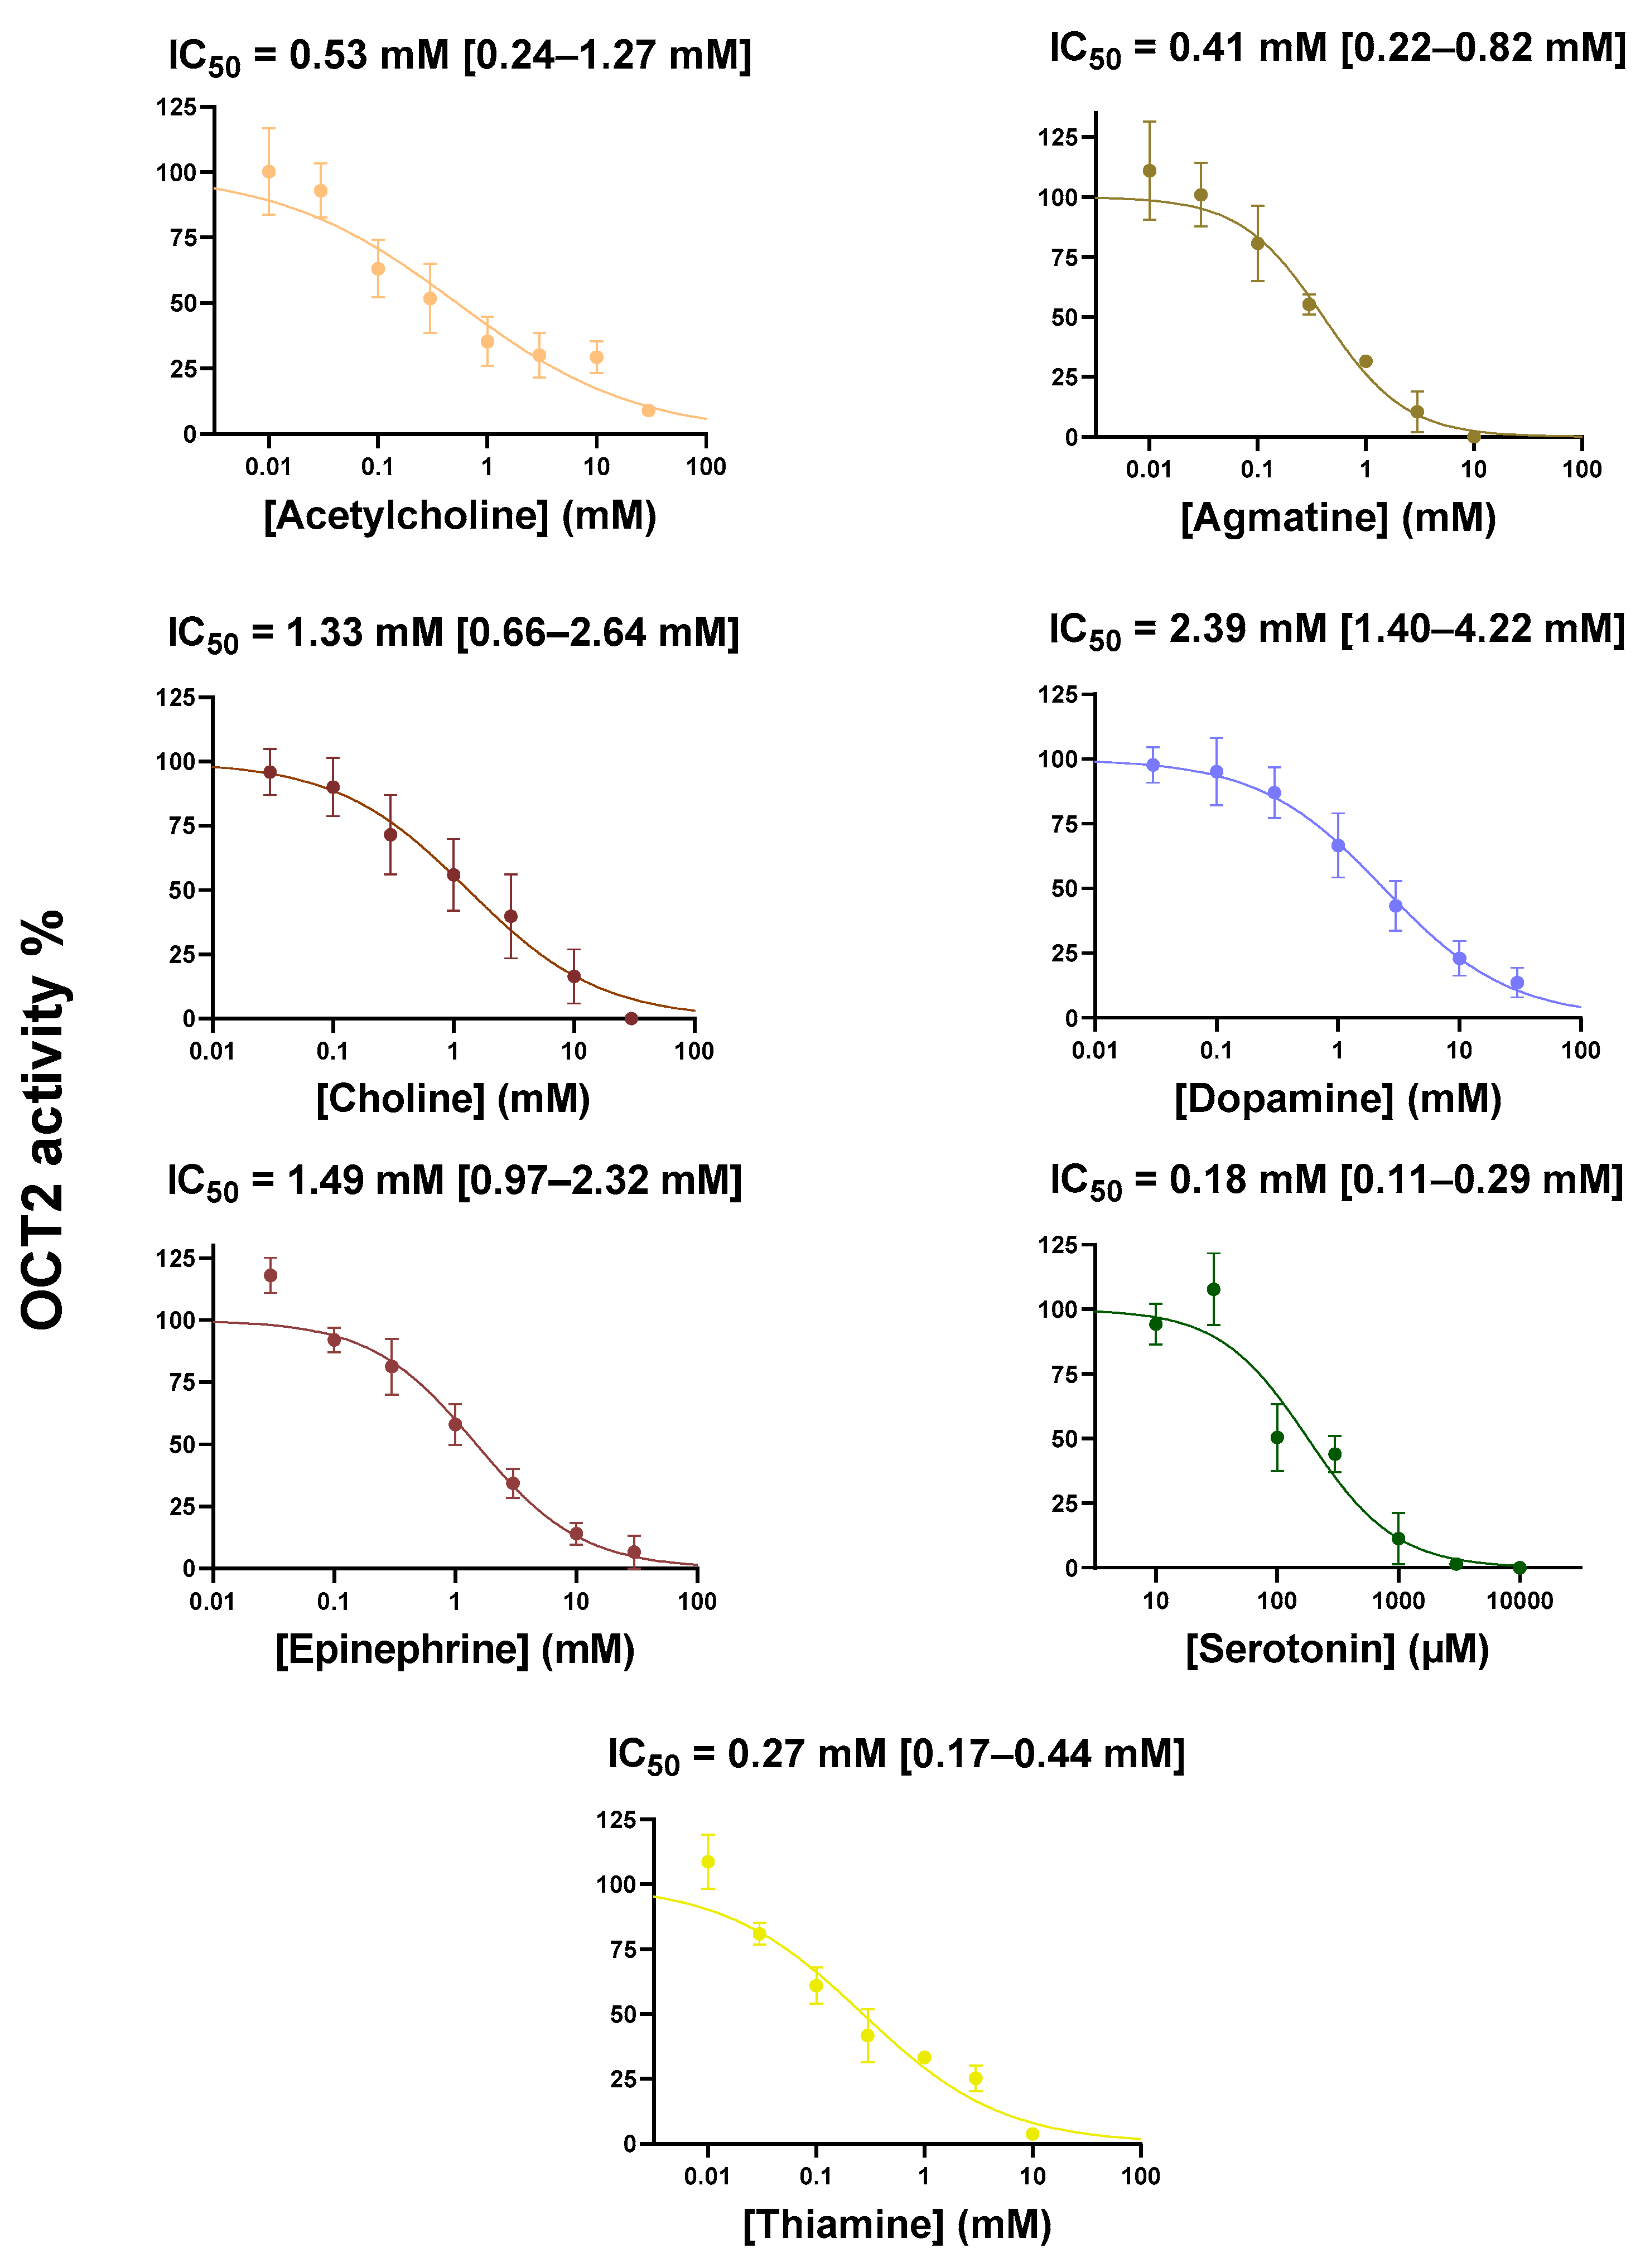
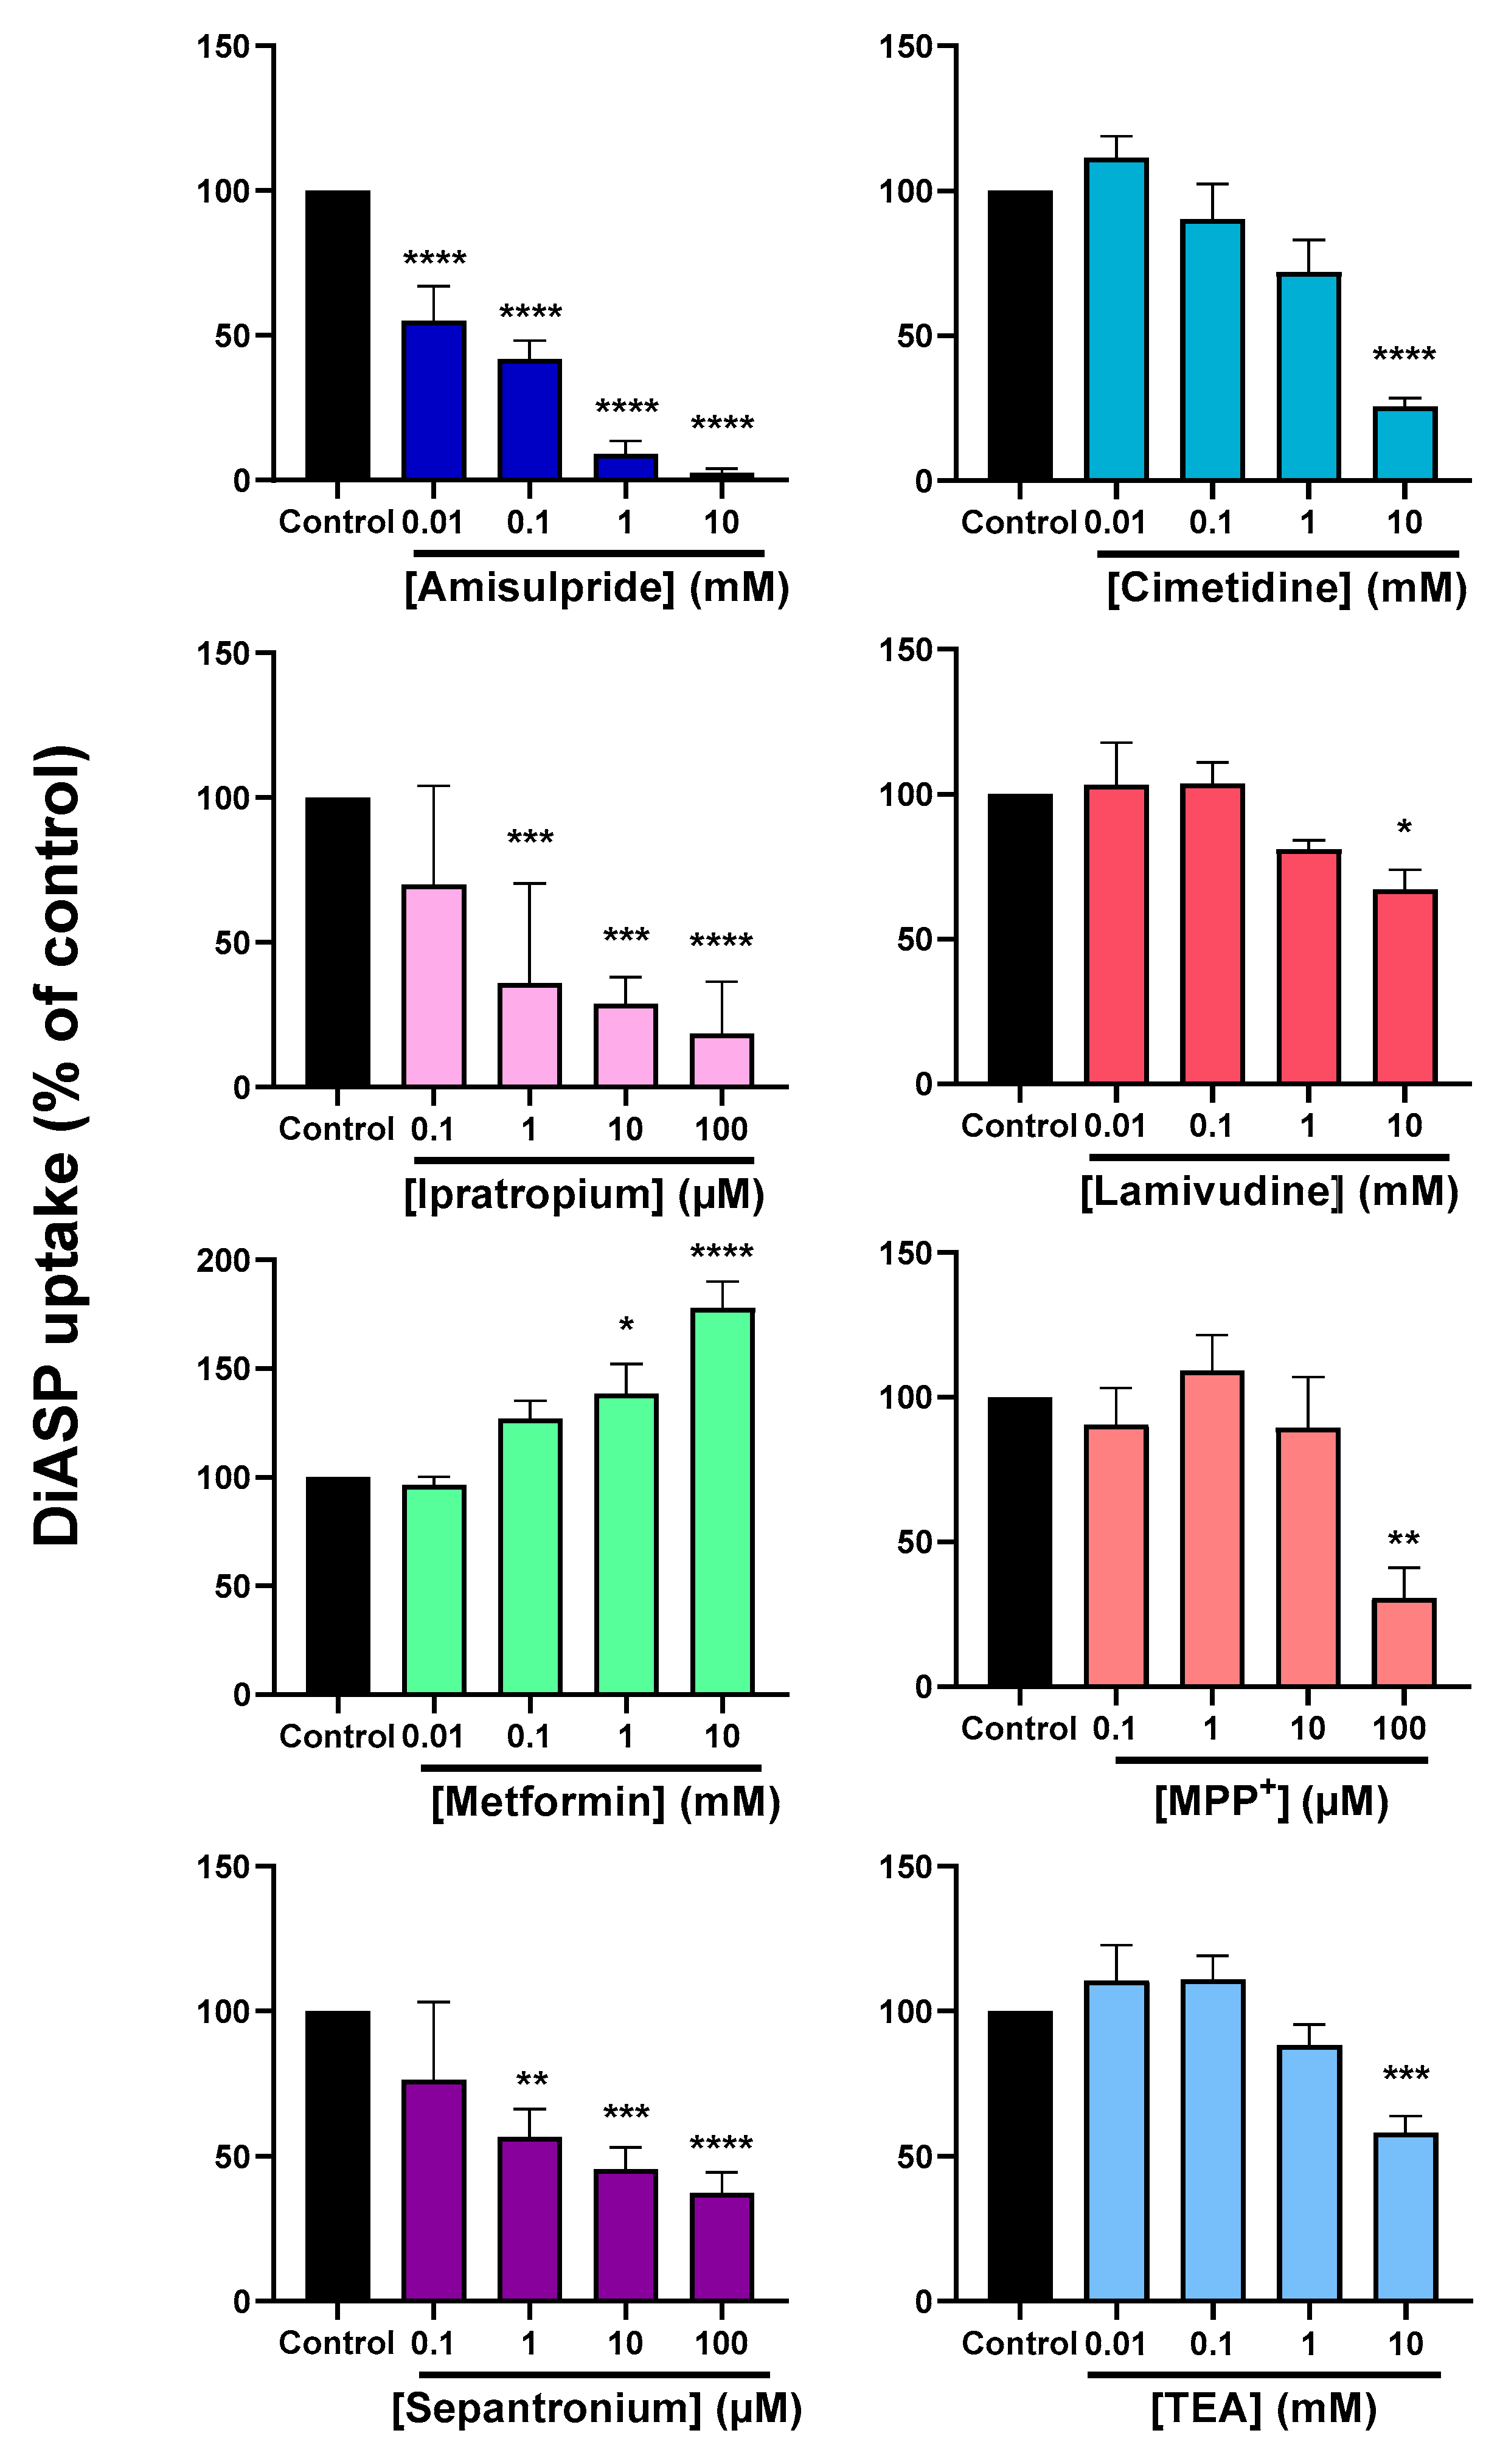
2.1. Cis-Inhibition of OCT2 Activity by OCT2 Substrates

Fifteen known OCT2 substrates, corresponding to laboratory/chemical reagents (n = 2), drugs (n = 6) and endogenous compounds/metabolites (n = 7) and whose affinities/Michaelis constant (KM) values for OCT2 are listed in Table 1, were investigated for their potential cis-inhibitory effects towards OCT2-mediated transport of DiASP. Beforehand, these OCT2 substrates have been demonstrated to not significantly impair DiASP-related fluorescence (Figure S1). As indicated in Figure 1, all exogenous substrates for OCT2, i.e., tetra-ethylammonium (TEA), 1-methyl-4-phenyl pyridinium (MPP+) and drugs, were found to cis-inhibit OCT2 activity, with half-maximal inhibitory concentrations (IC50) widely ranging from 0.24 µM (for ipratropium) to 1.90 mM (for lamivudine). Similarly, endogenous OCT2 substrates cis-inhibited OCT2 activity, with IC50 ranging from 0.18 mM (for serotonin) to 2.39 mM (for dopamine) (Figure 2). These IC50 values did not statistically differ between endogenous and exogenous substrates (p = 0.21). They were significantly positively correlated with KM values for OCT2 (Figure 3), indicating that IC50 values were related to affinities of substrates for OCT2.

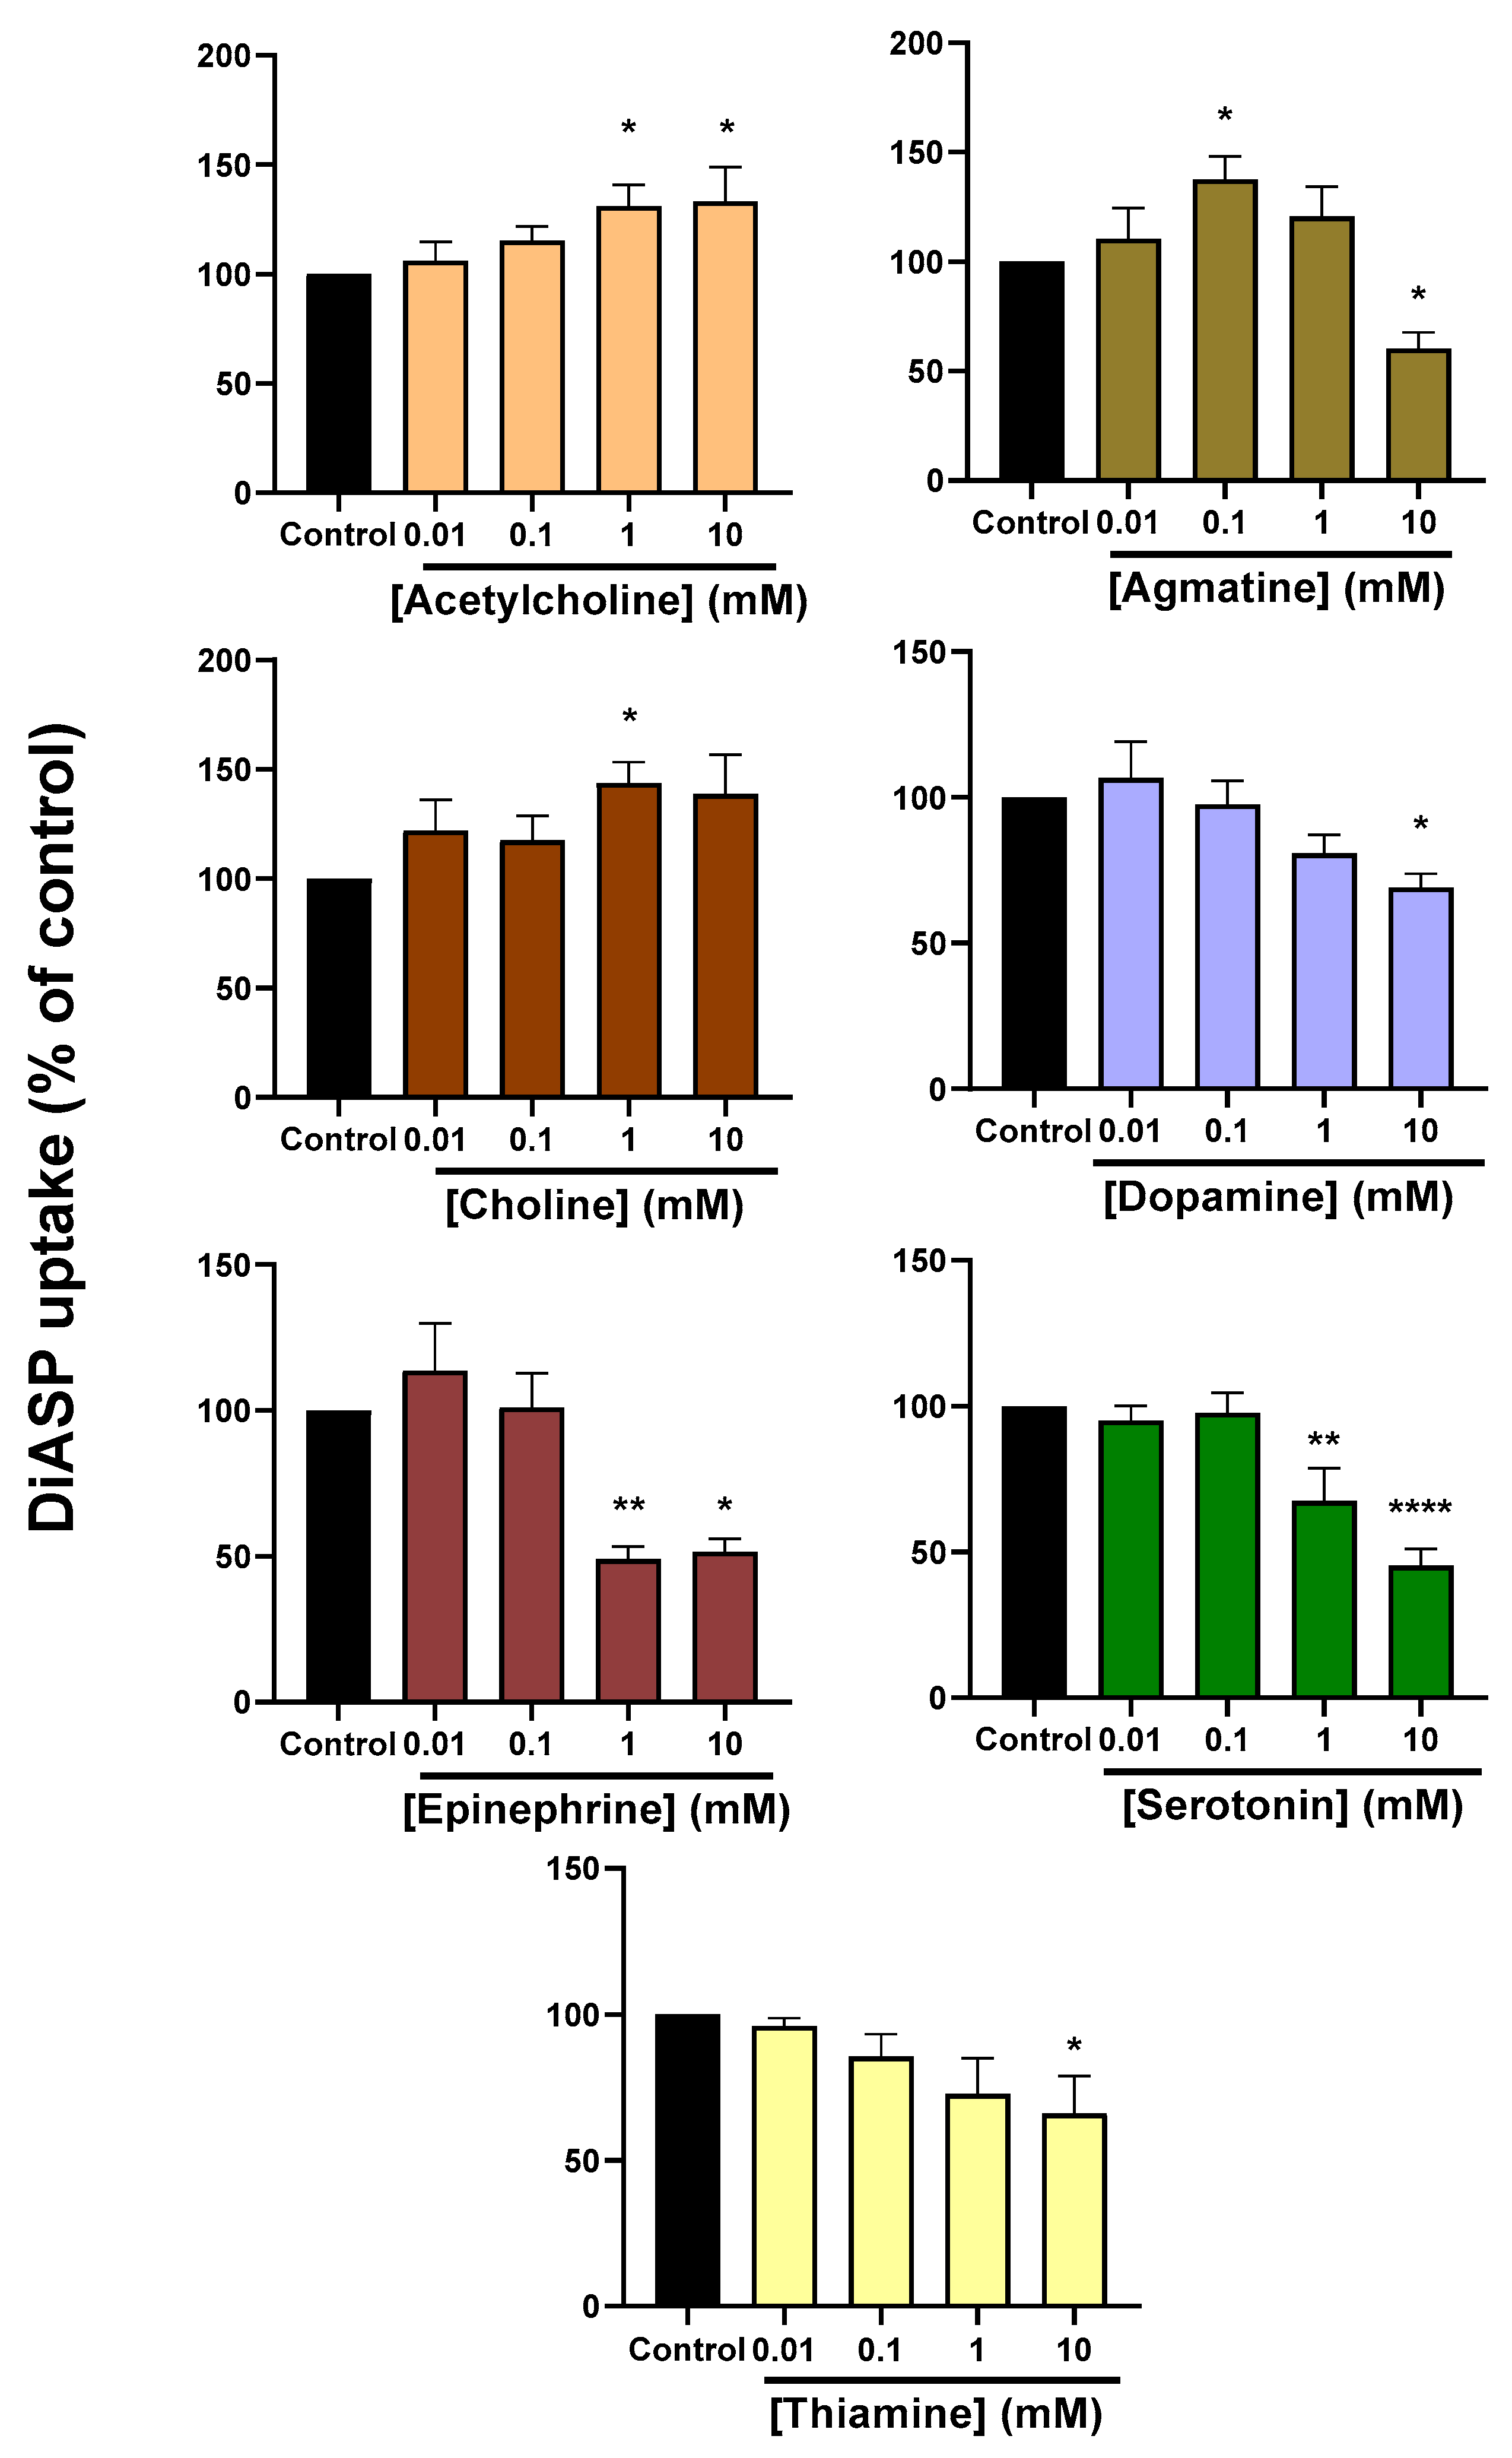
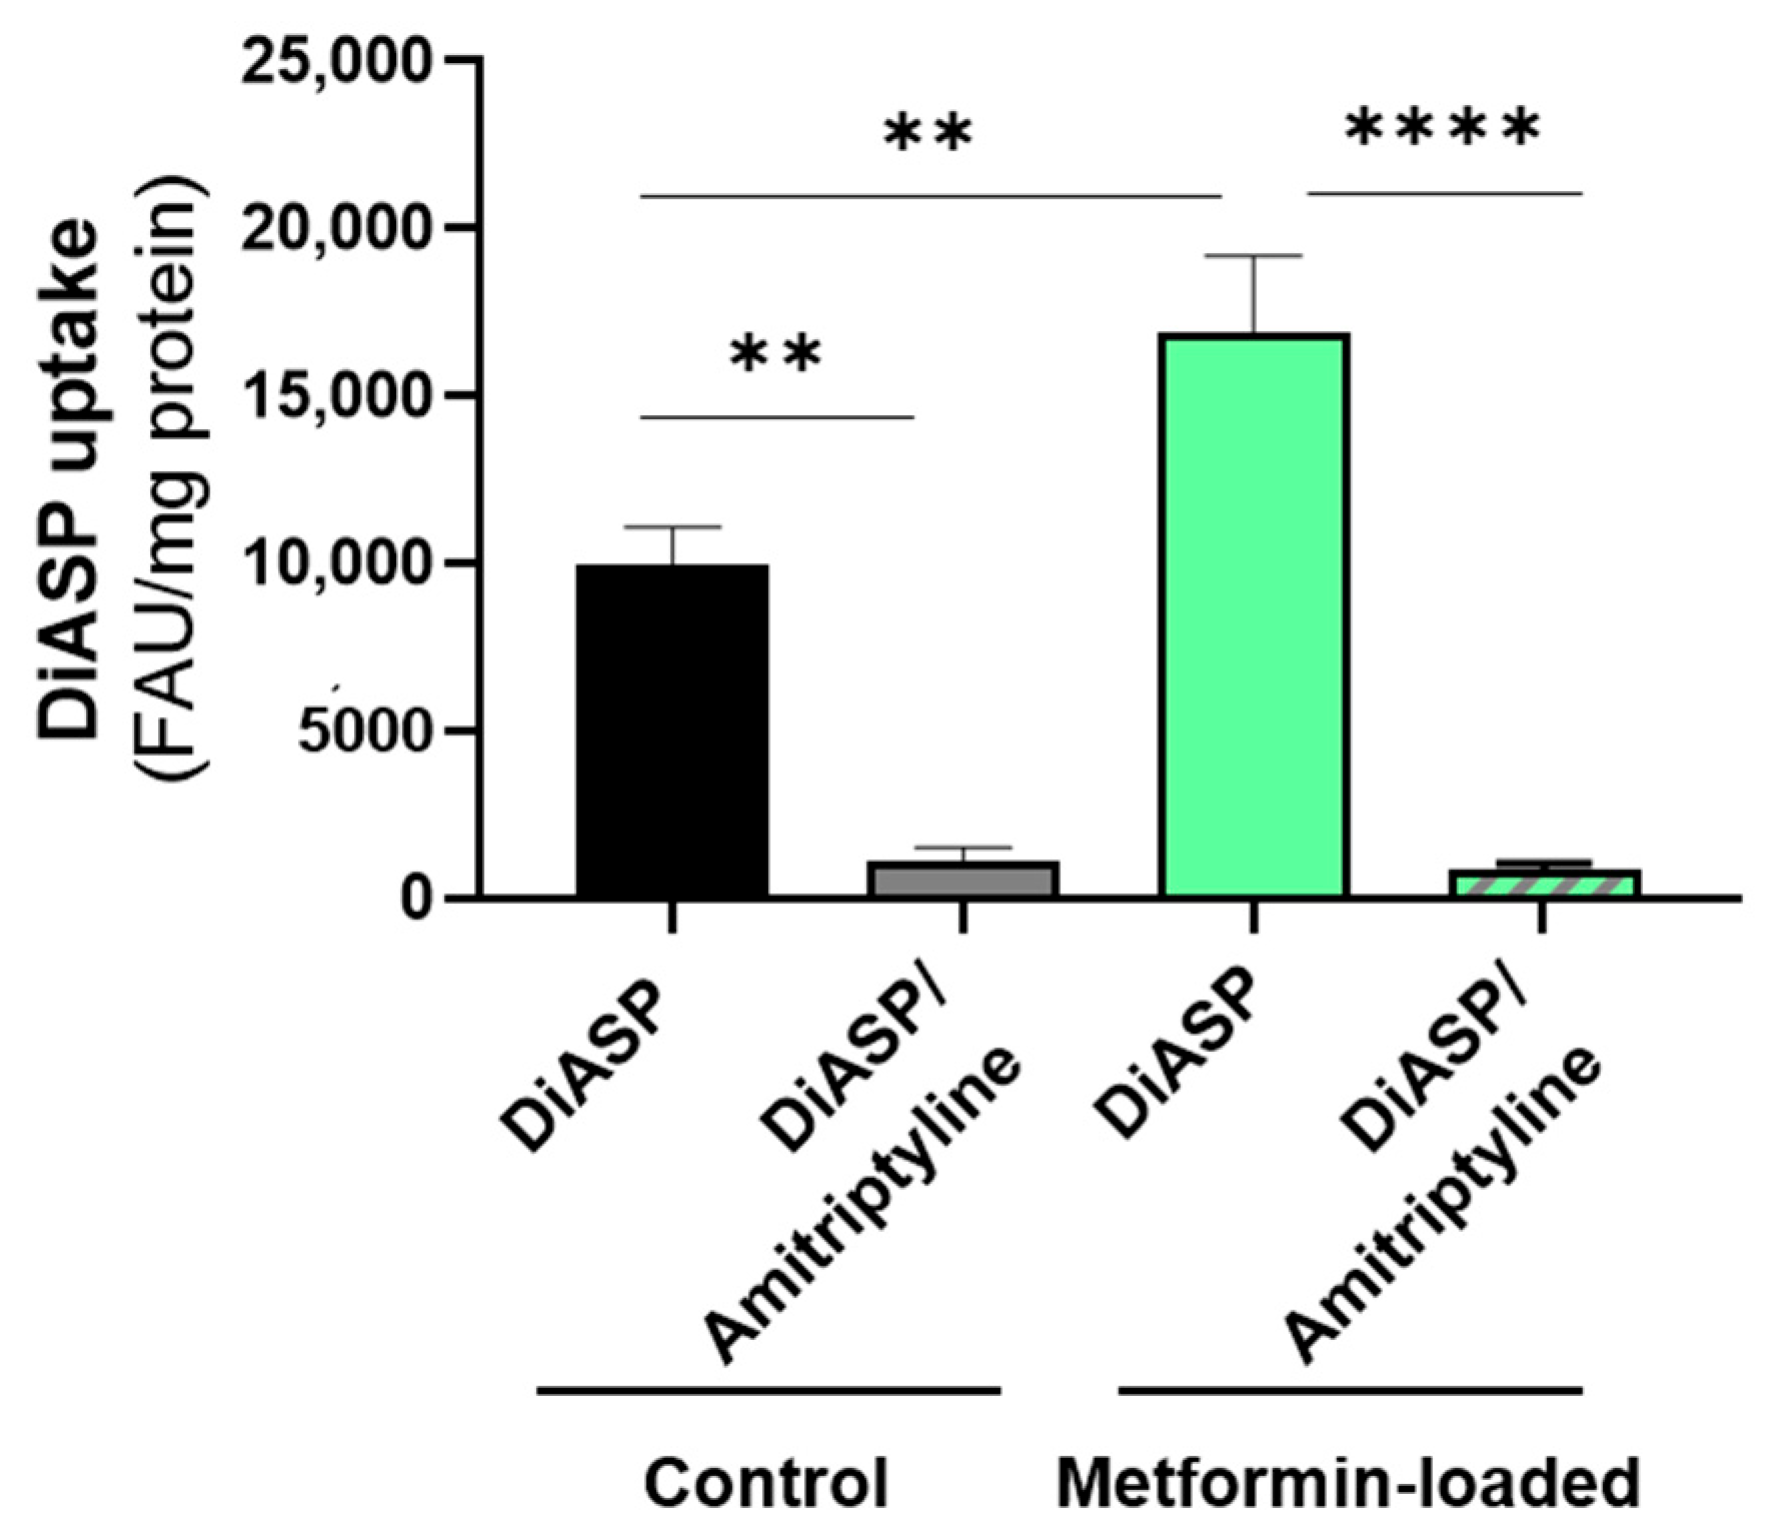
2.2. Trans-Stimulation of OCT2 Activity by OCT2 Substrates

Uptake trans-stimulation assays were performed as schematically depicted in Figure 4. HEK-OCT2 cells were first exposed to different increasing concentrations of OCT2 substrates, usually in the 0.01–10 mM range, except for ipratropium, MPP+ and sepantronium, for which lower concentrations were used (0.1–100 µM), owing to their high affinities (low KM and IC50 values) for OCT2 (Table 1 and Figure 1); after washing, cells were secondly exposed to the tracer substrate DiASP. Among exogenous substrates of OCT2, only metformin was found to trans-stimulate uptake of DiASP, when used at 1 or 10 mM (Figure 5). By contrast, the other drugs trans-inhibited DiASP uptake; however, the lowest trans-inhibiting concentrations differed according to OCT2 substrates, ranging from 1 µM (for ipratopium and sepantronium) to 10 mM (for TEA, cimetidine and lamivudine) (Figure 5). For endogenous substrates of OCT2, acetylcholine (1 and 10 µM), agmatine (0.1 mM) and choline (1 mM) were found to significantly trans-stimulate OCT2 activity (Figure 6). Agmatine, however, also trans-inhibited OCT2 activity when used at 10 mM (Figure 6), indicating that this compound may act as a bifunctional modulator of OCT2 activity, i.e., it may act as a trans-stimulator or a trans-inhibitor according to the used concentration. Other endogenous compounds were demonstrated to trans-inhibit OCT2-mediated uptake of DiASP, with the lowest trans-inhibitory concentrations ranging from 1 mM (for epinephrine and serotonin) to 10 mM (for dopamine and thiamine) (Figure 6).
For further investigating whether the trans-stimulating effects of OCT2 substrates towards OCT2 activity were formally linked to OCT2, we next analysed the effects of the reference OCT2 inhibitor amitriptyline [50] towards metformin-mediated trans-stimulation of DiASP uptake in HEK-OCT2 cells. As indicated in Figure 7, amitriptyline fully suppressed metformin-stimulated uptake of DiASP; uptake of DiASP in HEK-OCT2 cells not preloaded with metformin was also abolished. Moreover, metformin failed to significantly trans-stimulate DiASP uptake in control HEK-MOCK cells (data not shown).

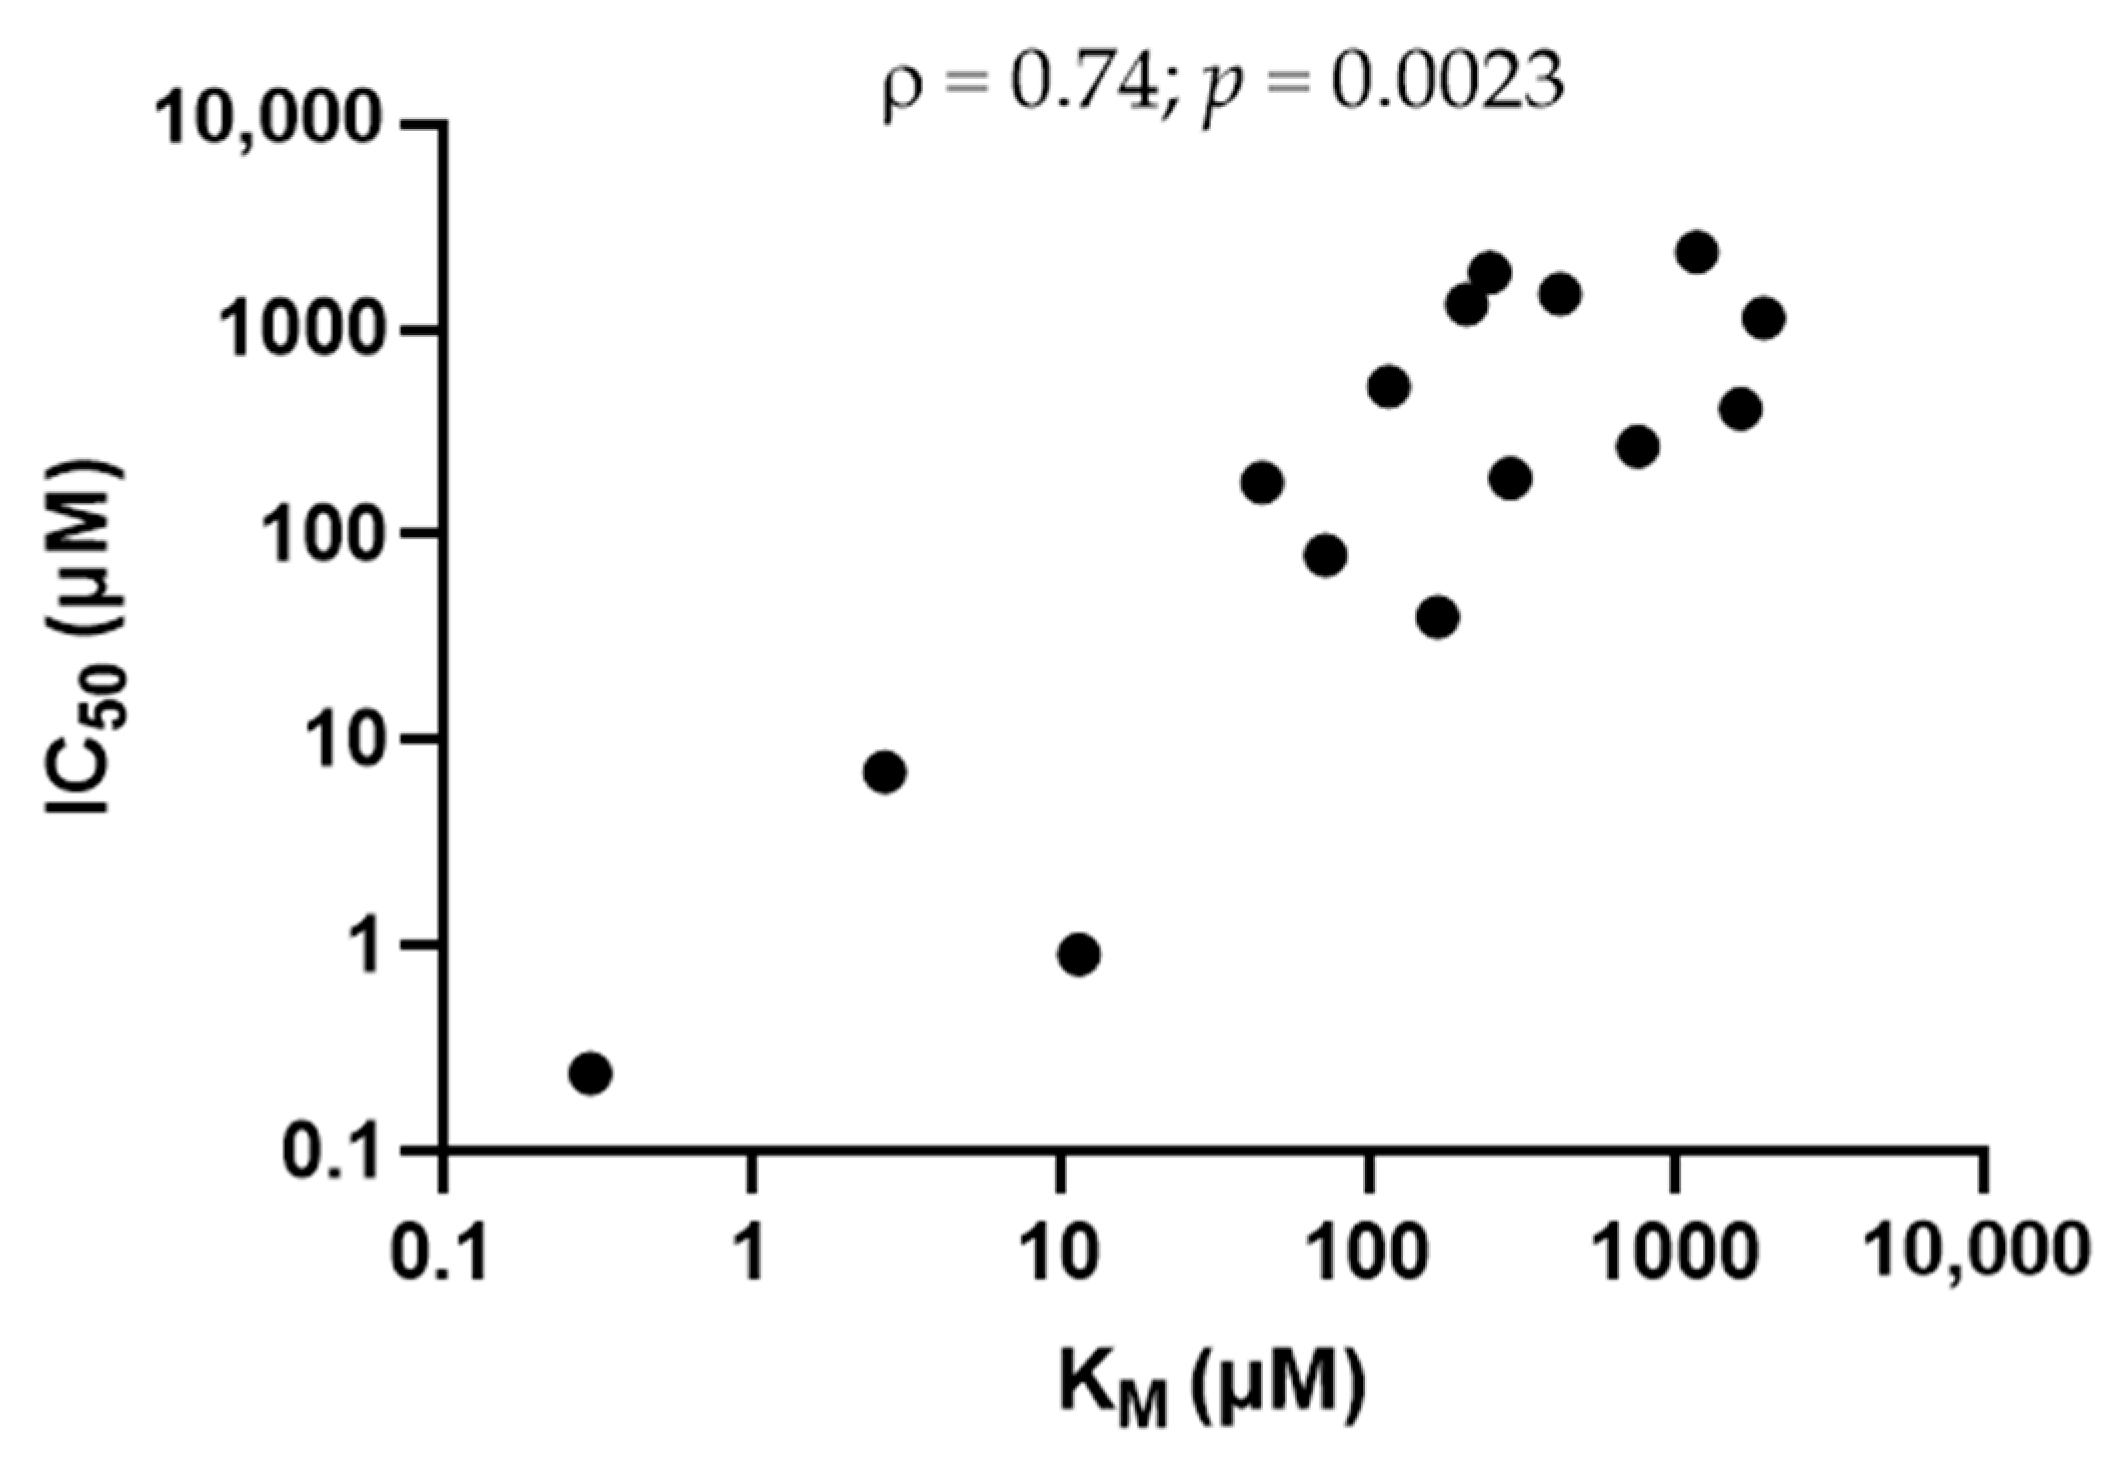
2.3. Physico-Chemical Parameters Associated with Trans-Stimulation of OCT2 Activity by OCT2 Substrates

Among fifteen known OCT2 substrates, only four, i.e., acetylcholine, agmatine, choline and metformin, were found to significantly trans-stimulate OCT2-mediated DiASP uptake in HEK-OCT2 cells, which indicates a rather low sensitivity (26.7%) of the trans-stimulation assay for correctly identifying OCT2 substrates. To determine whether trans-stimulating OCT2 substrates may exhibit specific physico-chemical features comparatively to non-trans-stimulating counterparts, we compared molecular descriptor values as well as those of KM and IC50 (affinity parameters for OCT2), between trans-stimulating OCT2 substrates (n = 4) and non-trans-stimulating ones (n = 11). As shown in Table 2, 30/82 molecular descriptors exhibit significant differences between trans-stimulating and non-trans-stimulating OCT2 substrates. Analysis of these descriptors/parameters indicated that trans-stimulating compounds exhibit notably lower lipophilicity (ALOGP and MLOGP), volume (Mv, Sv, Vx and VvdwMG), molecular weight (MW), aromatic bond number (nAB) and polarizability (Mp and Sp) when compared to non-trans-stimulating ones; they additionally show increased first ionisation potential (Mi) (Table 2). With respect to affinity parameters (KM and IC50), they do not statistically discriminate between trans-stimulating and non-trans-stimulating OCT2 substrates (data not shown), even if a trend to higher KM values and thus lower affinities is observed for trans-stimulating compounds versus non-trans-stimulating ones (p = 0.056).

3. Discussion

Trans-stimulation assays have been presumed to represent an easy and rapid way for the identification of drugs substrates for SLCs, notably allowing to discard the use of radiolabelled molecules or the fastidious development of LC-MS/MS methods for molecule dosages. We however reported a rather low sensitivity (26.7%) of trans-stimulation assays for the identification of OCT2 substrates in the present study, using a set of OCT2 substrates (n = 15) displaying various chemical structures and affinities for OCT2. Indeed, only 4/15 OCT2 substrates were found to both cis-inhibit and trans-stimulate OCT2 activity, which is usually required for considering them as substrates. The other 11/15 OCT2 substrates both cis- and trans-inhibited OCT2 activity, confirming thus that they also interacted with OCT2, but without evidence for being transported. Indeed, even if the fact that these non-trans-stimulating compounds exert trans-inhibitory effects may be considered as indirect proof of their putative transport into cells, this cellular uptake does not formally necessarily be linked to OCT2 and may notably reflect passive transport across the plasma membrane [51]. The fact that these non-trans-stimulating substrates display notable lipophilicity (ALOGP and MLOGP) may agree with this hypothesis.
Even if restricted to only 4/15 compounds, trans-stimulatory effects are most likely related to OCT2 activity, notably for metformin, because (i) the reference OCT2 inhibitor amitriptyline fully abrogated metformin-mediated trans-stimulation of DiASP in HEK-OCT2 cells and (ii) the antidiabetic drug trans-stimulated DiASP uptake in HEK-OCT2 cells, but not in control HEK-MOCK cells. Therefore, these data clearly support the concept of trans-stimulation for OCT2, even if it can be not extended to all substrates. In this context, choline and metformin have already been shown to trans-stimulate OCT2 activity using radiolabelled MPP+ as a tracer substrate [23], thus confirming that these compounds are likely robust trans-stimulating agents of OCT2 activity. In the same way, agmatine has been demonstrated to trans-stimulate the activity of OCT3 (SLC22A3) [16], thus suggesting that this compound is a global trans-stimulator of OCTs. Furthermore, OCT2 can mediate cellular efflux of acetylcholine [34], which is fully consistent with the OCT2 trans-stimulatory effects of this neurotransmitter; indeed, enhanced uptake of the tracer substrate in trans-stimulation assays is presumed to be triggered by efflux of the trans-stimulating agent and the resulting conformational switch of the loaded transporter, resulting in an extracellular-facing binding site of the transporter [7].
The reason for which a majority of OCT2 substrates (11/15) failed to trans-stimulate OCT2-mediated uptake of DiASP activity remains to be determined. This is particularly intriguing for TEA, which has been previously found to trans-stimulate OCT2 activity, with however the use of radiolabelled MPP+ or TEA as tracer reference substrates, indeed of that of DiASP [20,23,52]. The nature of the reference tracer substrate used in trans-stimulation assays may therefore be hypothesized to contribute to the discrepancy with respect to TEA trans-stimulating effects towards OCT2 activity, as already been demonstrated for OCT2 cis-inhibition studies, in which the inhibitory potential of various drugs depends on the nature of the probe substrate [53]. Moreover, MPP+ and cimetidine failed to trans-stimulate, not only OCT2-mediated DiASP uptake but also that of MPP+ [20], confirming therefore that these OCT2 substrates exhibit rather poor trans-stimulation potential in uptake studies. This lack of trans-stimulation caused by these compounds and the other non-trans-stimulating compounds is likely not due to the use of inappropriate concentrations of them in trans-stimulation assays. Indeed, a large range of concentrations has been tested for each compound, including high concentrations being at least fourfold, and often more than tenfold greater than IC50 values, and thus in the range of minimal concentrations usually recommended in trans-stimulation assays [22,54].
Low-affinity substrates of OCT2 have been hypothesized to have greater trans-stimulating potential when compared to high-affinity substrates, due to their higher rates of dissociation from OCT2 [20]. Indeed, the rate-limiting step in OCT2-mediated transport may be the dissociation of the substrate from the transporter, rather than differences in conformational change of the transport protein associated with the translocation of structurally distinct substrates [7]. However, neither KM values nor IC50 were found to statistically discriminate between trans-stimulating and non-trans-stimulating OCT2 substrates in the present study, even if a trend exists for KM values. In particular, if the 4 trans-stimulating compounds display rather high KM values (in the 117–3171 µM range), non-trans-stimulating substrates such as dopamine or thiamine also exhibit similar high KM values, i.e., 932–1400 µM for dopamine and 750 µM for thiamine (Table 1). Taken together, these data do not highlight affinity as a major discriminating factor between trans-stimulating or non-trans-stimulating OCT2 substrates. By contrast, various molecular descriptors were found to be significantly associated with a trans-stimulating activity of OCT2 substrates. Trans-stimulating OCT2 substrates thus appear to exhibit lower molecular weight, volume, polarizability and lipophilicity than non-trans-stimulating counterparts. The parameter lipophilicity likely deserves special attention, because it can be hypothesized that non-trans-stimulating compounds, which are more lipophilic than trans-stimulating counterparts, may at least partly cross back the plasma membrane by passive diffusion after their loading, without mobilizing OCT2 in a major way and therefore without triggering the conformational switch of the transporter required for the trans-stimulation process. Moreover, the resulting extracellular concentrations of passive diffusion-based transport for these non-trans-stimulating substrates may rapidly rise to levels sufficient for inhibiting OCT2 activity; this may explain the observed trans-inhibitory effects of these compounds when they are loaded at high concentrations. This hypothesis is likely supported by the fact that the OAT3 substrate estrone-sulfate has been found to trans-inhibit OAT3 activity, likely due to competition with the tracer substrate for re-entry at the cis-side [55]. Such a re-entry process may also contribute to the biphasic effect of agmatine, with trans-stimulation of OCT2 activity for a low loading concentration and trans-inhibition at higher loading concentration, possibly due to the fact that effluxed agmatine reached extracellular levels allowing competition with DiASP for OCT2-mediated entry into cells. As an alternative to competition for re-entry, trans-inhibition may be due to binding to intracellular regulatory sites of OCT2 by trans-inhibiting agents, knowing that OCT2 substrates are thought to bind to multiple non-overlapping sites on OCT2 [7]. Finally, side-specificity of the transport as well different affinities of extracellular and intracellular binding sites of OCT2 for drugs may also be considered for putatively explaining the lack of trans-stimulation effect of 11/15 substrates. The possible existence of multiple drug binding sites on OCT2 with variable affinities may argue in favour of this hypothesis [9]. Additional studies, notably molecular docking analyses, may help to better understand why some OCT2 substrates fail to trans-stimulate OCT2-mediated DiASP transport.
The low level of sensitivity of OCT2 activity trans-stimulation assays for the identification of substrates, i.e., the notable number of false negatives does not argue in favour of the general use of such assays performed in the experimental conditions described in the present study. Overall, this also highlights the rather complexity of the trans-stimulation process, however already applied to the study of SLCs handling glucose or amino acids [56,57]. However, it remains noteworthy that trans-stimulation was demonstrated to be well-operating for certain OCT2 substrates such as metformin, with a fluorescence dye as a tracer substrate. This last point has to be underlined, since the use of fluorochromes in trans-stimulation studies may be applicable to high throughput studies, as already described for cis-inhibition analyses of transporters [58]. Further studies are likely required to search improved experimental conditions for trans-stimulation assays, including the development of efflux trans-stimulation or competitive counterflow approaches, in order to enhance their sensitivity for identifying substrates, notably for organic cation transporters. The specificity of these trans-stimulation assays, i.e., the rate of false positives would be complementary important to investigate; comparison of the sensitivities of trans-stimulation assays based on fluorescent tracer substrates with those using radiolabelled tracer substrates or tracers investigated by LC-MS/MS would be also worthy of interest.
In summary, 15 various OCT2 substrates were found to all cis-inhibited OCT2-mediated uptake of the fluorescent dye DiASP, but only a few of them (4/15), including the reference substrate metformin, trans-stimulated it. Caution has therefore likely to be considered when using such trans-stimulation assays for the identification of drug substrates for SLCs such as OCT2.

4. Materials and Methods

4.1. Chemicals

The exogenous OCT2 substrates amisulpride, cimetidine, ipratropium, lamivudine, metformin, MPP+, TEA and sepantronium (also known as YM155), as well as the endogenous OCT2 substrates acetylcholine, agmatine, choline, dopamine, epinephrine, serotonin and thiamine and the OCT2 inhibitor amitriptyline were provided by Sigma-Aldrich (Saint Quentin Fallavier, France). The chemical structures of the OCT2 substrates are indicated in Figure S2. The fluorescent dye DiASP, used here as a reference tracer substrate for OCT2 [59,60], was purchased from Invitrogen (Carlsbad, CA, USA).

4.2. Cell Culture

Human embryonic kidney HEK293 cells overexpressing human OCT2 (HEK-OCT2 cells) and corresponding control HEK-MOCK cells were provided by Vectalys (Labege, France) and have been previously functionally characterized [61]. They were cultured in Dulbecco’s modified Eagle medium (DMEM) (Life Technologies, Carlsbad, CA, USA), supplemented with 10% (vol/vol) fetal calf serum, 10 IU/mL penicillin, 10 μg/mL streptomycin, 1% non-essential amino acids, and 1 μg/mL insulin, as already reported [52].

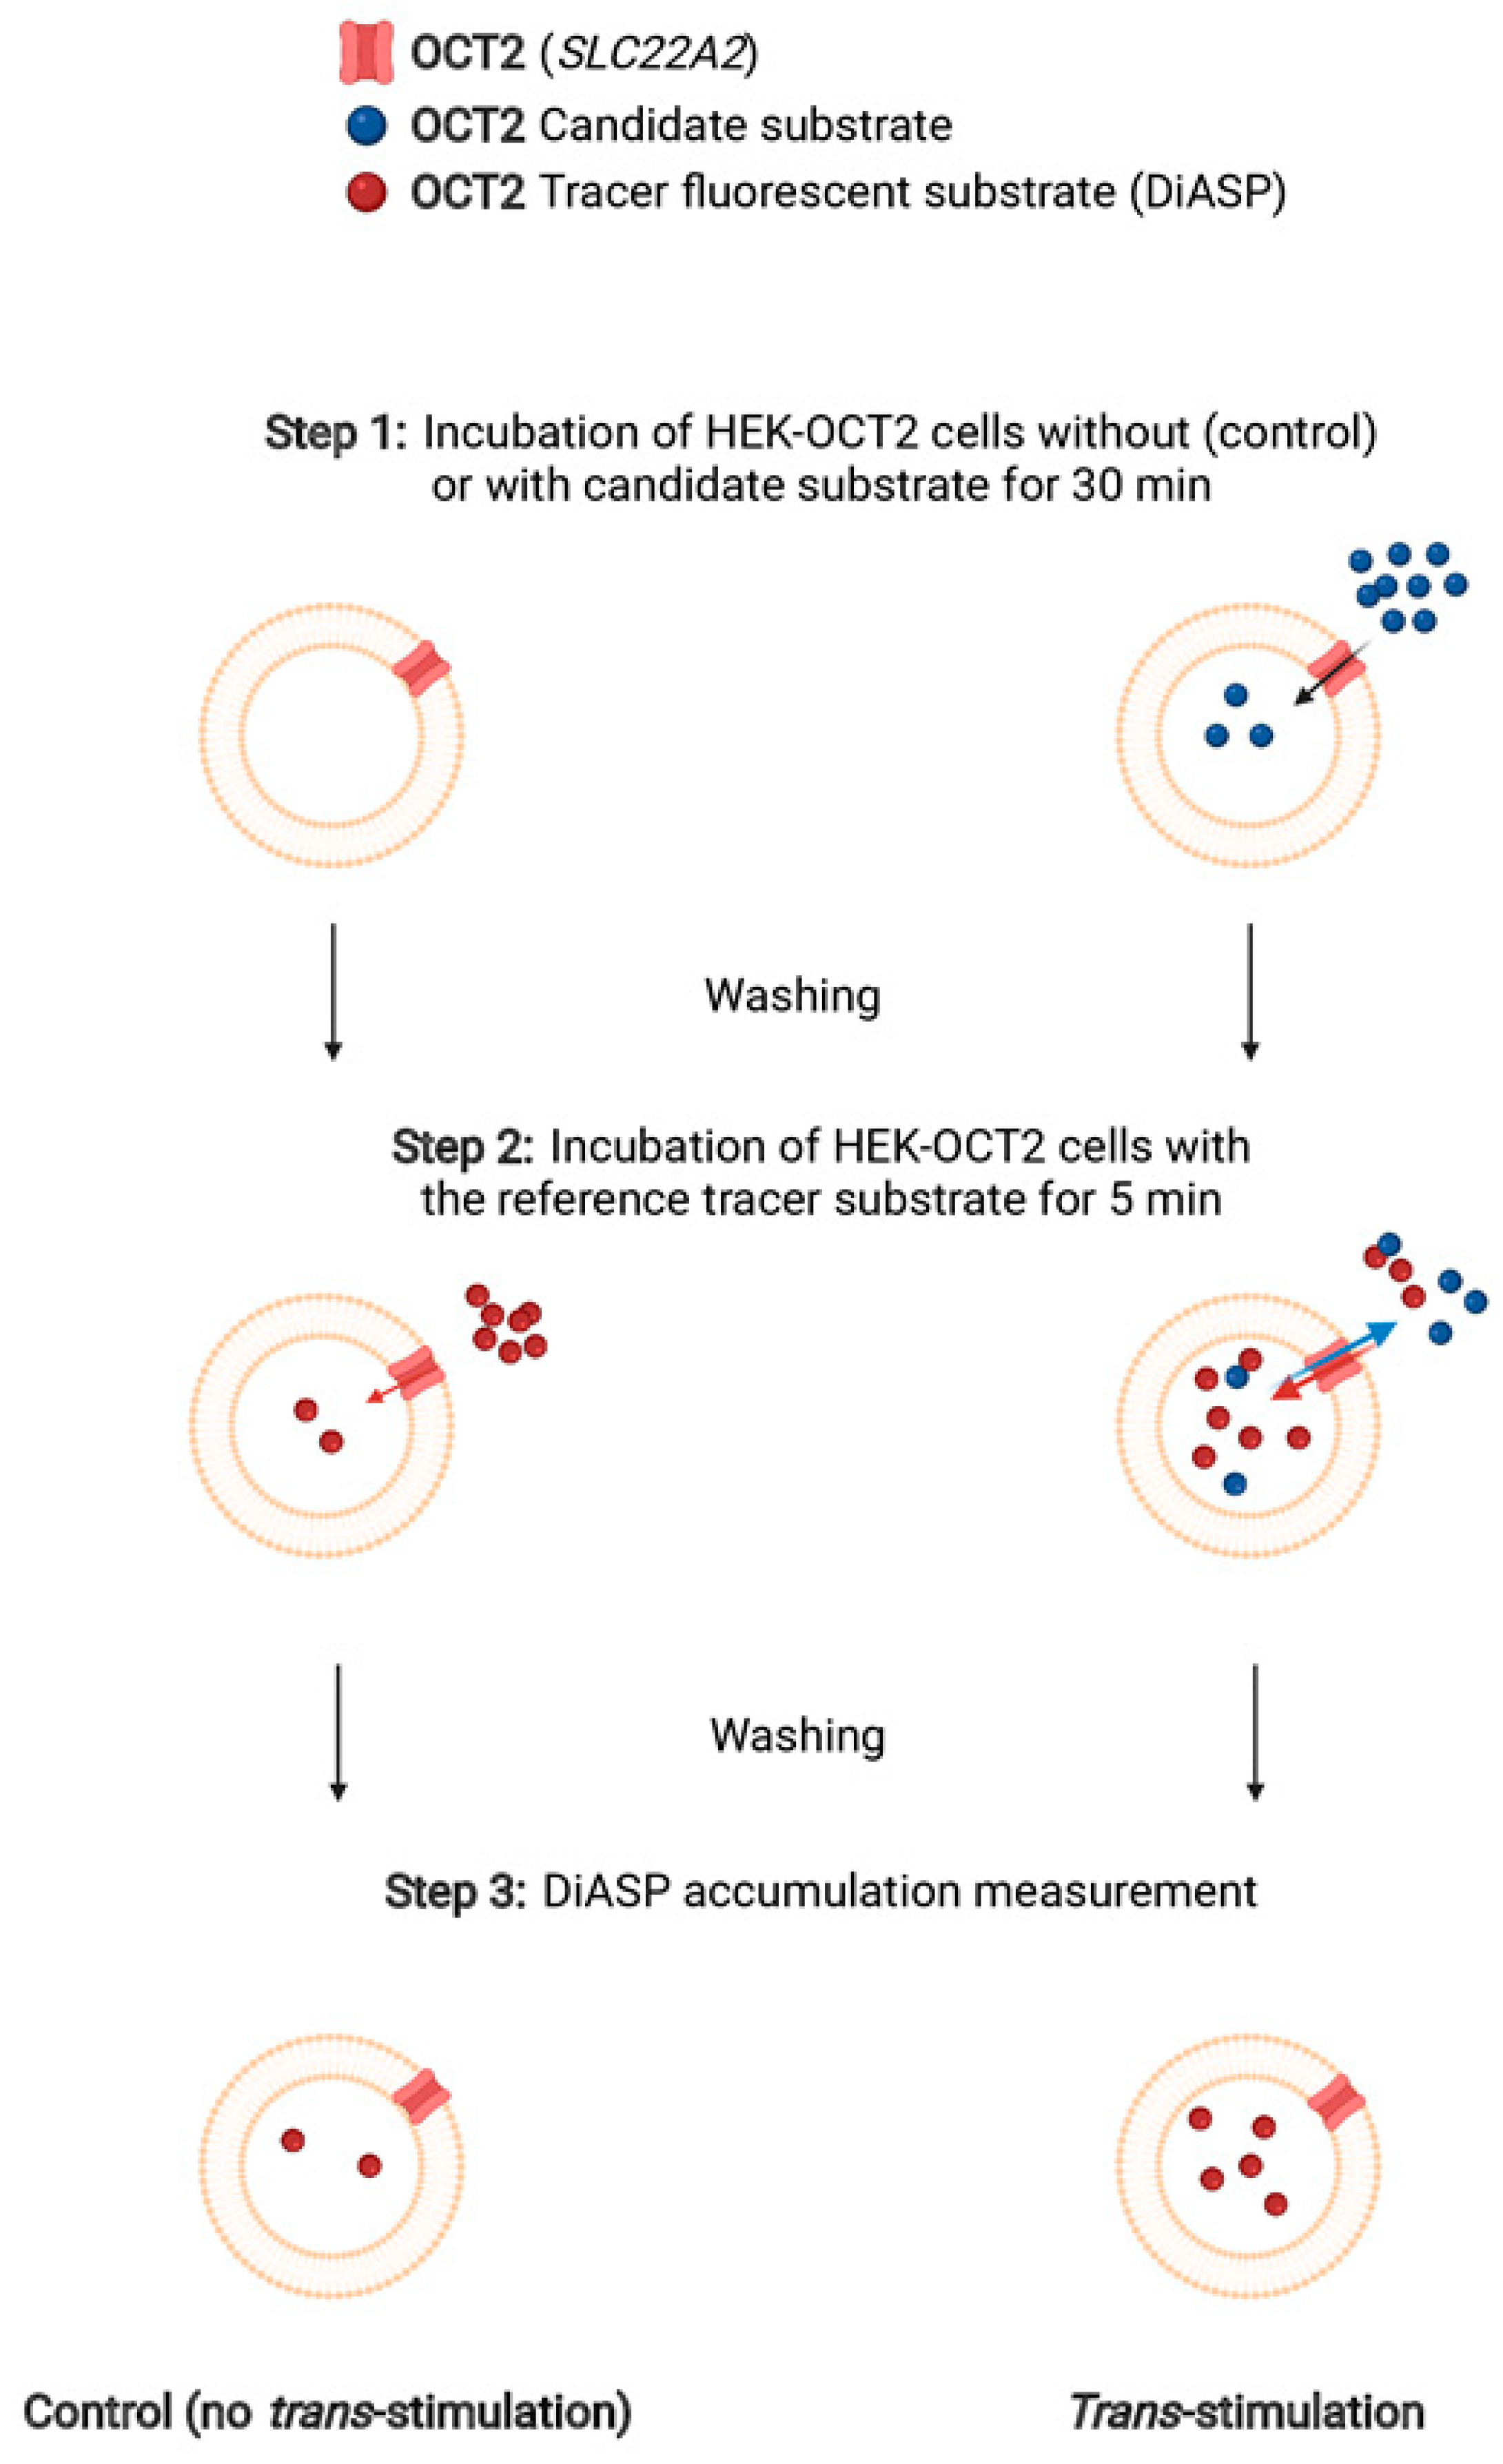
4.3. OCT2 Activity Assays

4.3.1. Cis-Inhibition Assays

Cis-inhibition of OCT2 activity was analysed as previously described [52]. Briefly, HEK-OCT2 cells were incubated with 10 µM DiASP, in the absence (control) of the presence of 100 µM amitriptyline (used here as a reference inhibitor of OCT2 activity) or of various concentrations of the OCT2 substrates, for 5 min. The transport assay medium consisted of 5.3 mM KCl, 1.1 mM KH2PO4, 0.8 mM MgSO4, 1.8 mM CaCl2, 11 mM dextrose, 10 mM HEPES, and 136 mM NaCl, adjusted to pH = 7.4. Next, cells were washed with phosphate-buffered saline (PBS) and lysed in distilled water. Intracellular accumulation of DiASP was then determined by spectrofluorimetry using a PerkinElmer Enspire spectrofluorometer (Waltham, MA, USA); excitation and emission wavelengths were 485 nm and 607 nm, respectively. DiASP accumulation values were thereafter normalized to total protein content, determined by the Bradford method [62]. Data were expressed as percentages of transporter activity found in control cells, arbitrarily set at 100%, according to the following Equation (1):
OCT 2   activity   %   =   DiASP OCT 2   substrate     DiASP Amitriptyline DiASP Control DiASP Amitriptyline   ×   100  
where [DiASPOCT2 substrate] = DiASP accumulation in the presence of a defined concentration of OCT2 substrate, [DiASPAmitriptyline] = DiASP accumulation in the presence of amitriptyline and [DiASPControl] = DiASP accumulation in untreated control cells.
IC50 values of OCT2 substrates towards OCT2-mediated uptake of DiASP and the corresponding 95% confidence intervals were determined from nonlinear regression of concentration-response data, based on the four-parameter logistic function. They were calculated using Prism 9.3 software (GraphPad Software, San Diego, CA, USA), through the following Equation (2):
A   =   100 1   +   10 OCT 2   substrate     LogIC 50   ×   Hill   slope  
where A = the percentage of transporter activity for a given concentration of OCT2 substrate determined as described in Equation (1), [OCT2 substrate] = OCT2 substrate concentration in the transport assay medium, and Hill slope = a coefficient describing the steepness of the curve.

4.3.2. Trans-Stimulation Assays

OCT2 trans-stimulation assays were performed through monitoring cellular uptake of the tracer substrate DiASP. As schematically depicted in Figure 4, HEK-OCT2 cells were first incubated in the absence (control) or presence of different concentrations of OCT2 substrates for 30 min at 37 °C in the transport assay medium described above. After washing with PBS, cells were re-incubated with 10 µM DiASP for 5 min. Cellular accumulation of the fluorescence dye was next determined by spectrofluorimetry, as reported above. Data were commonly expressed as % of DiASP uptake in control cells, set at 100%, or as fluorescence arbitrary units (FAU)/mg protein.

4.4. Molecular Descriptors Generation

Eighty-two molecular descriptors listed in Table S1 and belonging to the blocks “constitutional indices” (n = 47), “charge descriptors” (n = 15), and “molecular properties” (n = 20), were determined for each of the 15 OCT2 substrates investigated in the study, using the Dragon 7.0 software (Talete, Milano, Italy). OCT2 substrates, initially expressed in SMILES format, were converted to 3D format using MarvinView 20.20.0 software (ChemAxon, Budapest, Hungary) before processing by Dragon 7.0 software to obtain molecular descriptors, as previously described [52,63].

4.5. Data Analysis

Experimental data are usually expressed as means ± SEM from at least three independent experiments, each being performed in quadruplicate. They were statistically analyzed using Prism 9.3 software through analysis of variance (ANOVA) followed by Dunnett’s or Bonferroni’s post hoc test. The relationship between measured IC50 and KM values reported in the literature for each OCT2 substrate was analysed through the nonparametric Spearman’s rank correlation method. Comparison of molecular descriptor values between trans-stimulating and non-trans-stimulating OCT2 substrates was performed using the t-test, which is applicable to small sample sizes [64]. The criterion of significance for statistical tests was p < 0.05. The sensitivity of the trans-stimulation assay for identifying OCT2 substrates was calculated according to the following equation:
Sensitivity   =   Number   of   OCT 2   substrates   c i s     inhibiting   and   t r a n s     stimulating   OCT 2   activity Number   of   OCT 2   substrates   ×   100

Supplementary Materials

The following are available online at www.mdpi.com/ccc/s1.

Author Contributions

Conceptualization, C.R.L., M.L.V., C.M. and O.F.; methodology, C.R.L., M.L.V. and O.F.; validation, C.R.L., M.L.V. and O.F.; formal analysis, C.R.L., M.L.V. and O.F.; investigation, C.R.L., M.L.V., S.G., E.J. and A.B.; resources, M.L.V. and A.B.; data curation, C.R.L., M.L.V. and O.F.; writing—original draft preparation, C.R.L. and O.F.; writing—review and editing, C.R.L., M.L.V., C.M. and O.F.; visualization, C.R.L. and O.F.; supervision, M.L.V. and O.F.; project administration, C.R.L., M.L.V. and O.F.; funding acquisition, O.F. All authors have read and agreed to the published version of the manuscript.

Funding

This research received no external funding.

Institutional Review Board Statement

Not applicable.

Informed Consent Statement

Not applicable.

Data Availability Statement

Data of the study are available from the corresponding author upon reasonable request.

Conflicts of Interest

The authors declare no conflict of interest.

References

  1. Pizzagalli, M.D.; Bensimon, A.; Superti-Furga, G. A guide to plasma membrane solute carrier proteins. FEBS J. 2021, 288, 2784–2835. [Google Scholar] [CrossRef] [PubMed]
  2. Giacomini, K.M.; Huang, S.M.; Tweedie, D.J.; Benet, L.Z.; Brouwer, K.L.; Chu, X.; Dahlin, A.; Evers, R.; Fischer, V.; Hillgren, K.M.; et al. Membrane transporters in drug development. Nat. Rev. Drug Discov. 2010, 9, 215–236. [Google Scholar] [CrossRef]
  3. Brecht, K.; Schäfer, A.M.; Meyer Zu Schwabedissen, H.E. Uptake Transporters of the SLC21, SLC22A, and SLC15A Families in Anticancer Therapy-Modulators of Cellular Entry or Pharmacokinetics? Cancers 2020, 12, 2263. [Google Scholar] [CrossRef] [PubMed]
  4. Nies, A.T.; Koepsell, H.; Damme, K.; Schwab, M. Organic cation transporters (OCTs, MATEs), in vitro and in vivo evidence for the importance in drug therapy. Handb. Exp. Pharmacol. 2011, 201, 105–167. [Google Scholar] [CrossRef]
  5. Lee, S.C.; Arya, V.; Yang, X.; Volpe, D.A.; Zhang, L. Evaluation of transporters in drug development: Current status and contemporary issues. Adv. Drug Deliv. Rev. 2017, 116, 100–118. [Google Scholar] [CrossRef] [PubMed]
  6. Gründemann, D.; Schömig, E. Gene structures of the human non-neuronal monoamine transporters EMT and OCT2. Hum. Genet. 2000, 106, 627–635. [Google Scholar] [CrossRef] [PubMed]
  7. Wright, S.H. Molecular and cellular physiology of organic cation transporter 2. Am. J. Physiol. Ren. Physiol. 2019, 317, F1669–F1679. [Google Scholar] [CrossRef] [PubMed]
  8. Budiman, T.; Bamberg, E.; Koepsell, H.; Nagel, G. Mechanism of electrogenic cation transport by the cloned organic cation transporter 2 from rat. J. Biol. Chem. 2000, 275, 29413–29420. [Google Scholar] [CrossRef] [Green Version]
  9. Koepsell, H. Multiple binding sites in organic cation transporters require sophisticated procedures to identify interactions of novel drugs. Biol. Chem. 2019, 400, 195–207. [Google Scholar] [CrossRef] [Green Version]
  10. Samodelov, S.L.; Kullak-Ublick, G.A.; Gai, Z.; Visentin, M. Organic Cation Transporters in Human Physiology, Pharmacology, and Toxicology. Int. J. Mol. Sci. 2020, 21, 7890. [Google Scholar] [CrossRef]
  11. Motohashi, H.; Inui, K. Multidrug and toxin extrusion family SLC47: Physiological, pharmacokinetic and toxicokinetic importance of MATE1 and MATE2-K. Mol. Asp. Med. 2013, 34, 661–668. [Google Scholar] [CrossRef]
  12. Koepsell, H. Organic Cation Transporters in Health and Disease. Pharmacol. Rev. 2020, 72, 253–319. [Google Scholar] [CrossRef]
  13. Hucke, A.; Rinschen, M.M.; Bauer, O.B.; Sperling, M.; Karst, U.; Köppen, C.; Sommer, K.; Schröter, R.; Ceresa, C.; Chiorazzi, A.; et al. An integrative approach to cisplatin chronic toxicities in mice reveals importance of organic cation-transporter-dependent protein networks for renoprotection. Arch. Toxicol. 2019, 93, 2835–2848. [Google Scholar] [CrossRef]
  14. Burckhardt, G. Drug transport by Organic Anion Transporters (OATs). Pharmacol. Ther. 2012, 136, 106–130. [Google Scholar] [CrossRef]
  15. Dvorak, V.; Wiedmer, T.; Ingles-Prieto, A.; Altermatt, P.; Batoulis, H.; Bärenz, F.; Bender, E.; Digles, D.; Dürrenberger, F.; Heitman, L.H.; et al. An Overview of Cell-Based Assay Platforms for the Solute Carrier Family of Transporters. Front. Pharmacol. 2021, 12, 722889. [Google Scholar] [CrossRef]
  16. Gründemann, D.; Hahne, C.; Berkels, R.; Schömig, E. Agmatine is efficiently transported by non-neuronal monoamine transporters extraneuronal monoamine transporter (EMT) and organic cation transporter 2 (OCT2). J. Pharmacol. Exp. Ther. 2003, 304, 810–817. [Google Scholar] [CrossRef] [Green Version]
  17. Dresser, M.J.; Xiao, G.; Leabman, M.K.; Gray, A.T.; Giacomini, K.M. Interactions of n-tetraalkylammonium compounds and biguanides with a human renal organic cation transporter (hOCT2). Pharm. Res. 2002, 19, 1244–1247. [Google Scholar] [CrossRef]
  18. Hagos, Y.; Schley, G.; Schödel, J.; Krick, W.; Burckhardt, G.; Willam, C.; Burckhardt, B.C. α-Ketoglutarate-related inhibitors of HIF prolyl hydroxylases are substrates of renal organic anion transporters 1 (OAT1) and 4 (OAT4). Pflugers Arch. 2012, 464, 367–374. [Google Scholar] [CrossRef] [Green Version]
  19. Blazquez, A.G.; Briz, O.; Romero, M.R.; Rosales, R.; Monte, M.J.; Vaquero, J.; Macias, R.I.; Cassio, D.; Marin, J.J. Characterization of the role of ABCG2 as a bile acid transporter in liver and placenta. Mol. Pharmacol. 2012, 81, 273–283. [Google Scholar] [CrossRef] [Green Version]
  20. Severance, A.C.; Sandoval, P.J.; Wright, S.H. Correlation between Apparent Substrate Affinity and OCT2 Transport Turnover. J. Pharmacol. Exp. Ther. 2017, 362, 405–412. [Google Scholar] [CrossRef]
  21. Bourdet, D.L.; Pritchard, J.B.; Thakker, D.R. Differential substrate and inhibitory activities of ranitidine and famotidine toward human organic cation transporter 1 (hOCT1; SLC22A1), hOCT2 (SLC22A2), and hOCT3 (SLC22A3). J. Pharmacol. Exp. Ther. 2005, 315, 1288–1297. [Google Scholar] [CrossRef] [Green Version]
  22. Martínez-Guerrero, L.J.; Wright, S.H. Substrate-dependent inhibition of human MATE1 by cationic ionic liquids. J. Pharmacol. Exp. Ther. 2013, 346, 495–503. [Google Scholar] [CrossRef] [Green Version]
  23. Harper, J.N.; Wright, S.H. Multiple mechanisms of ligand interaction with the human organic cation transporter, OCT2. Am. J. Physiol. Ren. Physiol. 2013, 304, F56–F67. [Google Scholar] [CrossRef] [Green Version]
  24. Schäfer, A.M.; Bock, T.; Meyer Zu Schwabedissen, H.E. Establishment and Validation of Competitive Counterflow as a Method To Detect Substrates of the Organic Anion Transporting Polypeptide 2B1. Mol. Pharm. 2018, 15, 5501–5513. [Google Scholar] [CrossRef]
  25. McKinney, T.D.; Hosford, M.A. Organic cation transport by rat hepatocyte basolateral membrane vesicles. Am. J. Physiol. 1992, 263 Pt 1, G939–G946. [Google Scholar] [CrossRef]
  26. Takahashi, K.; Nakamura, N.; Terada, T.; Okano, T.; Futami, T.; Saito, H.; Inui, K.I. Interaction of beta-lactam antibiotics with H+/peptide cotransporters in rat renal brush-border membranes. J. Pharmacol. Exp. Ther. 1998, 286, 1037–1042. [Google Scholar]
  27. Takano, M.; Inui, K.; Okano, T.; Saito, H.; Hori, R. Carrier-mediated transport systems of tetraethylammonium in rat renal brush-border and basolateral membrane vesicles. Biochim. et Biophys. Acta 1984, 773, 113–124. [Google Scholar] [CrossRef]
  28. Cisternino, S.; Chapy, H.; André, P.; Smirnova, M.; Debray, M.; Scherrmann, J.M. Coexistence of passive and proton antiporter-mediated processes in nicotine transport at the mouse blood-brain barrier. AAPS J. 2013, 15, 299–307. [Google Scholar] [CrossRef] [Green Version]
  29. Chapy, H.; André, P.; Declèves, X.; Scherrmann, J.M.; Cisternino, S. A polyspecific drug/proton antiporter mediates diphenhydramine and clonidine transport at the mouse blood-retinal barrier. Br. J. Pharmacol. 2015, 172, 4714–4725. [Google Scholar] [CrossRef]
  30. Dresser, M.J.; Gray, A.T.; Giacomini, K.M. Kinetic and selectivity differences between rodent, rabbit, and human organic cation transporters (OCT1). J. Pharmacol. Exp. Ther. 2000, 292, 1146–1152. [Google Scholar]
  31. Apiwattanakul, N.; Sekine, T.; Chairoungdua, A.; Kanai, Y.; Nakajima, N.; Sophasan, S.; Endou, H. Transport properties of nonsteroidal anti-inflammatory drugs by organic anion transporter 1 expressed in Xenopus laevis oocytes. Mol. Pharmacol. 1999, 55, 847–854. [Google Scholar] [PubMed]
  32. Müller, J.P.; Keufgens, L.; Gründemann, D. Hyperosmolarity stimulates transporter-mediated insertion of estrone sulfate into the plasma membrane, but inhibits the uptake by SLC10A1 (NTCP). Biochem. Pharmacol. 2021, 186, 114484. [Google Scholar] [CrossRef]
  33. Chapy, H.; Goracci, L.; Vayer, P.; Parmentier, Y.; Carrupt, P.A.; Declèves, X.; Scherrmann, J.M.; Cisternino, S.; Cruciani, G. Pharmacophore-based discovery of inhibitors of a novel drug/proton antiporter in human brain endothelial hCMEC/D3 cell line. Br. J. Pharmacol. 2015, 172, 4888–4904. [Google Scholar] [CrossRef] [PubMed]
  34. Lips, K.S.; Volk, C.; Schmitt, B.M.; Pfeil, U.; Arndt, P.; Miska, D.; Ermert, L.; Kummer, W.; Koepsell, H. Polyspecific cation transporters mediate luminal release of acetylcholine from bronchial epithelium. Am. J. Respir. Cell Mol. Biol. 2005, 33, 79–88. [Google Scholar] [CrossRef] [PubMed] [Green Version]
  35. Winter, T.N.; Elmquist, W.F.; Fairbanks, C.A. OCT2 and MATE1 provide bidirectional agmatine transport. Mol. Pharm. 2011, 8, 133–142. [Google Scholar] [CrossRef] [PubMed]
  36. Dos Santos Pereira, J.N.; Tadjerpisheh, S.; Abu Abed, M.; Saadatmand, A.R.; Weksler, B.; Romero, I.A.; Couraud, P.O.; Brockmöller, J.; Tzvetkov, M.V. The poorly membrane permeable antipsychotic drugs amisulpride and sulpiride are substrates of the organic cation transporters from the SLC22 family. AAPS J. 2014, 16, 1247–1258. [Google Scholar] [CrossRef] [PubMed] [Green Version]
  37. Gorboulev, V.; Ulzheimer, J.C.; Akhoundova, A.; Ulzheimer-Teuber, I.; Karbach, U.; Quester, S.; Baumann, C.; Lang, F.; Busch, A.E.; Koepsell, H. Cloning and characterization of two human polyspecific organic cation transporters. DNA Cell Biol. 1997, 16, 871–881. [Google Scholar] [CrossRef] [PubMed]
  38. Tahara, H.; Kusuhara, H.; Endou, H.; Koepsell, H.; Imaoka, T.; Fuse, E.; Sugiyama, Y. A species difference in the transport activities of H2 receptor antagonists by rat and human renal organic anion and cation transporters. J. Pharmacol. Exp. Ther. 2005, 315, 337–345. [Google Scholar] [CrossRef] [Green Version]
  39. Zolk, O.; Solbach, T.F.; König, J.; Fromm, M.F. Functional characterization of the human organic cation transporter 2 variant p.270Ala>Ser. Drug Metab. Dispos. 2009, 37, 1312–1318. [Google Scholar] [CrossRef] [Green Version]
  40. Amphoux, A.; Vialou, V.; Drescher, E.; Brüss, M.; Mannoury La Cour, C.; Rochat, C.; Millan, M.J.; Giros, B.; Bönisch, H.; Gautron, S. Differential pharmacological in vitro properties of organic cation transporters and regional distribution in rat brain. Neuropharmacology 2006, 50, 941–952. [Google Scholar] [CrossRef]
  41. Chen, J.; Brockmöller, J.; Seitz, T.; König, J.; Chen, X.; Tzvetkov, M.V. Tropane alkaloids as substrates and inhibitors of human organic cation transporters of the SLC22 (OCT) and the SLC47 (MATE) families. Biol. Chem. 2017, 398, 237–249. [Google Scholar] [CrossRef]
  42. Jung, N.; Lehmann, C.; Rubbert, A.; Knispel, M.; Hartmann, P.; van Lunzen, J.; Stellbrink, H.J.; Faetkenheuer, G.; Taubert, D. Relevance of the organic cation transporters 1 and 2 for antiretroviral drug therapy in human immunodeficiency virus infection. Drug Metab. Dispos. 2008, 36, 1616–1623. [Google Scholar] [CrossRef]
  43. Kimura, N.; Masuda, S.; Tanihara, Y.; Ueo, H.; Okuda, M.; Katsura, T.; Inui, K. Metformin is a superior substrate for renal organic cation transporter OCT2 rather than hepatic OCT1. Drug Metab. Pharmacokinet. 2005, 20, 379–386. [Google Scholar] [CrossRef] [Green Version]
  44. Elsby, R.; Chidlaw, S.; Outteridge, S.; Pickering, S.; Radcliffe, A.; Sullivan, R.; Jones, H.; Butler, P. Mechanistic in vitro studies confirm that inhibition of the renal apical efflux transporter multidrug and toxin extrusion (MATE) 1, and not altered absorption, underlies the increased metformin exposure observed in clinical interactions with cimetidine, trimethoprim or pyrimethamine. Pharmacol. Res. Perspect. 2017, 5, e00357. [Google Scholar] [CrossRef]
  45. Lee, W.K.; Reichold, M.; Edemir, B.; Ciarimboli, G.; Warth, R.; Koepsell, H.; Thévenod, F. Organic cation transporters OCT1, 2, and 3 mediate high-affinity transport of the mutagenic vital dye ethidium in the kidney proximal tubule. Am. J. Physiol. Ren. Physiol. 2009, 296, F1504–F1513. [Google Scholar] [CrossRef] [Green Version]
  46. Belzer, M.; Morales, M.; Jagadish, B.; Mash, E.A.; Wright, S.H. Substrate-dependent ligand inhibition of the human organic cation transporter OCT2. J. Pharmacol. Exp. Ther. 2013, 346, 300–310. [Google Scholar] [CrossRef] [Green Version]
  47. Minematsu, T.; Iwai, M.; Umehara, K.; Usui, T.; Kamimura, H. Characterization of human organic cation transporter 1 (OCT1/SLC22A1)- and OCT2 (SLC22A2)-mediated transport of 1-(2-methoxyethyl)-2-methyl-4,9-dioxo-3-(pyrazin-2-ylmethyl)- 4,9-dihydro-1H-naphtho[2,3-d]imidazolium bromide (YM155 monobromide), a novel small molecule survivin suppressant. Drug Metab. Dispos. 2010, 38, 1–4. [Google Scholar] [CrossRef]
  48. Barendt, W.M.; Wright, S.H. The human organic cation transporter (hOCT2) recognizes the degree of substrate ionization. J. Biol. Chem. 2002, 277, 22491–22496. [Google Scholar] [CrossRef] [Green Version]
  49. Chen, L.; Shu, Y.; Liang, X.; Chen, E.C.; Yee, S.W.; Zur, A.A.; Li, S.; Xu, L.; Keshari, K.R.; Lin, M.J.; et al. OCT1 is a high-capacity thiamine transporter that regulates hepatic steatosis and is a target of metformin. Proc. Natl. Acad. Sci. USA 2014, 111, 9983–9988. [Google Scholar] [CrossRef] [Green Version]
  50. Chiba, S.; Ikawa, T.; Takeshita, H.; Kanno, S.; Nagai, T.; Takada, M.; Mukai, T.; Wempe, M.F. Human organic cation transporter 2 (hOCT2): Inhibitor studies using S2-hOCT2 cells. Toxicology 2013, 310, 98–103. [Google Scholar] [CrossRef]
  51. Sugano, K.; Kansy, M.; Artursson, P.; Avdeef, A.; Bendels, S.; Di, L.; Ecker, G.F.; Faller, B.; Fischer, H.; Gerebtzoff, G.; et al. Coexistence of passive and carrier-mediated processes in drug transport. Nat. Rev. Drug Discov. 2010, 9, 597–614. [Google Scholar] [CrossRef]
  52. Sayyed, K.; Camillerapp, C.; Le Vée, M.; Bruyère, A.; Nies, A.T.; Abdel-Razzak, Z.; Fardel, O. Inhibition of organic cation transporter (OCT) activities by carcinogenic heterocyclic aromatic amines. Toxicol. In Vitro 2019, 54, 10–22. [Google Scholar] [CrossRef]
  53. Sandoval, P.J.; Zorn, K.M.; Clark, A.M.; Ekins, S.; Wright, S.H. Assessment of Substrate-Dependent Ligand Interactions at the Organic Cation Transporter OCT2 Using Six Model Substrates. Mol. Pharmacol. 2018, 94, 1057–1068. [Google Scholar] [CrossRef] [Green Version]
  54. Kimura, N.; Masuda, S.; Katsura, T.; Inui, K. Transport of guanidine compounds by human organic cation transporters, hOCT1 and hOCT2. Biochem. Pharmacol. 2009, 77, 1429–1436. [Google Scholar] [CrossRef] [PubMed]
  55. Bakhiya, A.; Bahn, A.; Burckhardt, G.; Wolff, N. Human organic anion transporter 3 (hOAT3) can operate as an exchanger and mediate secretory urate flux. Cell. Physiol. Biochem. 2003, 13, 249–256. [Google Scholar] [CrossRef] [PubMed]
  56. Xiao, C.; Cant, J.P. Glucose transporter in bovine mammary epithelial cells is an asymmetric carrier that exhibits cooperativity and trans-stimulation. Am. J. Physiol. Cell Physiol. 2003, 285, C1226–C1234. [Google Scholar] [CrossRef] [PubMed] [Green Version]
  57. Chien, H.C.; Colas, C.; Finke, K.; Springer, S.; Stoner, L.; Zur, A.A.; Venteicher, B.; Campbell, J.; Hall, C.; Flint, A.; et al. Reevaluating the Substrate Specificity of the L-Type Amino Acid Transporter (LAT1). J. Med. Chem. 2018, 61, 7358–7373. [Google Scholar] [CrossRef] [PubMed]
  58. Fardel, O.; Le Vee, M.; Jouan, E.; Denizot, C.; Parmentier, Y. Nature and uses of fluorescent dyes for drug transporter studies. Expert Opin. Drug Metab. Toxicol. 2015, 11, 1233–1251. [Google Scholar] [CrossRef]
  59. Cetinkaya, I.; Ciarimboli, G.; Yalçinkaya, G.; Mehrens, T.; Velic, A.; Hirsch, J.R.; Gorboulev, V.; Koepsell, H.; Schlatter, E. Regulation of human organic cation transporter hOCT2 by PKA, PI3K, and calmodulin-dependent kinases. Am. J. Physiol. Ren. Physiol. 2003, 284, F293–F302. [Google Scholar] [CrossRef] [Green Version]
  60. Koepp, T.N.; Tokaj, A.; Nedvetsky, P.I.; Conchon Costa, A.C.; Snieder, B.; Schröter, R.; Ciarimboli, G. Properties of Transport Mediated by the Human Organic Cation Transporter 2 Studied in a Polarized Three-Dimensional Epithelial Cell Culture Model. Int. J. Mol. Sci. 2021, 22, 9658. [Google Scholar] [CrossRef]
  61. Jouan, E.; Le Vee, M.; Denizot, C.; Da Violante, G.; Fardel, O. The mitochondrial fluorescent dye rhodamine 123 is a high-affinity substrate for organic cation transporters (OCTs) 1 and 2. Fundam. Clin. Pharmacol. 2014, 28, 65–77. [Google Scholar] [CrossRef]
  62. Bradford, M.M. A rapid and sensitive method for the quantitation of microgram quantities of protein utilizing the principle of protein-dye binding. Anal. Biochem. 1976, 72, 248–254. [Google Scholar] [CrossRef]
  63. Chedik, L.; Bruyere, A.; Le Vee, M.; Stieger, B.; Denizot, C.; Parmentier, Y.; Potin, S.; Fardel, O. Inhibition of Human Drug Transporter Activities by the Pyrethroid Pesticides Allethrin and Tetramethrin. PLoS ONE 2017, 12, e0169480. [Google Scholar] [CrossRef] [Green Version]
  64. de Winter, J.C.F. Using the Student’s t-test with extremely small sample sizes. Pract. Assess. Res. Eval. 2013, 18, 10. [Google Scholar] [CrossRef]
Figure 1. Cis-inhibition of OCT2 activity by exogenous OCT2 substrates. HEK-OCT2 cells were incubated with 10 µM DiASP, used here as a tracer substrate for OCT2, for 5 min at 37 °C, in the absence or presence of various concentrations of exogenous OCT2 substrates. Intracellular accumulation of DiASP was next determined by spectrofluorimetry and normalized to protein content. Data are expressed as % of OCT2 activity found in untreated control cells, arbitrarily set at 100%; they are the means ± SEM of at least three independent experiments performed in quadruplicate. IC50 values and 95% confidence intervals are indicated on the top of graphs.
Ijms 22 12926 g001
Figure 2. Cis-inhibition of OCT2 activity by endogenous OCT2 substrates. HEK-OCT2 cells were incubated with 10 µM DiASP, used here as a tracer substrate for OCT2, for 5 min at 37 °C, in the absence or presence of various concentrations of endogenous OCT2 substrates. Intracellular accumulation of DiASP was next determined by spectrofluorimetry and normalized to protein content. Data are expressed as % of OCT2 activity found in untreated control cells, arbitrarily set at 100%; they are the means ± SEM of at least three independent experiments performed in quadruplicate. IC50 values and 95% confidence intervals are indicated on the top of graphs.
Ijms 22 12926 g002
Figure 3. Spearman’s rank correlation between Michaelis constant (KM) and IC50 values for OCT2 substrates (n = 15). Spearman ρ coefficient and p value are indicated on the top of graph. KM were from Table 1; KM means were used for compounds for which various KM have been reported.
Ijms 22 12926 g003
Figure 4. Schematic representation of the various steps of the trans-stimulation assay performed for investigating OCT2 substrates (created with biorender.com). Step 1 corresponds to the initial incubation of cells without (Control) or with candidate substrate for 30 min at 37 °C. Step 2 consists of the incubation of cells with the reference tracer substrate (DiASP) for 5 min at 37 °C. Step 3 is the measurement of cellular accumulation of DiASP through spectrofluorimetry.
Ijms 22 12926 g004
Figure 5. Trans-modulation of OCT2 activity by exogenous OCT2 substrates. HEK-OCT2 cells were first incubated in the absence (control) or presence of various concentrations of exogenous OCT2 substrates for 30 min at 37 °C. After washing, cells were next incubated with 10 µM DiASP, used here as a tracer substrate for OCT2, for 5 min at 37 °C. Accumulation of DiASP was finally determined by spectrofluorimetry and normalised to protein content. Data are expressed as % of DiASP accumulation found in untreated control cells, arbitrarily set at 100%; they are the means ± SEM of at least three independent experiments performed in quadruplicate. *, p < 0.05, **, p < 0.01, ***, p < 0.001 and ****, p < 0.0001, when compared to control.
Ijms 22 12926 g005
Figure 6. trans-modulation of OCT2 activity by endogenous OCT2 substrates. HEK-OCT2 cells were first incubated in the absence (control) or presence of various concentrations of endogenous OCT2 substrates for 30 min at 37 °C. After washing, cells were next incubated with 10 µM DiASP, used here as a tracer substrate for OCT2, for 5 min at 37 °C. Accumulation of DiASP was finally determined by spectrofluorimetry and normalised to protein content. Data are expressed as % of DiASP accumulation found in untreated control cells, arbitrarily set at 100%; they are the means ± SEM of at least three independent experiments performed in quadruplicate. *, p < 0.05, **, p < 0.01 and ****, p < 0.0001, when compared to control.
Ijms 22 12926 g006
Figure 7. Effects of the reference OCT2 inhibitor amitriptyline on metformin-mediated trans-stimulation of DiASP uptake in HEK-OCT2 cells. HEK-OCT2 cells were either untreated (control) or treated by 10 mM metformin for 30 min at 37 °C. After washing, cells were incubated with 10 µM DiASP for 5 min at 37 °C, in the absence or presence of 100 µM amitriptyline. Accumulation of DiASP was finally determined by spectrofluorimetry and normalised to protein content. Data are expressed as DiASP-related fluorescence arbitrary unit (FAU)/mg protein and are the means ± SEM of at least three independent experiments performed in quadruplicate. **, p < 0.01 and ****, p < 0.0001.
Ijms 22 12926 g007
Table 1. Affinity for OCT2 (KM values) of substrates used in the study.
OCT2 SubstrateNatureKM (µM)Reference
AcetylcholineEndogenous substance (neurotransmitter)117[34]
AgmatineEndogenous substance (metabolite)1400–1840[16,35]
AmisulprideExogenous substance (antiemetic drug)168[36]
CholineEndogenous substance (neurotransmitter)210[37]
CimetidineExogenous substance (antihistamine drug)73[38]
DopamineEndogenous substance (neurotransmitter)932–1400[39,40]
EpinephrineEndogenous substance (biogenic amine)420[40]
IpratropiumExogenous substance (anticholinergic drug)0.3[41]
LamivudineExogenous substance (antiretroviral drug)248[42]
MetforminExogenous substance (antidiabetic drug)990–3171[39,43,44]
MPP+Exogenous substance (laboratory reagent)3.1–20[39,45,46]
SepantroniumExogenous substance (anticancer drug)2.7[47]
SerotoninEndogenous substance (neurotransmitter)290[40]
TEAExogenous substance (laboratory reagent)28.5–76[37,48]
ThiamineEndogenous substance (vitamin precursor)750[49]
Table 2. Molecular descriptors significantly discriminating OCT2 substrates according to their trans-stimulation properties towards OCT2-mediated DiASP uptake. CI, constitutional indices; MP, molecular properties; CD, charge descriptors.
Molecular DescriptorValue Meanp-Value
(t-Test)
OCT2 Substrates
BlockNameDescriptionTrans-StimulatingNon-Trans-Stimulating
CIMiMean first ionization potential (scaled on Carbon atom)1.171.140.0004
CIMpMean atomic polarizability (scaled on Carbon atom)0.560.640.0007
MPALOGPGhose-Crippen octanol-water partition coeff. (logP)−1.020.610.0012
CIC%Percentage of C atoms23.1035.930.0015
CIMvMean atomic van der Waals volume (scaled on Carbon atom)0.510.600.0030
MPUcUnsaturation count0.902.820.0054
CIGDGraph density0.230.150.0061
CInABNumber of aromatic bonds05.730.0073
MPBLTF96Verhaar Fish base-line toxicity from MLOGP (mmol/L)0.04−1.830.0079
MPMLOGPMoriguchi octanol-water partition coeff. (logP)−1.680.520.0079
MPBLTD48Verhaar Daphnia base-line toxicity from MLOGP (mmol/L)0.28−1.810.0080
MPBLTA96Verhaar Algae base-line toxicity from MLOGP (mmol/L)0.45−1.740.0080
CInBMNumber of multiple bonds17.360.0094
CInCsp2Number of sp2 hybridized Carbon atoms16.820.0120
CISCBOSum of conventional bond orders (H-depleted)8.7522.230.0123
MPUiUnsaturation index0.902.300.0130
CInCNumber of Carbon atoms5.2512.180.0131
CInBONumber of non-H bonds7.7517.640.0161
CIH%Percentage of H atoms61.0350.290.0188
CDRNCGRelative negative charge0.480.250.0195
CInSKNumber of non-H atoms8.7516.820.0225
CIMWMolecular weight127.5238.70.0254
CISvSum of atomic van der Waals volumes (scaled on carbon atom)11.4920.280.0295
CISpSum of atomic polarizabilities (scaled on carbon atom)12.5421.650.0325
CIAMWAverage molecular weight5.687.050.0350
MPVxMcGowan volume188.5309.80.0366
MPVvdwMGvan der Waals volume from McGowan volume80.62130.30.0366
MPAMRGhose–Crippen molar refractivity35.2662.750.0383
MPVvdwZAZvan der Waals volume from Zhao–Abraham–Zissimos equation134.22250.0395
MPPDIPacking density index0.820.910.0418
Publisher’s Note: MDPI stays neutral with regard to jurisdictional claims in published maps and institutional affiliations.

