
IFPTML Mapping of Drug Graphs with Protein and Chromosome Structural Networks vs. Pre-Clinical Assay Information for Discovery of Antimalarial Compounds


Abstract
:1. Introduction
2. Results
3. Discussion
3.1. IFPTML Linear Model with Multi-Condition Combinatorial Moving Averages (MMAs)
3.2. IFPTML-CTUS and IFPTML-CTLC Models
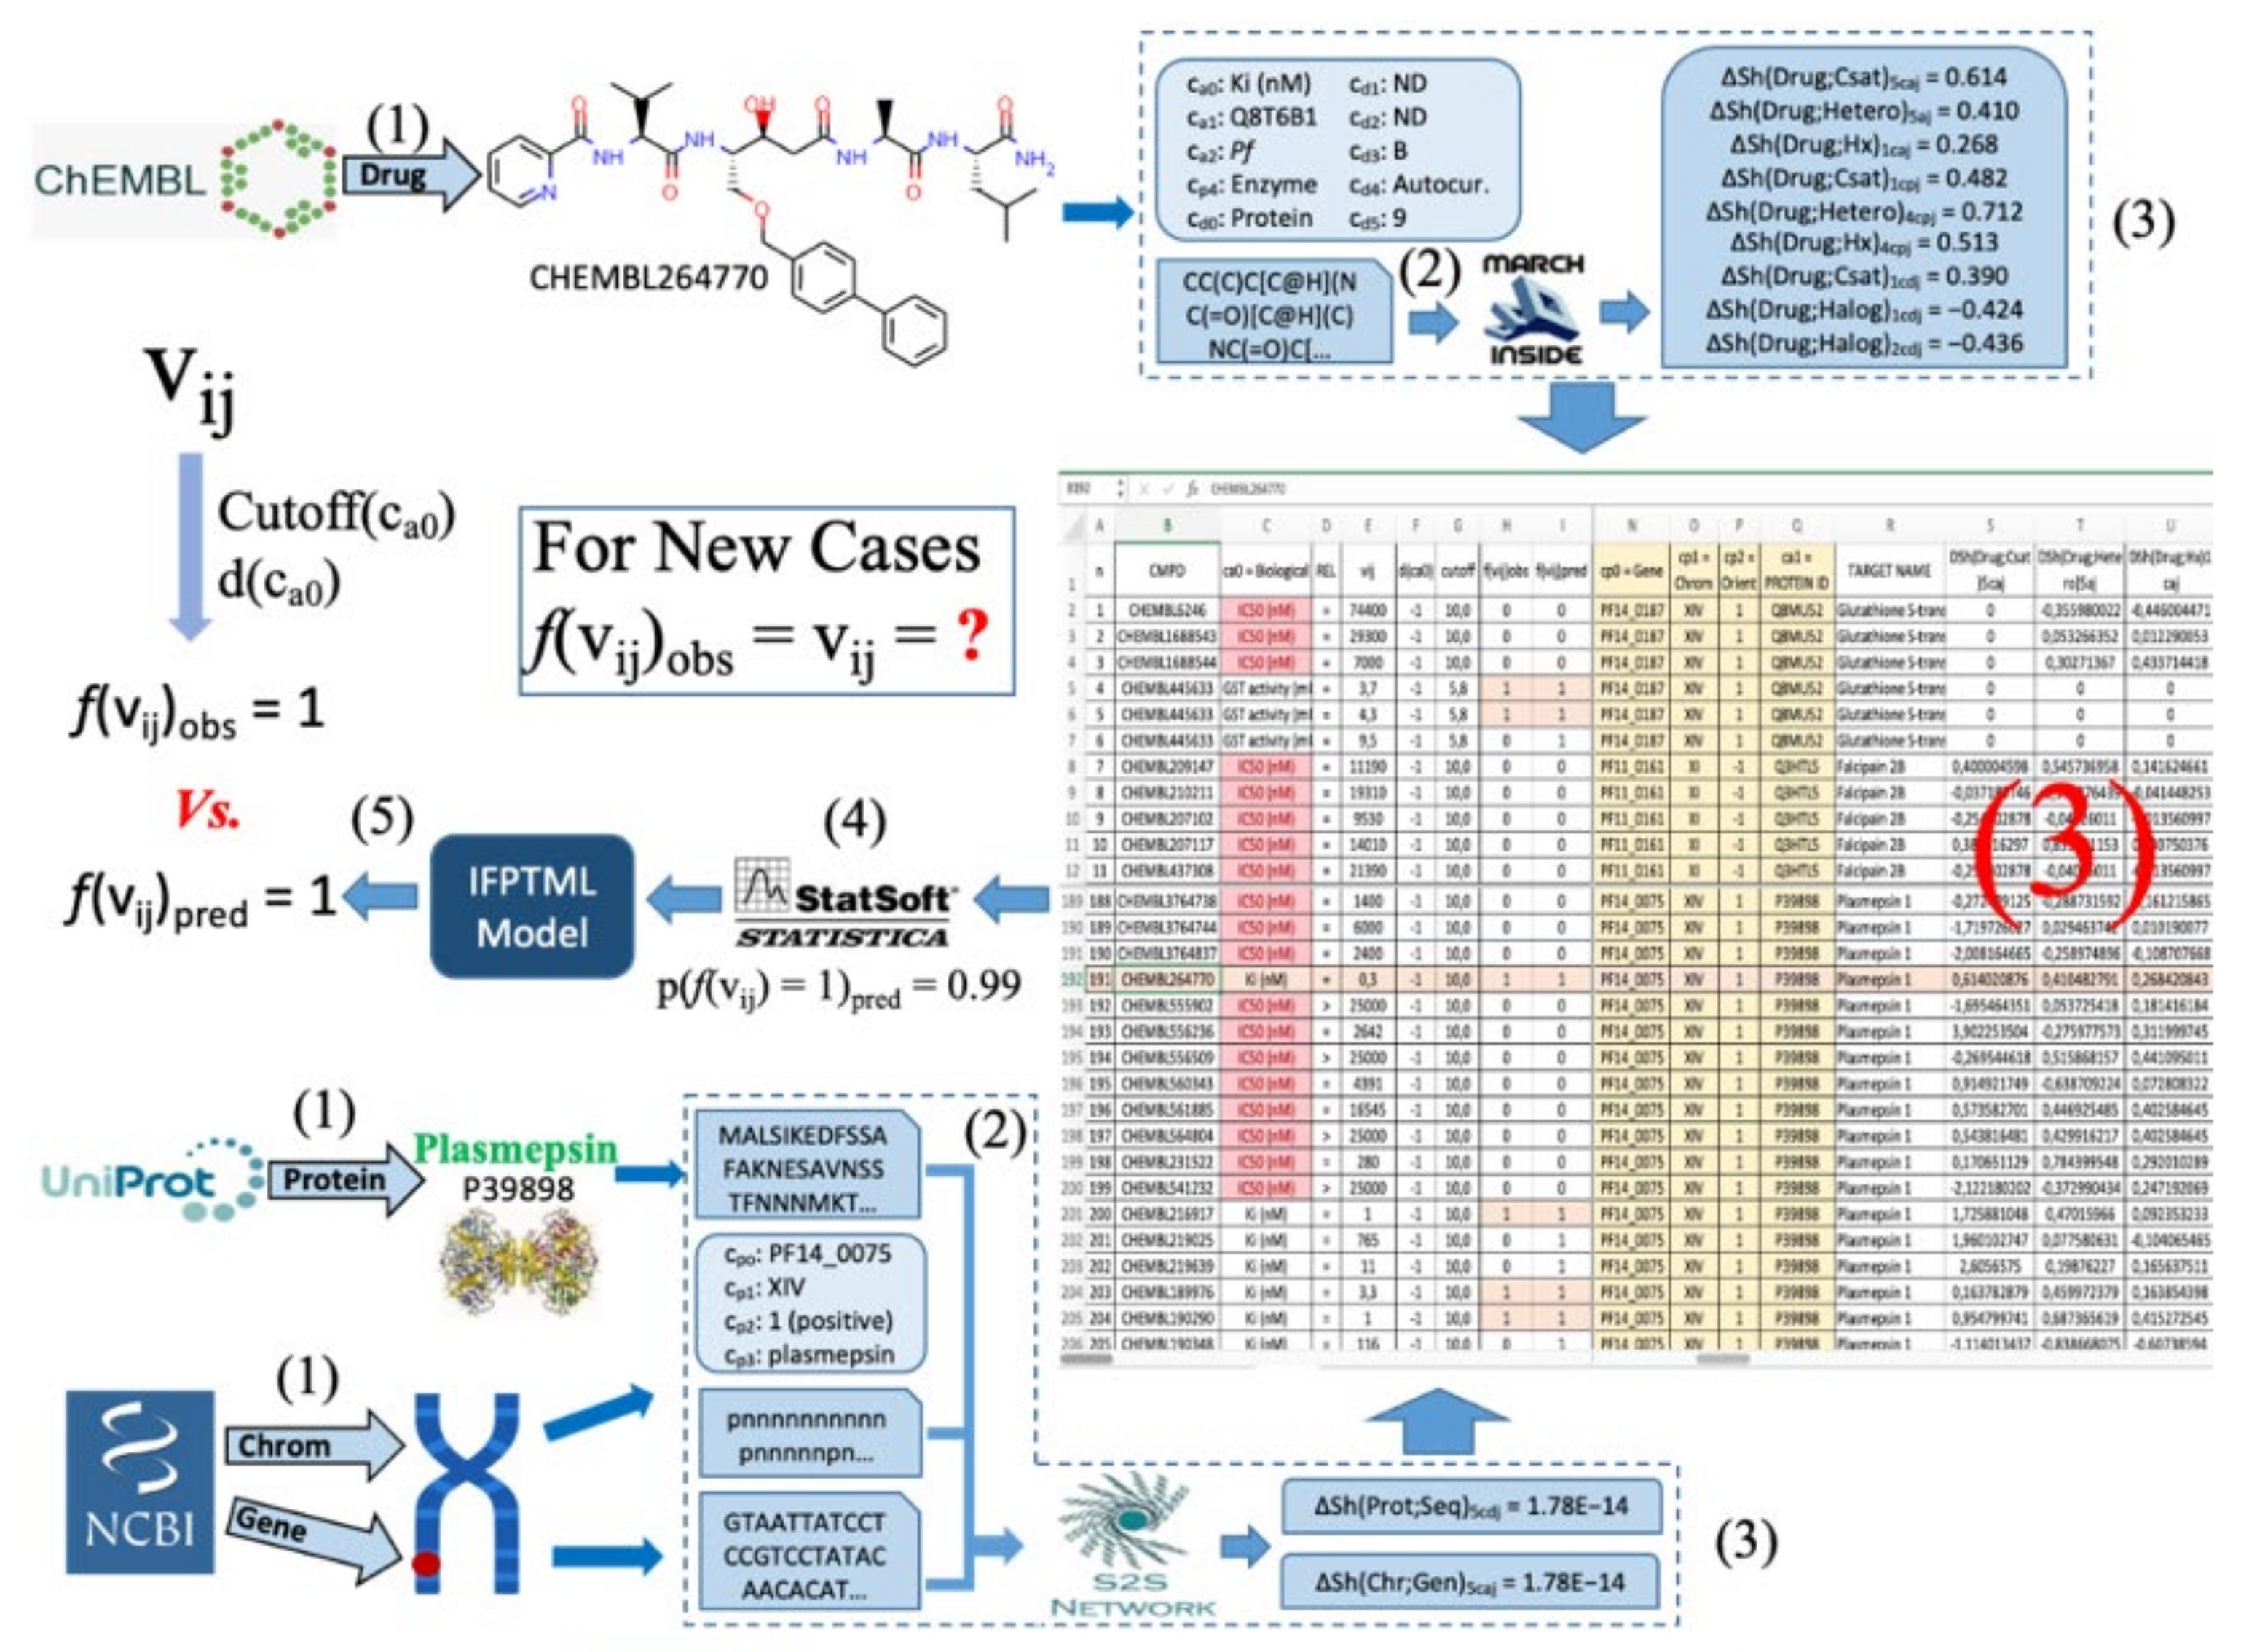
3.3. IFPTML-CTLC Model Practical Use Example
4. Materials and Methods
4.1. ChEMBL Dataset
4.2. NCBI-GDV Dataset
4.3. UniProt Dataset
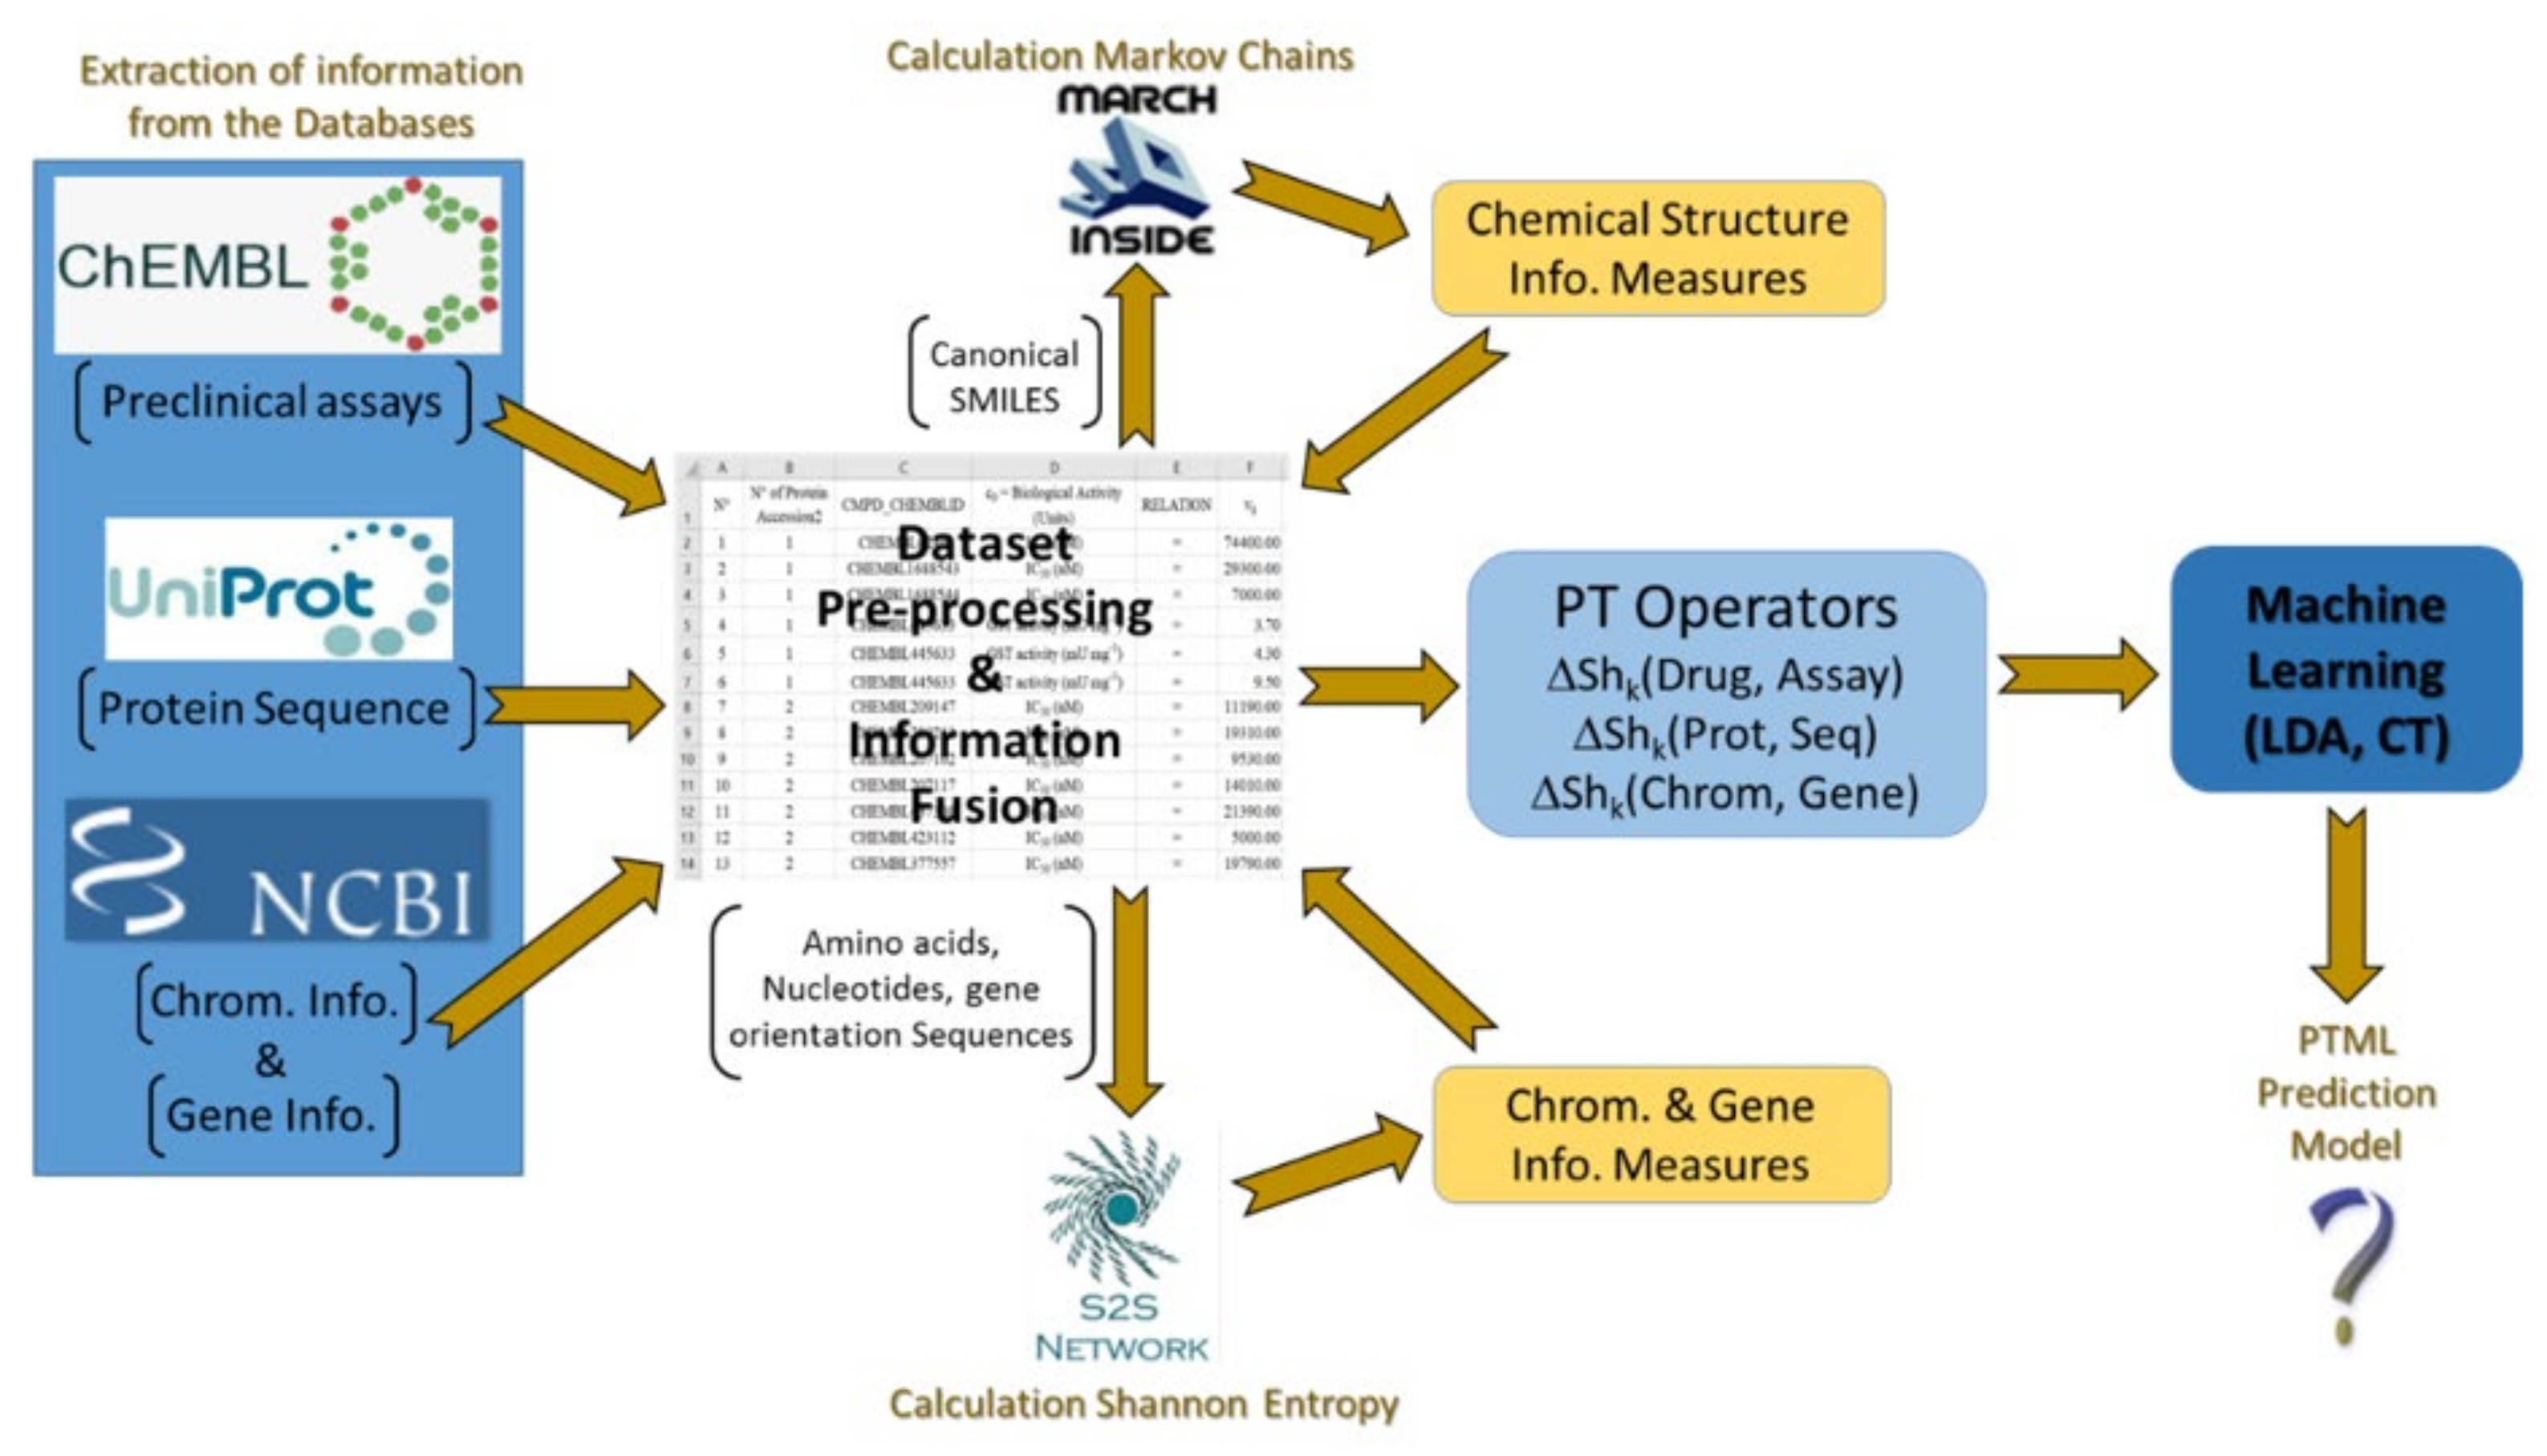
4.4. ChEMBL, NCBI-GDV, and UniProt Information Fusion
4.5. Pre-Processing of the Working Dataset
4.6. IFPTML Shannon Information Theory Models
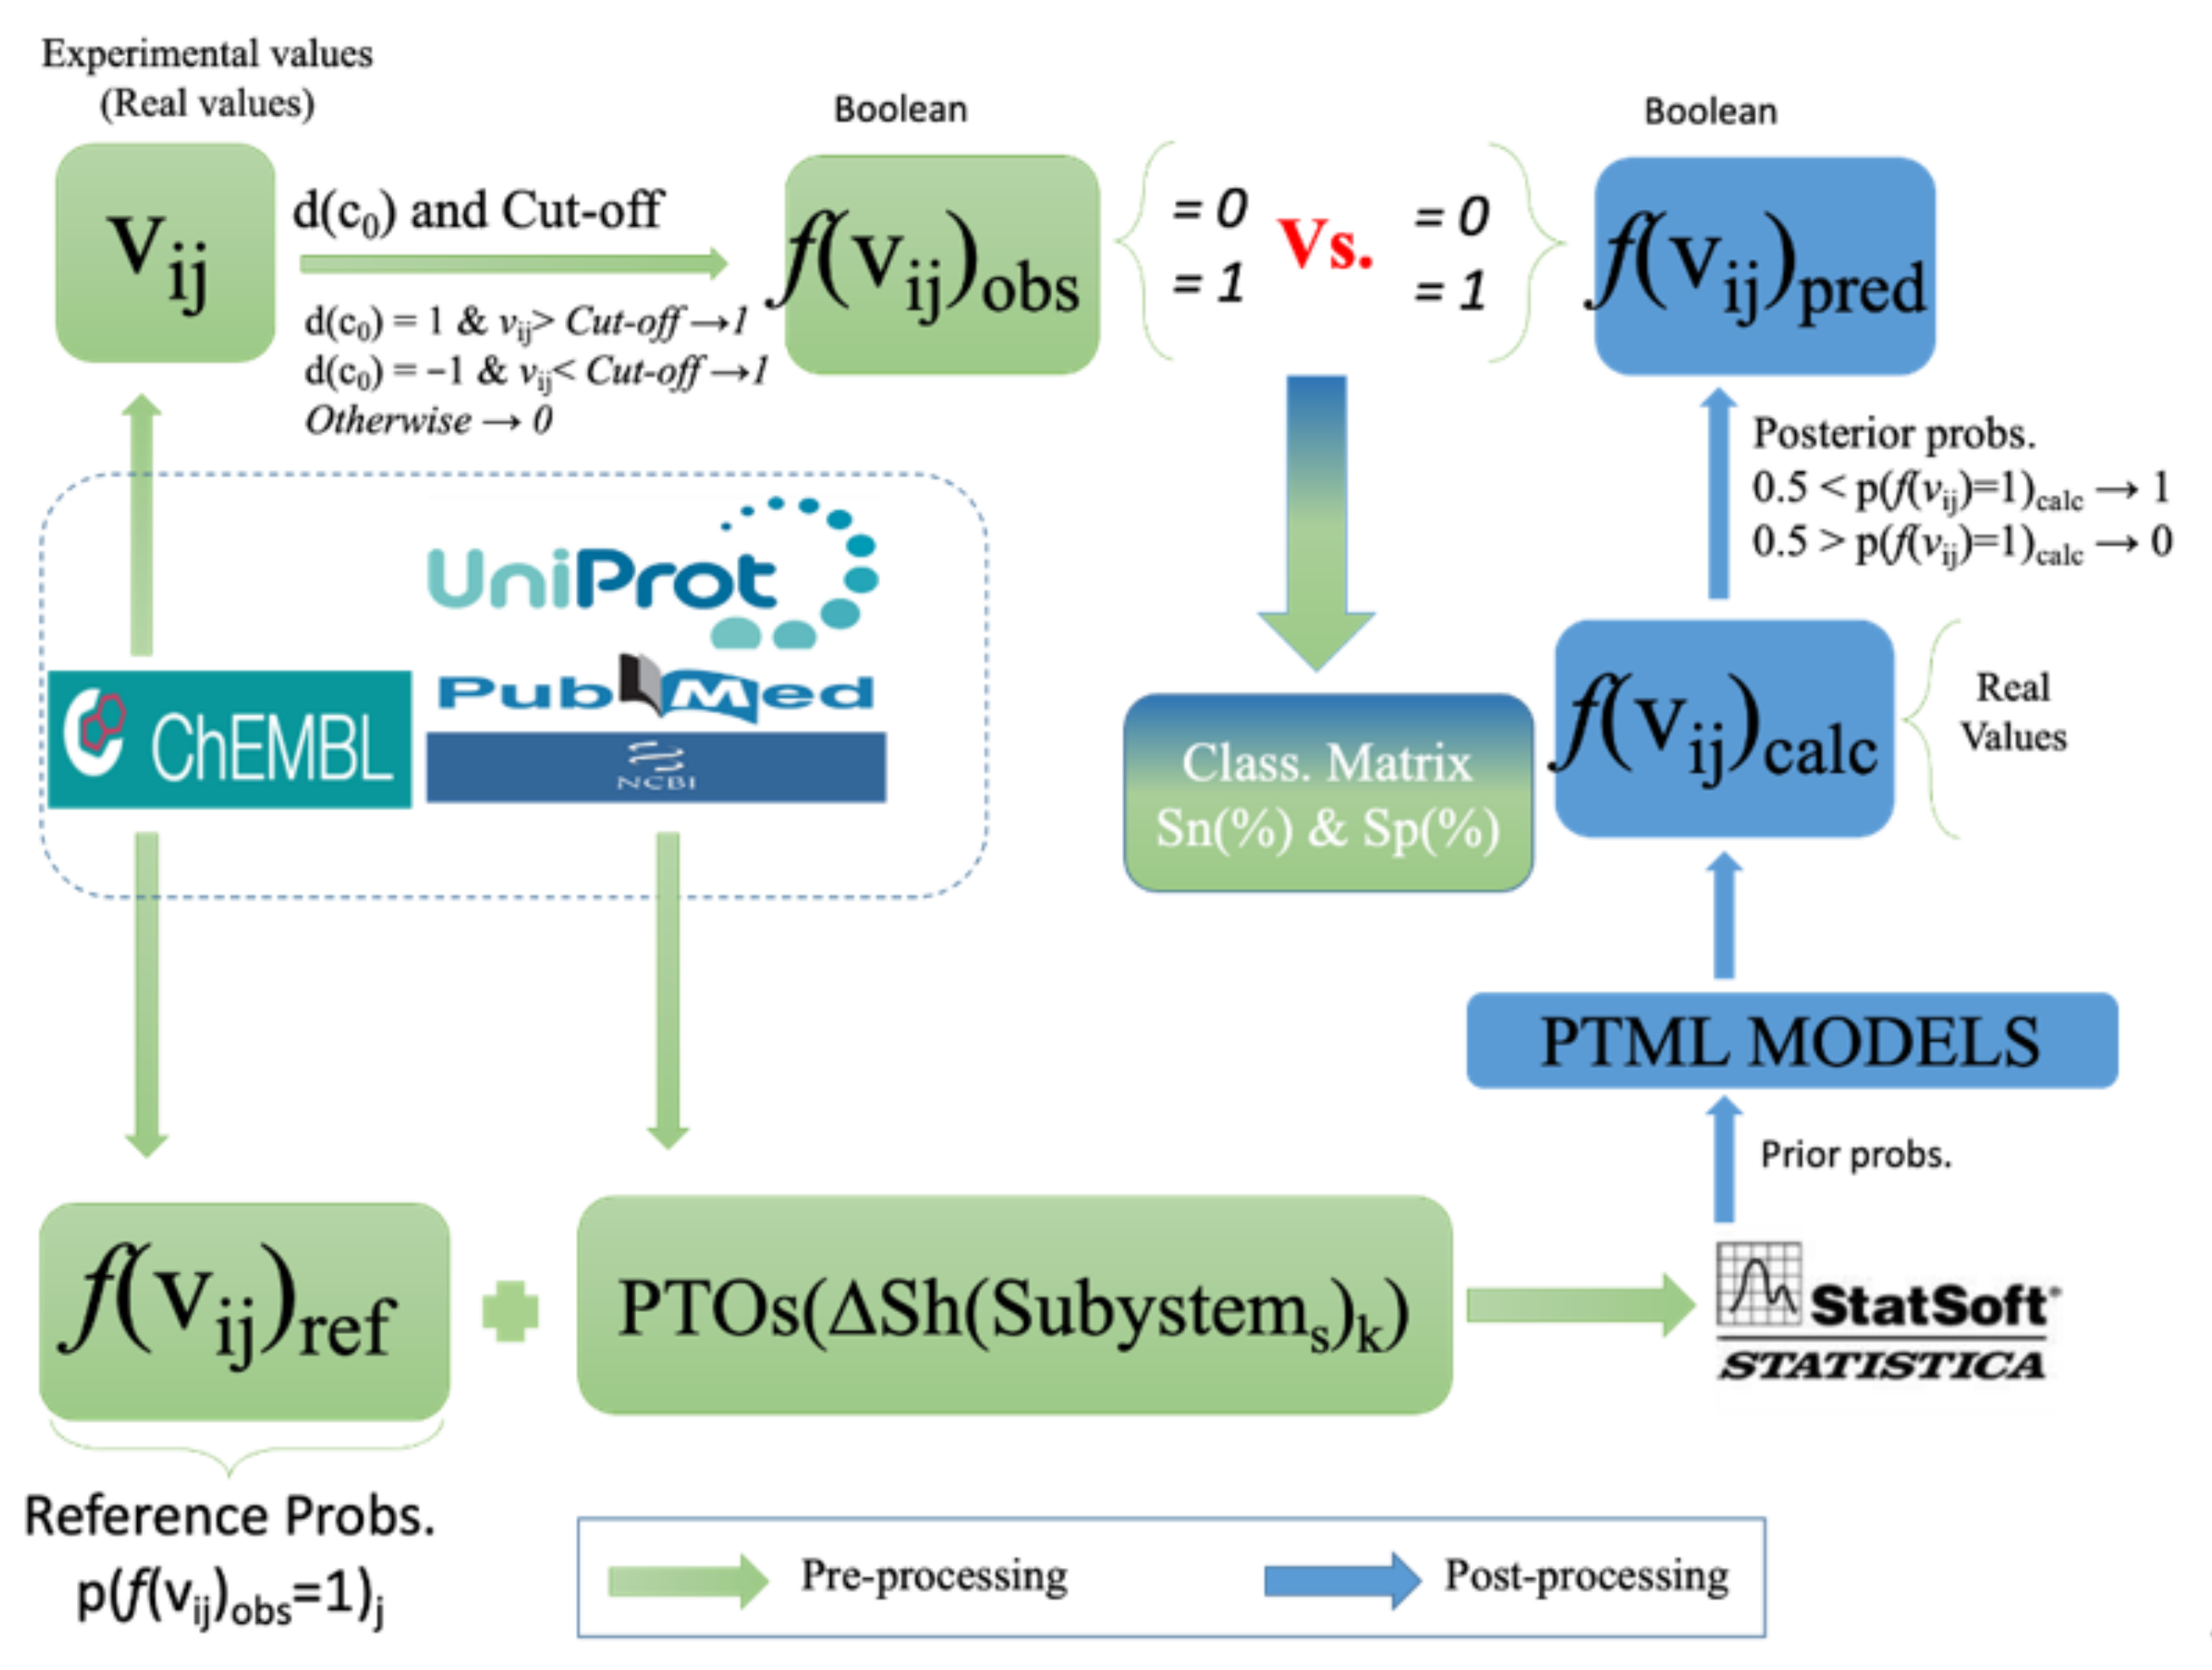
4.7. Output Variable and Function of Reference
4.8. Shannon Entropy Measures
4.9. Partitions of Categorical Variables
4.10. Perturbation-Theory Operators (PTOs)
4.11. IFPTMLModel Training and Validation
5. Conclusions
Supplementary Materials
Author Contributions
Funding
Institutional Review Board Statement
Informed Consent Statement
Data Availability Statement
Conflicts of Interest
References
- Alonso, P.; Noor, A.M. The global fight against malaria is at crossroads. Lancet 2017, 390, 2532–2534. [Google Scholar] [CrossRef]
- Kalanon, M.; McFadden, G.I. Malaria, Plasmodium falciparum and its apicoplast. Biochem. Soc. Trans. 2010, 38, 775–782. [Google Scholar] [CrossRef]
- Gaillard, T.; Boxberger, M.; Madamet, M.; Pradines, B. Has doxycycline, in combination with anti-malarial drugs, a role to play in intermittent preventive treatment of Plasmodium falciparum malaria infection in pregnant women in Africa? Malar. J. 2018, 17, 469. [Google Scholar] [CrossRef]
- DiMasi, J.A.; Grabowski, H.G.; Hansen, R.W. Innovation in the pharmaceutical industry: New estimates of R&D costs. J. Health Econ. 2016, 47, 20–33. [Google Scholar]
- Gaulton, A.; Hersey, A.; Nowotka, M.; Bento, A.P.; Chambers, J.; Mendez, D.; Mutowo, P.; Atkinson, F.; Bellis, L.J.; Cibrian-Uhalte, E.; et al. The ChEMBL database in 2017. Nucleic Acids Res. 2017, 45, D945–D954. [Google Scholar] [CrossRef]
- Gaulton, A.; Bellis, L.J.; Bento, A.P.; Chambers, J.; Davies, M.; Hersey, A.; Light, Y.; McGlinchey, S.; Michalovich, D.; Al-Lazikani, B.; et al. ChEMBL: A large-scale bioactivity database for drug discovery. Nucleic Acids Res. 2012, 40, D1100–D1107. [Google Scholar] [CrossRef] [Green Version]
- Wolfsberg, T.G. Using the NCBI map viewer to browse genomic sequence data. Curr. Protoc. Bioinform. 2010, 29, 1–5. [Google Scholar] [CrossRef] [PubMed]
- Coordinators, N.R. Database resources of the National Center for Biotechnology Information. Nucleic Acids Res. 2018, 46, D13–D21. [Google Scholar] [CrossRef] [Green Version]
- UniProt Consortium. UniProt: A worldwide hub of protein knowledge. Nucleic Acids Res. 2019, 47, D506–D515. [Google Scholar] [CrossRef] [PubMed] [Green Version]
- UniProt Consortium. UniProt: The universal protein knowledgebase. Nucleic Acids Res. 2018, 46, 2699. [Google Scholar] [CrossRef] [PubMed] [Green Version]
- Pundir, S.; Martin, M.J.; O’Donovan, C. UniProt Protein Knowledgebase. Methods Mol. Biol. 2017, 1558, 41–55. [Google Scholar]
- Gonzalez-Diaz, H.; Arrasate, S.; Gomez-SanJuan, A.; Sotomayor, N.; Lete, E.; Besada-Porto, L.; Ruso, J.M. General theory for multiple input-output perturbations in complex molecular systems. 1. linear QSPR electronegativity models in physical, organic, and medicinal chemistry. Curr. Top. Med. Chem. 2013, 13, 1713–1741. [Google Scholar] [CrossRef] [PubMed]
- Santana, R.; Zuluaga, R.; Gañán, P.; Arrasate, S.; Onieva, E.; González-Díaz, H. Designing nanoparticle release systems for drug-vitamin cancer co-therapy with multiplicative perturbation-theory machine learning (PTML) models. Nanoscale 2019, 11, 21811–21823. [Google Scholar] [CrossRef] [PubMed]
- Nocedo-Mena, D.; Cornelio, C.; Camacho-Corona, M.D.R.; Garza-Gonzalez, E.; Waksman de Torres, N.; Arrasate, S.; Sotomayor, N.; Lete, E.; Gonzalez-Diaz, H. Modeling antibacterial activity with machine learning and fusion of chemical structure information with microorganism metabolic networks. J. Chem. Inf. Model. 2019, 59, 1109–1120. [Google Scholar] [CrossRef] [PubMed]
- Shannon, C.E. A Mathematical theory of communication. Bell Syst. Tech. J. 1948, 27, 379–423. [Google Scholar] [CrossRef] [Green Version]
- Graham, D.J. Information content in organic molecules: Structure considerations based on integer statistics. J. Chem. Inf. Comput. Sci. 2002, 42, 215. [Google Scholar] [CrossRef]
- Graham, D.J.; Malarkey, C.; Schulmerich, M.V. Information content in organic molecules: Quantification and statistical structure via brownian processing. J. Chem. Inf. Comput. Sci. 2004, 44, 1601–1611. [Google Scholar] [CrossRef]
- Graham, D.J.; Schacht, D. Base Information content in organic molecular formulae. J. Chem. Inf. Comput. Sci. 2000, 40, 942. [Google Scholar] [CrossRef]
- Graham, D.J.; Schulmerich, M.V. Information content in organic molecules: Reaction pathway analysis via brownian processing. J. Chem. Inf. Comput. Sci. 2004, 44, 1612–1622. [Google Scholar] [CrossRef] [PubMed]
- Graham, D.J. Information content and organic molecules: Aggregation states and solvent effects. J. Chem. Inf. Model. 2005, 45, 1223–1236. [Google Scholar] [CrossRef]
- Graham, D.J. Information content in organic molecules: Brownian processing at low levels. J. Chem. Inf. Model. 2007, 47, 376–389. [Google Scholar] [CrossRef] [PubMed]
- Contreras-Torres, E.; Marrero-Ponce, Y.; Teran, J.E.; Garcia-Jacas, C.R.; Brizuela, C.A.; Sanchez-Rodriguez, J.C. MuLiMs-MCoMPAs: A novel multiplatform framework to compute tensor algebra-based three-dimensional protein descriptors. J. Chem. Inf. Model. 2019, 60, 1042–1059. [Google Scholar] [CrossRef] [PubMed]
- Martinez-Lopez, Y.; Marrero-Ponce, Y.; Barigye, S.J.; Teran, E.; Martinez-Santiago, O.; Zambrano, C.H.; Torres, F.J. When global and local molecular descriptors are more than the sum of its parts: Simple, but not simpler? Mol. Divers. 2019, 24, 913–932. [Google Scholar] [CrossRef]
- Valdes-Martini, J.R.; Marrero-Ponce, Y.; Garcia-Jacas, C.R.; Martinez-Mayorga, K.; Barigye, S.J.; Vazd’Almeida, Y.S.; Pham-The, H.; Perez-Gimenez, F.; Morell, C.A. QuBiLS-MAS, open source multi-platform software for atom- and bond-based topological (2D) and chiral (2.5D) algebraic molecular descriptors computations. J. Cheminform. 2017, 9, 35. [Google Scholar] [CrossRef]
- Ruiz-Blanco, Y.B.; Paz, W.; Green, J.; Marrero-Ponce, Y. ProtDCal: A program to compute general-purpose-numerical descriptors for sequences and 3D-structures of proteins. BMC Bioinform. 2015, 16, 162. [Google Scholar] [CrossRef] [Green Version]
- Ruiz-Blanco, Y.B.; Marrero-Ponce, Y.; Paz, W.; Garcia, Y.; Salgado, J. Global stability of protein folding from an empirical free energy function. J. Theor. Biol. 2013, 321, 44–53. [Google Scholar] [CrossRef]
- Barigye, S.J.; Marrero-Ponce, Y.; Martinez-Lopez, Y.; Torrens, F.; Artiles-Martinez, L.M.; Pino-Urias, R.W.; Martinez-Santiago, O. Relations frequency hypermatrices in mutual, conditional and joint entropy-based information indices. J. Comput. Chem. 2013, 34, 259–274. [Google Scholar] [CrossRef]
- Munteanu, C.R.; Gonzalez-Diaz, H.; Borges, F.; de Magalhaes, A.L. Natural/random protein classification models based on star network topological indices. J. Theor. Biol. 2008, 254, 775–783. [Google Scholar] [CrossRef]
- Quevedo-Tumailli, V.F.; Ortega-Tenezaca, B.; Gonzalez-Diaz, H. Chromosome gene orientation inversion networks (GOINs) of plasmodium proteome. J. Proteome Res. 2018, 17, 1258–1268. [Google Scholar] [CrossRef] [PubMed]
- Mendez, D.; Gaulton, A.; Bento, A.P.; Chambers, J.; De Veij, M.; Felix, E.; Magarinos, M.P.; Mosquera, J.F.; Mutowo, P.; Nowotka, M.; et al. ChEMBL: Towards direct deposition of bioassay data. Nucleic Acids Res. 2019, 47, D930–D940. [Google Scholar] [CrossRef]
- Nowotka, M.M.; Gaulton, A.; Mendez, D.; Bento, A.P.; Hersey, A.; Leach, A. Using ChEMBL web services for building applications and data processing workflows relevant to drug discovery. Expert Opin. Drug. Discov. 2017, 12, 757–767. [Google Scholar] [PubMed]
- Davies, M.; Nowotka, M.; Papadatos, G.; Dedman, N.; Gaulton, A.; Atkinson, F.; Bellis, L.; Overington, J.P. ChEMBL web services: Streamlining access to drug discovery data and utilities. Nucleic Acids Res. 2015, 43, W612–W620. [Google Scholar] [CrossRef] [Green Version]
- Bento, A.P.; Gaulton, A.; Hersey, A.; Bellis, L.J.; Chambers, J.; Davies, M.; Kruger, F.A.; Light, Y.; Mak, L.; McGlinchey, S.; et al. The ChEMBL bioactivity database: An update. Nucleic Acids Res. 2014, 42, D1083–D1090. [Google Scholar] [CrossRef] [Green Version]
- Sastry, G.M.; Inakollu, V.S.; Sherman, W. Boosting virtual screening enrichments with data fusion: Coalescing hits from two-dimensional fingerprints, shape, and docking. J. Chem. Inf. Model. 2013, 53, 1531–1542. [Google Scholar] [CrossRef]
- Willett, P. Combination of similarity rankings using data fusion. J. Chem. Inf. Model. 2013, 53, 1–10. [Google Scholar] [CrossRef]
- Whittle, M.; Gillet, V.J.; Willett, P.; Loesel, J. Analysis of data fusion methods in virtual screening: Similarity and group fusion. J. Chem. Inf. Model. 2006, 46, 2206–2219. [Google Scholar] [CrossRef]
- Whittle, M.; Gillet, V.J.; Willett, P.; Loesel, J. Analysis of data fusion methods in virtual screening: Theoretical model. J. Chem. Inf. Model. 2006, 46, 2193–2205. [Google Scholar] [CrossRef] [PubMed]
- Weininger, D. SMILES, a chemical language and information system. 1. Introduction to methodology and encoding rules. J. Chem. Inf. Model. 1988, 28, 31–36. [Google Scholar] [CrossRef]
- Toropov, A.A.; Benfenati, E. SMILES as an alternative to the graph in QSAR modelling of bee toxicity. Comput. Biol. Chem. 2007, 31, 57–60. [Google Scholar] [CrossRef] [PubMed]
- Veselinovic, A.M.; Milosavljevic, J.B.; Toropov, A.A.; Nikolic, G.M. SMILES-based QSAR model for arylpiperazines as high-affinity 5-HT(1A) receptor ligands using CORAL. Eur. J. Pharm. Sci. 2013, 48, 532–541. [Google Scholar] [CrossRef] [PubMed]
- Leone, C.; Bertuzzi, E.E.; Toropova, A.P.; Toropov, A.A.; Benfenati, E. CORAL: Predictive models for cytotoxicity of functionalized nanozeolites based on quasi-SMILES. Chemosphere 2018, 210, 52–56. [Google Scholar] [CrossRef]
- Pogany, P.; Arad, N.; Genway, S.; Pickett, S.D. De novo molecule design by translating from reduced graphs to SMILES. J. Chem. Inf. Model. 2019, 59, 1136–1146. [Google Scholar] [CrossRef] [PubMed]
- Toropova, A.P.; Toropov, A.A. Quasi-SMILES: Quantitative structure-activity relationships to predict anticancer activity. Mol. Divers. 2019, 23, 403–412. [Google Scholar] [CrossRef]
- Zheng, S.; Yan, X.; Yang, Y.; Xu, J. Identifying structure-property relationships through SMILES syntax analysis with self-attention mechanism. J. Chem. Inf. Model. 2019, 59, 914–923. [Google Scholar] [CrossRef] [Green Version]
- Prado-Prado, F.; García-Mera, X.; Abeijón, P.; Alonso, N.; Caamaño, O.; Yáñez, M.; Gárate, T.; Mezo, M.; González-Warleta, M.; Muiño, L.; et al. Using entropy of drug and protein graphs to predict FDA drug-target network: Theoretic-experimental study of MAO inhibitors and hemoglobin peptides from Fasciola hepatica. Eur. J. Med. Chem. 2011, 46, 1074–1094. [Google Scholar] [CrossRef] [PubMed]
- Hill, T.; Lewicki, P. STATISTICS Methods and Applications. A Comprehensive Reference for Science, Industry and Data Mining; StatSoft: Tulsa, OK, USA, 2006; Volume 1, p. 813. [Google Scholar]
- Tilley, L.; Rosenthal, P.J. Malaria parasites fine-tune mutations to resist drugs. Nature 2019, 576, 217–219. [Google Scholar] [CrossRef]
- Zhao, L.; Pi, L.; Qin, Y.; Lu, Y.; Zeng, W.; Xiang, Z.; Qin, P.; Chen, X.; Li, C.; Zhang, Y.; et al. Widespread resistance mutations to sulfadoxine-pyrimethamine in malaria parasites imported to China from Central and Western Africa. Int. J. Parasitol. Drugs Drug Resist. 2019, 12, 1–6. [Google Scholar] [CrossRef] [PubMed]


| Observed | Statistical | Predicted | Predicted Sets | ||
|---|---|---|---|---|---|
| Setsa | Parameterb | Statistics | nj | f(vij)pred = 0 | f(vij)pred = 1 |
| Training Series | |||||
| f(vij)obs= 0 | Sp(%) | 98.8 | 13,087 | 12,934 | 153 |
| f(vij)obs = 1 | Sn(%) | 65.9 | 232 | 79 | 153 |
| total | Ac(%) | 98.3 | 13,319 | ||
| External Validation Series | |||||
| f(vij)obs= 0 | Sp(%) | 98.7 | 4365 | 4310 | 55 |
| f(vij)obs = 1 | Sn(%) | 66.2 | 74 | 25 | 49 |
| total | Ac(%) | 98.2 | 4439 | ||
| c0 = Activity (Units) | Cut-off(c0) | Total | |||||||
|---|---|---|---|---|---|---|---|---|---|
| 1 | 10 | 25 | 50 | 75 | 95 | 100 | 200 | ||
| Inhibition (%) | 9785 | 1535 | 564 | 376 | 228 | 78 | 39 | - | 13,469 |
| IC50 (nM) | 2 | 29 | 49 | 81 | 101 | 108 | 110 | 133 | 3715 |
| Ki (nM) | 24 | 78 | 100 | 120 | 132 | 134 | 138 | 160 | 369 |
| Other Activities | 59 | 133 | 146 | 148 | 150 | 149 | 150 | 152 | 205 |
| n(f(vij)=1) | 9870 | 1775 | 859 | 725 | 611 | 469 | 437 | 445 | 17,758 |
| n(f(vij)=0) | 7888 | 15,983 | 16,899 | 17,033 | 17,147 | 17,289 | 17,321 | 17,313 | |
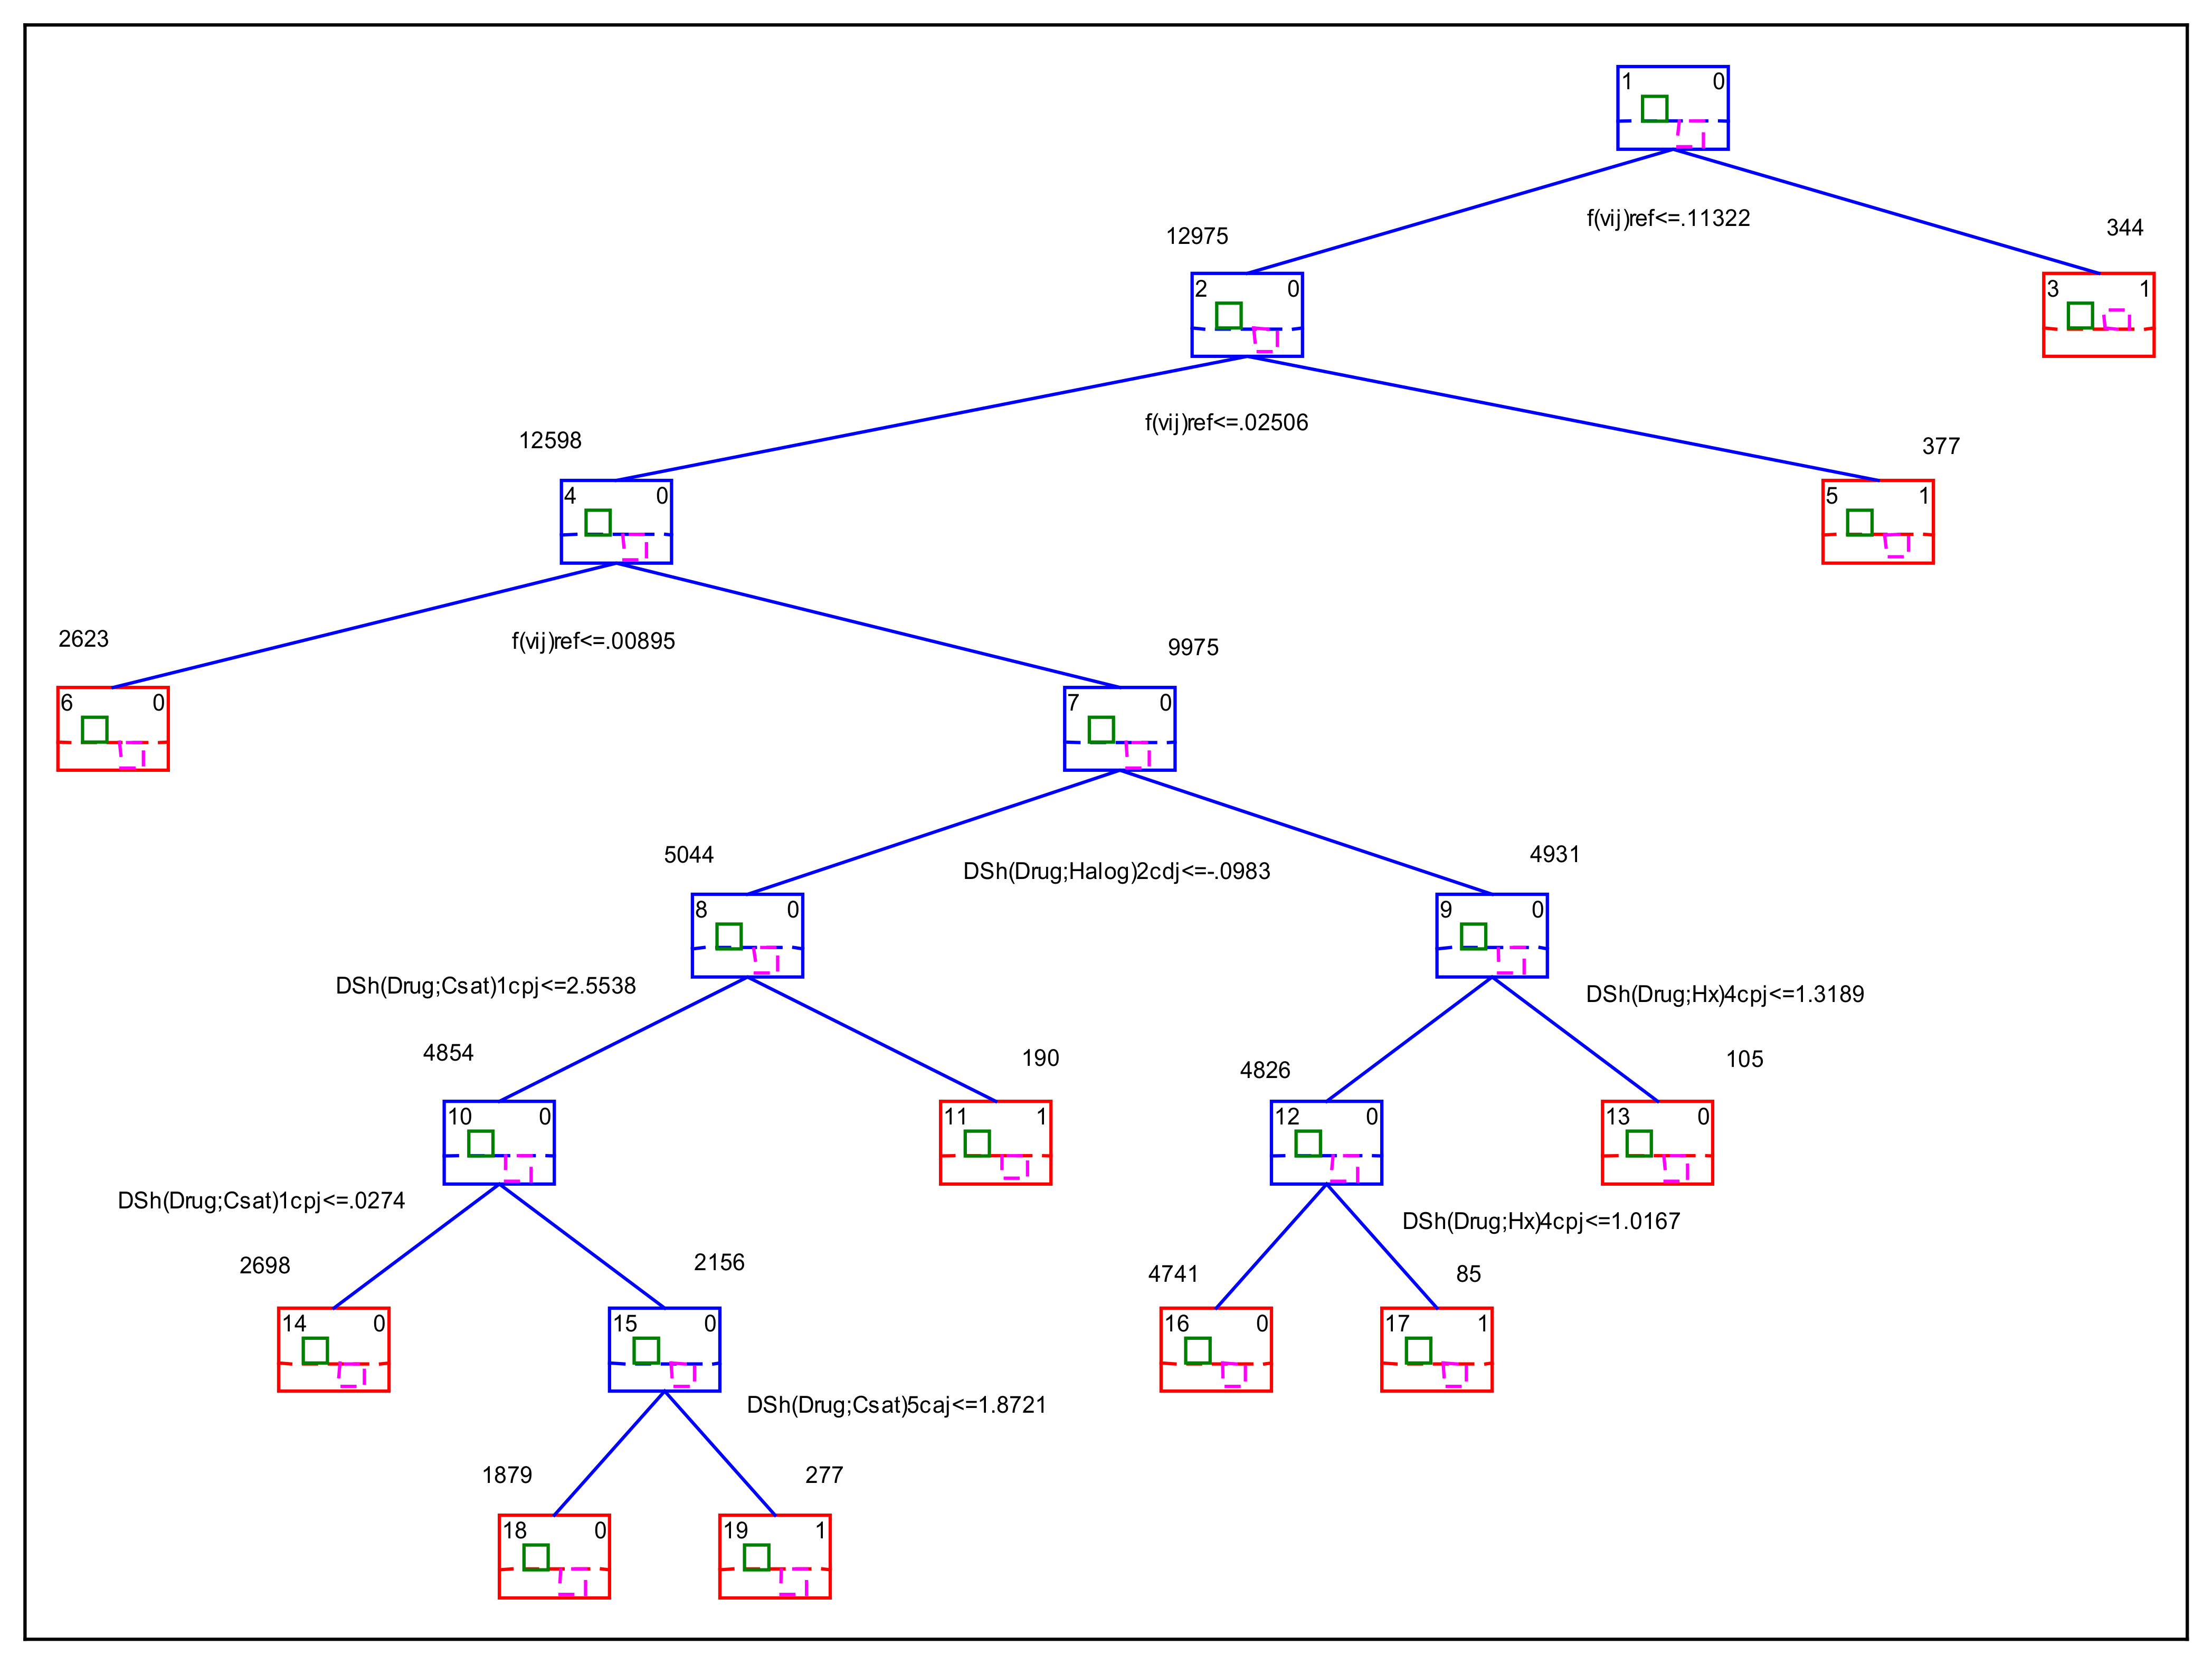
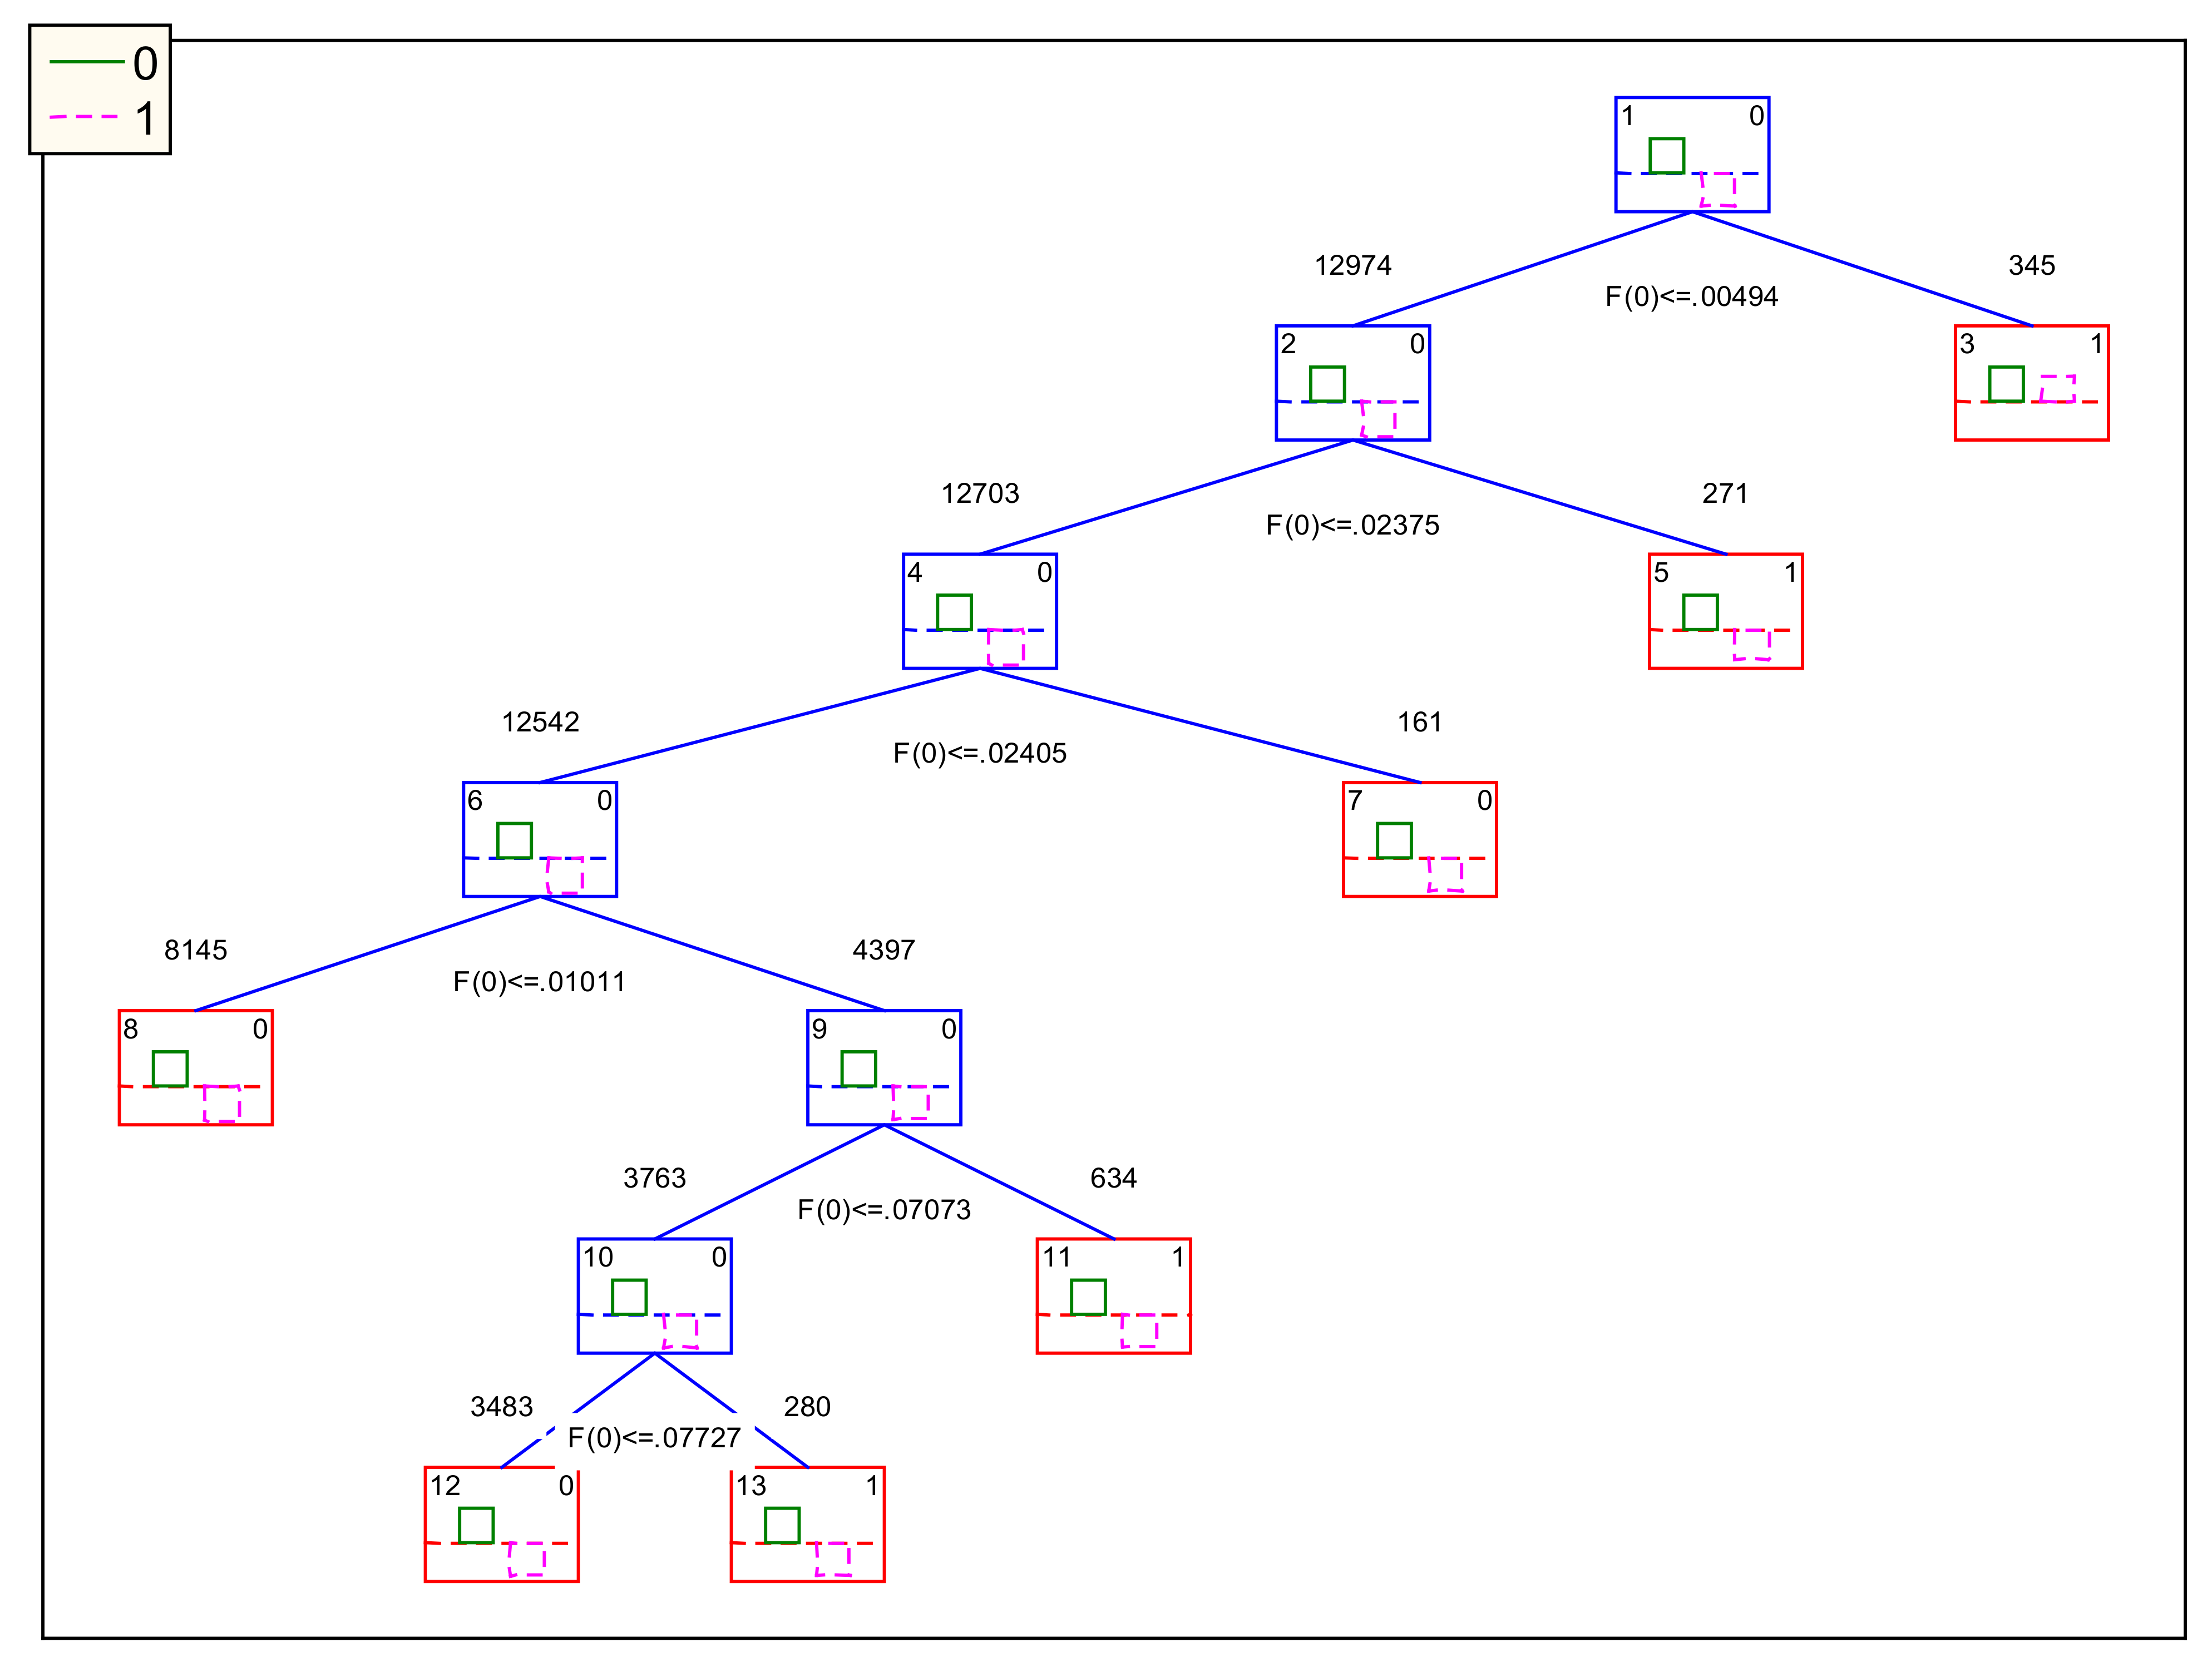
| Class | Left | Right | Control | Active | Predict. | Split | Split |
|---|---|---|---|---|---|---|---|
| Node | Branch | Branch | n(f(vij) = 0) | n(f(vij) = 1) | Class | Constant | Variable |
| 1 | 2 | 3 | 13,087 | 232 | 0 | 0.11321607 | f(vij)refi |
| 2 | 4 | 5 | 12,903 | 72 | 0 | 0.02505894 | f(vij)refi |
| 3 | 184 | 160 | 1 | -- | |||
| 4 | 6 | 7 | 12,542 | 56 | 0 | 0.00895431 | f(vij)refi |
| 5 | 361 | 16 | 1 | -- | |||
| 6 | 2623 | 0 | 0 | -- | |||
| 7 | 8 | 9 | 9919 | 56 | 0 | −0.0982586 | ΔSh(Drug;Halog)2cdj |
| 8 | 10 | 11 | 5006 | 38 | 0 | 2.55375728 | ΔSh(Drug;Csat)1cpj |
| 9 | 12 | 13 | 4913 | 18 | 0 | 1.318866 | ΔSh(Drug;Hx)4cpj |
| 10 | 14 | 15 | 4821 | 33 | 0 | 0.02739699 | ΔSh(Drug;Csat)1cpj |
| 11 | 185 | 5 | 1 | -- | |||
| 12 | 16 | 17 | 4809 | 17 | 0 | 1.01671015 | ΔSh(Drug;Hx)4cpj |
| 13 | 104 | 1 | 0 | -- | |||
| 14 | 2681 | 17 | 0 | -- | |||
| 15 | 18 | 19 | 2140 | 16 | 0 | 1.87205633 | ΔSh(Drug;Csat)5caj |
| 16 | 4726 | 15 | 0 | -- | |||
| 17 | 83 | 2 | 1 | -- | |||
| 18 | 1868 | 11 | 0 | -- | |||
| 19 | 272 | 5 | 1 | -- |
| Var | Coeff. | f(vij)01 | f(vij)02 | f(vij)03 | f(vij)04 | f(vij)05 | f(vij)06 | Mean | S.D. |
|---|---|---|---|---|---|---|---|---|---|
| Split const. | a00 | −0.005 | −0.024 | −0.024 | −0.010 | −0.071 | −0.077 | −0.04 | 0.03 |
| f(vij)ref | a01 | 0.044 | 0.762 | 0.751 | 0.818 | 2.678 | 2.881 | 1.32 | 1.17 |
| ΔSh(Drug;Csat)5caj | a02 | 0.000 | 0.008 | −0.001 | −0.003 | −0.008 | −0.007 | 0.00 | 0.01 |
| ΔSh(Drug;Hetero)5caj | a03 | −0.001 | −0.010 | −0.042 | −0.033 | −0.103 | −0.143 | −0.06 | 0.06 |
| ΔSh(Drug;Hx)1caj | a04 | 0.001 | 0.020 | 0.047 | 0.047 | 0.120 | 0.160 | 0.07 | 0.06 |
| ΔSh(Drug;Csat)1cpj | a05 | 0.001 | 0.014 | 0.020 | 0.023 | 0.083 | 0.093 | 0.04 | 0.04 |
| ΔSh(Drug;Hetero)4cpj | a06 | 0.001 | 0.009 | 0.036 | 0.028 | 0.078 | 0.109 | 0.04 | 0.04 |
| ΔSh(Drug;Hx)4cpj | a07 | −0.001 | −0.017 | −0.038 | −0.037 | −0.092 | −0.117 | −0.05 | 0.04 |
| ΔSh(Drug;Csat)1cdj | a08 | −0.001 | −0.019 | −0.016 | −0.017 | −0.065 | −0.079 | −0.03 | 0.03 |
| ΔSh(Drug;Halog)1cdj | a09 | 0.003 | 0.057 | 0.087 | 0.088 | 0.713 | 0.577 | 0.25 | 0.31 |
| ΔSh(Drug;Halog)2cdj | a10 | −0.003 | −0.059 | −0.094 | −0.095 | −0.740 | −0.609 | −0.27 | 0.32 |
| ΔSh(Chr;Gen)5caj | a11 | 0.000 | 0.000 | 0.002 | 0.002 | 0.039 | 0.075 | 0.02 | 0.03 |
| ΔSh(Prot;Seq)5cdj | a12 | 0.000 | 0.004 | −0.002 | −0.003 | 0.008 | 0.024 | 0.01 | 0.01 |
| Algorithm | Set | Class | Stat Param. | Value (%) | f(vij)pred = 0 | f(vij)pred = 1 |
|---|---|---|---|---|---|---|
| IFPTML GDA π0 = 0.30 π1 = 0.70 | Train | f(vij)obs = 0 | Sp | 98.8 | 12,934 | 153 |
| f(vij)obs = 1 | Sn | 65.9 | 79 | 153 | ||
| Validation | f(vij)obs = 0 | Sp | 98.7 | 4310 | 55 | |
| f(vij)obs = 1 | Sn | 66.2 | 25 | 49 | ||
| IFPTML CTUS π0 = 0.50 π1 = 0.50 | Train | f(vij)obs = 0 | Sp | 91.7 | 12,002 | 1085 |
| f(vij)obs = 1 | Sn | 81.0 | 44 | 188 | ||
| Validation | f(vij)obs = 0 | Sp | 91.6 | 3997 | 368 | |
| f(vij)obs = 1 | Sn | 82.4 | 13 | 61 | ||
| Train | f(vij)obs = 0 | Sp | 89.8 | 11,751 | 1336 | |
| IFPTML CTLC | f(vij)obs = 1 | Sn | 83.6 | 38 | 194 | |
| π0 = 0.50 π1 = 0.50 | Validation | f(vij)obs = 0 | Sp | 89.7 | 3917 | 448 |
| f(vij)obs = 1 | Sn | 85.1 | 11 | 63 |
| Variable | Excel Functions Syntax | Notes |
|---|---|---|
| nj(ca0) | =COUNTIF(Range(ca0), Criteria(ca0)) | Function that determines the total number of cases for each Biological activity in the dataset. |
| <vij(ca0)> | =AVERAGEIF (Range(ca0), Criteria(ca0), Range(vij)) | Calculates the average of all the standard values of biological activity in the dataset. It is used as an argument for the cutoff(ca0) function. |
| cutoff(ca0) | =IF(Units(ca0) = %, 95, IF(Units(ca0) = nM, 10, <vij(ca0)>) | The cutoff value is used to decide if the compounds is active or not. For the values of Activity(%) and Inhibition(%), the cutoff(ca0) = 95%.Similarly, for the IC50(nM), Ki(nM), and Km(nM), the cutoff(ca0) = 10 nM, etc. |
| d(ca0) | =OR(d(ca0) = 1, d(ca0) = −1) | Indicates that the measured parameter increases or decreases directly with a desired or not desired biological effect. |
| f(vij)obs | =IF(AND(vij> cutoff(ca0), d(ca0) = 1), 1, IF(AND(vij ≤ cutoff(ca0), d(ca0) = −1), 1, 0)) | f(vij)obs = 1 for active compounds or f(vij)obs = 0 for control group according to the set of cutoff and desirability values used for each ca0. It is the function used as output to train the IFPTML model. |
| n(f(vij) =1) | =COUNTIF(Range(ca0), Criteria(ca0), Range(f(vij)obs, 1)) | Function that determines the total number of each Biological activity in the dataset and f(vij)obs equal to 1. |
| f(vij)ref | =n(f(vij)=1)/nj(ca0) | The function of reference f(vij)ref = p(f(vij)=1/ca0) is the probability with which the observed function gets the value f(vij)obs = 1, positive assay. It is used as the first input variable of the IFPTML model. |
| Partition (cj) | Var. | Information | NLa | Unique Levels |
|---|---|---|---|---|
| cassayj (caj) | ca0 | Biological activity | 22 | Inhibition(%); IC50(nM); Ki(nM); IC50(ug.mL−1); BHIA50(-); IC50(mill equivalent); FC(-); Kinact(/min); Activity(%); VAR(-); Ratio(-); Ratio(/M/s); IC50(molar ratio); Ratio IC50(-); Mean(pM mg−1); GST activity (mU mg−1); Km(nM); Ratio(/s/M); Activity(-); Ka(103/M/s); Kcat(/s); Inhibition(uM) |
| ca1 | UniProt protein accession ID | 28 | Q8MU52; Q3HTL5; Q9NBA7; Q9NFS5; Q8T6J6; Q25856; P39898; Q9N6S8; Q0PJ46; Q6T755; Q8MMZ4; Q868D6; Q25917; Q9GSW0; Q9NAW4; O77078; Q9NAW2; Q9BJJ9; Q8T6B1; Q9N623; Q9XYC7; P05227; P11144; Q17SB2; O77239; Q9Y006; O96214; O97467 | |
| ca2 | Assay Organism | 9 | Plasmodium falciparum; Plasmodium falciparum K1; Plasmodium falciparum NF54; Plasmodium falciparum Dd2; Plasmodium sp.; Plasmodium yoelii; Plasmodium berghei; Leishmania Mexicana; ND (No registered data) | |
| cdataj (cdj) | cd0 | Target mapping | 2 | Protein; Homologous protein |
| cd1 | APD name | 9 | Peptidase C1; Pkinase; Peptidase S8; Asp; OMPdecase; Spermine synth; Sugar tr; Hist deacetyl | |
| cd2 | APD confidence | 2 | ND (No-Data); high | |
| cd3 | Assay type | 2 | Binding (B) = Data measuring binding of compound to a molecular target.Functional (F) = Data measuring the biological effect of a compound. | |
| cd4 | Data curation level | 3 | Autocuration; Intermediate; Expert | |
| cd5 | Confidence score | 2 | 8 = Homologous single protein target assigned. 9 = Direct single protein target assigned | |
| cprotj (cpj) | cp0 | Gene | 32 | PF140187; PF110161; PFB0325c; PF110301; PF100225; PF140341; PF140075; PF110165; PF130141; MAL13P1.214; PF140346; PFE0355c; PF140294; PF140125; PF110162; PFB0505c; PF140511; PF140076; PFE0370c; PF110147; PFB0330c; PFF0730c; PF140598; MAL7P1.27; PFI1260c; PFB0100c; PF080054; PF140077; MAL13P1.185; PF140078; PFB0150c; PFE1455w |
| cp1 | Chromosome | 10 | II; V; VI; VII; VIII; IX; X; XI; XIII; XIV | |
| cp2 | Orientation | 2 | Downstream = −1; Upstream = 1 | |
| cp3 | Protein function (UniProt) | 31 | Glutathione s-transferase, putative; Falcipain-2 precursor; Cysteine protease, putative; Spermidine synthase; Orotidine-monophosphate-decarboxylase, putative; Glucose-6-phosphate isomerase; Plasmepsin, putative; Falcipain 2 precursor; l-lactate dehydrogenase; phosphoethanolamineN-methyltransferase; cGMP-dependent protein kinase 1, beta isozyme, putative; Serine protease belonging to subtilisin family, putative; Mitogen-activated protein kinase 1; Deoxyhypusine synthase; Falcipain-3; Beta-ketoacyl-acyl carrier protein synthase III precursor, putative; Glucose-6-phosphate dehydrogenase-6-phosphogluconolactonase; Plasmepsin 1 precursor; Subtilisin-like protease precursor, putative; Mitogen-activated protein kinase 2; Enoyl-acyl carrier reductase; Glyceraldehyde-3-phosphate dehydrogenase; Chloroquine resistance transporter, putative; Histone deacetylase; Knob associated histidine-rich protein; Heat shock 70 kDa protein; Plasmepsin 2 precursor; CDK-related protein kinase 6; HAP protein; Protein kinase, putative; Sugar transporter, putative | |
| cp4 | ChEMBL target function type | 5 | Enzyme; Transporter; Epigenetic regulator; Other cytosolic protein; Unclassified Protein |
| Variable Type | Symbol | Formula | Categorical Variables | Details |
|---|---|---|---|---|
| - | f(vij)ref | n(f(vij)expt = 1)/nj | ca0 | Expected value of probability p(f(vij) =1)ref for the activity vij of type ca0. |
| MMAcaj | ΔSh(Drugi)k,caj | Sh(Drugi)k– ⟨Sh(Drug)k,caj⟩ | caj | Variation (Δ) of the information of the structure of the drugin different subsets of multiple categorical variables related to the pharmacological assay caj. |
| MMAcdj | ΔSh(Drugi)k,cdj | Sh(Drugi)k –⟨ Sh(Drug)k,cdj⟩ | cdj | Variation (Δ) of the information of the structure of the drugin different subsets of multiple categorical variables related to the nature and/or accuracy of the data measuredcdj. |
| ΔSh (Proti)k,cpj | Sh(Proti)k− ⟨Sh(Prot)k,cpj⟩ | Variation (Δ) of the information of the sequence of the protein, sequence of the gene, and information about the chromosome for different subsets of multiple categorical variables related tothe nature of the protein target cpj. | ||
| MMAcpj | ΔSh (Genei)k,cpj | Sh(Genei)k− ⟨Sh(Gene)k,cpj⟩ | cpj | |
| ΔSh (Chromi)k,cpj | Sh(Chromi)k− ⟨Sh(Chrom)k,cpj⟩ |
Publisher’s Note: MDPI stays neutral with regard to jurisdictional claims in published maps and institutional affiliations. |
© 2021 by the authors. Licensee MDPI, Basel, Switzerland. This article is an open access article distributed under the terms and conditions of the Creative Commons Attribution (CC BY) license (https://creativecommons.org/licenses/by/4.0/).
Share and Cite
Quevedo-Tumailli, V.; Ortega-Tenezaca, B.; González-Díaz, H. IFPTML Mapping of Drug Graphs with Protein and Chromosome Structural Networks vs. Pre-Clinical Assay Information for Discovery of Antimalarial Compounds. Int. J. Mol. Sci. 2021, 22, 13066. https://0-doi-org.brum.beds.ac.uk/10.3390/ijms222313066
Quevedo-Tumailli V, Ortega-Tenezaca B, González-Díaz H. IFPTML Mapping of Drug Graphs with Protein and Chromosome Structural Networks vs. Pre-Clinical Assay Information for Discovery of Antimalarial Compounds. International Journal of Molecular Sciences. 2021; 22(23):13066. https://0-doi-org.brum.beds.ac.uk/10.3390/ijms222313066
Chicago/Turabian StyleQuevedo-Tumailli, Viviana, Bernabe Ortega-Tenezaca, and Humberto González-Díaz. 2021. "IFPTML Mapping of Drug Graphs with Protein and Chromosome Structural Networks vs. Pre-Clinical Assay Information for Discovery of Antimalarial Compounds" International Journal of Molecular Sciences 22, no. 23: 13066. https://0-doi-org.brum.beds.ac.uk/10.3390/ijms222313066