Article

A Hybrid Machine Learning and Network Analysis Approach Reveals Two Parkinson’s Disease Subtypes from 115 RNA-Seq Post-Mortem Brain Samples

1
Data Science Unit, IRCCS Santa Lucia Foundation c/o CERC, 00143 Rome, Italy
2
Genomic Medicine Laboratory UILDM, IRCCS Santa Lucia Foundation, 00179 Rome, Italy
3
Medical Genetics Laboratory, Department of Biomedicine and Prevention, Tor Vergata University, 00133 Rome, Italy
4
Experimental and Behavioral Neurophysiology, IRCCS Santa Lucia Foundation c/o CERC, 00143 Rome, Italy
5
Department of Clinical and Behavioral Neurology, IRCCS Santa Lucia Foundation, 00179 Rome, Italy
6
Department of Biomedical Sciences, Catholic University Our Lady of Good Counsel, 1000 Tirana, Albania
7
UILDM Lazio ONLUS Foundation, Department of Biomedicine and Prevention, Tor Vergata University, 00133 Rome, Italy
*
Author to whom correspondence should be addressed.
These authors contributed equally to this work.
Int. J. Mol. Sci. 2022, 23(5), 2557; https://0-doi-org.brum.beds.ac.uk/10.3390/ijms23052557
Submission received: 21 January 2022 / Revised: 16 February 2022 / Accepted: 24 February 2022 / Published: 25 February 2022
(This article belongs to the Special Issue Complex Networks, Bio-Molecular Systems, and Machine Learning)

Abstract

:
Precision medicine emphasizes fine-grained diagnostics, taking individual variability into account to enhance treatment effectiveness. Parkinson’s disease (PD) heterogeneity among individuals proves the existence of disease subtypes, so subgrouping patients is vital for better understanding disease mechanisms and designing precise treatment. The purpose of this study was to identify PD subtypes using RNA-Seq data in a combined pipeline including unsupervised machine learning, bioinformatics, and network analysis. Two hundred and ten post mortem brain RNA-Seq samples from PD (n = 115) and normal controls (NCs, n = 95) were obtained with systematic data retrieval following PRISMA statements and a fully data-driven clustering pipeline was performed to identify PD subtypes. Bioinformatics and network analyses were performed to characterize the disease mechanisms of the identified PD subtypes and to identify target genes for drug repurposing. Two PD clusters were identified and 42 DEGs were found (p adjusted ≤ 0.01). PD clusters had significantly different gene network structures (p < 0.0001) and phenotype-specific disease mechanisms, highlighting the differential involvement of the Wnt/β-catenin pathway regulating adult neurogenesis. NEUROD1 was identified as a key regulator of gene networks and ISX9 and PD98059 were identified as NEUROD1-interacting compounds with disease-modifying potential, reducing the effects of dopaminergic neurodegeneration. This hybrid data analysis approach could enable precision medicine applications by providing insights for the identification and characterization of pathological subtypes. This workflow has proven useful on PD brain RNA-Seq, but its application to other neurodegenerative diseases is encouraged.

Graphical Abstract

1. Introduction

Parkinson’s disease (PD) is the most common age-related motor neurodegenerative disease, affecting more than 6 million people worldwide, with rising incidence and prevalence imposing a mounting socioeconomic burden on society [1,2,3] and currently, no disease-modifying treatments are available [4,5,6]. The genetic basis of PD has been evaluated with several genome-wide association studies (GWASs), finally reporting up to 90 PD-associated risk variants in various cohorts [7,8,9,10]. However, genetic variants account for ~20% of PD familial cases, while the etiology of most idiopathic cases is largely unclear as multiple genes and environmental factors are believed to be involved in idiopathic PD onset and progression [7]. Consequently, PD is heterogeneous in both clinical manifestations and progression, which serves as evidence for the existence of disease subtypes [11,12]. Defining which PD subtype we are facing is crucial to better understand underlying mechanisms, predict disease course, and eventually design personalized management strategies able to fully consider the genetic or other specific biological features that can be employed in a precision medicine approach addressed to match the patients’ needs [11,13,14,15].
Empirical clustering stratifies patients based on demographic factors, clinical parameters, and genetic factors, making use of expert-based a priori conceptions. Up to now, these applications have shown limited sensitivity in detecting clinically useful classes of PD patients, thus hindering the development and deployment of better suited treatments [16]. It has been shown that the use of a priori assumptions in stratifying patients with complex diseases like PD can be appealing due to its simplicity; nevertheless, this method has an arbitrary nature [16]. As an example, PD patients younger than 50 years of age represent only 5–10% of the total population [17] and thus they are simple to subset, whereas the later onset subtype (~90%) remains highly heterogeneous in its clinical presentation, and a clear boundary between groups is not easily achieved. The unreliability of this subtyping method became apparent as many studies used arbitrary cut-offs of 50, 55, and 60 [16,18]. Similarly, various authors have defined the motor subtypes of PD differently, providing ambiguous results for patient stratification, which indicates the arbitrary nature of a priori conceptions [16]. As a fine-grained diagnosis is pivotal for precision medicine applications, more sensitive methods are required. To this extent, data-driven clustering based on unsupervised machine learning (ML) could offer better results by applying unbiased statistical methods and a hypothesis-free approach. In fact, clustering algorithms aim at finding patterns within data distribution to define clusters, free from a priori assumptions about disease and patients. Data-driven subtyping applications on complex diseases are shaping our knowledge about the best suited treatments for patients with a fine-grained diagnostic definition, such as molecular subtypes of Alzheimer’s disease or colorectal cancer [19,20]. Coupling data-driven clustering methods with next-generation sequencing (NGS) is advancing biomedical research, and transcriptomics data from RNA-Seq can be used in gene-network analysis to identify gene co-expression/co-regulation patterns, refining our understanding of complex biological systems. Data-driven PD subtyping has so far provided heterogeneous results due to disparate data sources and methods of clustering, which hampers understanding of idiopathic PD subgrouping [16]. In fact, even if data-driven clustering is a hypothesis-free approach, its results are dependent on the choice of the number of clusters and the clustering technique used. A fully data-driven clustering pipeline would address these limitations, providing more detailed diagnoses to facilitate precision medicine applications.
To the best of our knowledge, there are no published attempts at molecular subtyping of PD. Transcriptomic profiling from RNA-Seq data provides an in-depth characterization of complex diseases affecting the brain, reflecting the heterogeneity in the biological profiles of such pathologies. Moreover, network biology has not been extensively applied to PD research due to the lack of available data, thus information about gene interactions and regulations in PD is still poor [21]. In addition, there are no available disease-modifying treatments for PD. Disease heterogeneity can be tidied up by coupling unsupervised ML methods with bioinformatics and network analyses on transcriptomic profiles. Regulatory network identification would highlight genes acting as key regulators in each subtype, which can be used in a drug repurposing pipeline to foster tailored treatment definition. Here we show the implementation of a fully data-driven clustering pipeline and its application to PD subtyping. Our proposed novel methodology for better detailing diagnosis and accelerating drug repurposing could provide new research insights for assessing the efficacy of treatments. Our hybrid data-driven workflow is applied to gene expression data from idiopathic PD post-mortem brain samples from Gene Expression Omnibus (GEO) and PubMed databases. We aim to demonstrate that coupling unsupervised ML for disease subtyping with bioinformatics and network analysis for regulatory network identification can clarify the molecular landscape of disease subtypes. The workflow integrates multiple unsupervised ML algorithms for disease subtyping, with independent clusterability assessment and best number of clusters determination. The clustering pipeline aims to optimize the internal clustering validation measures. Network and bioinformatics analyses have been used to isolate and characterize regulatory genes in common and specific disease networks. The obtained key genes from this workflow were tested in a drug repurposing pipeline, enabling us to propose a set of compounds with disease-modifying potential.

2. Results

2.1. Clustering Results and Clinical Characterization

Two subtypes of PD, namely PD Cluster 1 (PDC1, n = 50) and PD Cluster 2 (PDC2, n = 65), were identified through the cluster analysis pipeline on gene-expression data. Hierarchical K-means implementing the centroid method with Manhattan distance was selected as the best clustering algorithm based on validation metrics (Silhouetteavg = 0.40; Dunn = 0.05). The differences between PDC1 and PDC2 clinical and demographic variables were assessed. PDC2 lives longer than PDC1 (Wilcoxon Test p value = 0.03), and lower Braak scores than PDC1 were found (Fisher Test p value = 0.004), while no sex differences in the composition of the clusters were found (Fisher Test p value = 0.21) (Figure 1).

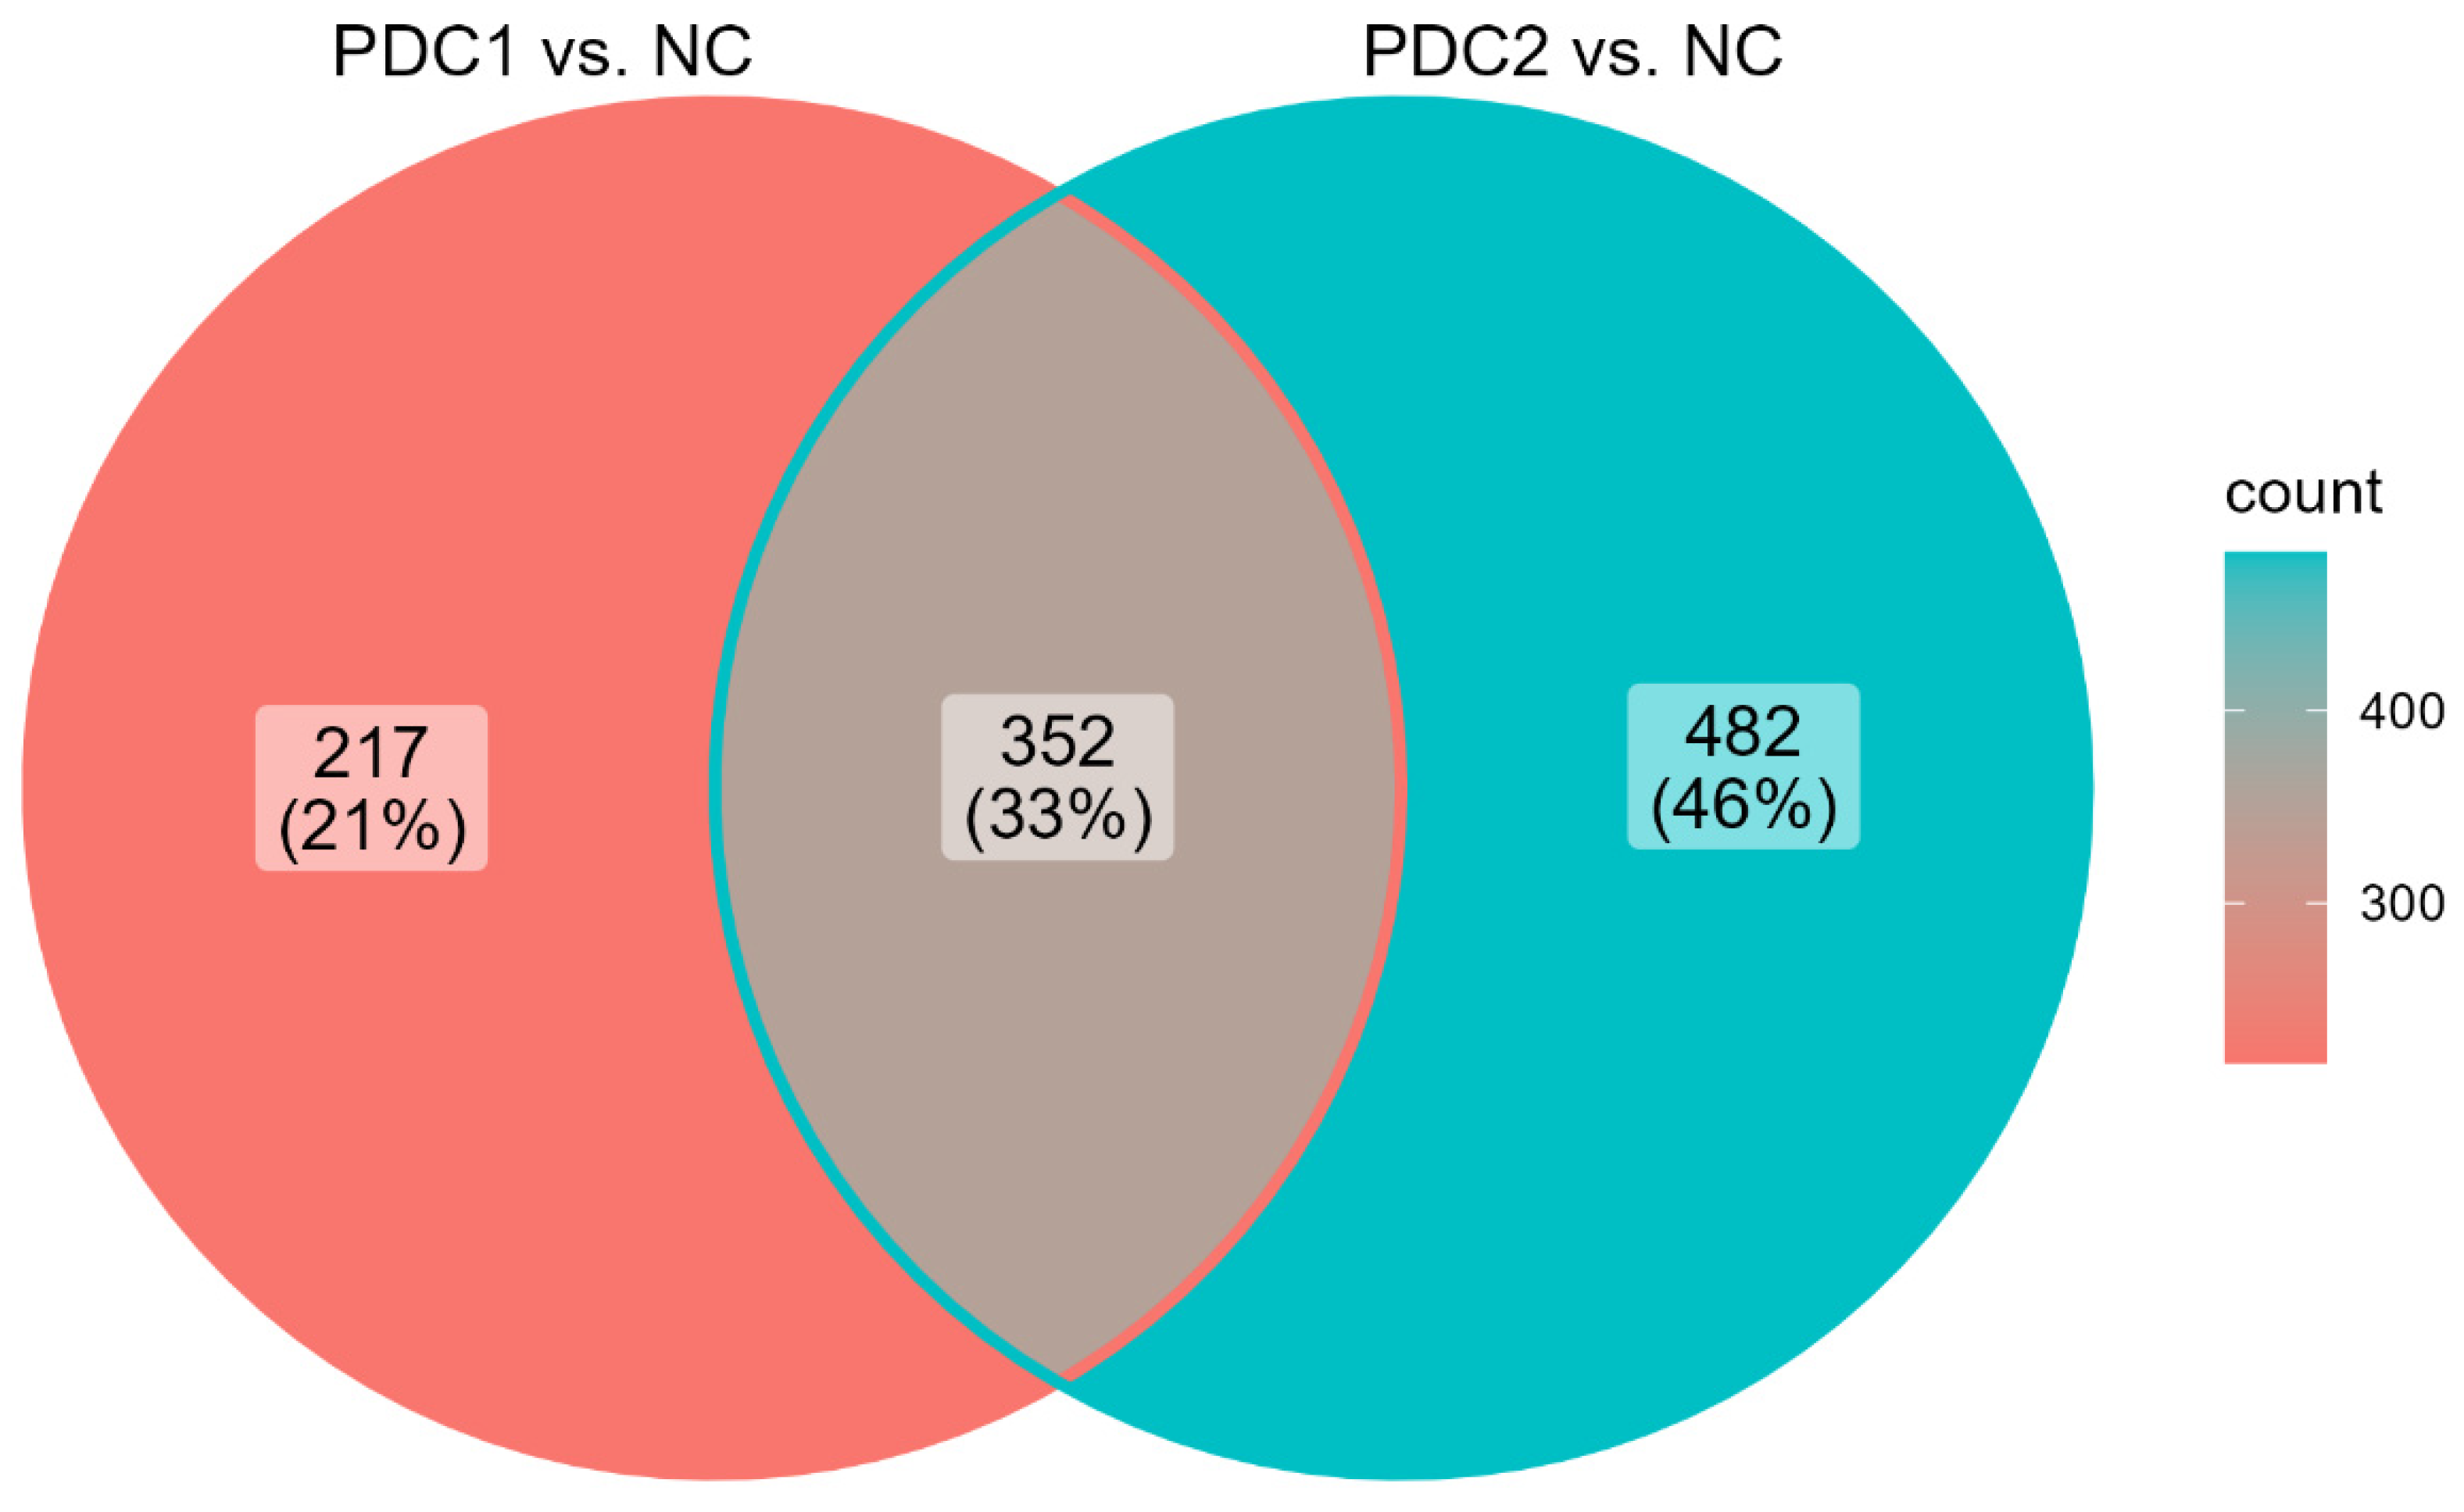
2.2. Differentially Expressed Genes in PDC1 vs. PDC2

To investigate the genetic background regulating the differences in the survival rate of the two PD clusters, we performed a differential gene expression analysis to retrieve DEGs. A comparison between the gene expression profiles of PDC1 and PDC2 was performed, yielding 42 DEGs with p adjusted ≤ 0.01 (Figure 2A). Among them, 6 transcription factors (TFs) were identified, mostly regulating the Wnt/β-catenin pathway including TBR1, the basic helix–loop–helix (bHLH) TF members NEUROD1, NEUROD2, NEUROD6, coupled with CBP/p300 modulators (CITED1, eEF1Bγ). Notably, only 6% of the DEGs were recognized as PD-associated genes by GDA analysis. Functional enrichment analysis revealed that DEGs were mostly enriched in protein complexes associated with CBP/p300 modulation in the Wnt/β-catenin pathway, namely IRF3-CBP (CORUM:299 p adjusted < 0.01), BETA2-Cyclin D1 (CORUM:2635 p adjusted < 0.01), SNW1 (CORUM:298 p adjusted < 0.05), and VEGF (CORUM:298 p adjusted < 0.05) complexes. Regulation of drug responses (GO:2001023 p adjusted < 0.05) was also altered between PDC1 and PDC2, with ADIRF and GRM2 overexpressed in PDC2. Overall, the obtained DEGs differently modulated the regulation of synapse structure or activity (GO:0050803 p adjusted < 0.05; GO:0006865 p adjusted < 0.05), including alterations in the glutamatergic synapse due to mGluR2-mGluR4 complex (CORUM:6363 p adjusted < 0.01) modulation.

2.3. PDC1 and PDC2 Networks Differ for Neuroprotective Pathways

A network analysis approach was used to investigate differences in gene co-expression and connectivity between the two PD clusters. Two networks were obtained using DEGs to define nodes and PCIT values to define edges between nodes. Next, the label propagation algorithm was applied on the two networks to detect communities and 2 were found in PDC1 (Figure 2B), while no distinct communities were found in PDC2 (Figure 2C). These structural differences were confirmed by the NCT test, showing that the subjects represented different PD subpopulations (p value < 0.0001). Communities in PDC1 were studied to identify the functional pathways enriched by their genes. Text-mining on STRINGdb showed that PDC1 community 1 (PPI score p value < 0.0001) was composed of DEGs belonging to Wnt/β-catenin and TGF-β/SMAD pathways, regulating adult neurogenesis [22], and functional enrichment analysis showed that DEGs in PDC1 community 1 significantly altered nuclear factor of activated T-cells 1 (NFATc1) transcription, which is a key regulator in Wnt signaling (TF:M04053, p adjusted < 0.001). To further explore functional alterations in PDC1 vs. PDC2 we decided to compare the intensity of the connections between nodes in the two networks. Although the overall level of connectivity is not different across PD subtypes (NCT, S = 34.64, p = 0.08), we observed 271 edges displaying different levels of strength between clusters (p adjusted < 0.01) (Figure 3A). Nodes in this differential network enriched the neuronal helix–loop–helix TF protein domain (PF12533, p adjusted < 0.01), which is required for neurogenesis.

2.4. Network Regulators as Drug Repurposing Candidates

DEGs from PDC1 vs. PDC2 comparison were investigated to understand their role in the disease networks, aiming to identify potential drug repurposing candidate genes. CITED1 and NEUROD1 were identified as the most important genes regulating the differential wiring between clusters based on the authority centrality score (Figure 3B). The influence of the bHLH TFs (NEUROD1, NEUROD2, NEUROD6), along with ZNF593, was confirmed by RIF analysis, as these DEGs were shown to be the best predictors of other DEG expression levels in the disease network (Figure 3C). To further inspect the topology of the disease networks, we computed the delta standardized betweenness centrality score between PDC1 and PDC2, identifying GRM2, KRT222, PMF1-BGLPA, and CCK DEGs as the most differentially wired between the PDC1 and PDC2 clusters (Figure 3D). The obtained set of DEGs was used in the drug repurposing pipeline.

2.5. Drug Repurposing Pipeline

A drug repurposing analysis was performed to identify compounds modulating selected DEGs from the PDC1 vs. PDC2 comparison (Table 1). In particular, we wanted to identify drugs showing agonist effects on the downregulated key genes driving the impaired neuroprotection network in PDC1. The obtained compounds (n = 42) were filtered and drugs being duplicated (n = 16) and inefficacious based on clinical trials (n = 5) were removed, along with substances showing side effects on memory or excitotoxicity (n = 2) and unknown modality of action (n = 10). The final set of drugs (n = 9) was mapped on NEUROD1 and GRM2 genes. These nine compounds displayed different modalities of action that were assessed for both preclinical and clinical evidence of their neuroprotective potential (Table 1).

2.6. Molecular Characterization of PDC1 or PDC2 vs. NC

DEGs were identified for both PDC1 vs. NC and PDC2 vs. NC comparisons, aiming to assess the specific disease mechanisms of the two clusters (Figure 4). As expected, functional enrichment on PDMap enriched the entire diagram in the main map with p adjusted < 0.0001 for both clusters, including the Parkinsons UK Gene Ontology genes with p adjusted < 0.05 and p adjusted < 0.0001 for PDC1 and PDC2, respectively. Moreover, we studied the common DEGs resulting from each comparison to assess whether their connectivity was significantly different between PDC1 and PDC2. Two networks were built for both PDC1 and PDC2 common DEGs. Despite holding the same node structure, the networks were differentially connected (NCT, p < 0.0001), with 5000 differential connections showing p adjusted (FDR) < 0.01 (Supplementary Figure S1).

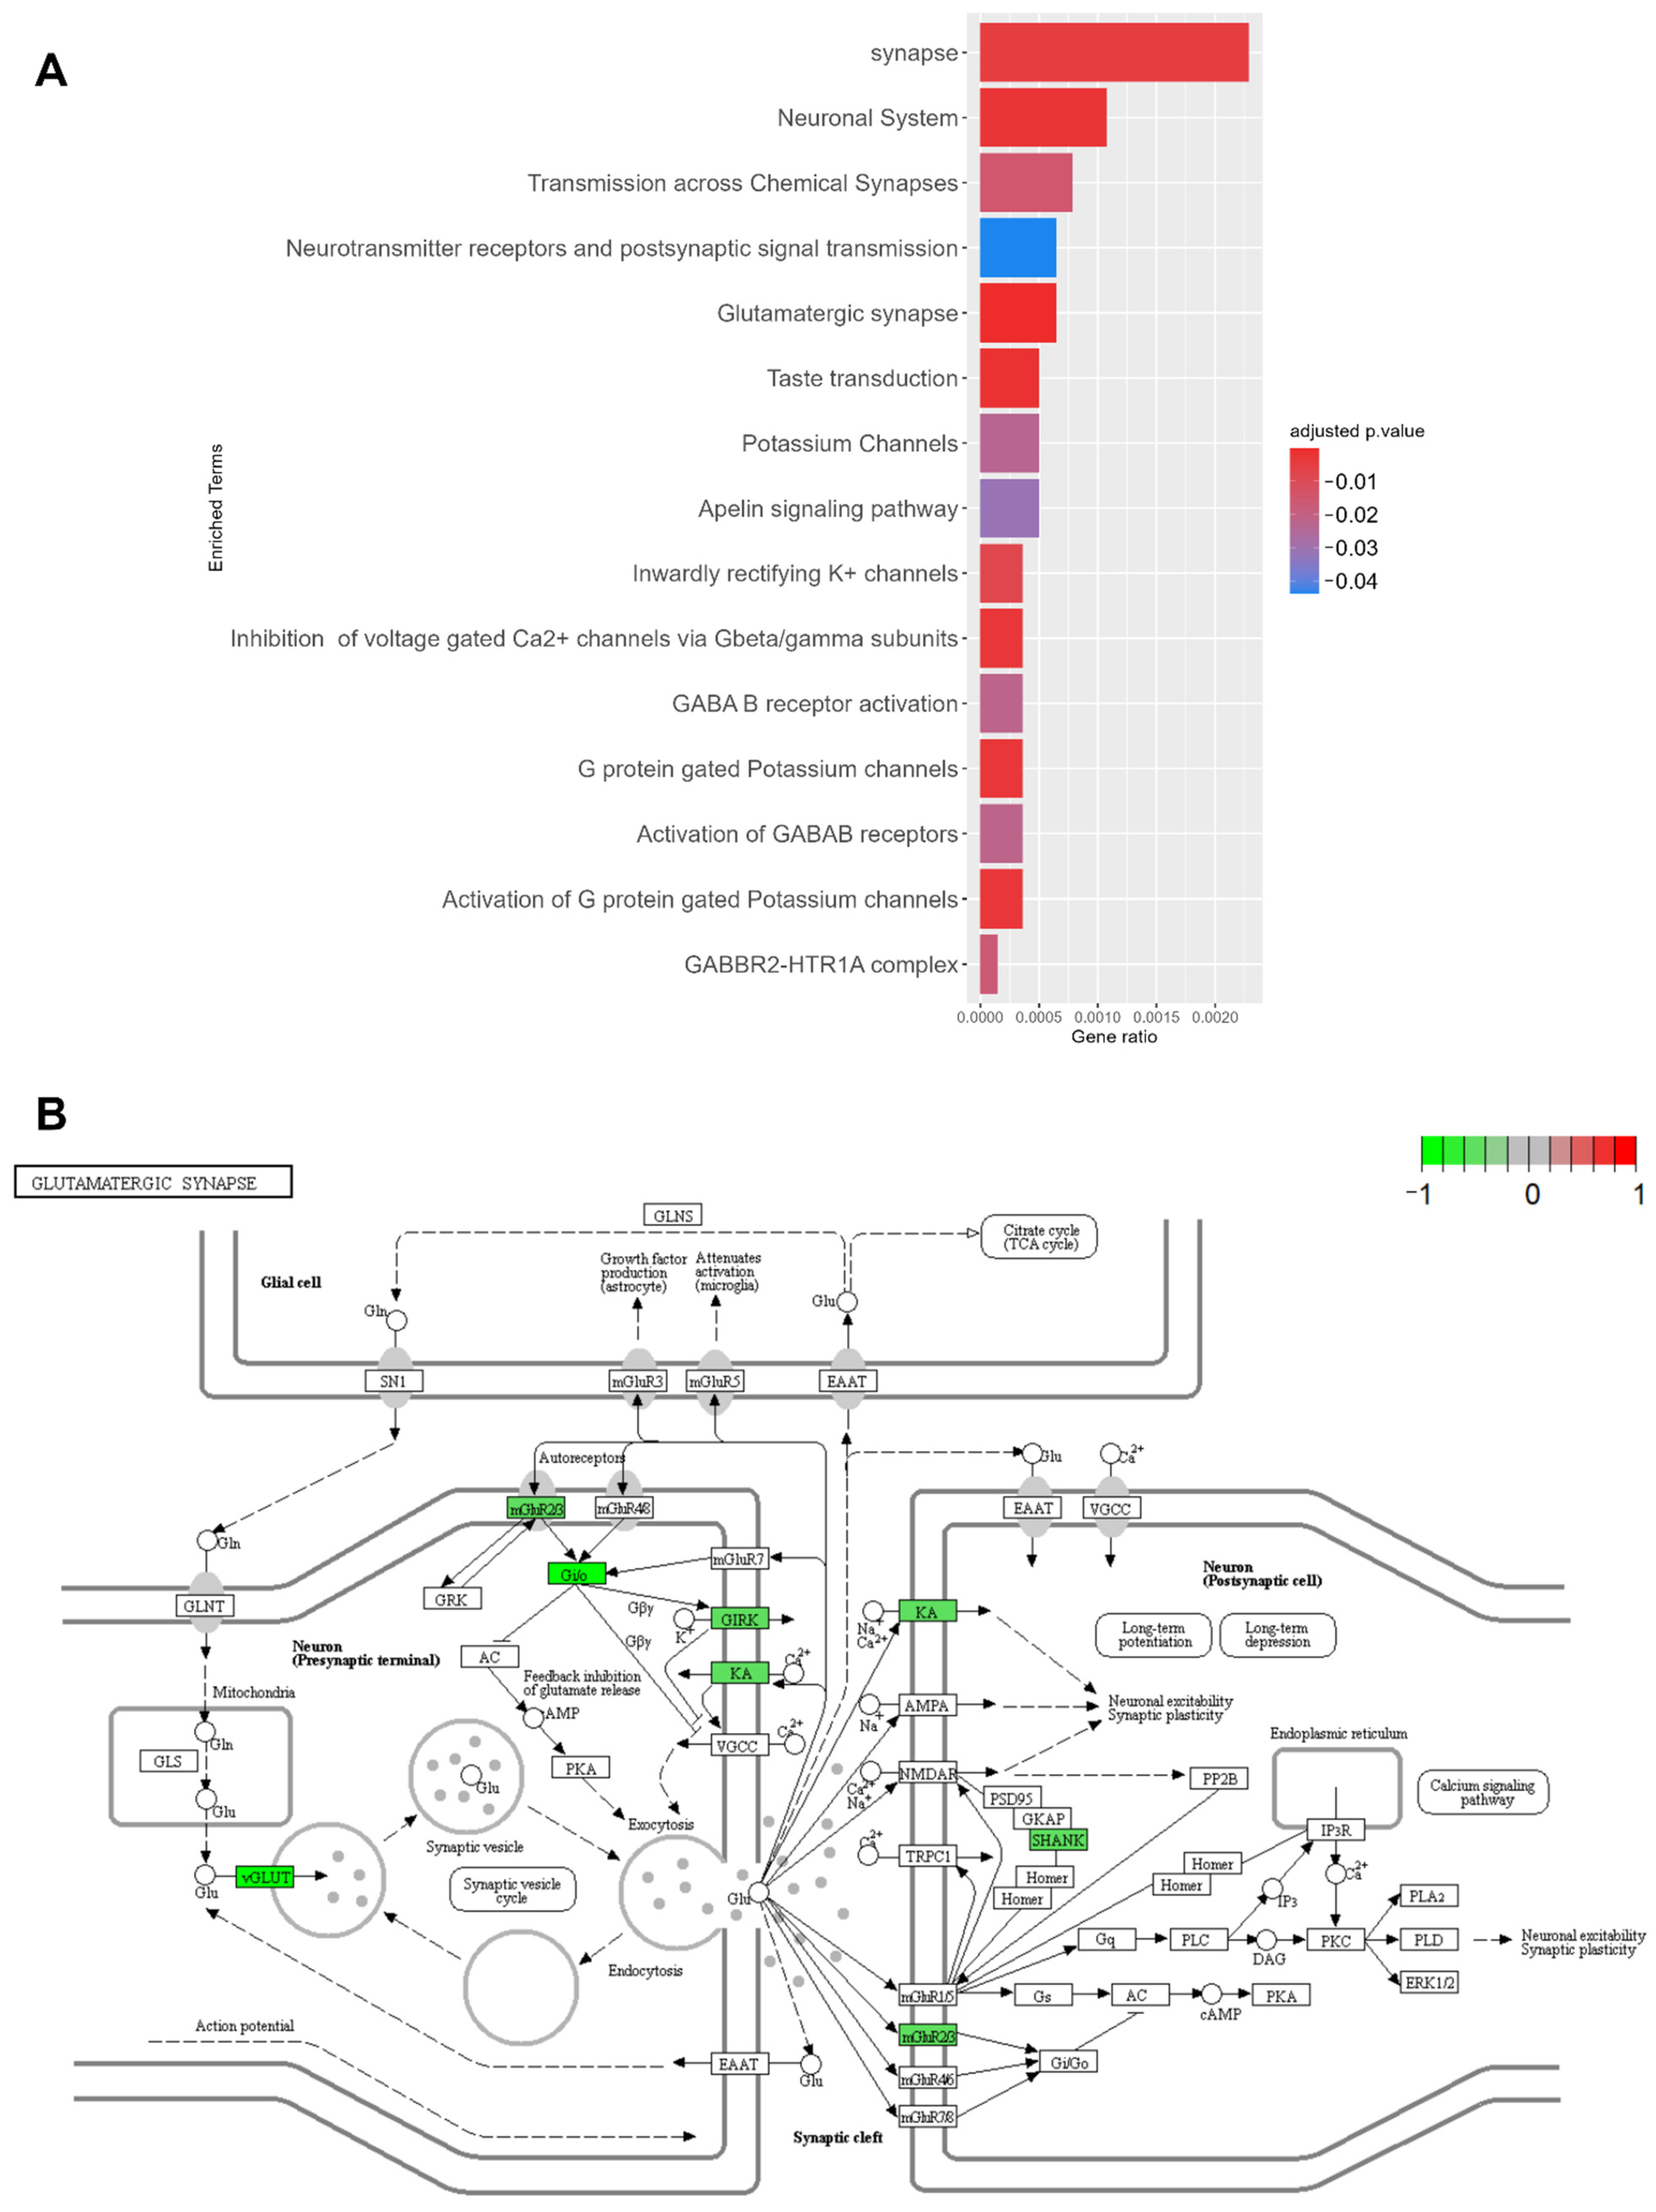
2.6.1. Disease Mechanism of PDC1

A total of 217 unique DEGs were identified in the PDC1 vs. NC comparison with p adjusted (FDR) ≤ 0.01 (Figure 4). Within this set, 5 unique TFs were found and GDA analysis revealed that 12% of these DEGs were already associated with PD. Functional enrichment analysis mapped this set of DEGs on 15 biological pathways (p adjusted < 0.05), mostly belonging to glutamatergic (KEGG:04724) and GABAergic signaling (CORUM:5418, REAC:R-HSA-991365, REAC:R-HSA-977444), but also including the Apelin signaling pathway (KEGG:04371) (Figure 5A) and the Sonic Hedgehog (SHH) pathway from the Parkinson’s UK Annotation Initiative (p adjusted < 0.05) in the PDMap (Supplementary Figure S2). The expression profiles of DEGs involved in the glutamatergic synapse were further detailed, highlighting the downregulation of several key genes underlying the glutamate balance in the synaptic cleft (Figure 5B) (GNG13, SLC17A7, GNG11, GRM2, SLC17A6, GRIK1, KCNJ3, SHANK1, GNG3).

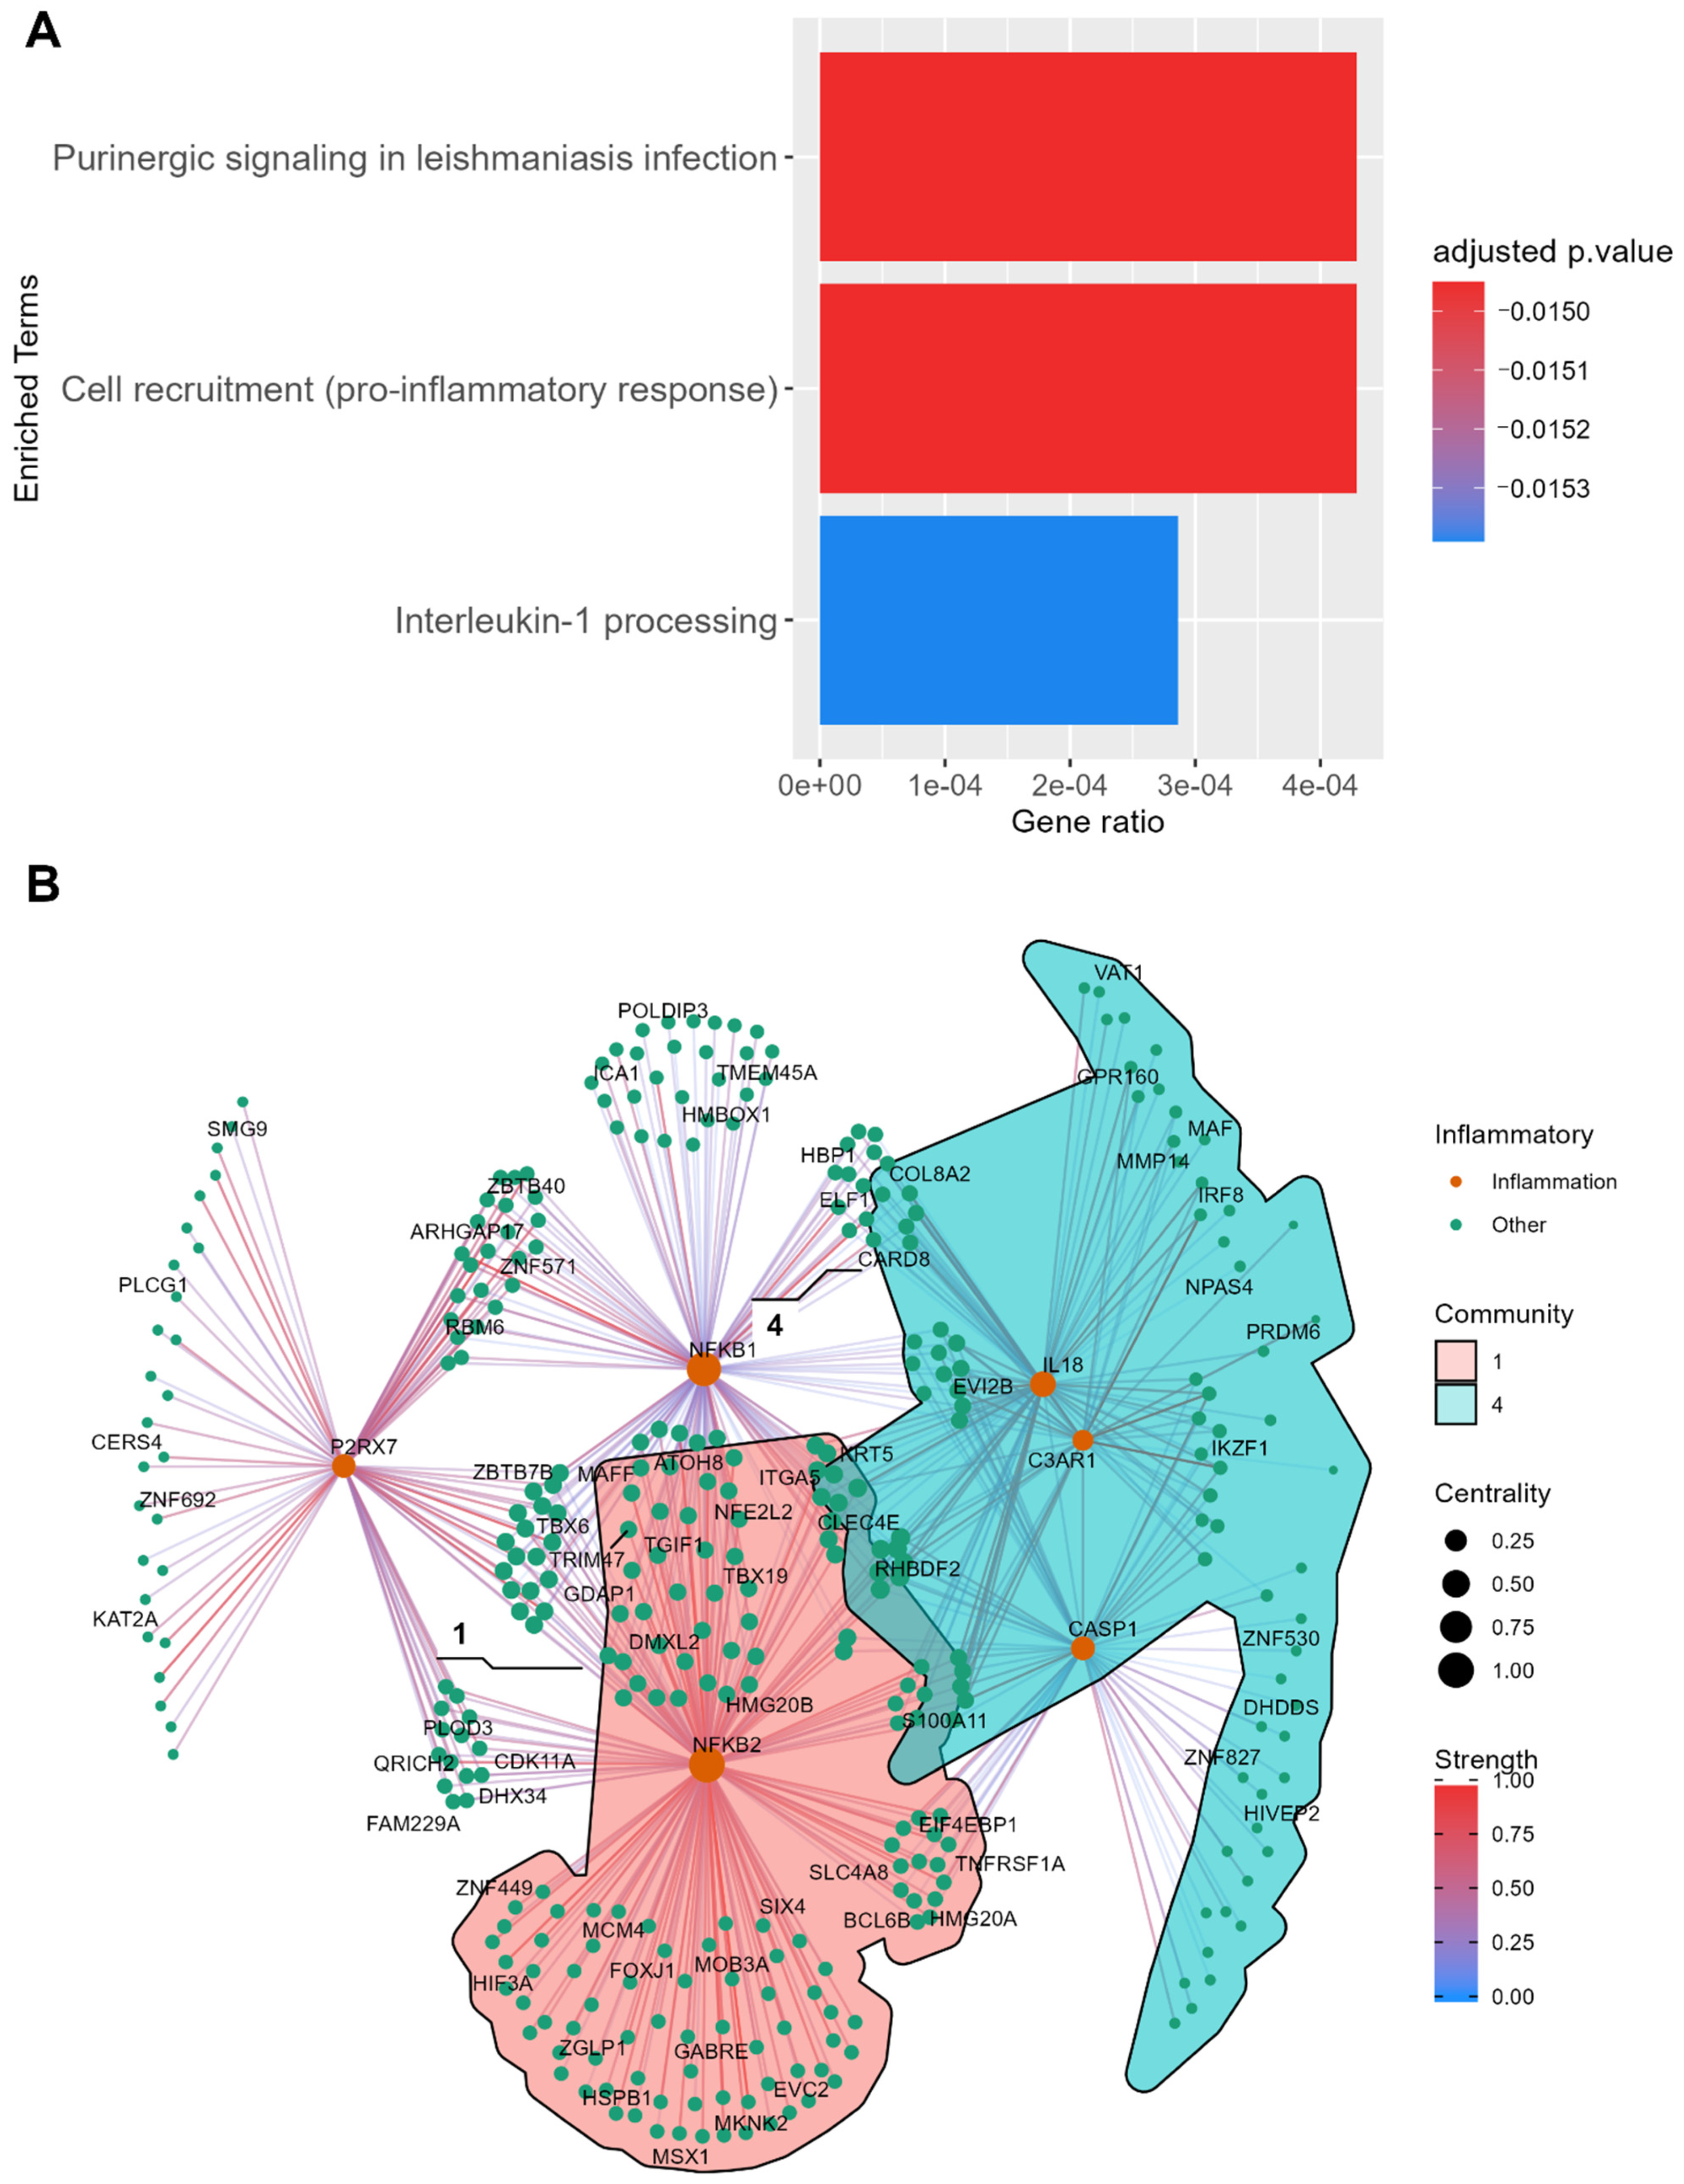
2.6.2. Disease Mechanism of PDC2

A total of 482 unique DEGs were identified in the PDC2 vs. NC comparison, with p adjusted (FDR) ≤ 0.01 (Figure 4). Within this set, 2 unique TFs were found, while 10% of the DEGs were already associated with PD from GDA analysis. Functional enrichment analysis showed that PDC2 unique DEGs exclusively enriched pro-inflammatory pathways, namely cell recruitment (pro-inflammatory response), purinergic signaling in leishmaniasis infection, and Interleukin-1 processing from the REACT database (Figure 6A), as well as endoplasmic reticulum (ER) stress signaling (p adjusted < 0.01) and the ubiquitin proteasome system (p adjusted < 0.05) from the Parkinson’s UK Annotation Initiative in the PDMap (Supplementary Figure S3). These pathways were enriched by the same set of genes: NFKB2, IL18, P2RX7, NFKB1, C3AR1, and CASP1. A network analysis approach was used to further investigate this immunological subnetwork characterizing PDC2 (Figure 6B). Several communities of DEGs were found, and communities 1 and 4 reported significant PPI enrichment scores p values (p value = 0.002; p value < 0.0001). Community 1 significantly enriched the cell surface receptor signaling pathway (p value < 0.05). STRINGdb text mining on this community suggested that this set of DEGs may be involved in neuronal apoptosis mediated by oxidative stress (CXCR4, 4E-BP1, DR5, TNFRSF10B, TRAIL-R2, HSPB1, TNFRSF1A, BAG3) [23]. As expected, community 4 was mainly composed of genes from the immune system (adjusted p value = 0.03).

3. Discussion

Disease subtyping is required to address PD heterogeneity in clinical manifestations and progression and improve both management strategies and research in an attempt to develop disease-modifying treatments. In this study, we proposed a hybrid workflow integrating ML, bioinformatics, and network analyses to overcome the pervasive limitations in PD subtyping, specifically addressing reproducibility, disease network identification and characterization, drug repurposing, and knowledge transferability. As a proof of concept, we analyzed RNA-Seq data from PD and NC post mortem brain samples to identify PD subtypes and to characterize the gene networks regulating common and specific disease mechanisms. In fact, we applied a data-driven approach based on network analysis and information theory and determined the most influential DEGs. Finally, we applied a drug repurposing pipeline to propose compounds holding therapeutic potential. Two PD subtypes were identified and internally validated using unsupervised ML. The obtained clusters differed by lifespan and Braak score, with PDC2 reporting a later age of death and lower neuronal depletion than PDC1. Additionally, we observed that PDC1 and PDC2 were characterized by specific disease mechanisms when compared with NC, further confirming that PDC1 and PDC2 represented two distinct subpopulations in PD. Alterations in SHH and Apelin signaling, coupled with altered glutamatergic transmission, specifically characterized PDC1, while the PDC2 unique disease fingerprint reported ER and oxidative stress mechanisms due to the increase in neuroinflammation. Most of the differences between PDC1 and PDC2 gene expression were driven by a gene network centered on the bHLH NEUROD TFs (NEUROD1, NEUROD2, NEUROD6) controlling cell-cycle and adult neurogenesis in the Wntβ-catenin pathway [24,25]. Genes in this community were downregulated in PDC1 vs. PDC2, suggesting an impairment of Wntβ-catenin signaling. The impairment of Wnt/β-catenin is a PD hallmark, as it regulates dopaminergic neurogenesis and survival in the subventricular zone and substantia nigra during aging [26]. Several other key genes in the Wnt/β-catenin were downregulated in PDC1, including NFATc1 and CBP/p300 modulators (CITED1, eEF1Bγ). CBP and p300 are epigenetic factors constituting the KAT3 family, which controls chromatin acetylation [27]. Differential CBP/p300 modulation is used to regulate nuclear receptor/Wnt/β-catenin interactions, allowing for both the maintenance of genomic integrity and neuronal plasticity during aging [28]. The present extensive network analysis revealed that NEUROD1 and GRM2 were the most influential genes in the network, as they were able to predict and/or influence the expression of the other DEGs. NEUROD1 regulates the onset of neurogenesis, differentiation, and survival in the Wnt/β-catenin pathway [29,30,31], representing a key target of several applications aiming to restore dopaminergic signaling in PD [32,33,34,35,36]. In particular, NEUROD1 chemical reprogramming has produced dopaminergic neurons from astrocytes in an in vivo PD mouse model, while its overexpression reduced the loss of the dopaminergic neurons associated with PD, thus inducing relief of symptoms [22,24,37,38]. GRM2 encodes mGluR2 metabotropic receptors modulating neurotransmission and synaptic plasticity between the substantia nigra and subthalamic nucleus [39]. Recently, GRM2 downregulation in the substantia nigra has been associated with PD [40] since mGluR2 is essential for the induction of long-term depression (LTD) in the substantia nigra and mGluR2 agonists have been proposed for the treatment of motor symptoms in PD [41,42,43]. Given the therapeutic potential of NEUROD1 and GRM2, we used them in a drug repurposing pipeline, finding nine compounds potentially able to restore their functionality. NEUROD1-interacting compounds (ISX9, PD98059, deferoxamine) are currently under evaluation as disease-modifying treatments in PD [4]. ISX9 is a neural stem cell inducer aiming to enhance adult neurogenesis through NEUROD1 overexpression [33,44,45,46]. PD98059 acts as an ERK1/2 inhibitor, counteracting the apoptotic processes harming dopaminergic neurons [45,46,47,48]. Finally, deferoxamine (DFO) is an hexadentate iron chelator approved by the Food and Drugs Administration (FDA) to be prescribed for iron and aluminum intoxication [49]. Given that free iron and aluminum deposits are known to be involved in PD pathogenesis, iron chelation may represent a promising therapeutic strategy to improve behavioral outcomes and slow down neurodegeneration [50,51]. In PD animal models, DFO chronic intranasal administration reduces motor defects and overall pathology, while it has been demonstrated that DFO treatment increases the number of neurons produced from neural stem/progenitor cells (NPCs) due to the activation of the NEUROD signaling pathway [52,53]. DFO action can also be coupled with antioxidants to counteract neurotoxicity in dopaminergic neurons of the substantia nigra, reducing oxidative stress and cellular damage [54]. Clinical trials on an orally active form of the iron chelator deferiprone (DFP) showed decreases in substantia nigra iron content resulting in improved Unified Parkinson’s Disease Rating Scale (UPDRS) scores [55]. GRM2 modulators have risen in interest, given that allosteric modulators of G-protein-coupled receptors (GPCRs) appear to provide a new strategy to develop novel treatments in neurodegenerative diseases in general and PD in particular [43]. Moreover, GPCR positive allosteric modulators (PAMs) acting on mGluR2 can potentiate the receptor response providing higher subtype selectivity and thus reduce the activation of pathways inducing side-effects [56].

4. Materials and Methods

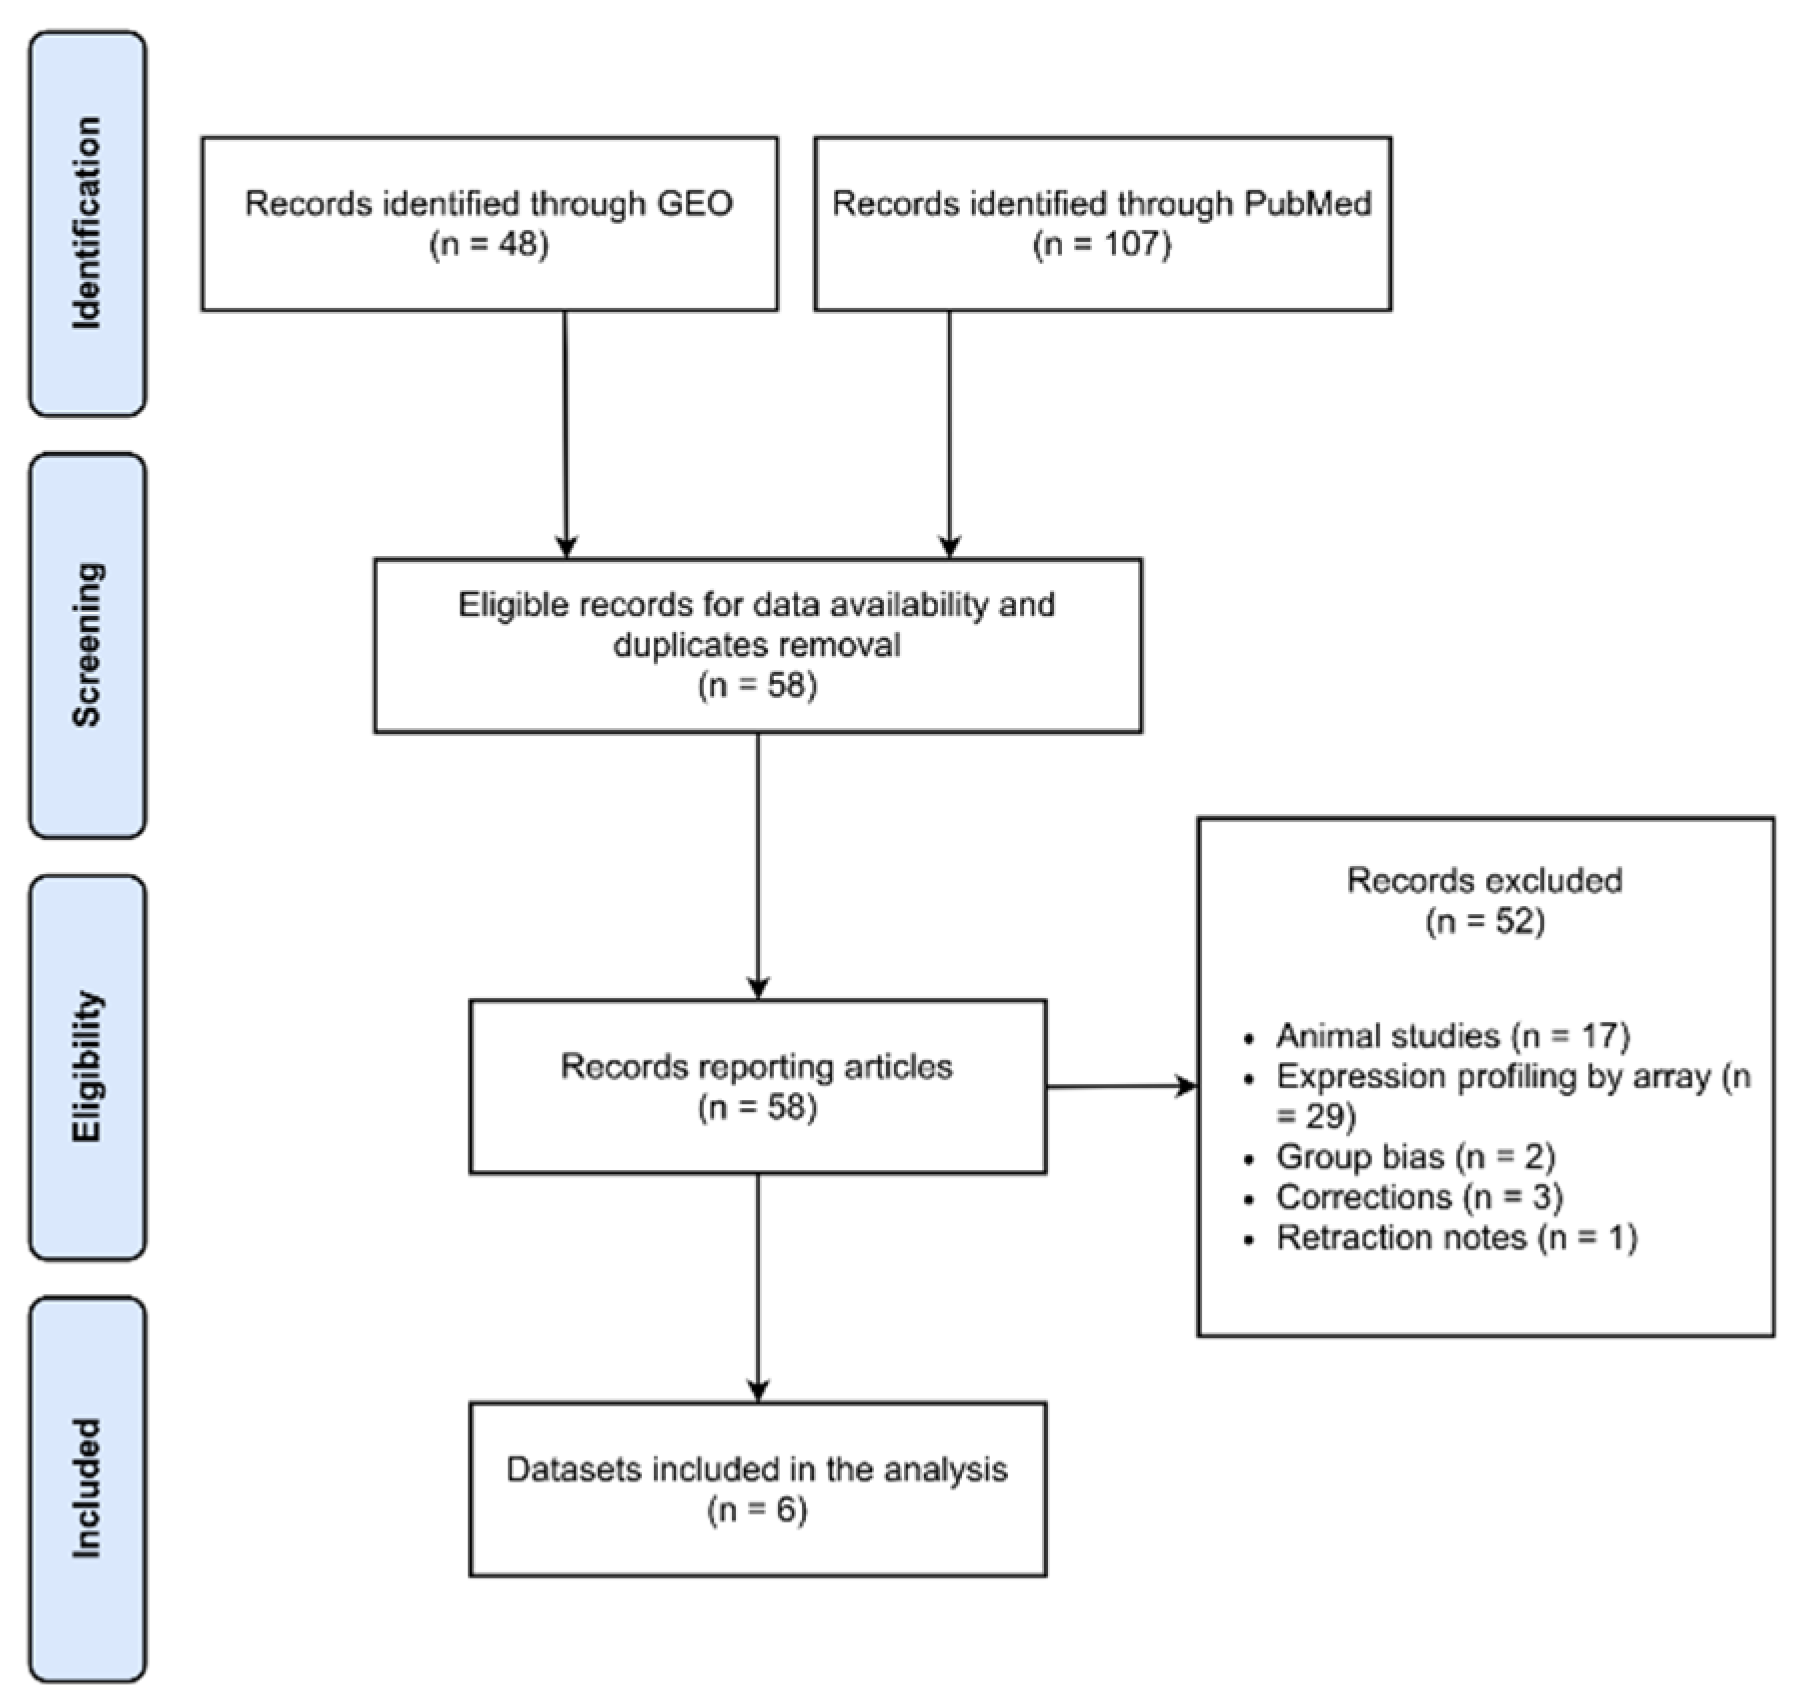
4.1. Systematic Data Retrieval

A comprehensive online search of the published literature in Gene Expression Omnibus (GEO) and PubMed databases (to 30 April 2021) was performed to identify all publications measuring RNA expression levels in brain tissue from idiopathic PD patients. The search strategy used a query string including as relevant keywords: “Parkinson, High throughput Sequencing”. Studies were included to retrieve data if they met the following criteria: available RNA-Seq data; sequenced RNA extracted from post-mortem human brain tissue; RNA sequenced by next-generation sequencing (NGS) technology; data must include both PD and normal control (NC) subjects’ expression matrices. Search results were reviewed by two investigators (A.T. and C.F.) who were required to agree on study selection. Any discrepancies were resolved by discussion. Preferred Reporting Items for Systematic Reviews and Meta-Analyses (PRISMA) guidelines adherence was respected to perform this systematic data retrieval [57]. After filtering, 6 datasets including transcriptomic data of 210 participants (PD = 115; NC = 94) were selected (Figure 7), namely GSE136666 [40], GSE135036 [58], GSE134390, GSE110716 [59], GSE68719 [60], and [61].

4.2. Raw Counts Preprocessing

Raw counts matrices were integrated by gene, and univariate anomaly detection on demographics was performed using Grubbs testing. One PD subject that proved to be an outlier for the age of death parameter was then removed. Genes with expression values below the 15th percentile were removed during the low counts filtering stage. The batch effect due to the experiment source was removed using the “ComBat-seq” function in the sva package [62,63]. “ComBat-seq” uses a negative binomial regression model to estimate batch effects based on the count matrix in RNA-seq studies. The estimated batch effect parameters are used to calculate the expected distributions if there were no batch effects in the data based on the model. Then, the “ComBat-seq” function adjusts the data by mapping the quantiles of the empirical distributions of data to the batch-free distributions [64]. Preprocessed gene counts matrices for the clustering pipeline are included in Supplementary Table S1.

4.3. Clustering Pipeline

After raw counts preprocessing, the clustering tendency of the PD gene-expression data was confirmed using Hopkins’ statistic (H = 0.14), while the best number of clusters (n = 2) was estimated using the NbClust R package [65,66]. NbClust’s approach to clustering validity is based on the relative criteria, which consists of the evaluation of a clustering structure by comparing it with other clustering schemes resulting from the same algorithm but with different parameter values [66]. The clustering pipeline included 7 algorithms from the factoextra R package [67] (fuzzy clustering; k-means, hierarchical_kmeans; clara, agnes; pam; hclust; diana) over several distance metrics and measures (Supplementary Table S2) and the final clustering method was selected based on the maximum average Silhouette width and Dunn index methods (Supplementary Table S2). The silhouette (S) and Dunn (D) coefficients measure how similar an observation is to its own cluster (cohesion) compared to other clusters (separation), which indicates how well an observation was classified [68]. Since S and D coefficients can be computed with any distance metric, they can be compared across multiple models. Moreover, it was demonstrated that S and D coefficients are among the most reliable internal validation metrics in five different aspects: monotonicity, noise, density, subclusters, and skewed distributions [69].

4.4. Statistical Analyses

All the statistical analyses were performed in R v. 4.1.0 [70]. A seed was set to 12345 for all algorithms needing pseudorandomization. A Wilcoxon rank-sum test was performed to assess differences in age of death in PDC1 vs. PDC2 comparison [71], whereas Fisher tests were used to evaluate differences in Braak score and sex in the same comparison [72].

4.5. Differential Expression Analysis

Differential expression analysis was performed using limma for each comparison and gene expression matrices were transformed in log2 counts per million (CPM) before modeling [73]. Finally, moderated t-statistic and F-statistic along with log-odds of differential expression were computed by empirical Bayes moderation of the standard errors. Only genes with p-value adjusted for false discovery rate (FDR) ≤ 0.01 were considered differentially expressed genes (DEGs) [74]. Over-representation analysis (ORA) was performed to map genes on their functional pathways. DEGs were queried on all gene ontology (GO) domains: biological processes (BP), cellular components (CCs) and molecular functions (MFs). Similarly, DEGs were mapped on the CORUM database, which provides manually annotated protein complexes, and the Kyoto Encyclopedia of Genes and Genomes (KEGG) database using g: Profiler API [75]. Moreover, a gene-disease association (GDA) analysis was performed using DisGeNET to retrieve DEGs associated with PD (tag:C0030567) [76]. Unique DEGs from PDC1 and PDC2 vs. NC comparisons were mapped on the Parkinson’s Disease Map (PDMap), including the Parkinson’s UK Annotation Initiative, to identify their specific disease pathways [77]. The obtained pathways were considered as differentially modulated with p adjusted ≤ 0.05 (FDR) and KEGG pathways were visualized using the pathview package [78]. Critical TFs among DEGs were identified using the CeTF package, and regulatory impact factor (RIF) scores were computed for each of the identified TFs [79]. Complete results from the differential expression analysis are reported in Supplementary Tables S3 and S4 for PDC1 vs. PDC2 and PDC1/2 vs. NC, respectively.

4.6. Gene Network Analysis

The gene networks in PDC1 and PDC2, as well as the differential network between the clusters, were investigated using the partial correlation coefficient with information theory (PCIT) algorithm to estimate connectivity among nodes. PCIT identifies meaningful correlations to define edges in a weighted gene co-expression network [79]. Importantly, PCIT allows one to draw a co-expression gene network while controlling the moderation effect of other genes. For example, for every trio of genes in x, y, and z, the partial correlation coefficient between x and y given z indicates the strength of the linear relationship between x and y that is independent of (uncorrelated with) z. Statistical significance of the association between x and y is evaluated by computing the tolerance level to be used as the local threshold for capturing significant associations for every trio of genes. The tolerance level here is defined as the average ratio of partial to direct correlation [80]. Finally, each network was optimized by pruning isolated nodes and looped or multiple edges. The obtained networks were represented using the force-directed Kamada–Kawai algorithm to assure that geometric distances between vertices closely corresponded to the underlying graph distances. Moreover, distinct communities of genes in PDC1 and PDC2 networks were identified using the label propagation algorithm from the tidygraph package, while weights of genes in the networks were estimated using the betweenness centrality score from the same package [81]. The functions of the identified communities and their protein–protein interaction (PPI) enrichment scores were investigated using the protein–protein interaction network from the STRINGdb package [82]. The networks were compared to identify both structural differences and changes in the overall level of connectivity using the NetworkComparisonTest (NCT) package [83]. To build the differential network in PDC1 vs. PDC2 comparison, we tested the edge strength invariance hypothesis, meaning that a specific edge is identical across subpopulations. The edges and nodes showing differential strength levels were used to represent the differential network between the two clusters, while the authority centrality measure was computed to estimate the weight of the nodes in the network [81].

4.7. Drug Repurposing

The DEGs from PDC1 vs. PDC2 comparison were used in a drug repurposing pipeline. We selected as input the top-5 most influential DEGs in the gene network based on authority, RIF1, RIF2, and betweenness scores. The selected DEGs were queried on the Drug Gene Interaction Database (DGIdb) and the Drug Repurposing Hub from the Broad Institute to obtain their interacting compounds and modality of action. The Drug Repurposing Hub is a curated and annotated collection of FDA-approved drugs, clinical trial drugs, and pre-clinical tool compounds, while DGIdb is a data mining platform exploring the druggable genome for personalized medicine [84,85]. The DGIdb mining algorithm explores over 30 trusted sources, including scientific literature and curated databases [84]. The obtained set of drugs was filtered with the following criteria: duplicated, inefficacious, side effects on memory or excitotoxicity, and unknown modality of action. The final set of drugs was then evaluated based on their target and modality of action [84,85]. Each compound’s literature data was filtered to include only preclinical experiments or concluded clinical trials on neurodegenerative diseases. Finally, data from ClinicalTrials.gov (accessed on 10 May 2021) were retrieved to verify ongoing clinical trials on neurodegenerative diseases involving the administration of the identified compounds [86].

5. Conclusions

Hybrid workflows combining network biology and artificial intelligence have the potential to discover novel mechanisms and promising drug targets for complex diseases [21]. Despite this potential, these techniques have rarely been combined in a data-driven pipeline. We implemented a fully data-driven pipeline for PD subtyping, aiming to gather knowledge for precision medicine applications. Collectively, our results point out that two clusters representing distinct PD subpopulations can be identified from RNA-Seq data. Adopting a rigorous data-driven pipeline for disease subtyping allowed us to stratify homogeneous groups of individuals based on their unique pattern of gene expression. Interestingly, PD subjects belonging to PDC1 and PDC2 were consistently different in the Wnt/β-Catenin signaling pathway, which regulates neuronal survival, adult neurogenesis, and plasticity. However, when compared to NC, PDC1 and PDC2 differed also by disease mechanisms. PDC1 was characterized by an altered glutamatergic transmission, while PDC2 was characterized by altered inflammatory pathways. These results were independently validated on the PDMAP from the University of Luxembourg, which is a manually curated knowledge repository established to describe molecular mechanisms of PD. These alterations in neuroprotection and distinct disease machinery were reflected on clinical data, as PDC1 and PDC2 were characterized by different ages at death and Braak scores. Using a data-driven methodology for subtype identification and characterization could result in the identification of disease-modifying treatments specifically suited for one subtype. To this extent, we performed a drug-repurposing pipeline using as input the key genes regulating the alteration in expression profiles of PDC1 and PDC2, identifying nine drugs at various stages of FDA approval. This set of compounds shared a known or predicted neuroprotective effect. This workflow is in line with the aims of precision medicine, for which detecting disease subtypes enhances diagnostic precision, finally helping to determine specific treatments for well-defined patients [87]. Although researchers are using similar in silico approaches to unravel the regulatory pathways underneath complex diseases and to identify key druggable disease networks [20,21,88], reduced data availability represents a major limitation in this workflow, as pivotal clinical information like age of PD onset, treatment type and duration, or comorbidities is often lacking in public repositories. The lack of clinical characteristics in in silico unsupervised analyses prevents this kind of application from being translated into clinical practice in a timely manner. Moreover, limitations in data availability have hindered knowledge translation from the brain to more easily available tissues in clinical practice, such as blood samples. Thus, the translation of the findings into biological understanding remains a major challenge to be addressed in future research. As the field moves forward, better data practices are needed to keep up with the increasing availability of novel technologies and the need to implement artificial intelligence tools for biomedical purposes [89]. Here, we showed how transcriptomic data and unsupervised ML can be leveraged to identify and characterize distinct subpopulations of idiopathic PD while proposing tailored potential treatments, enabling a precision medicine approach to complex neurodegenerative diseases.

Supplementary Materials

The following supporting information can be downloaded at: https://0-www-mdpi-com.brum.beds.ac.uk/article/10.3390/ijms23052557/s1.

Author Contributions

Conceptualization, A.T., C.F.; methodology, A.T., C.F., C.S., V.C.; software, A.T., C.F.; validation, all authors; formal analysis, A.T., C.F.; investigation, A.T., C.F.; resources, A.T., C.F., C.C., E.G.; data curation, A.T., C.F.; writing—original draft preparation, A.T., C.F.; writing—review and editing, all authors; visualization, A.T., C.F.; supervision, L.P., C.C., R.C., E.G.; project administration, C.C., R.C., E.G. All authors have read and agreed to the published version of the manuscript.

Funding

This work was partially supported by Ricerca Corrente grants (Italian Ministry of Health) from the Santa Lucia Foundation IRCCS—Linea di Ricerca A: Neurologia Clinica e Comportamentale.

Institutional Review Board Statement

Not applicable.

Informed Consent Statement

Not applicable.

Data Availability Statement

Original data are available from the NCBI Gene Expression Omnibus at https://0-www-ncbi-nlm-nih-gov.brum.beds.ac.uk/geo/ (accessed on 19 February 2022). The preprocessed data table, ready for the unsupervised machine learning pipeline, is available in the Supplementary Materials.

Acknowledgments

We thank Filippo Taranta for his support in data curation, and Luca Battistini and Giovanna Borsellino for their assistance and guidance.

Conflicts of Interest

The authors declare no conflict of interest.

References

  1. Bloem, B.R.; Okun, M.S.; Klein, C. Parkinson’s Disease. Lancet 2021, 397, 2284–2303. [Google Scholar] [CrossRef]
  2. Deuschl, G.; Beghi, E.; Fazekas, F.; Varga, T.; Christoforidi, K.A.; Sipido, E.; Bassetti, C.L.; Vos, T.; Feigin, V.L. The Burden of Neurological Diseases in Europe: An Analysis for the Global Burden of Disease Study 2017. Lancet Public Health 2020, 5, e551–e567. [Google Scholar] [CrossRef]
  3. Dorsey, E.R.; Elbaz, A.; Nichols, E.; Abd-Allah, F.; Abdelalim, A.; Adsuar, J.C.; Ansha, M.G.; Brayne, C.; Choi, J.-Y.J.; Collado-Mateo, D.; et al. Global, Regional, and National Burden of Parkinson’s Disease, 1990–2016: A Systematic Analysis for the Global Burden of Disease Study 2016. Lancet Neurol. 2018, 17, 939–953. [Google Scholar] [CrossRef] [Green Version]
  4. Lang, A.E.; Espay, A.J. Disease Modification in Parkinson’s Disease: Current Approaches, Challenges, and Future Considerations. Mov. Disord. Off. J. Mov. Disord. Soc. 2018, 33, 660–677. [Google Scholar] [CrossRef] [PubMed]
  5. Paolini Paoletti, F.; Gaetani, L.; Parnetti, L. The Challenge of Disease-Modifying Therapies in Parkinson’s Disease: Role of CSF Biomarkers. Biomolecules 2020, 10, 335. [Google Scholar] [CrossRef] [PubMed] [Green Version]
  6. Park, A.; Stacy, M. Disease-Modifying Drugs in Parkinson’s Disease. Drugs 2015, 75, 2065–2071. [Google Scholar] [CrossRef]
  7. Blauwendraat, C.; Nalls, M.A.; Singleton, A.B. The Genetic Architecture of Parkinson’s Disease. Lancet Neurol. 2020, 19, 170–178. [Google Scholar] [CrossRef]
  8. Nalls, M.A.; Blauwendraat, C.; Vallerga, C.L.; Heilbron, K.; Bandres-Ciga, S.; Chang, D.; Tan, M.; Kia, D.A.; Noyce, A.J.; Xue, A.; et al. Identification of Novel Risk Loci, Causal Insights, and Heritable Risk for Parkinson’s Disease: A Meta-Analysis of Genome-Wide Association Studies. Lancet Neurol. 2019, 18, 1091–1102. [Google Scholar] [CrossRef]
  9. Chang, D.; Nalls, M.A.; Hallgrímsdóttir, I.B.; Hunkapiller, J.; van der Brug, M.; Cai, F.; International Parkinson’s Disease Genomics Consortium; 23andMe Research Team; Kerchner, G.A.; Ayalon, G.; et al. A Meta-Analysis of Genome-Wide Association Studies Identifies 17 New Parkinson’s Disease Risk Loci. Nat. Genet. 2017, 49, 1511–1516. [Google Scholar] [CrossRef]
  10. International Parkinson Disease Genomics Consortium; Nalls, M.A.; Plagnol, V.; Hernandez, D.G.; Sharma, M.; Sheerin, U.-M.; Saad, M.; Simón-Sánchez, J.; Schulte, C.; Lesage, S.; et al. Imputation of Sequence Variants for Identification of Genetic Risks for Parkinson’s Disease: A Meta-Analysis of Genome-Wide Association Studies. Lancet 2011, 377, 641–649. [Google Scholar] [CrossRef] [Green Version]
  11. Fereshtehnejad, S.-M.; Romenets, S.R.; Anang, J.B.M.; Latreille, V.; Gagnon, J.-F.; Postuma, R.B. New Clinical Subtypes of Parkinson Disease and Their Longitudinal Progression: A Prospective Cohort Comparison With Other Phenotypes. JAMA Neurol. 2015, 72, 863–873. [Google Scholar] [CrossRef] [PubMed]
  12. Greenland, J.C.; Williams-Gray, C.H.; Barker, R.A. The Clinical Heterogeneity of Parkinson’s Disease and Its Therapeutic Implications. Eur. J. Neurosci. 2019, 49, 328–338. [Google Scholar] [CrossRef] [PubMed]
  13. Riggare, S.; Hägglund, M. Precision Medicine in Parkinson’s Disease—Exploring Patient-Initiated Self-Tracking. J. Park. Dis. 2018, 8, 441–446. [Google Scholar] [CrossRef] [Green Version]
  14. Severson, K.A.; Chahine, L.M.; Smolensky, L.A.; Dhuliawala, M.; Frasier, M.; Ng, K.; Ghosh, S.; Hu, J. Discovery of Parkinson’s Disease States and Disease Progression Modelling: A Longitudinal Data Study Using Machine Learning. Lancet Digit. Health 2021, 3, e555–e564. [Google Scholar] [CrossRef]
  15. Fabrizio, C.; Termine, A.; Caltagirone, C.; Sancesario, G. Artificial Intelligence for Alzheimer’s Disease: Promise or Challenge? Diagnostics 2021, 11, 1473. [Google Scholar] [CrossRef] [PubMed]
  16. Qian, E.; Huang, Y. Subtyping of Parkinson’s Disease—Where Are We Up To? Aging Dis. 2019, 10, 1130–1139. [Google Scholar] [CrossRef] [PubMed] [Green Version]
  17. Bertucci Filho, D.; Teive, H.A.G.; Werneck, L.C. Early-Onset Parkinson’s Disease and Depression. Arq. Neuropsiquiatr. 2007, 65, 5–10. [Google Scholar] [CrossRef] [Green Version]
  18. Wickremaratchi, M.M.; Knipe, M.D.W.; Sastry, B.S.D.; Morgan, E.; Jones, A.; Salmon, R.; Weiser, R.; Moran, M.; Davies, D.; Ebenezer, L.; et al. The Motor Phenotype of Parkinson’s Disease in Relation to Age at Onset. Mov. Disord. Off. J. Mov. Disord. Soc. 2011, 26, 457–463. [Google Scholar] [CrossRef]
  19. Dienstmann, R.; Vermeulen, L.; Guinney, J.; Kopetz, S.; Tejpar, S.; Tabernero, J. Consensus Molecular Subtypes and the Evolution of Precision Medicine in Colorectal Cancer. Nat. Rev. Cancer 2017, 17, 79–92. [Google Scholar] [CrossRef] [PubMed]
  20. Neff, R.A.; Wang, M.; Vatansever, S.; Guo, L.; Ming, C.; Wang, Q.; Wang, E.; Horgusluoglu-Moloch, E.; Song, W.; Li, A. Molecular Subtyping of Alzheimer’s Disease Using RNA Sequencing Data Reveals Novel Mechanisms and Targets. Sci. Adv. 2021, 7, eabb5398. [Google Scholar] [CrossRef]
  21. Wang, Q.; Zhang, Y.; Wang, M.; Song, W.-M.; Shen, Q.; McKenzie, A.; Choi, I.; Zhou, X.; Pan, P.-Y.; Yue, Z.; et al. The Landscape of Multiscale Transcriptomic Networks and Key Regulators in Parkinson’s Disease. Nat. Commun. 2019, 10, 5234. [Google Scholar] [CrossRef] [PubMed]
  22. Ma, N.-X.; Yin, J.-C.; Chen, G. Transcriptome Analysis of Small Molecule–Mediated Astrocyte-to-Neuron Reprogramming. Front. Cell Dev. Biol. 2019, 7, 82. [Google Scholar] [CrossRef] [PubMed]
  23. Galluzzi, L.; Vitale, I.; Aaronson, S.A.; Abrams, J.M.; Adam, D.; Agostinis, P.; Alnemri, E.S.; Altucci, L.; Amelio, I.; Andrews, D.W.; et al. Molecular Mechanisms of Cell Death: Recommendations of the Nomenclature Committee on Cell Death 2018. Cell Death Differ. 2018, 25, 486–541. [Google Scholar] [CrossRef] [PubMed]
  24. Tutukova, S.; Tarabykin, V.; Hernandez-Miranda, L.R. The Role of Neurod Genes in Brain Development, Function, and Disease. Front. Mol. Neurosci. 2021, 14, 109. [Google Scholar] [CrossRef] [PubMed]
  25. Marchetti, B. Wnt/β-Catenin Signaling Pathway Governs a Full Program for Dopaminergic Neuron Survival, Neurorescue and Regeneration in the MPTP Mouse Model of Parkinson’s Disease. Int. J. Mol. Sci. 2018, 19, 3743. [Google Scholar] [CrossRef] [Green Version]
  26. Marchetti, B.; Tirolo, C.; L’Episcopo, F.; Caniglia, S.; Testa, N.; Smith, J.A.; Pluchino, S.; Serapide, M.F. Parkinson’s Disease, Aging and Adult Neurogenesis: Wnt/β-Catenin Signalling as the Key to Unlock the Mystery of Endogenous Brain Repair. Aging Cell 2020, 19, e13101. [Google Scholar] [CrossRef]
  27. Valor, L.M.; Viosca, J.; Lopez-Atalaya, J.P.; Barco, A. Lysine Acetyltransferases CBP and P300 as Therapeutic Targets in Cognitive and Neurodegenerative Disorders. Curr. Pharm. Des. 2013, 19, 5051–5064. [Google Scholar] [CrossRef] [Green Version]
  28. Ono, M.; Lai, K.K.Y.; Wu, K.; Nguyen, C.; Lin, D.P.; Murali, R.; Kahn, M. Nuclear Receptor/Wnt Beta-Catenin Interactions Are Regulated via Differential CBP/P300 Coactivator Usage. PLoS ONE 2018, 13, e0200714. [Google Scholar] [CrossRef]
  29. Fu, M.; Wang, C.; Li, Z.; Sakamaki, T.; Pestell, R.G. Minireview: Cyclin D1: Normal and Abnormal Functions. Endocrinology 2004, 145, 5439–5447. [Google Scholar] [CrossRef]
  30. Hagey, D.W.; Topcic, D.; Kee, N.; Reynaud, F.; Bergsland, M.; Perlmann, T.; Muhr, J. CYCLIN-B1/2 and -D1 Act in Opposition to Coordinate Cortical Progenitor Self-Renewal and Lineage Commitment. Nat. Commun. 2020, 11, 2898. [Google Scholar] [CrossRef]
  31. Xu, D.; Hou, K.; Li, F.; Chen, S.; Fang, W.; Li, Y. XQ-1H Alleviates Cerebral Ischemia in Mice through Inhibition of Apoptosis and Promotion of Neurogenesis in a Wnt/β-Catenin Signaling Dependent Way. Life Sci. 2019, 235, 116844. [Google Scholar] [CrossRef] [PubMed]
  32. Brulet, R.; Matsuda, T.; Zhang, L.; Miranda, C.; Giacca, M.; Kaspar, B.K.; Nakashima, K.; Hsieh, J. NEUROD1 Instructs Neuronal Conversion in Non-Reactive Astrocytes. Stem Cell Rep. 2017, 8, 1506–1515. [Google Scholar] [CrossRef] [Green Version]
  33. Chang, J.-H.; Tsai, P.-H.; Wang, K.-Y.; Wei, Y.-T.; Chiou, S.-H.; Mou, C.-Y. Generation of Functional Dopaminergic Neurons from Reprogramming Fibroblasts by Nonviral-Based Mesoporous Silica Nanoparticles. Sci. Rep. 2018, 8, 11. [Google Scholar] [CrossRef] [PubMed] [Green Version]
  34. Jiang, J.; Piao, X.; Hu, S.; Gao, J.; Bao, M. LncRNA H19 Diminishes Dopaminergic Neuron Loss by Mediating MicroRNA-301b-3p in Parkinson’s Disease via the HPRT1-Mediated Wnt/β-Catenin Signaling Pathway. Aging 2020, 12, 8820–8836. [Google Scholar] [CrossRef] [PubMed]
  35. Parmar, M.; Björklund, A.; Björklund, T. In Vivo Conversion of Dopamine Neurons in Mouse Models of Parkinson’s Disease—A Future Approach for Regenerative Therapy? Curr. Opin. Genet. Dev. 2021, 70, 76–82. [Google Scholar] [CrossRef]
  36. Rivetti di Val Cervo, P.; Romanov, R.A.; Spigolon, G.; Masini, D.; Martín-Montañez, E.; Toledo, E.M.; La Manno, G.; Feyder, M.; Pifl, C.; Ng, Y.-H.; et al. Induction of Functional Dopamine Neurons from Human Astrocytes in Vitro and Mouse Astrocytes in a Parkinson’s Disease Model. Nat. Biotechnol. 2017, 35, 444–452. [Google Scholar] [CrossRef]
  37. Gao, Z.; Ure, K.; Ables, J.L.; Lagace, D.C.; Nave, K.-A.; Goebbels, S.; Eisch, A.J.; Hsieh, J. Neurod1 Is Essential for the Survival and Maturation of Adult-Born Neurons. Nat. Neurosci. 2009, 12, 1090–1092. [Google Scholar] [CrossRef] [Green Version]
  38. Pataskar, A.; Jung, J.; Smialowski, P.; Noack, F.; Calegari, F.; Straub, T.; Tiwari, V.K. NeuroD1 Reprograms Chromatin and Transcription Factor Landscapes to Induce the Neuronal Program. EMBO J. 2016, 35, 24–45. [Google Scholar] [CrossRef]
  39. Dickerson, J.W.; Conn, P.J. Therapeutic Potential of Targeting Metabotropic Glutamate Receptors for Parkinson’s Disease. Neurodegener. Dis. Manag. 2012, 2, 221–232. [Google Scholar] [CrossRef] [Green Version]
  40. Xicoy, H.; Brouwers, J.F.; Wieringa, B.; Martens, G.J.M. Explorative Combined Lipid and Transcriptomic Profiling of Substantia Nigra and Putamen in Parkinson’s Disease. Cells 2020, 9, 1966. [Google Scholar] [CrossRef]
  41. Crupi, R.; Impellizzeri, D.; Cuzzocrea, S. Role of Metabotropic Glutamate Receptors in Neurological Disorders. Front. Mol. Neurosci. 2019, 12, 20. [Google Scholar] [CrossRef] [PubMed] [Green Version]
  42. Murray, T.K.; Messenger, M.J.; Ward, M.A.; Woodhouse, S.; Osborne, D.J.; Duty, S.; O’Neill, M.J. Evaluation of the MGluR2/3 Agonist LY379268 in Rodent Models of Parkinson’s Disease. Pharmacol. Biochem. Behav. 2002, 73, 455–466. [Google Scholar] [CrossRef]
  43. Nickols, H.H.; Conn, P.J. Development of Allosteric Modulators of GPCRs for Treatment of CNS Disorders. Neurobiol. Dis. 2014, 61, 55–71. [Google Scholar] [CrossRef] [Green Version]
  44. Bettio, L.E.B.; Gil-Mohapel, J.; Patten, A.R.; O’Rourke, N.F.; Hanley, R.P.; Gopalakrishnan, K.; Wulff, J.E.; Christie, B.R. Effects of Isx-9 and Stress on Adult Hippocampal Neurogenesis: Experimental Considerations and Future Perspectives. Neurogenesis 2017, 4, e1317692. [Google Scholar] [CrossRef] [Green Version]
  45. Petersen, H.V.; Jensen, J.N.; Stein, R.; Serup, P. Glucose Induced MAPK Signalling Influences NeuroD1-Mediated Activation and Nuclear Localization. FEBS Lett. 2002, 528, 241–245. [Google Scholar] [CrossRef] [Green Version]
  46. Rui, Y.; Sun, Z.; Gu, J.; Sheng, Z.; He, X.; Xie, Z. MEK Inhibitor PD98059 Acutely Inhibits Synchronized Spontaneous Ca2+ Oscillations in Cultured Hippocampal Networks. Acta Pharmacol. Sin. 2006, 27, 869–876. [Google Scholar] [CrossRef] [PubMed] [Green Version]
  47. Bohush, A.; Niewiadomska, G.; Filipek, A. Role of Mitogen Activated Protein Kinase Signaling in Parkinson’s Disease. Int. J. Mol. Sci. 2018, 19, 2973. [Google Scholar] [CrossRef] [PubMed] [Green Version]
  48. Chen, G.; Nie, S.; Han, C.; Ma, K.; Xu, Y.; Zhang, Z.; Papa, S.M.; Cao, X. Antidyskinetic Effects of MEK Inhibitor Are Associated with Multiple Neurochemical Alterations in the Striatum of Hemiparkinsonian Rats. Front. Neurosci. 2017, 11, 112. [Google Scholar] [CrossRef] [Green Version]
  49. Kosyakovsky, J.; Fine, J.M.; Frey, W.H.; Hanson, L.R. Mechanisms of Intranasal Deferoxamine in Neurodegenerative and Neurovascular Disease. Pharmaceuticals 2021, 14, 95. [Google Scholar] [CrossRef]
  50. Farr, A.C.; Xiong, M.P. Challenges and Opportunities of Deferoxamine Delivery for Treatment of Alzheimer’s Disease, Parkinson’s Disease, and Intracerebral Hemorrhage. Mol. Pharm. 2021, 18, 593–609. [Google Scholar] [CrossRef]
  51. Mounsey, R.B.; Teismann, P. Chelators in the Treatment of Iron Accumulation in Parkinson’s Disease. Int. J. Cell Biol. 2012, 2012, e983245. [Google Scholar] [CrossRef] [PubMed] [Green Version]
  52. Febbraro, F.; Andersen, K.J.; Sanchez-Guajardo, V.; Tentillier, N.; Romero-Ramos, M. Chronic Intranasal Deferoxamine Ameliorates Motor Defects and Pathology in the α-Synuclein RAAV Parkinson’s Model. Exp. Neurol. 2013, 247, 45–58. [Google Scholar] [CrossRef]
  53. Kim, H.-J.; Hida, H.; Jung, C.-G.; Miura, Y.; Nishino, H. Treatment with Deferoxamine Increases Neurons from Neural Stem/Progenitor Cells. Brain Res. 2006, 1092, 1–15. [Google Scholar] [CrossRef] [PubMed]
  54. Mursaleen, L.; Somavarapu, S.; Zariwala, M.G. Deferoxamine and Curcumin Loaded Nanocarriers Protect Against Rotenone-Induced Neurotoxicity. J. Parkinson Dis. 2020, 10, 99–111. [Google Scholar] [CrossRef] [PubMed]
  55. Ward, R.J.; Dexter, D.T.; Martin-Bastida, A.; Crichton, R.R. Is Chelation Therapy a Potential Treatment for Parkinson’s Disease? Int. J. Mol. Sci. 2021, 22, 3338. [Google Scholar] [CrossRef] [PubMed]
  56. Foster, D.J.; Conn, P.J. Allosteric Modulation of GPCRs: New Insights and Potential Utility for Treatment of Schizophrenia and Other CNS Disorders. Neuron 2017, 94, 431–446. [Google Scholar] [CrossRef] [Green Version]
  57. Shamseer, L.; Moher, D.; Clarke, M.; Ghersi, D.; Liberati, A.; Petticrew, M.; Shekelle, P.; Stewart, L.A. Preferred Reporting Items for Systematic Review and Meta-Analysis Protocols (PRISMA-P) 2015: Elaboration and Explanation. BMJ 2015, 349, g7647. [Google Scholar] [CrossRef] [Green Version]
  58. Li, P.; Ensink, E.; Lang, S.; Marshall, L.; Schilthuis, M.; Lamp, J.; Vega, I.; Labrie, V. Hemispheric Asymmetry in the Human Brain and in Parkinson’s Disease Is Linked to Divergent Epigenetic Patterns in Neurons. Genome Biol. 2020, 21, 61. [Google Scholar] [CrossRef] [Green Version]
  59. Schulze, M.; Sommer, A.; Plötz, S.; Farrell, M.; Winner, B.; Grosch, J.; Winkler, J.; Riemenschneider, M.J. Sporadic Parkinson’s Disease Derived Neuronal Cells Show Disease-Specific MRNA and Small RNA Signatures with Abundant Deregulation of PiRNAs. Acta Neuropathol. Commun. 2018, 6, 58. [Google Scholar] [CrossRef] [Green Version]
  60. Dumitriu, A.; Golji, J.; Labadorf, A.T.; Gao, B.; Beach, T.G.; Myers, R.H.; Longo, K.A.; Latourelle, J.C. Integrative Analyses of Proteomics and RNA Transcriptomics Implicate Mitochondrial Processes, Protein Folding Pathways and GWAS Loci in Parkinson Disease. BMC Med. Genom. 2016, 9, 5. [Google Scholar] [CrossRef] [Green Version]
  61. Nido, G.S.; Dick, F.; Toker, L.; Petersen, K.; Alves, G.; Tysnes, O.-B.; Jonassen, I.; Haugarvoll, K.; Tzoulis, C. Common Gene Expression Signatures in Parkinson’s Disease Are Driven by Changes in Cell Composition. Acta Neuropathol. Commun. 2020, 8, 55. [Google Scholar] [CrossRef] [PubMed] [Green Version]
  62. Leek, J.T. Svaseq: Removing Batch Effects and Other Unwanted Noise from Sequencing Data. Nucleic Acids Res. 2014, 42, e161. [Google Scholar] [CrossRef] [PubMed]
  63. Leek, J.T.; Johnson, W.E.; Parker, H.S.; Jaffe, A.E.; Storey, J.D. The Sva Package for Removing Batch Effects and Other Unwanted Variation in High-Throughput Experiments. Bioinformatics 2012, 28, 882–883. [Google Scholar] [CrossRef] [PubMed]
  64. Zhang, Y.; Parmigiani, G.; Johnson, W.E. ComBat-Seq: Batch Effect Adjustment for RNA-Seq Count Data. NAR Genom. Bioinform. 2020, 2, lqaa078. [Google Scholar] [CrossRef] [PubMed]
  65. Banerjee, A.; Dave, R.N. Validating clusters using the Hopkins statistic. In Proceedings of the IEEE International Conference on Fuzzy Systems, Budapest, Hungary, 25–29 July 2004; Volume 1, pp. 149–153. [Google Scholar]
  66. Charrad, M.; Ghazzali, N.; Boiteau, V.; Niknafs, A. NbClust: An R Package for Determining the Relevant Number of Clusters in a Data Set. J. Stat. Softw. 2014, 61, 1–36. [Google Scholar] [CrossRef] [Green Version]
  67. Kassambara, A.; Mundt, F. Package ‘Factoextra’. Extract Visual Results Multivariative Data Anallysis. Available online: https://cran.r-project.org/web/packages/factoextra/index.html (accessed on 10 May 2021).
  68. Rousseeuw, P.J. Silhouettes: A Graphical Aid to the Interpretation and Validation of Cluster Analysis. J. Comput. Appl. Math. 1987, 20, 53–65. [Google Scholar] [CrossRef] [Green Version]
  69. Liu, Y.; Li, Z.; Xiong, H.; Gao, X.; Wu, J. Understanding of internal clustering validation measures. In Proceedings of the IEEE International Conference on Data Mining, Sydney, Australia, 13–17 December 2010; Institute of Electrical and Electronics Engineers (IEEE): Piscataway, NJ, USA, 2010; pp. 911–916. [Google Scholar]
  70. R Core Team. R: A Language and Environment for Statistical Computing; R Foundation for Statistical Computing: Vienna, Austria, 2013. [Google Scholar]
  71. Hollander, M.; Wolfe, D.A.; Chicken, E. Nonparametric Statistical Methods; John Wiley & Sons: Hoboken, NJ, USA, 2013; Volume 751, ISBN 1118553292. [Google Scholar]
  72. Agresti, A. An Introduction to Categorical Data Analysis; John Wiley & Sons: Hoboken, NJ, USA, 2018; ISBN 1119405262. [Google Scholar]
  73. Smyth, G.K. Limma: Linear models for microarray Data. In Bioinformatics and Computational Biology Solutions Using R and Bioconductor; Springer: Cham, Switzerland, 2005; pp. 397–420. [Google Scholar]
  74. Benjamini, Y. Discovering the False Discovery Rate. J. R. Stat. Soc. Ser. B Stat. Methodol. 2010, 72, 405–416. [Google Scholar] [CrossRef]
  75. Raudvere, U.; Kolberg, L.; Kuzmin, I.; Arak, T.; Adler, P.; Peterson, H.; Vilo, J. g:Profiler: A Web Server for Functional Enrichment Analysis and Conversions of Gene Lists (2019 Update). Nucleic Acids Res. 2019, 47, W191–W198. [Google Scholar] [CrossRef] [Green Version]
  76. Piñero, J.; Ramírez-Anguita, J.M.; Saüch-Pitarch, J.; Ronzano, F.; Centeno, E.; Sanz, F.; Furlong, L.I. The DisGeNET Knowledge Platform for Disease Genomics: 2019 Update. Nucleic Acids Res. 2020, 48, D845–D855. [Google Scholar] [CrossRef] [Green Version]
  77. Fujita, K.A.; Ostaszewski, M.; Matsuoka, Y.; Ghosh, S.; Glaab, E.; Trefois, C.; Crespo, I.; Perumal, T.M.; Jurkowski, W.; Antony, P.M.A.; et al. Integrating Pathways of Parkinson’s Disease in a Molecular Interaction Map. Mol. Neurobiol. 2014, 49, 88–102. [Google Scholar] [CrossRef] [PubMed] [Green Version]
  78. Luo, W.; Brouwer, C. Pathview: An R/Bioconductor Package for Pathway-Based Data Integration and Visualization. Bioinformatics 2013, 29, 1830–1831. [Google Scholar] [CrossRef] [Green Version]
  79. Oliveira de Biagi, C.A.; Nociti, R.P.; Brotto, D.B.; Funicheli, B.O.; de Cássia Ruy, P.; Bianchi Ximenez, J.P.; Alves Figueiredo, D.L.; Araújo Silva, W. CeTF: An R/Bioconductor Package for Transcription Factor Co-Expression Networks Using Regulatory Impact Factors (RIF) and Partial Correlation and Information (PCIT) Analysis. BMC Genom. 2021, 22, 624. [Google Scholar] [CrossRef] [PubMed]
  80. Reverter, A.; Hudson, N.J.; Nagaraj, S.H.; Pérez-Enciso, M.; Dalrymple, B.P. Regulatory Impact Factors: Unraveling the Transcriptional Regulation of Complex Traits from Expression Data. Bioinformatics 2010, 26, 896–904. [Google Scholar] [CrossRef] [PubMed]
  81. Pedersen, T.L. Tidygraph: A Tidy API for Graph Manipulation. Available online: https://cran.r-project.org/web/packages/tidygraph/index.html (accessed on 10 May 2021).
  82. Szklarczyk, D.; Gable, A.L.; Lyon, D.; Junge, A.; Wyder, S.; Huerta-Cepas, J.; Simonovic, M.; Doncheva, N.T.; Morris, J.H.; Bork, P.; et al. STRING V11: Protein–Protein Association Networks with Increased Coverage, Supporting Functional Discovery in Genome-Wide Experimental Datasets. Nucleic Acids Res. 2019, 47, D607–D613. [Google Scholar] [CrossRef] [Green Version]
  83. Van Borkulo, C.D.; Boschloo, L.; Kossakowski, J.; Tio, P.; Schoevers, R.A.; Borsboom, D.; Waldorp, L.J. Comparing Network Structures on Three Aspects: A Permutation Test. J. Stat. Softw. 2017, 10. [Google Scholar] [CrossRef]
  84. Corsello, S.M.; Bittker, J.A.; Liu, Z.; Gould, J.; McCarren, P.; Hirschman, J.E.; Johnston, S.E.; Vrcic, A.; Wong, B.; Khan, M.; et al. The Drug Repurposing Hub: A next-Generation Drug Library and Information Resource. Nat. Med. 2017, 23, 405–408. [Google Scholar] [CrossRef] [Green Version]
  85. Freshour, S.L.; Kiwala, S.; Cotto, K.C.; Coffman, A.C.; McMichael, J.F.; Song, J.J.; Griffith, M.; Griffith, O.L.; Wagner, A.H. Integration of the Drug-Gene Interaction Database (DGIdb 4.0) with Open Crowdsource Efforts. Nucleic Acids Res. 2021, 49, D1144–D1151. [Google Scholar] [CrossRef] [PubMed]
  86. Zarin, D.A.; Tse, T.; Williams, R.J.; Califf, R.M.; Ide, N.C. The ClinicalTrials.Gov Results Database—Update and Key Issues. N. Engl. J. Med. 2011, 364, 852–860. [Google Scholar] [CrossRef] [Green Version]
  87. National Research Council (US) Committee on A Framework for Developing a New Taxonomy of Disease. Toward Precision Medicine: Building a Knowledge Network for Biomedical Research and a New Taxonomy of Disease; National Academies Press: Washington, DC, USA, 2011; ISBN 9780309222259.
  88. Strafella, C.; Caputo, V.; Termine, A.; Fabrizio, C.; Ruffo, P.; Potenza, S.; Cusumano, A.; Ricci, F.; Caltagirone, C.; Giardina, E. Genetic Determinants Highlight the Existence of Shared Etiopathogenetic Mechanisms Characterizing Age-Related Macular Degeneration and Neurodegenerative Disorders. Front. Neurol. 2021, 12, 626066. [Google Scholar] [CrossRef]
  89. Termine, A.; Fabrizio, C.; Strafella, C.; Caputo, V.; Petrosini, L.; Caltagirone, C.; Giardina, E.; Cascella, R. Multi-Layer Picture of Neurodegenerative Diseases: Lessons from the Use of Big Data through Artificial Intelligence. J. Pers. Med. 2021, 11, 280. [Google Scholar] [CrossRef] [PubMed]
Figure 1. Clustered subjects and clinical characterization. (A) PCA plot for RNA-Seq data, clearly showing PDC1 and PDC2 separation. (B) Boxplot for PDC1 and PDC2 age at death, reporting a significant difference * p value < 0.05.
Ijms 23 02557 g001
Figure 2. Differences between PDC1 and PDC2 gene expression. (A) Volcano plot reporting differences in gene expression where red points were DEGs. (B) Gene network for PDC1 showing nodes are segregated into 2 communities. (C) Gene network for PDC2, showing no segregation in communities. Both networks were built with the Kamada–Kawai layout, where each node is a gene and each edge is a PCIT value between genes.
Ijms 23 02557 g002
Figure 3. Differential network and measures of network regulators. (A) Differential network for PDC1 and PDC2 DEGs networks. (B) Bar plot for standardized centrality of genes from the differential network. (C) RIF 1 scores of genes from the differential network. (D) Difference in standardized centrality between genes from PDC1 and PDC2 networks (shown in Figure 2B,C).
Ijms 23 02557 g003
Figure 4. Venn diagram reporting the number of unique and overlapping DEGs found in PDC1 vs. NC and PDC2 vs. NC comparisons.
Ijms 23 02557 g004
Figure 5. Investigation of the disease mechanism of PDC1, based on PDC1 vs. NC unique DEGs. (A) Enrichment analysis of DEGs shows that these genes map mostly on synaptic functions, in particular on the glutamatergic synapse. (B) Pheatmap illustration of the glutamatergic synapse pathway, showing downregulation in neurotransmitter uptake (vGLUT) and feedback regulation of neurotransmission (mGluR2) functions.
Ijms 23 02557 g005
Figure 6. Investigation of the disease mechanism of PDC2, based on PDC2 vs. NC unique DEGs. (A) Enrichment analysis of DEGs shows that these genes map on inflammatory processes. (B) Gene network showing segregation in communities (only communities with significant PPI scores are colored). The network was built with the Kamada–Kawai layout, where each node is a gene and each edge is a PCIT value between genes.
Ijms 23 02557 g006
Figure 7. PRISMA flow diagram showing the step-by-step process of our search and selection applied during systematic data retrieval.
Ijms 23 02557 g007
Table 1. Compounds and drugs obtained from the drug repurposing pipeline. The modality of action of each compound was identified on DGIdb and validated through extensive literature assessment; PMIDs are reported in the table.
GeneDrugChEMBL-IDPhaseModality of ActionPMID
NEUROD1PD98059CHEMBL35482PreclinicalERK1⁄2 pathway inhibitor12297313
28337120
30274251
16787571
NEUROD1DEFEROXAMINECHEMBL556Launchedhexadentate iron chelator16697980
32926630
23531432
22754573
31868679
33513737
33805195
NEUROD1ISX9CHEMBL1222381Preclinicalneural stem cell inducer29311646
18552832
26407349
28656155
22542682
28216149
GRM2JNJ-40411813CHEMBL3337527Phase 2glutamate receptor positive allosteric modulator25462291
25586401
25735992
GRM2LY2979165CHEMBL3544939Phase 2glutamate receptor positive allosteric modulator32052375
33071070
29564482
GRM2LY2969822CHEMBL3545270Phase 1glutamate receptor agonist28177520
31306647
30934533
GRM2LY404039CHEMBL375611Phase 1glutamate receptor agonist32403118
32403118
GRM2BINACHEMBL593013Preclinicalglutamate receptor positive allosteric modulator16046122
16608916
17526600
24076101
28472649
GRM2CBiPESCHEMBL4303163Preclinicalglutamate receptor positive allosteric modulator15717213
19951716
22659090
Publisher’s Note: MDPI stays neutral with regard to jurisdictional claims in published maps and institutional affiliations.

