
HIF1A: A Putative Modifier of Hemochromatosis
by
 , ,
, ,
Sara Pelucchi
1, 
Giulia Ravasi
1,
Cristina Arosio
2,
Mario Mauri
1,
Rocco Piazza
1,3,
Raffaella Mariani
4 and
Alberto Piperno
1,4,5,* 1
Department of Medicine and Surgery, University of Milano-Bicocca, 20900 Monza, Italy
2
Liceo Artistico Statale Amedeo Modigliani, 20833 Giussano, Italy
3
Hematology and Clinical Research Unit, ASST-Monza, San Gerardo Hospital Monza, 20900 Monza, Italy
4
Centre of European Reference Network (EuroBloodNet) and Centre for Rare Diseases-Disorders of Iron Metabolism-ASST-Monza, San Gerardo Hospital Monza, 20900 Monza, Italy
5
Medical Genetics-ASST-Monza, S. Gerardo Hospital Monza, 20900 Monza, Italy
*
Author to whom correspondence should be addressed.
Int. J. Mol. Sci. 2021, 22(3), 1245; https://0-doi-org.brum.beds.ac.uk/10.3390/ijms22031245
Submission received: 21 December 2020
/
Revised: 22 January 2021
/
Accepted: 22 January 2021
/
Published: 27 January 2021
(This article belongs to the Special Issue Transport, Cellular Uptake and Metabolism of Iron: Molecular Aspects and Regulation in Health and Disease)
Abstract
:HFE-related hereditary hemochromatosis (HH) is characterized by marked phenotypic heterogeneity. Homozygosity for p.C282Y is a low penetrance genotype suggesting that the HFE-HH is a multifactorial disease resulting from a complex interaction involving a major gene defect, genetic background and environmental factors. We performed a targeted NGS-based gene panel to identify new candidate modifiers by using an extreme phenotype sampling study based on serum ferritin and iron removed/age ratio. We found an increased prevalence of the HIF1A p.Phe582Ser and p.Ala588Thr variants in patients with a severe iron and clinical phenotype. Accordingly, Huh-7 cells transfected with both variants showed significantly lower HAMP promoter activity by luciferase assay. The qRT-PCR assays showed a downregulation of hepcidin and an upregulation of the HIF1A target genes (VEGF, HMOX, FUR, TMPRSS6) in cells transfected with the HIF1A-P582S vector. We identified mutations in other genes (e.g., Serpina1) that might have some relevance in single cases in aggravating or mitigating disease manifestation. In conclusion, the present study identified HIF1A as a possible modifier of the HFE-HH phenotype cooperating with the genetic defect in downregulating hepcidin synthesis. In addition, this study highlights that an NGS-based approach could broaden our knowledge and help in characterizing the genetic complexity of HFE-HH patients with a severe phenotype expression.
1. Introduction
Type 1 hemochromatosis (HH) is the most common inherited iron overload disorders in Caucasians, and homozygosity for the p.Cys282Tyr mutation of the HFE gene is the most frequent disease-causing genotype. Homozygotes for p.Cys282Tyr may develop iron-related complications, but clinical penetrance is low and expression largely differs between cases. Thus, only a proportion of these subjects will progress to exhibit the full HH phenotype [1]. Acquired factors may influence the HH phenotypes [2,3] and there is evidence that variants in genes involved in hepcidin regulation, iron uptake and transport, and other genes not directly linked to iron metabolism, e.g., SERPINA1, HP, GNPAT and PCSK7 might modulate the expression of the disease [4,5,6,7,8,9,10,11]. However, none of the polymorphic variants identified to date in candidate-gene and genome-wide association studies emerged as major modifiers of HH phenotype. This supports the idea that type 1 HH is a multifactorial disease resulting from a complex interaction involving a major gene defect, genetic background and environmental factors (e.g., alcohol intake and liver steatosis) [12,13,14]. In the present study, we performed a targeted NGS-based gene panel to identify new candidate polymorphisms that may act as modulators of the disease phenotype in Italian p.Cys282Tyr homozygous patients.
2. Results
2.1. Iron and Clinical Status
Table 1 shows the main data of the 99 HH patients divided according to the HAS-score (Haute Autorité de Santé) (0–2 vs. 3–4); 41 patients were classified in the less severe group (HAS-low) and 58 in the more severe group (HAS-high). As expected, they significantly differed for sFerr (serum Ferritin), TSAT (Transferrin SATuration) and IR/age (Iron Removed), liver function tests and glycemia. Clinical complications were significantly more frequent in HAS-high than in HAS-low (liver fibrosis in 93.1% vs. 12.1%, of whom 31% vs. 0% had liver cirrhosis; diabetes or glucose intolerance in 27.6% vs. 3%, hypogonadism in 17.2% and cardiopathy in 13.8% vs. none). Table 2 shows the data of the 26 HH patients divided according to extreme phenotypes (L-Iron and H-Iron), selected as reported in the Materials and Methods Section. There were significant differences in iron and hepatic indices, BMI (Body Mass Index) and glucose between patients’ subgroups. None of the patients in the L-Iron subgroup had organ damage while 55% in the H-Iron subgroup had liver cirrhosis (Ishak’s stage 5 or 6) and 45% moderate–severe fibrosis (stage 3 or 4), 45% had clinical and/or laboratory signs of pituitary hypogonadism, 36% had artropathy, 27% diabetes, and 18% early signs of cardiomyopathy (increased interventricular septum thickness and left atrial diameter) [15].
2.2. Analysis of NGS Data
We found 679 different variants, of which 77 were in exons, 88 upstream, 122 downstream, and 1 in the splice site region, and 391 were in introns (Supplementary Table S2). Relative to the 77 exonic variants, 73 were already registered with a reference ID: 41 were synonymous variants, 31 were missense, and one was a nucleotide insertion causing a frameshift. Four mutations are still not registered, three were synonymous (Furin, HIF1A and TMPRSS6), and one was a missense mutation in IREB2. Table 3 reports the list of the non-synonymous exonic variants and their allele frequencies in patients and Genome Aggregation Database (gnomAD). Six variants showed different distribution in H- and/or L-Iron HH groups compared to gnomAD (p < 0.001). In detail, the p.Ser266Asn (rs10455) in CYBRD1 is a common non-pathogenic variant that was more represented in the L-Iron group; the rs1456427498 in IREB2 (p.Tyr8fs), reported as a very rare mutation in gnomAD (allele frequency 0.00065), was more represented in both H- and L-Iron groups (one patient in H-Iron and two in L-Iron in the heterozygous state); the rs2958720 in IREB2 (p.Val159Leu) is a highly frequent variant that was less represented in both H-Iron and L-Iron groups. The rs2235324 in TMPRSS6 (p.Lys253Glu) is a common non-deleterious polymorphism [16,17] whose minor allele was not represented in the H-Iron group. Two variants in HIF1A (p.Phe582Ser (rs11549465, C > T) and p.Ala588Thr (rs11549467, G > A)) were more frequent in the H-Iron group, and they were in complete linkage disequilibrium. In total, nine out of the 11 patients in the H-Iron (82%) compared to 4 of 15 (27%) carried one or the other HIF1A variants [18]. The two variants in HIF1A were evaluated in the entire cohort of 99 patients by Sanger’s sequencing. Genotypes carrying the rs11549465 minor allele were more common in HAS-high than in the HAS-light group (19/58 (0.33) vs. 5/41 (0.12), respectively, p = 0.019) and those carrying the rs11549467 variant were found only in two HAS-high patients. Focusing on the HH-related gene and on genes causing inherited iron diseases, we found only two known synonymous variants in TFR2 (p.Ala617Ala) and SLC40A1 (p.Val221Val), and exonic non-synonymous variants in CP, TF, and TMPRSS6 in the heterozygous state, respectively. We also found exonic non-synonymous variants in BMP6, HP and Serpina1, whose proteins might act as possible modulators of hepcidin synthesis and iron overload [19,20,21]. Of the four CP variants, one (rs701753, p.Glu544Asp) was a non-pathogenic polymorphism equally distributed between the H- and L-Iron groups. The others showed a different distribution between the two groups: two patients in the L-Iron group carried p.Thr551Ile (rs61733458) and p.Arg793His (rs115552500) variants, respectively. p.Thr551Ile was firstly described in Parkinson’s disease patients [22] and classified as probably pathogenetic in silico (SIFT = 0.0; Polyphen = 1.0) as well as p.Arg793His (SIFT = 0.05; Polyphen = 0.892). p.Pro477Leu (rs35331711) (SIFT = 0.0; Polyphen = 0.984) was found in one patient in the H-Iron group. TF variants were common non-deleterious polymorphisms equally distributed between the L- and H-Iron groups. While the common p.Val736Ala variant in TMPRSS6 was similarly frequent in the H- and L-iron groups, another two polymorphisms (p.Lys235Glu, rs2235324; p.Ala31Val, rs200558933) were identified only in four patients in the L-Iron group. A single patient in the L-Iron group carried the very rare p.Gln114Arg variant in BMP6 (rs377443730) currently classified as a VUS (variant of uncertain significance). Two patients in the L-Iron group showed two rare variants in HP (p.Ala371Ser, rs376612221; p.Val258Leu, rs746679401), classified as deleterious or uncertain, respectively; both patients showed normal serum haptoglobin levels (160 and 132 mg/dL; normal values: 30–200 mg/dL). Lastly, three patients carried mutations in Serpina1 encoding α1-antitrypsin (A1AT). Two were in the L-Iron group and carried the p.Glu288Val responsible for the PiS form [23]. Accordingly, they had serum A1AT levels in the range of PiS heterozygotes (84 and 82 mg/dL, respectively; normal range 90–200 mg/dL). The other patient belonged to the H-Iron group and carried the p.Glu366Lys, described as PiZ [24], in the homozygous state, and displayed a very low serum A1AT level (25 mg/dL), as expected.
2.3. In Vitro Study
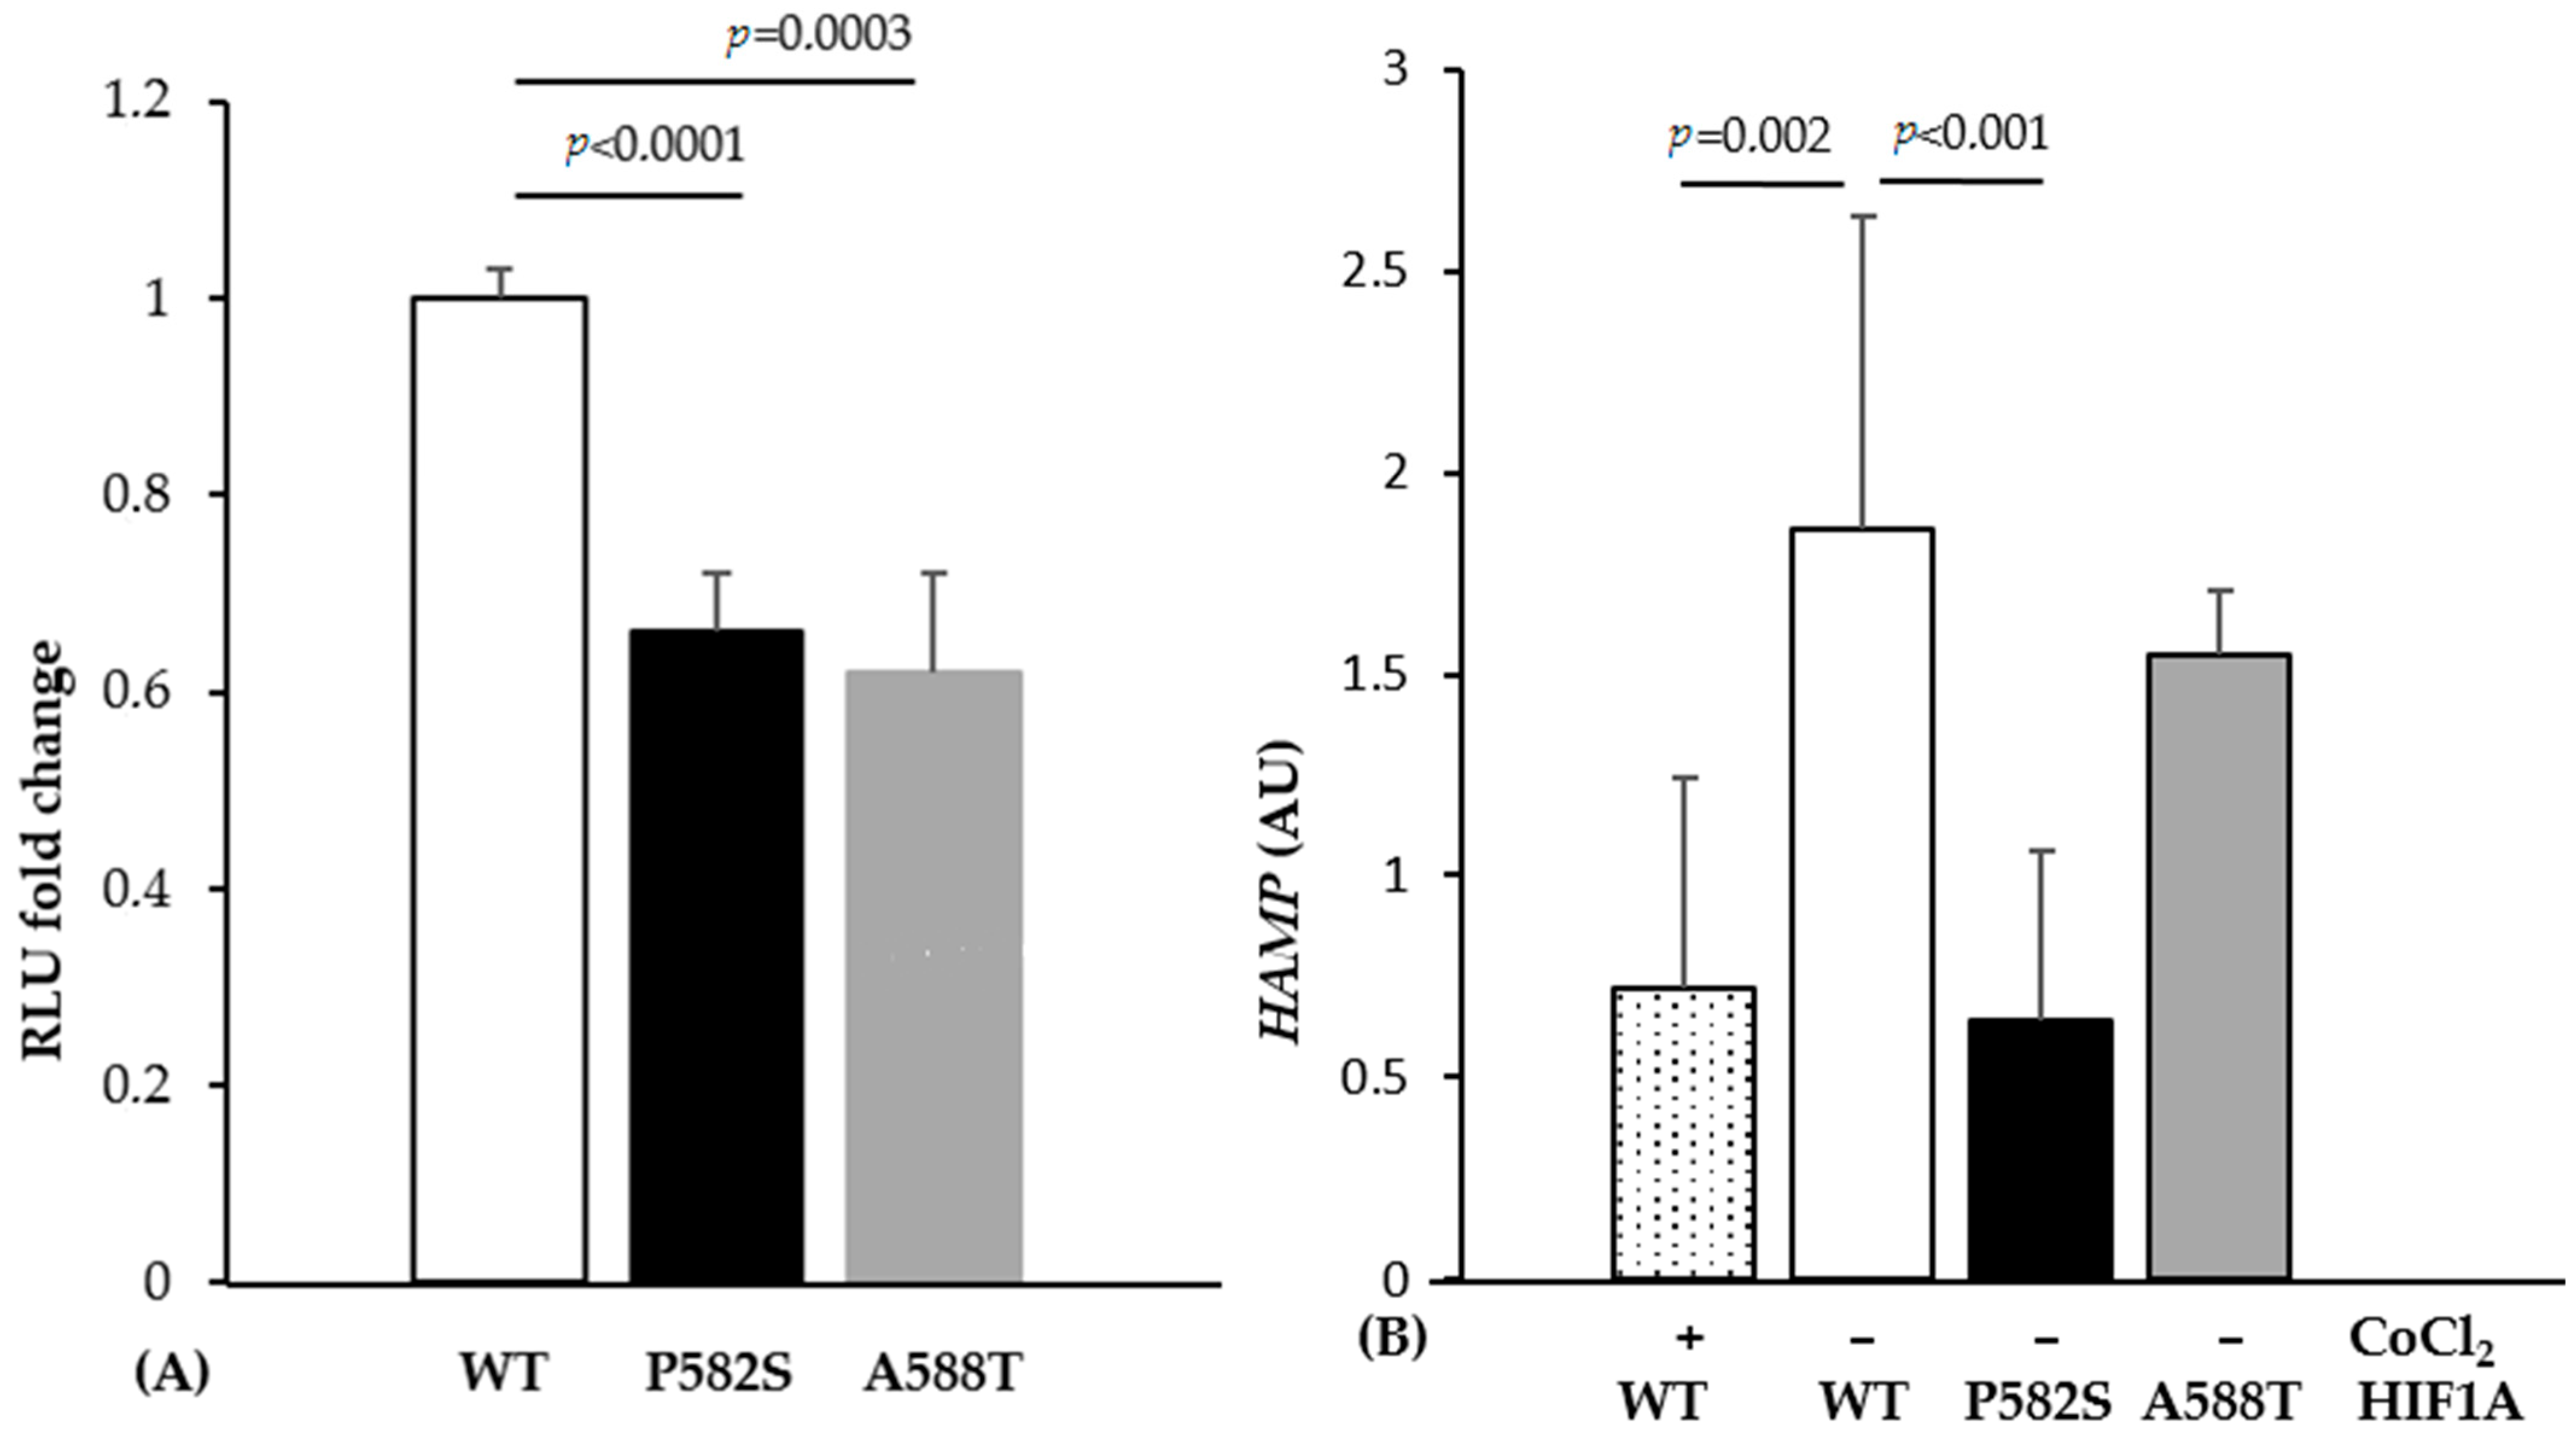
Luciferase assays showed a significant decrease in relative luminescence unit (RLU) when cells were co-transfected with mutant-containing vectors compared to wild type (34% and 38% decrease for HIF1A-P582S and HIF1A-A588T, respectively) (Figure 1A). Cells transfected with the HIF1A-P582S, but not with the HIF1A-A588T vector, showed a significant downregulation of HAMP expression compared to the wild type vector, comparable to that occurring in cells transfected with the HIF1A-WT vector treated with CoCl2 (Figure 1B).
To confirm the correct transfection, we quantified the mRNAs of HIF1A, and genes that are known to be upregulated by the binding of HIF1A on HIF responsive elements (VEGF, HMOX, FUR, TMPRSS6). As expected, they were all upregulated when the cells were transfected with the HIF1A-P582S but not with HIF1A-A588T vectors (Table 4).
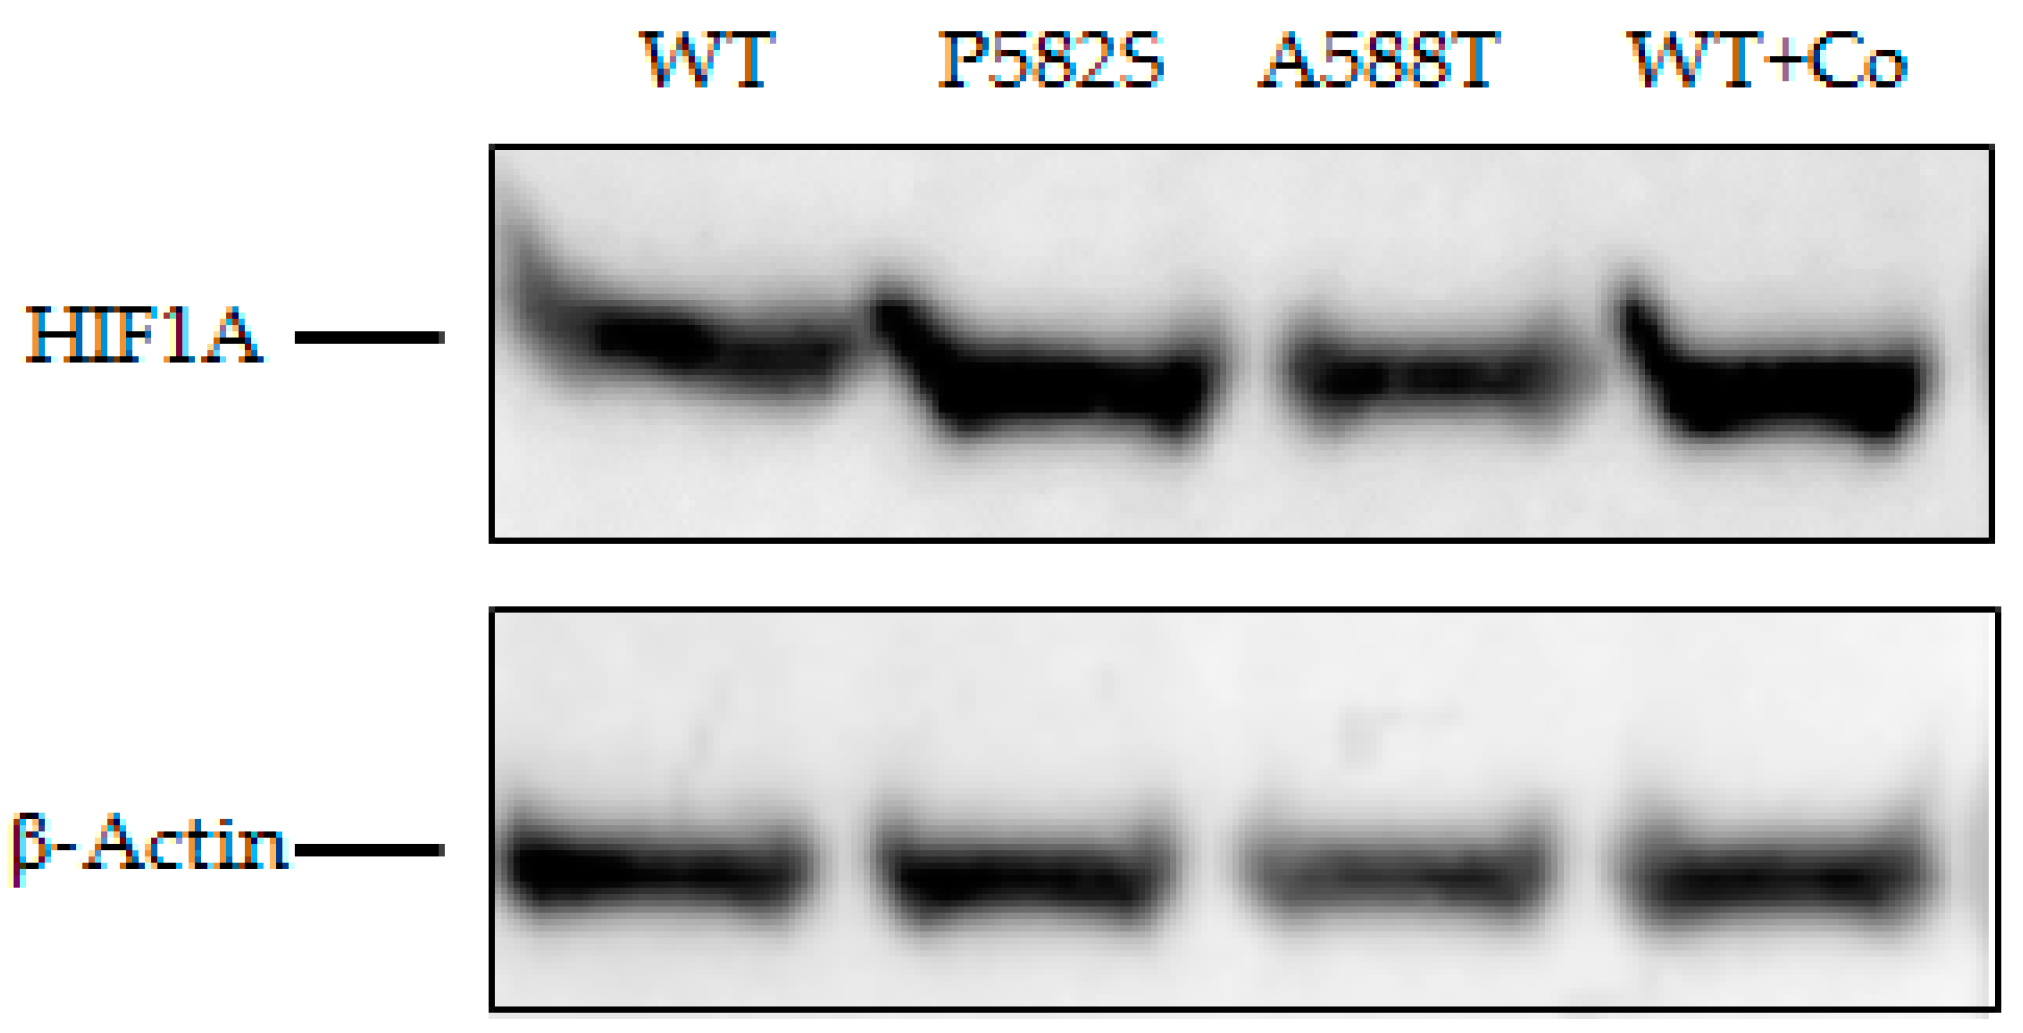
The Western blot showed increased HIF1A in Huh-7 cell lysates transfected with both variants compared to the HIFA1-wild type. Such an increase was more evident for the HIF1A-P582S and comparable with that observed in chemically induced hypoxia cell lysates (Figure 2).
3. Discussion
In recent years, several studies aimed at identifying acquired and inherited factors explaining the marked phenotype heterogeneity of HFE-related hemochromatosis (HFE-HH). Gender, age, alcohol intake, and the coexistence of metabolic abnormalities, viral hepatitis and β-thalassemia are all able to influence the severity of iron overload and/or clinical complications [12,14,25]. Supported by studies in the HFE-HH animal model, efforts have been made to identify genetic modifiers in humans [4,5,6,7,8,9,10,25]. Several polymorphic variants in genes involved in iron metabolism or even apparently unrelated (e.g., PCSK7, GNPAT) have been proposed as potential modifiers of HFE-HH phenotype, although results have often been controversial [9,26]. However, there might be several reasons to explain these differences. First, the phenotypic description of HH remains difficult and imprecise: markers of iron burden are subject to frequent limitations; serum ferritin varies according to age and gender and it can be markedly influenced by several factors that may coexist in HH [12]. Hepatic iron measurement requires liver biopsy that is infrequently performed, or quantitative assessment by magnetic resonance, which is also not routinely done and is less reliable for measuring liver iron concentration in the lower or higher ranges [27]. Indicators of organ damage allow for a precise case description, however, the non-specificity of most clinical symptoms, particularly in less severe cases, and the high prevalence of co-damaging factors, such as metabolic syndrome and alcohol, may result in overestimating the role of iron in the clinical presentation.
In an attempt to overcome these limitations, we exploited the extreme phenotyping sampling study (EPS) for increasing the power of genetic association studies [28]. Although this approach is not free from risks of inflated false positive rates [29], it can be a useful tool in preliminary investigations in complex and heterogeneous disorders.
We firstly selected our cohort for the known cofactors able to influence iron overload and clinical complications. We then sampled patients with an extreme phenotype based on two combined markers of iron burden: serum ferritin and iron removed by phlebotomies corrected for age. Since phlebotomy, with the careful measurement of the amount of iron removed in the blood, is the most accurate measure of total body iron stores [30], we were confident that combining both markers allowed the true selection of two groups with the extreme phenotype, although this reduced the available sample size. Indeed, the two groups markedly and significantly differed both in terms of iron overload and in terms of the severity of the clinical picture (Table 2).
The analysis of the NGS data highlighted three main findings. First, the lack of causal mutations in other HH-related genes confirmed that mutations in non-HFE genes are rare and that di-genic inheritance can occasionally explain the occurrence of a severe phenotype in HFE-HH [31]. Second, we identified six exonic polymorphisms or rare variants whose prevalence differed in patients compared to that reported in gnomAD. However, rs10455 in CYBRD1 is a common non-pathogenic polymorphism, rs2958720 and rs1456427498 in IREB2 were under- or over-represented in both L- and H-Iron groups suggesting that they have no relevant role as HFE-HH phenotype modifiers. The rs2235324 in TMPRSS6 (p.Lys253Glu) is a common polymorphism [16,17] whose minor allele was not found in the H-Iron group. Although the rs2235324 variant in TMPRSS6 is predicted as being neutral by mutation prediction software [32], two reports from China and Japan suggested that homozygosity for this variant might be implicated in the IRIDA-like phenotype [33,34]. Interestingly, two out of three patients in the L-Iron group carried the rs2235324 variant in the homozygous state, suggesting a possible protective effect on phenotype expression. Thus, the role of this polymorphism remains uncertain and further studies regarding its functional assessment are needed. Due to the increased prevalence of HIF1A p.Phe582Ser and p.Ala588Thr variants in H-Iron as well as in HAS-high groups (Haute Autorité de Santé), and their potential role in influencing the stability of HIF1A [18,35], we evaluated their functional role as potential modifiers of the HFE-HH phenotype. There is extensive evidence that the production of hepcidin is downregulated under hypoxic conditions [36,37] and that HAMP and other genes involved in hepcidin regulation (TMPRSS6 and FUR) harbor hypoxia-responsive elements (HREs) [38,39]. However, it is controversial whether HAMP is a direct target of HIF or if hypoxia-induced hepcidin downregulation occurs indirectly, e.g., through TMPRSS6 upregulation and the increased degradation of membrane-bound hemojuvelin, and/or erythropoiesis activation [37,38,40,41]. Previous studies showed that the HIF1A protein carrying polymorphic p.Phe582Ser or p.Ala588Thr variants displayed higher transactivation capacity in vitro under both normoxic and hypoxic conditions, maintaining the hypoxia-dependent induction response, when compared with the wild type protein [18]. These substituted amino acids are located within or near the N-terminal transactivation domain (N-TAD) and the conserved Pro564 residue, interacting with E3 ubiquitin ligase von Hippel–Lindau tumor suppressor protein (pVHL). It was suggested that one possible mechanism for the observed enhancement of transactivation capacity may be the alteration of protein stability, and that the presence of these variants hinders the hydroxylation of Pro564 residue stabilizing HIF1A and increasing its transcriptional regulation activity in both normoxia and hypoxia [18]. To investigate the role of the two HIF1A variants on HAMP activity, we performed in vitro experiments on Huh-7, a human hemochromatosis cell line [42]. We showed a comparable reduction in the luciferase activity of the HAMP promoter with both variants compared to the wild type. However, the p.Phe582Ser variant seemed stronger than p.Ala588Thr in stabilizing HIF1A activity and inducing HAMP downregulation. This is supported by i. the upregulation of the HIF1A transcript and protein in cells transfected with the HIF1A-P582S vector; ii. the significant downregulation of HAMP mRNA in cells transfected with the HIF1A-P582S vector which was comparable to that observed in chemically induced hypoxia; iii. the significant upregulation of the HIF1A target mRNA genes (VEGF, HMOX, FUR, TMPRSS6) in cells transfected with the HIF1A-P582S vector. These findings allow the following conclusions to be made: first, HIF1A can directly modulate the expression of HAMP through the binding to the HAMP promoter HREs as previously reported [43]; second, the p.Phe582Ser variant mimics a hypoxia status (genetically induced) by stabilizing HIF1A; third, p.Phe582Ser variant HAMP inhibition can be the result of the combination of direct (HIF1A-induced) and indirect (the upregulation of FUR and TMPRSS6) effects [44]. In fact, furin might increase the production of mature hepcidin by pro-hepcidin cleavage, and matriptase-2 may increase the cleavage of hemojuvelin, thus suppressing hepcidin synthesis [40]. Although the rare HIF1A p.Ala588Thr (rs11549467) variant was identified exclusively in the more severe H-iron group, its role remains uncertain, as functional studies gave controversial results showing reduced HAMP-promoter activity by luciferase assay but no effects on mRNA expression by qRT-PCR assays. Such difference could be due to the higher sensibility of the luciferase assay system to detect even small differences compared to the qRT-PCR [37]. Overall, these results suggest that HIF1A variants might be candidate modifiers of the HFE-HH phenotype by aggravating hepcidin suppression, the p.Phe582Ser variant showing higher penetrance than p.Ala588Thr (Figure 3).
A third finding concerns the identification of mutations in Serpina1 and Cp genes that might have some relevance in single cases in aggravating or mitigating disease expression. Six polymorphic variants of α1-antitrypsin, including PiS and PiZ, were identified, whose prevalence did not differ as compared to that in control populations. However, one patient with very severe phenotype (age 40 years, TSAT 88%, s-Ferritin 4728 ng/mL, IR 14.6 g, liver cirrhosis and arthropathy) was also homozygous for the PiZZ allele. This finding reinforces what was observed by Schaefer et al. [45] suggesting that the coinheritance of homozygosity for the PiZZ allele could be a trigger of hepatic iron overload in genetically predisposed individuals by suppressing hepcidin synthesis.
We found four CP variants in the L- and H-iron groups, of whom one is a common polymorphism (p.Glu544Asp). Two patients in the L-Iron group carried the p.Thr551Ile variant (rs61733458) and p.Arg793His (rs115552500), respectively. Although described as likely pathogenetic by in silico testing, it is uncertain whether they have any clinical significance (https://web.expasy.org, accessed on 20 December 2020) [46]. Hochstrasser et al. [47] reported a slight reduction in ceruloplasmin concentrations and ferroxidase activity in patients with Parkinson’s disease carrying the p.Arg793His variant. We performed a functional study of p.Thr551Ile variant in HepG2 cells: the ceruloplasmin band was absent in both cell lysate and in culture media, supporting its damaging effect (personal data). The last variant p.Pro477Leu (rs35331711) identified in one patient in the H-iron group seems to have marginal clinical significance (https://clinvarminer.genetics.utah.edu, accessed on 20 December 2020) [48] as also shown by a functional study (personal data). Overall, these findings do not allow for speculation on the role of Cp variants in modulating phenotype expression in patients with HFE-HH. However, further studies may be worthwhile considering the role of the protein in iron recycling.
In conclusion, the present study identified HIF1A as a possible modifier of the HFE-HH phenotype. In addition, it showed that an NGS-based approach could be used to expand our knowledge and help in characterizing the genetic complexity of HFE-HH patients with severe phenotype expression.
4. Materials and Methods
Extreme phenotype sampling (EPS) is a popular study design for increasing the power of genetic association studies. Assuming a large cohort with available continuous phenotype data, EPS only involves genotyping individuals in the top and bottom extremes of the phenotype distribution. The rationale for this design is that the phenotypic extremes are enriched for either deleterious or protective variants and so the power to detect genetic effects can be maintained even while genotyping a smaller subset of a larger cohort [28].
4.1. Patients
From the entire cohort of p.Cys282Tyr homozygous patients attending the Centre for iron metabolism disorders at the ASST-Monza, San Gerardo Hospital, we excluded females and patients with coexistent chronic liver diseases (autoimmune hepatitis, chronic B or C virus hepatitis, non-alcoholic steatohepatitis), alcohol intake >50 g/day in men and >30 g/day in women [12], a previous history of regular blood donations, concomitant iron loading anemias and those with metabolic syndrome according to previously defined criteria [50]. Inclusion criteria were: p.Cys282Tyr homozygosity, age and serum iron indices (serum iron, transferrin and ferritin), the assessment of iron-related complications at diagnosis and the amount of iron removed based on the number of phlebotomies performed to achieve iron depletion (serum ferritin around 50 ng/mL) [51]. Among the 99 patients fulfilling the exclusion and inclusion criteria, we selected two groups of patients with extreme iron phenotypes, light (L-Iron) and heavy (H-Iron) according to ferritin levels (sFerr) and the amount of iron removed corrected for the age (IR/age) as previously reported [9,52]. The L-Iron group included patients with sFerr ≤ 1000 µg/L and IR/age ≤ 0.15 g/years, while the H-Iron group included patients with sFerr ≥ 2000 µg/L and IR/age ≥ 0.33 g/years. The 26 patients with extreme phenotypes underwent molecular study by the NGS-based panel in order to identify candidate modifiers. Variants that showed significant different allele frequencies in the H-Iron group compared to those in Genome Aggregation Database (gnomAD) [53] were subsequently re-analyzed by Sanger sequencing for confirmation. Two variants in HIF1A (rs11549465 and rs11549467) so identified, were analyzed in the whole group of 99 patients according to the HAS-score as previously described [54], and their functional effect on hepcidin expression was evaluated in human hepatic cell lines. All patients gave their written informed consent according to institution’s guidelines.
4.2. NGS Panel
A panel of 25 genes and 6 SNPs currently associated with iron metabolism and hereditary iron overload disorders [7,10] was designed and optimized using SureDesignTM software (Agilent Technologies, Santa Clara, CA, USA). The panel consisted of 12.224 amplicons with an average of 200 bp in length, covering a cumulative target sequence of 185.730 Kbp including coding regions, exon/intron junctions, promoters and the target regions of SNPs of interest. The complete list of genes sequenced is reported in Supplementary Table S1.
4.3. Library Preparation and Sequencing
Blood samples were collected for DNA extraction from all subjects into tubes containing EDTA. Genomic DNA was extracted from the whole blood of each subject using the Wizard® Genomic DNA Purification kit (Promega, Madison, WI, USA), and stored at −20 °C before use. DNA concentration was measured using the Qubit dsDNA assay kit with Qubit fluorometer 2.0 (ThermoFisher Scientific, Waltham, MA, USA). Custom libraries were generated starting from 225 ng DNA of 26 patients of first cohort using a custom design HaloPlex Target Enrichment kit (Agilent Technologies, Santa Clara, CA, USA) according to the manufacturer’s protocol. Library quality and quantity were determined using the Agilent High Sensitivity DNA kit on the Agilent 2100 bioanalyzer (Agilent Technologies, Santa Clara, CA, USA). Libraries were then sequenced using Ion PGM Hi-Q OT2 kit and Ion PGM Hi-Q Sequencing Kit on Ion PGM 318 chip V2 on an Ion Torrent PGM (ThermoFisher Scientific, Waltham, MA, USA).
4.4. Data Analysis
Post run QC/QA filtering was performed using the Torrent Suit (version 3.6; ThermoFisher Scientific, Waltham, MA, USA), and sequences aligned to the human genome version 19 (HG19) using T-MAP (version 3.6.58977, ThermoFisher Scientific, Waltham, MA, USA). Variants were called using the Torrent Variant Caller (version 5.2, with Germ Line–Low Stringency configuration), annotated using wANNOVAR and SureCallTM Software (Agilent Technologies, Santa Clara, CA, USA). The variant calling plugin was set to include variants with a minimum coverage of 20X, following the software developers’ recommendations.
4.5. PCR and Sequencing
Direct sequencing of the exon 12 of HIF1A was carried out by ABI Prism 3100 Avant DNA sequencer (PE Applied Biosystems, Foster City, CA, USA) for the 73 patients not analyzed by NGS. Sequences were compared with GenBank Accession No. NM_001530. The amplicon of 572 bp covered both rs11549465 (c.1744C > T coding for p.Phe582Ser) and rs11549467 (c.1762G > A coding for p.Ala588Thr).
4.6. Mutagenesis
pReceiver-Lv225 vector (Genecopoeia) containing the HIF1A wild type gene was mutated into p.Phe582Ser and p.A588T variants using Q5® Site-Directed Mutagenesis Kit (NEB New England BioLabs, Ipswich, MA, USA) according manufacturer’s protocol.
4.7. Cell Culture, Transfection and Hypoxia Treatment
The human hepatoma cell line Huh-7 was grown in DMEM (Dulbecco’s modified Eagle medium) supplemented with 10% heat inactivated fetal bovine serum (FBS), glutamine and combined antibiotics, at 37 °C and 5% CO2. To examine the effect of HIF1A vectors, cells were seeded in 6-well plates (300,000 cells/well). After 24 h, the cells were transiently transfected with wild type and mutant constructs (1.1 µg) by Fugene HD transfection reagent (Promega, Madison, WI, USA). One day later they were harvested for mRNA isolation and gene expression analysis as reported below. Cells were grown in normoxia and hypoxia, chemically induced with CoCl2, as reported in [55]. Experiments were performed in triplicate on three independent occasions.
4.8. Dual-Luciferase Reporter Assay
We used a dual-luciferase reporter assay to evaluate the luciferase activity [37]. Huh-7 cells were seeded in 48-well plates at 40% of confluency. Cells were transiently co-transfected with i. the pGL2 reporter vector (Promega Corp., Madison, WI, USA) harboring a 2.9 Kb fragment of human HAMP promoter (250 ng) [37]; ii. the pReceiver-Lv225 vector containing the wild type and the mutated (p.Phe582Ser and p.Ala588Thr) HIF1A variants, respectively (25 ng/each); iii. the pRL-TK renilla luciferase vector (15 ng) (Promega Corp., Madison, WI, USA) to control transfection efficiency by Fugene HD transfection reagent (Promega Corp., Madison, WI, USA). The pGL-basic plasmids were also co-transfected with the pRL-TK renilla vector as a negative control. After 48 h of transfection, the cells were lysed and firefly and renilla luciferase activities were measured by Glomax Multi JR luminometer according to manufacturer’s protocols (Promega Corp., Madison, WI, USA). Relative luciferase activity was calculated as the ratio between the firefly (reporter) and Renilla luciferase activity and expressed as the RLU fold change compared to wild type. Three independent experiments were performed in triplicate.
4.9. RNA Extraction and cDNA Synthesis
RNA from the cell cultures was extracted using the ZR RNA mini-prep (Zymo Research Corporation, Irvine, CA, USA) according to the manufacturer’s protocol, and quantified by spectrophotometry. RNA integrity was assessed by non-denaturing agarose gel. Two hundred and twenty five nanograms of total RNA for a final concentration of 20 ng/µL was used as template for reverse transcription, performed using the High Capacity cDNA Archive kit (Thermo Fisher, Foster City, CA, USA), according to the manufacturer’s protocol.
4.10. Real-Time Quantitative-PCR
mRNA expression levels of HAMP, HIF1A, VEGF, HMOX, FUR and TMPRSS6 were evaluated by quantitative real-time PCR (qRT-PCR); HPRT1 was chosen as the housekeeping gene. The analysis was performed on QuantStudio 7 (Thermo Fisher, Foster City, CA, USA) using the Assays-on-Demand Gene Expression Products (Thermo Fisher, Foster City, CA, USA) according to the manufacturer’s protocol. All analyses were carried out in triplicate; results showing a discrepancy greater than 0.3 cycles between the samples were excluded. Relative quantities present in each sample were assessed using the 2−ΔΔCt methods and reported as arbitrary unit (AU). Non-retrotranscribed RNAs were included in each amplification plate, and the analysis was considered valid if the fluorescence intensity in the no-template control was zero.
4.11. Western Blot
Proteins obtained from cell lysates were extracted by NET buffer, electrophoresed on NuPAGE 4−12% bis-Tris gel (ThermoFisher Scientific, Waltham, MA, USA) then probed with primary antibodies HIF1α (AbCam, Cambridge, UK) and β-Actin (Sigma, St. Louis, MO, USA) followed by HRP-conjugated secondary antibody (GE Healthcare, Amersham Biosciences Europe GmbH, Freiburg, Germany). Bands were visualized by using enhanced chemiluminescence (GE Healthcare, Amersham Biosciences Europe GmbH, Freiburg, Germany) and images quantified using a Gel-Doc phosphor imager (Bio-Rad Laboratories, Hercules, CA, USA), ImageJ software and normalized by the intensity of β-actin.
4.12. Statistical Analysis
Percentages and medians (with first to third quartiles) were used for descriptive purposes, as appropriate. Continuous variables in different groups were compared by non-parametric tests (i.e., Mann–Whitney test). Hardy–Weinberg equilibrium was examined for all subjects using the Chi-squared test. Allele and genotype frequencies in L- and H-iron and HAS-high and -low subgroups were compared using the chi-square or Fisher’s test as needed. The gnomAD data in the European (non-Finnish) populations were used as reference allele frequency. In the in vitro transfection experiments, the t-test was used to compare values in normoxia and after hypoxia exposure in wild type and mutant transfected Huh-7 cells. All tests were two sided and with a significance level of α equal to 0.05. Analyses were carried out by the Origin® statistical analysis software (version 2016, OriginLab Corporation, Northampton, MA, USA).
Supplementary Materials
Supplementary materials can be found at https://0-www-mdpi-com.brum.beds.ac.uk/1422-0067/22/3/1245/s1.
Author Contributions
Conceptualization, S.P. and A.P.; methodology, G.R., C.A., M.M. and R.P.; validation, G.R.; formal analysis, S.P., G.R. and C.A.; investigation, data curation, S.P., G.R. and R.M.; writing—original draft preparation, S.P. and A.P.; writing—review and editing, S.P., G.R., C.A., M.M., R.P., R.M. and A.P.; supervision, A.P. All authors have read and agreed to the published version of the manuscript.
Funding
This research was funded by FAQD-2017 and FAQD-2018 (Fondo Ateneo Quota Dipartimentale) to AP and partially by “Association for the Study of Hemochromatosis and Iron overload Disorders”—ONLUS, Monza.
Institutional Review Board Statement
The study was conducted according to the guidelines of the Declaration of Helsinki, and approved by the Institutional Review Board of ASST Monza under the General Data Protection Regulation (GDPR) 679/2016 and Legislative Decree 101/2018 (protocol code GEN-CI-001A, dated 10 December 2018).
Informed Consent Statement
Informed consent was obtained from all subjects involved in the study.
Data Availability Statement
Not applicable.
Acknowledgments
The authors thank Serena Melgrati for English editing.
Conflicts of Interest
The authors declare no conflict of interest.
Abbreviations
| A1AT | Alpha 1 Anti-Trypsin |
| ALT | Alanine Amino Transferase |
| AST | Aspartate Amino Transferase |
| AU | Arbitrary Unit |
| BMI | Body Mass Index |
| DMEM | Dulbecco’s Modified Eagle Medium |
| EPS | Extreme Phenotype Sampling |
| FBS | Fetal Bovine Serum |
| gnomAD | Genome Aggregation Database |
| HAS | Haute Autorité de Santé |
| HIF1A-WT | Vector Carrying cDNA of HIF1A Wild Type |
| HIF1A-P582S | Vector Carrying cDNA of HIF1A with p.Phe582Ser Variant |
| HIF1A-A588T | Vector Carrying cDNA of HIF1A with p.Ala588Thr Variant |
| HRE | Hypoxia Responsive Element |
| HDL | High-Density Lipoprotein |
| HH | Hereditary Hemochromatosis |
| IR | Iron Removed |
| NGS | Next Generation Sequencing |
| qRT-PCR | Quantitative-Real Time Polymerase Chain Reaction |
| RLU | Relative Luminescence Unit |
| sFerr | Serum Ferritin |
| SNP | Single Nucleotide Polymorphism |
| Try | Triglicerydes |
| TSAT | Transferrin Saturation |
| VUS | Variant of Uncertain Significance |
References
- Hanson, E.H.; Imperatore, G.; Burke, W. HFE gene and hereditary hemochromatosis: A HuGE review. Human Genome Epidemiology. Am. J. Epidemiol. 2001, 154, 193–206. [Google Scholar] [CrossRef] [Green Version]
- Fracanzani, A.L.; Piperno, A.; Valenti, L.; Fraquelli, M.; Coletti, S.; Maraschi, A.; Consonni, D.; Coviello, E.; Conte, D.; Fargion, S. Hemochromatosis in Italy in the last 30 years: Role of genetic and acquired factors. Hepatology 2010, 51, 501–510. [Google Scholar] [CrossRef]
- Piperno, A.; Vergani, A.; Malosio, I.; Parma, L.; Fossati, L.; Ricci, A.; Bovo, G.; Boari, G.; Mancia, G. Hepatic iron overload in patients with chronic viral hepatitis: Role of HFE gene mutations. Hepatology 1998, 28, 1105–1109. [Google Scholar] [CrossRef]
- Milet, J.; Le Gac, G.; Scotet, V.; Gourlaouen, I.; Thèze, C.; Mosser, J.; Bourgain, C.; Deugnier, Y.; Ferec, C. A common SNP near BMP2 is associated with severity of the iron burden in HFE p.C282Y homozygous patients: A follow-up study. Blood Cells Mol. Dis. 2010, 44, 34–37. [Google Scholar] [CrossRef]
- Constantine, C.C.; Anderson, G.J.; Vulpe, C.D.; McLaren, C.E.; Bahlo, M.; Yeap, H.L.; Gertig, D.M.; Osborne, N.J.; Bertalli, N.A.; Beckman, K.B.; et al. A novel association between a SNP in CYBRD1 and serum ferritin levels in a cohort study of HFE hereditary haemochromatosis. Br. J. Haematol. 2009, 147, 140–149. [Google Scholar] [CrossRef] [Green Version]
- Pelucchi, S.; Mariani, R.; Calza, S.; Fracanzani, A.L.; Modignani, G.L.; Bertola, F.; Busti, F.; Trombini, P.; Fraquelli, M.; Forni, G.L.; et al. CYBRD1 as a modifier gene that modulates iron phenotype in HFE p.C282Y homozygous patients. Haematologica 2012, 97, 1818–1825. [Google Scholar] [CrossRef] [Green Version]
- Stickel, F.; Buch, S.; Zoller, H.; Hultcrantz, R.; Gallati, S.; Österreicher, C.; Finkenstedt, A.; Stadlmayr, A.; Aigner, E.; Sahinbegovic, E.; et al. Evaluation of genome-wide loci of iron metabolism in hereditary hemochromatosis identifies PCSK7 as a host risk factor of liver cirrhosis. Hum. Mol. Genet. 2014, 23, 3883–3890. [Google Scholar] [CrossRef]
- Pelucchi, S.; Galimberti, S.; Greni, F.; Rametta, R.; Mariani, R.; Pelloni, I.; Girelli, D.; Busti, F.; Ravasi, G.; Valsecchi, M.G.; et al. Proprotein convertase 7 rs236918 associated with liver fibrosis in Italian patients with HFE-related hemochromatosis. J. Gastroenterol. Hepatol. 2016, 31, 1342–1348. [Google Scholar] [CrossRef]
- Greni, F.; Valenti, L.; Mariani, R.; Pelloni, I.; Rametta, R.; Busti, F.; Ravasi, G.; Girelli, D.; Fargion, S.; Galimberti, S.; et al. GNPAT rs11558492 is not a Major Modifier of Iron Status: Study of Italian Hemochromatosis Patients and Blood Donors. Ann. Hepatol. 2017, 16, 451–456. [Google Scholar] [CrossRef]
- McLaren, C.E.; Emond, M.J.; Subramaniam, V.N.; Phatak, P.D.; Barton, J.C.; Adams, P.C.; Goh Justin, B.; McDonald Cameron, J.; Powell Lawrie, W.; Gurrin Lyle, C.; et al. Exome sequencing in HFE C282Y homozygous men with extreme phenotypes identifies a GNPAT variant associated with severe iron overload. Hepatology 2015, 62, 429–439. [Google Scholar] [CrossRef] [Green Version]
- Angelucci, E.; Brittenham, G.M.; McLaren, C.E.; Ripalti, M.; Baronciani, D.; Giardini, C.; Galimberti, M.; Polchi, P.; Lucarelli, G. Hepatic iron concentration and total body iron stores in thalassemia major. N. Engl. J. Med. 2000, 343, 327–331. [Google Scholar] [CrossRef]
- Powell, E.E.; Ali, A.; Clouston, A.D.; Dixon, J.L.; Lincoln, D.J.; Purdie, D.M.; Fletcher, L.M.; Powell, L.W.; Jonsson, J.R. Steatosis is a cofactor in liver injury in hemochromatosis. Gastroenterology 2005, 129, 1937–1943. [Google Scholar] [CrossRef]
- Allen, K.J.; Bertalli, N.A.; Osborne, N.J.; Constantine, C.C.; Delatycki, M.B.; Nisselle, A.E.; Nicoll, A.J.; Gertig, D.M.; McLaren, C.E.; Giles, G.G.; et al. HFE Cys282Tyr homozygotes with serum ferritin concentrations below 1000 microg/L are at low risk of hemochromatosis. Hepatology 2010, 52, 925–933. [Google Scholar] [CrossRef] [Green Version]
- Adams, P.C.; Agnew, S. Alcoholism in hereditary hemochromatosis revisited: Prevalence and clinical consequences among homozygous siblings. Hepatology 1996, 23, 724–727. [Google Scholar] [CrossRef]
- Murphy, C.J.; Oudit, G.Y. Iron-overload cardiomyopathy: Pathophysiology, diagnosis, and treatment. J. Card. Fail. 2010, 16, 888–900. [Google Scholar] [CrossRef]
- Batar, B.; Bavunoglu, I.; Hacioglu, Y.; Cengiz, M.; Mutlu, T.; Yavuzer, S.; Yavuzer, H.; Ercelebi, D.C.; Erhan, D.; Unal, S.; et al. The role of TMPRSS6 gene variants in iron-related hematological parameters in Turkish patients with iron deficiency anemia. Gene 2018, 673, 201–205. [Google Scholar] [CrossRef]
- Lee, P.L.; Barton, J.C.; Khaw, P.L.; Bhattacharjee, S.Y. Common TMPRSS6 mutations and iron, erythrocyte, and pica phenotypes in 48 women with iron deficiency or depletion. Blood Cells Mol. Dis. 2012, 48, 124–127. [Google Scholar] [CrossRef] [Green Version]
- Tanimoto, K.; Yoshiga, K.; Eguchi, H.; Kaneyasu, M.; Ukon, K.; Kumazaki, T.; Oue, N.; Yasui, W.; Imai, K.; Nakachi, K.; et al. Hypoxia-inducible factor-1alpha polymorphisms associated with enhanced transactivation capacity, implying clinical significance. Carcinogenesis 2003, 24, 1779–1783. [Google Scholar] [CrossRef]
- Daher, R.; Kannengiesser, C.; Houamel, D.; Lefebvre, T.; Bardou-Jacquet, E.; Ducrot, N.; de Kerguenec, C.; Jouanolle, A.; Robreau, A.; Oudin, C.; et al. Heterozygous Mutations in BMP6 Pro-peptide Lead to Inappropriate Hepcidin Synthesis and Moderate Iron Overload in Humans. Gastroenterology 2016, 150, 672–683. [Google Scholar] [CrossRef] [Green Version]
- Zhao, L.; Hadziahmetovic, M.; Wang, C.; Xu, X.; Song, Y.; Jinnah, H.A.; Wodzinska, J.; Iacovelli, J.; Wolkow, N.; Krajacic, P.; et al. Cp/Heph mutant mice have iron-induced neurodegeneration diminished by deferiprone. J. Neurochem. 2015, 135, 958–974. [Google Scholar] [CrossRef]
- Tolosano, E.; Fagoonee, S.; Garuti, C.; Valli, L.; Andrews, N.C.; Altruda, F.; Pietrangelo, A. Haptoglobin modifies the hemochromatosis phenotype in mice. Blood 2005, 105, 3353–3355. [Google Scholar] [CrossRef]
- Hochstrasser, H.; Bauer, P.; Walter, U.; Behnke, S.; Spiegel, J.; Csoti, I.; Zeiler, B.; Bornemann, A.; Pahnke, J.; Becker, G.; et al. Ceruloplasmin gene variations and substantia nigra hyperechogenicity in Parkinson disease. Neurology 2004, 63, 1912–1917. [Google Scholar] [CrossRef]
- Zorzetto, M.; Russi, E.; Senn, O.; Imboden, M.; Ferrarotti, I.; Tinelli, C.; Campo, I.; Ottaviani, S.; Scabini, R.; von Eckardstein, A.; et al. SERPINA1 gene variants in individuals from the general population with reduced alpha1-antitrypsin concentrations. Clin. Chem. 2008, 54, 1331–1338. [Google Scholar] [CrossRef]
- Hamesch, K.; Mandorfer, M.; Pereira, V.M.; Moeller, L.S.; Pons, M.; Dolman, G.E.; Reichert, M.C.; Schneider, C.V.; Woditsch, V.; Voss, J.; et al. Liver Fibrosis and Metabolic Alterations in Adults With α1-Antitrypsin Deficiency Caused by the Pi*ZZ Mutation. Gastroenterology 2019, 157, 705–719. [Google Scholar] [CrossRef]
- Guo, S.; Jiang, S.; Epperla, N.; Ma, Y.; Maadooliat, M.; Ye, Z.; Olson, B.; Wang, M.; Kitchner, T.; Joyce, J.; et al. A gene-based recessive diplotype exome scan discovers. Blood 2019, 133, 1888–1898. [Google Scholar] [CrossRef] [Green Version]
- Barton, J.C.; Chen, W.P.; Emond, M.J.; Phatak, P.D.; Subramaniam, V.N.; Adams, P.C.; Gurrin, L.C.; Anderson, G.J.; Ramm, G.A.; Powell, L.W.; et al. GNPAT p.D519G is independently associated with markedly increased iron stores in HFE p.C282Y homozygotes. Blood Cells Mol. Dis. 2017, 63, 15–20. [Google Scholar] [CrossRef] [Green Version]
- Henninger, B.; Alustiza, J.; Garbowski, M.; Gandon, Y. Practical guide to quantification of hepatic iron with MRI. Eur. Radiol. 2020, 30, 383–393. [Google Scholar] [CrossRef] [Green Version]
- Barnett, I.J.; Lee, S.; Lin, X. Detecting rare variant effects using extreme phenotype sampling in sequencing association studies. Genet. Epidemiol. 2013, 37, 142–151. [Google Scholar] [CrossRef] [Green Version]
- Panarella, M.; Burkett, K.M. A Cautionary Note on the Effects of Population Stratification Under an Extreme Phenotype Sampling Design. Front. Genet. 2019, 10, 398. [Google Scholar] [CrossRef] [Green Version]
- Worwood, M. Laboratory determination of iron status. In Iron Metabolism in Health and Disease; Brock, J.H., Pippard, M.J., Powell, L.W., Eds.; Saunders: London, UK, 1994; pp. 449–476. [Google Scholar]
- Altès, A.; Bach, V.; Ruiz, A.; Esteve, A.; Felez, J.; Remacha, A.F.; Sarda, M.P.; Baiget, M. Mutations in HAMP and HJV genes and their impact on expression of clinical hemochromatosis in a cohort of 100 Spanish patients homozygous for the C282Y mutation of HFE gene. Ann. Hematol. 2009, 88, 951–955. [Google Scholar] [CrossRef] [Green Version]
- Donker, A.E.; Brons, P.P.; Swinkels, D.W. Microcytic anaemia with low transferrin saturation, increased serum hepcidin and non-synonymous TMPRSS6 variants: Not always iron-refractory iron deficiency anaemia. Br. J. Haematol. 2015, 169, 150–151. [Google Scholar] [CrossRef] [Green Version]
- Nie, N.; Shi, J.; Shao, Y.; Li, X.; Ge, M.; Huang, J.; Zhang, J.; Huang, Z.; Li, D.; Zheng, Y. A novel tri-allelic mutation of TMPRSS6 in iron-refractory iron deficiency anaemia with response to glucocorticoid. Br. J. Haematol. 2014, 166, 300–303. [Google Scholar] [CrossRef]
- Sato, T.; Iyama, S.; Murase, K.; Kamihara, Y.; Ono, K.; Kikuchi, S.; Takada, K.; Miyanishi, K.; Sato, Y.; Takimoto, R.; et al. Novel missense mutation in the TMPRSS6 gene in a Japanese female with iron-refractory iron deficiency anemia. Int. J. Hematol. 2011, 94, 101–103. [Google Scholar] [CrossRef]
- Fu, X.S.; Choi, E.; Bubley, G.J.; Balk, S.P. Identification of hypoxia-inducible factor-1alpha (HIF-1alpha) polymorphism as a mutation in prostate cancer that prevents normoxia-induced degradation. Prostate 2005, 63, 215–221. [Google Scholar] [CrossRef]
- Nicolas, G.; Chauvet, C.; Viatte, L.; Danan, J.L.; Bigard, X.; Devaux, I.; Beaumont, C.; Kahn, A.; Vaulont, S. The gene encoding the iron regulatory peptide hepcidin is regulated by anemia, hypoxia, and inflammation. J. Clin. Investig. 2002, 110, 1037–1044. [Google Scholar] [CrossRef]
- Ravasi, G.; Pelucchi, S.; Greni, F.; Mariani, R.; Giuliano, A.; Parati, G.; Silvestri, L.; Piperno, A. Circulating factors are involved in hypoxia-induced hepcidin suppression. Blood Cells Mol. Dis. 2014, 53, 204–210. [Google Scholar] [CrossRef]
- Maurer, E.; Gütschow, M.; Stirnberg, M. Matriptase-2 (TMPRSS6) is directly up-regulated by hypoxia inducible factor-1: Identification of a hypoxia-responsive element in the TMPRSS6 promoter region. Biol. Chem. 2012, 393, 535–540. [Google Scholar] [CrossRef]
- McMahon, S.; Grondin, F.; McDonald, P.P.; Richard, D.E.; Dubois, C.M. Hypoxia-enhanced expression of the proprotein convertase furin is mediated by hypoxia-inducible factor-1: Impact on the bioactivation of proproteins. J. Biol. Chem. 2005, 280, 6561–6569. [Google Scholar] [CrossRef] [Green Version]
- Silvestri, L.; Pagani, A.; Nai, A.; De Domenico, I.; Kaplan, J.; Camaschella, C. The serine protease matriptase-2 (TMPRSS6) inhibits hepcidin activation by cleaving membrane hemojuvelin. Cell Metab. 2008, 8, 502–511. [Google Scholar] [CrossRef] [Green Version]
- Volke, M.; Gale, D.P.; Maegdefrau, U.; Schley, G.; Klanke, B.; Bosserhoff, A.K.; Maxwell, P.H.; Eckardt, K.; Warnecke, C. Evidence for a lack of a direct transcriptional suppression of the iron regulatory peptide hepcidin by hypoxia-inducible factors. PLoS ONE 2009, 4, e7875. [Google Scholar] [CrossRef]
- Vecchi, C.; Montosi, G.; Pietrangelo, A. Huh-7: A human “hemochromatotic” cell line. Hepatology 2010, 51, 654–659. [Google Scholar] [CrossRef]
- Peyssonnaux, C.; Zinkernagel, A.S.; Schuepbach, R.A.; Rankin, E.; Vaulont, S.; Haase, V.H.; Nizet, V.; Johnson, R.S. Regulation of iron homeostasis by the hypoxia-inducible transcription factors (HIFs). J. Clin. Investig. 2007, 117, 1926–1932. [Google Scholar] [CrossRef] [Green Version]
- Lakhal, S.; Schödel, J.; Townsend, A.R.; Pugh, C.W.; Ratcliffe, P.J.; Mole, D.R. Regulation of type II transmembrane serine proteinase TMPRSS6 by hypoxia-inducible factors: New link between hypoxia signaling and iron homeostasis. J. Biol. Chem. 2011, 286, 4090–4097. [Google Scholar] [CrossRef] [Green Version]
- Schaefer, B.; Haschka, D.; Finkenstedt, A.; Petersen, B.S.; Theurl, I.; Henninger, B.; Janecke, A.R.; Wang, C.; Lin, H.Y.; Veits, L.; et al. Impaired hepcidin expression in alpha-1-antitrypsin deficiency associated with iron overload and progressive liver disease. Hum. Mol. Genet. 2015, 24, 6254–6263. [Google Scholar] [CrossRef] [Green Version]
- Consortium, U. UniProt: A worldwide hub of protein knowledge. Nucleic Acids Res. 2019, 47, D506–D515. [Google Scholar] [CrossRef] [Green Version]
- Hochstrasser, H.; Tomiuk, J.; Walter, U.; Behnke, S.; Spiegel, J.; Krüger, R.; Becker, G.; Riess, O.; Berg, D. Functional relevance of ceruloplasmin mutations in Parkinson’s disease. FASEB J. 2005, 19, 1851–1853. [Google Scholar] [CrossRef] [Green Version]
- Henrie, A.; Hemphill, S.E.; Ruiz-Schultz, N.; Cushman, B.; DiStefano, M.T.; Azzariti, D.; Harrison, S.M.; Rehm, H.L.; Eilbeck, K. ClinVar Miner: Demonstrating utility of a Web-based tool for viewing and filtering ClinVar data. Hum. Mutat. 2018, 39, 1051–1060. [Google Scholar] [CrossRef]
- Muckenthaler, M.U. How mutant HFE causes hereditary hemochromatosis. Blood 2014, 124, 1212–1213. [Google Scholar] [CrossRef] [Green Version]
- Riva, A.; Trombini, P.; Mariani, R.; Salvioni, A.; Coletti, S.; Bonfadini, S.; Paolini, V.; Pozzi, M.; Facchetti, R.; Bovo, G.; et al. Revaluation of clinical and histological criteria for diagnosis of dysmetabolic iron overload syndrome. World J. Gastroenterol. 2008, 14, 4745–4752. [Google Scholar] [CrossRef]
- Adams, P.C.; Barton, J.C. How I treat hemochromatosis. Blood 2010, 116, 317–325. [Google Scholar] [CrossRef] [Green Version]
- Adams, P.C.; Deugnier, Y.; Moirand, R.; Brissot, P. The relationship between iron overload, clinical symptoms, and age in 410 patients with genetic hemochromatosis. Hepatology 1997, 25, 162–166. [Google Scholar] [CrossRef]
- Karczewski, K.J.; Francioli, L.C.; Tiao, G.; Cummings, B.B.; Alföldi, J.; Wang, Q.; Collins, R.L.; Laricchia, K.M.; Ganna, A.; Birnbaum, D.P.; et al. The mutational constraint spectrum quantified from variation in 141,456 humans. Nature 2020, 581, 434–443. [Google Scholar] [CrossRef]
- Brissot, P.; Troadec, M.B.; Bardou-Jacquet, E.; Le Lan, C.; Jouanolle, A.M.; Deugnier, Y.; Loreal, O. Current approach to hemochromatosis. Blood Rev. 2008, 22, 195–210. [Google Scholar] [CrossRef]
- Piret, J.P.; Mottet, D.; Raes, M.; Michiels, C. CoCl2, a chemical inducer of hypoxia-inducible factor-1, and hypoxia reduce apoptotic cell death in hepatoma cell line HepG2. Ann. N. Y. Acad. Sci. 2002, 973, 443–447. [Google Scholar] [CrossRef]
Figure 1.
(A) Luciferase activity expressed as a fold change in the wild type (WT) and mutant vectors (P582S and A588T), as reported. (B) The HAMP mRNA levels expressed as the ratio between transfected and non-transfected Huh-7 cells under normoxic (−) and hypoxic (+) conditions. All data were obtained from three independent experiments done in triplicate.

Figure 2.
Western blot of lysates of Huh-7 cells transfected with WT vectors in normoxia and chemically induced hypoxia (WT + Co), and with P582S and A588T vectors. β-Actin was used as a loading control.
Figure 2.
Western blot of lysates of Huh-7 cells transfected with WT vectors in normoxia and chemically induced hypoxia (WT + Co), and with P582S and A588T vectors. β-Actin was used as a loading control.

Figure 3.
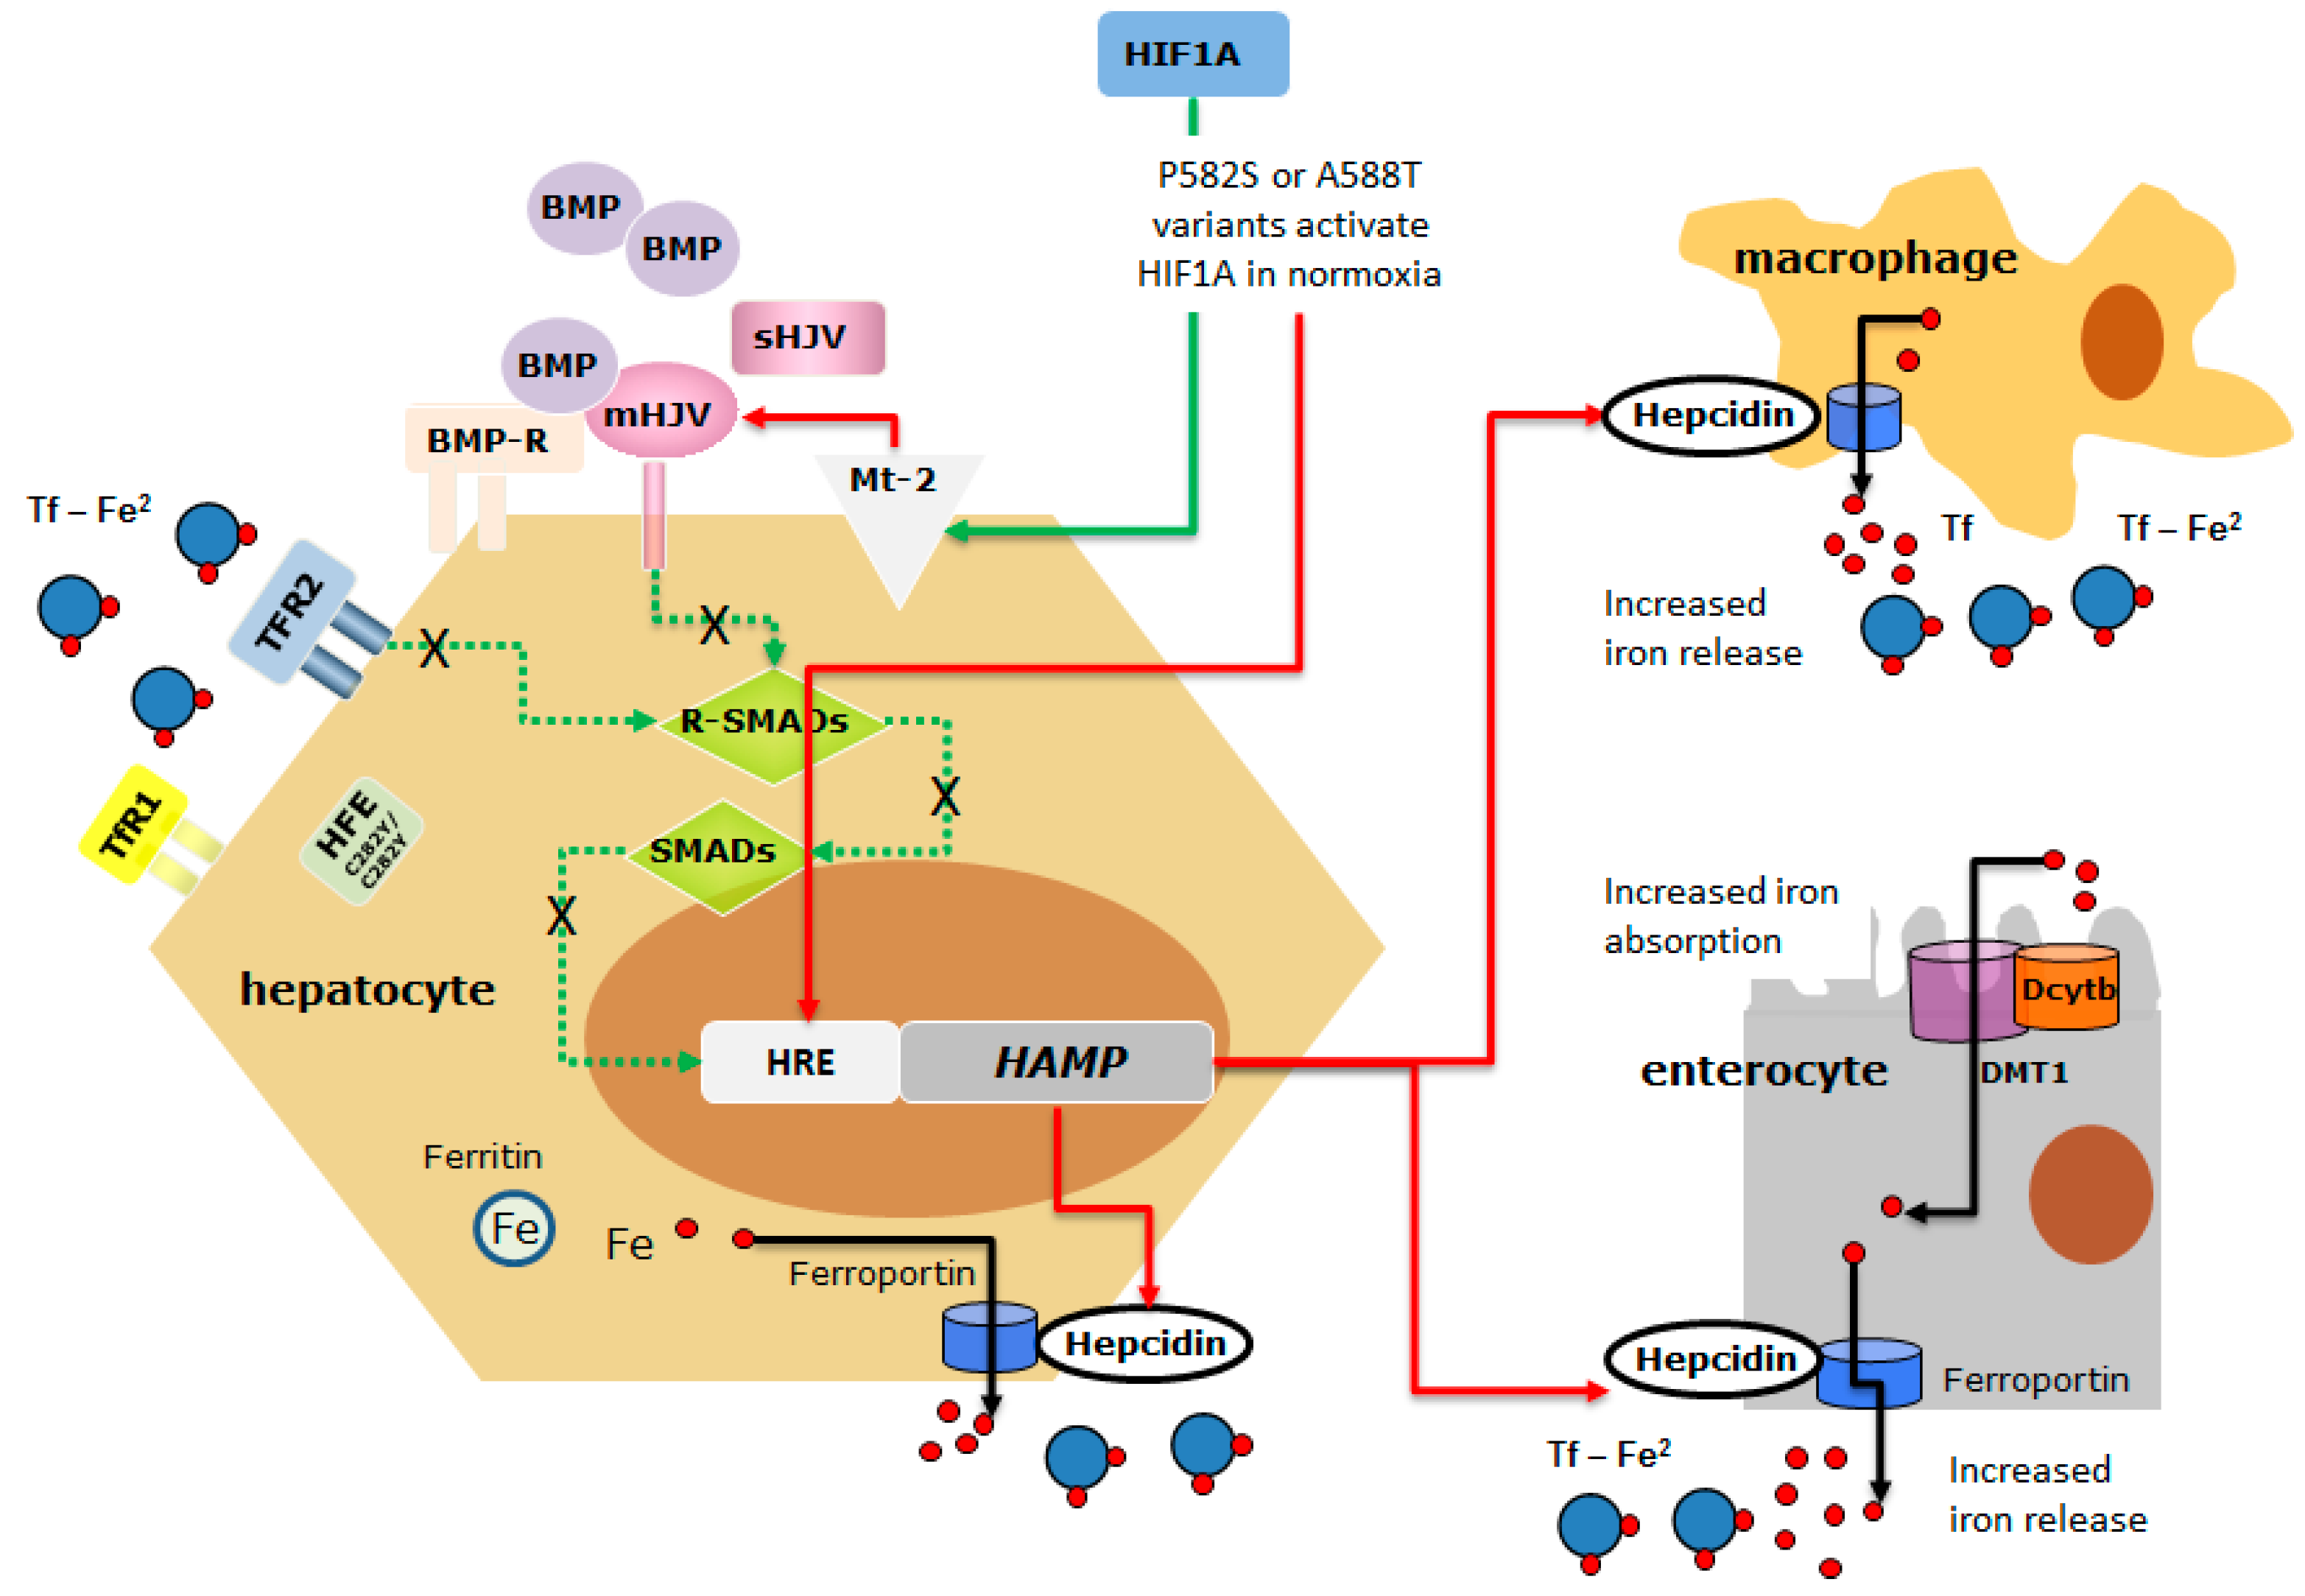
The schematic representation of the possible interaction between HIF1A variants and the HFEC282Y/C282Y mutant protein in inducing hepcidin suppression. HFE is a component of an iron-sensing complex that involves interactions with diferric transferrin (Tf-Fe2), transferrin receptors (TFR-1 and TFR-2) at the plasma membrane of hepatocytes. High concentrations of Tf–Fe2 displace HFE from TFR1, which then forms a complex with TFR2 and HJV to promote bone morphogenetic protein (BMP)/SMAD signaling to hepcidin. HJV is a GPI-linked protein that activates hepcidin as a co-receptor for BMP cytokines. The regulatory SMADs (R-SMADs), SMAD1, SMAD5, and SMAD8 are the mediators of BMP signaling, as they are phosphorylated by activated BMPRs. The common SMAD4 translocates to the nucleus in the complex with the R-SMADs to induce the expression of hepcidin. BMP/SMAD signaling to hepcidin is suppressed by matriptase 2 (Mt-2), a serine protease, codified by TMPRSS6 which cleaves and generates a soluble form of HJV (sHJV). Homozygous p.Cys282Tyr mutation affects HFE function limiting its expression on the membrane, thus dysregulating the iron-sensing complex and leading to HAMP downregulation. HIF1A p.Phe582Ser and p.Ala588Thr variants that stabilize HIF1A in normoxia might further inhibit hepcidin expression acting directly on the HAMP Hypoxia Responsive Element (HRE) or indirectly through the activation of Mt-2 [40,49] (the red arrow indicates inhibitory action; the green arrow indicates activating action; dotted green line indicates the signaling pathways dysregulated by HFEC282Y/C282Y mutant protein and HIF-induced Mt-2 activation).
Figure 3.
The schematic representation of the possible interaction between HIF1A variants and the HFEC282Y/C282Y mutant protein in inducing hepcidin suppression. HFE is a component of an iron-sensing complex that involves interactions with diferric transferrin (Tf-Fe2), transferrin receptors (TFR-1 and TFR-2) at the plasma membrane of hepatocytes. High concentrations of Tf–Fe2 displace HFE from TFR1, which then forms a complex with TFR2 and HJV to promote bone morphogenetic protein (BMP)/SMAD signaling to hepcidin. HJV is a GPI-linked protein that activates hepcidin as a co-receptor for BMP cytokines. The regulatory SMADs (R-SMADs), SMAD1, SMAD5, and SMAD8 are the mediators of BMP signaling, as they are phosphorylated by activated BMPRs. The common SMAD4 translocates to the nucleus in the complex with the R-SMADs to induce the expression of hepcidin. BMP/SMAD signaling to hepcidin is suppressed by matriptase 2 (Mt-2), a serine protease, codified by TMPRSS6 which cleaves and generates a soluble form of HJV (sHJV). Homozygous p.Cys282Tyr mutation affects HFE function limiting its expression on the membrane, thus dysregulating the iron-sensing complex and leading to HAMP downregulation. HIF1A p.Phe582Ser and p.Ala588Thr variants that stabilize HIF1A in normoxia might further inhibit hepcidin expression acting directly on the HAMP Hypoxia Responsive Element (HRE) or indirectly through the activation of Mt-2 [40,49] (the red arrow indicates inhibitory action; the green arrow indicates activating action; dotted green line indicates the signaling pathways dysregulated by HFEC282Y/C282Y mutant protein and HIF-induced Mt-2 activation).


Table 1.
Biochemical data of 99 patients divided according to the HAS-score.
| All | HAS-Low | HAS-High | p | |
|---|---|---|---|---|
| N | 99 | 41 | 58 | // |
| Age (years) | 43 (36–52) | 37 (29–45) | 45.5 (38.0–58.0) | <0.0001 |
| Hb (g/dL) | 15.0 (14.5–15.8) | 15.0 (14.7–15.8) | 14.9 (13.9–15.6) | ns |
| sFerritin (µg/L) | 1244 (768–2463.5) | 765 (516–956) | 2164 (1386–3427) | <0.0001 |
| TSAT (%) | 84.5 (70.6–90.8) | 78.5 (42.0–87.0) | 86 (78–95) | <0.0001 |
| IR/age (g/years) | 0.15 (0.10–0.24) | 0.10 (0.08–0.14) | 0.22 (0.14–0.33) | <0.0001 |
| BMI (kg/m2) | 24.5 (23.5–26.4) | 24.4 (23.8–26.6) | 24.5 (23.0–26.0) | ns |
| AST (U/L) | 31 (23–44) | 25.0 (19.3–30.0) | 41 (30–58) | <0.0001 |
| ALT (U/L) | 43.0 (26.3–64.8) | 27.0 (20.5–45.3) | 52.5 (40.0–79.3) | <0.0001 |
| γGT (U/L) | 28.5 (18.0–45.3) | 18.5 (16.0–30.0) | 38.5 (25.0–53.5) | <0.0001 |
| Total cholesterol (mg/dL) | 182 (155–212) | 172.5 (157.8–207.5) | 189 (153–213) | ns |
| HDL (mg/dL) | 49 (42–55) | 49.0 (42.5–54.0) | 49.0 (42.0–56.5) | ns |
| Try (mg/dL) | 104 (79–144) | 92.5 (78.3–127.5) | 118 (82–156) | ns |
| Glu (mg/dL) | 93 (85–102) | 87.5 (81.8–93.3) | 98.5 (89.5–111.3) | 0.0001 |
Data are expressed as median (1st–3rd). Hb: Hemoglobin; TSAT: Transferrin SATuration; IR: Iron Removed; BMI: Body Mass Index; AST: Aspartate Amino Transferase; ALT: Alanine Amino Transferase; γGT: gamma Glutamil Transferase; HDL: High-Density Lipoprotein; Try: Triglycerides; Glu: Glucose; ns: not significant.
Table 2.
Biochemical data of 26 patients divided according to extreme phenotypes.
| All | L-Iron | H-Iron | p | |
|---|---|---|---|---|
| N | 26 | 15 | 11 | // |
| Age (years) | 43 (38–50) | 41.0 (37.0–49.5) | 43.0 (38.0–48.5) | ns |
| Hb (g/dL) | 14.8 (14.4–15.1) | 14.9 (14.6–15.3) | 13.9 (12.15–15.75) | ns |
| sFerritin (µg/L) | 1158 (602–3680) | 698 (509–794) | 4000 (2700–4800) | <0.0001 |
| TSAT (%) | 84.5 (64.5–90.0) | 70 (59–86) | 90 (84–95) | 0.01 |
| IR/age (g/years) | 0.12 (0.08–0.43) | 0.08 (0.07–0.11) | 0.46 (0.40–0.63) | <0.0001 |
| BMI (kg/m2) | 24.2 (23.6–25.3) | 24.5 (24.2–26.3) | 22.2 (18.8–24.0) | 0.008 |
| AST (U/L) | 27.0 (21.5–36.0) | 23.0 (18.1–27.0) | 47.5 (36.0–61.0) | 0.0002 |
| ALT (U/L) | 38.0 (26.0–50.5) | 26 (24–39) | 58 (43–86) | 0.001 |
| γGT (U/L) | 25.0 (16.8–41.5) | 19.5 (14.5–28.5) | 51.0 (30.5–206.0) | 0.009 |
| Total cholesterol (mg/dL) | 176.5 (160.3–203.8) | 169 (157–183) | 205 (189–253) | 0.04 |
| HDL (mg/dL) | 51.0 (42.0–63.8) | 47.5 (42.0–62.5) | 57.5 (52.0–65.5) | ns |
| Try (mg/dL) | 98.5 (75.3–145.8) | 90 (75–124) | 130 (68–170) | ns |
| Glu (mg/dL) | 93 (88–98) | 92 (87–95) | 105.5 (92.5–151.5) | 0.042 |
Data are expressed as median (1st−3rd). Hb: Hemoglobin; TSAT: Transferrin SATuration; IR: Iron Removed; BMI: Body Mass Index; AST: Aspartate Amino Transferase; ALT: Alanine Amino Transferase; γGT: gamma Glutamil Transferase; HDL: High-Density Lipoprotein; Try: Triglycerides; Glu: Glucose; ns: not significant.
Table 3.
List of the 41 exonic non-synonymous variants and their allelic frequencies in all 26 patients, subgroups (L-Iron and H-Iron) and Genome Aggregation Database (gnomAD).
Table 3.
List of the 41 exonic non-synonymous variants and their allelic frequencies in all 26 patients, subgroups (L-Iron and H-Iron) and Genome Aggregation Database (gnomAD).
| Genes | Amino Acid Change | dbSNP | Allelic Frequencies (all) | Allelic Frequencies (L-Iron) | Allelic Frequencies (H-Iron) | Allelic Frequencies (gnomAD) | p |
|---|---|---|---|---|---|---|---|
| ACO1 | p.Lys580Gln | rs73477393 | 0.019 | 0.000 | 0.045 | 0.000 | ns |
| BMP6 | p.Gln114Arg | rs377443730 | 0.019 | 0.033 | 0.000 | 0.000 | ns |
| CP | p.Arg793His | rs115552500 | 0.019 | 0.033 | 0.000 | 0.009 | ns |
| CP | p.Glu544Asp | rs701753 | 0.865 | 0.900 | 0.818 | 0.941 | ns |
| CP | p.Pro477Leu | rs35331711 | 0.019 | 0.000 | 0.045 | 0.004 | ns |
| CP | p.Thr551Ile | rs61733458 | 0.019 | 0.033 | 0.000 | 0.031 | ns |
| CYBRD1 | p.Ser266Asn | rs10455 | 0.481 | 0.333 | 0.682 | 0.672 | <0.0001 * |
| FAM132B | p.Ala260Ser | rs111241405 | 0.019 | 0.000 | 0.045 | 0.021 | ns |
| FURIN | p.Arg81Cys | rs148110342 | 0.019 | 0.000 | 0.045 | 0.002 | ns |
| GNPAT | p.Asp519Gly | rs11558492 | 0.327 | 0.300 | 0.364 | 0.205 | ns |
| HEPH | p.Val39Ala | rs5919015 | 0.692 | 0.733 | 0.636 | 0.679 | ns |
| HIF1A | p.Ala588Thr | rs11549467 | 0.038 | 0.000 | 0.091 | 0.010 | 0.0001 § |
| HIF1A | p.Pro582Ser | rs11549465 | 0.231 | 0.167 | 0.318 | 0.105 | 0.001 § |
| HP | p.Ala371Ser | rs376612221 | 0.019 | 0.033 | 0.000 | 0.000 | ns |
| HP | p.Val258Leu | rs746679401 | 0.019 | 0.033 | 0.000 | 0.000 | ns |
| IREB2 | p.Ile580Thr | rs2230940 | 0.846 | 0.733 | 1.000 | 0.9998 | ns |
| IREB2 | p.Val159Leu | rs2958720 | 0.500 | 0.467 | 0.545 | 0.9998 | <0.0001 * |
| IREB2 | p.Tyr8fs | rs1456427498 | 0.058 | 0.067 | 0.045 | 0.0001 | <0.0001 * < 0.0001 § |
| SCARA5 | p.Ala304Val | rs118119884 | 0.019 | 0.000 | 0.045 | 0.036 | ns |
| SCARA5 | p.Asp316His | rs17058207 | 0.038 | 0.067 | 0.000 | 0.102 | ns |
| SERPINA1 | p.Arg125His | rs709932 | 0.135 | 0.133 | 0.136 | 0.163 | ns |
| SERPINA1 | p.Glu288Val | rs17580 | 0.038 | 0.067 | 0.000 | 0.037 | ns |
| SERPINA1 | p.Glu366Lys | rs28929474 | 0.038 | 0.000 | 0.091 | 0.018 | ns |
| SERPINA1 | p.Glu400Asp | rs1303 | 0.212 | 0.167 | 0.273 | 0.255 | ns |
| SERPINA1 | p.Ile116Met | rs759135389 | 0.019 | 0.033 | 0.000 | 0.0000 | ns |
| SERPINA1 | p.Val237Ala | rs6647 | 0.173 | 0.100 | 0.273 | 0.217 | ns |
| TF | p.Ile448Val | rs2692696 | 1.000 | 1.000 | 1.000 | 1.000 | ns |
| TF | p.Pro589Ser | rs1049296 | 0.135 | 0.167 | 0.091 | 0.160 | ns |
| TFRC | p.Gly142Ser | rs3817672 | 0.635 | 0.633 | 0.636 | 0.551 | ns |
| TMPRSS6 | p.Ala31Val | rs200558933 | 0.019 | 0.033 | 0.000 | 0.000 | ns |
| TMPRSS6 | p.Lys253Glu | rs2235324 | 0.096 | 0.167 | 0.000 | 0.385 | <0.0001 § |
| TMPRSS6 | p.Val736Ala | rs855791 | 0.442 | 0.367 | 0.545 | 0.564 | ns |
| FURIN | p.Leu163Leu | // | 0.019 | 0.000 | 0.045 | ns | |
| HIF1A | p.Tyr659Tyr | // | 0.019 | 0.000 | 0.045 | ns | |
| IREB2 | p.Pro145Ser | // | 0.019 | 0.000 | 0.045 | ns | |
| TMPRSS6 | p.Leu746Leu | // | 0.019 | 0.033 | 0.000 | ns |
*: L-Iron vs. gnomAD; §: H-Iron vs. gnomAD. ns: not significant.
Table 4.
HIF1A, VEGF, HMOX, FUR and TMPRSS6 mRNA levels expressed as the ratio between transfected and non-transfected Huh-7 cells under normoxic and hypoxic (+) conditions. All data were obtained from three independent experiments conducted in triplicate (mean ± SD).
Table 4.
HIF1A, VEGF, HMOX, FUR and TMPRSS6 mRNA levels expressed as the ratio between transfected and non-transfected Huh-7 cells under normoxic and hypoxic (+) conditions. All data were obtained from three independent experiments conducted in triplicate (mean ± SD).
| WT + Co | WT | P582S | A588T | |
|---|---|---|---|---|
| HIF1A | 911 ± 21 * | 600 ± 113 | 20,653 ± 2505 * | 287 ± 82 |
| VEGF | 2.93 ± 0.86 * | 0.76 ± 0.05 | 89 ± 5 * | 0.20 ± 0.07 |
| HMOX | 69 ± 9 * | 1.44 ± 0.11 | 6.28 ± 1.66 * | 0.42 ± 0.06 |
| FUR | 0.63 ± 0.15 | 0.43 ± 0.10 | 55 ± 2 * | 0.35 ± 0.07 |
| TMPRSS6 | 0.38 ± 0.04 | 1.06 ± 0.11 | 77 ± 12 * | 0.06 ± 0.02 |
*: p < 0.05 vs. WT.
Publisher’s Note: MDPI stays neutral with regard to jurisdictional claims in published maps and institutional affiliations. |
© 2021 by the authors. Licensee MDPI, Basel, Switzerland. This article is an open access article distributed under the terms and conditions of the Creative Commons Attribution (CC BY) license (http://creativecommons.org/licenses/by/4.0/).
Share and Cite
MDPI and ACS Style
Pelucchi, S.; Ravasi, G.; Arosio, C.; Mauri, M.; Piazza, R.; Mariani, R.; Piperno, A. HIF1A: A Putative Modifier of Hemochromatosis. Int. J. Mol. Sci. 2021, 22, 1245. https://0-doi-org.brum.beds.ac.uk/10.3390/ijms22031245
AMA Style
Pelucchi S, Ravasi G, Arosio C, Mauri M, Piazza R, Mariani R, Piperno A. HIF1A: A Putative Modifier of Hemochromatosis. International Journal of Molecular Sciences. 2021; 22(3):1245. https://0-doi-org.brum.beds.ac.uk/10.3390/ijms22031245
Chicago/Turabian StylePelucchi, Sara, Giulia Ravasi, Cristina Arosio, Mario Mauri, Rocco Piazza, Raffaella Mariani, and Alberto Piperno. 2021. "HIF1A: A Putative Modifier of Hemochromatosis" International Journal of Molecular Sciences 22, no. 3: 1245. https://0-doi-org.brum.beds.ac.uk/10.3390/ijms22031245
Note that from the first issue of 2016, this journal uses article numbers instead of page numbers. See further details here.