Article

Deficiency of Lipin2 Results in Enhanced NF-κB Signaling and Osteoclast Formation in RAW-D Murine Macrophages

1
Center for Advanced Stem Cell and Regenerative Research, Tohoku University Graduate School of Dentistry, Sendai 980-8575, Japan
2
Division of Molecular and Regenerative Prosthodontics, Tohoku University Graduate School of Dentistry, Sendai 980-8575, Japan
3
Division of Pediatric Dentistry, Tohoku University Graduate School of Dentistry, Sendai 980-8575, Japan
4
Department of Pediatric Dentistry, Graduate School of Dental Science, Kyushu University, Fukuoka 812-8582, Japan
*
Authors to whom correspondence should be addressed.
Int. J. Mol. Sci. 2021, 22(6), 2893; https://0-doi-org.brum.beds.ac.uk/10.3390/ijms22062893
Submission received: 30 January 2021 / Revised: 5 March 2021 / Accepted: 10 March 2021 / Published: 12 March 2021

Abstract

:
Lipin2 is a phosphatidate phosphatase that plays critical roles in fat homeostasis. Alterations in Lpin2, which encodes lipin2, cause the autoinflammatory bone disorder Majeed syndrome. Lipin2 limits lipopolysaccharide (LPS)-induced inflammatory responses in macrophages. However, little is known about the precise molecular mechanisms underlying its anti-inflammatory function. In this study, we attempted to elucidate the molecular link between the loss of lipin2 function and autoinflammatory bone disorder. Using a Lpin2 knockout murine macrophage cell line, we showed that lipin2 deficiency enhances innate immune responses to LPS stimulation through excessive activation of the NF-κB signaling pathway, partly because of TAK1 signaling upregulation. Lipin2 depletion also enhanced RANKL-mediated osteoclastogenesis and osteoclastic resorption activity accompanied by NFATc1 dephosphorylation and increased nuclear accumulation. These results suggest that lipin2 suppresses the development of autoinflammatory bone disorder by fine-tuning proinflammatory responses and osteoclastogenesis in macrophages. Therefore, this study provides insights into the molecular pathogenesis of monogenic autoinflammatory bone disorders and presents a potential therapeutic intervention.

1. Introduction

Alterations in human Lpin2 cause Majeed syndrome, a rare inherited autosomal recessive autoinflammatory bone disorder that is characterized by early onset chronic multifocal osteomyelitis, neutrophilic skin inflammation, and dyserythropoietic anemia [1,2,3,4,5]. Patients with a monogenic form of this disorder present with poor prognosis; however, IL-1β blockade has showed promising clinical outcomes [6]. Lpin2 encodes lipin2, a member of the lipin1–3 protein family. Lipins are phosphatidic acid phosphatases (PAPs) that are critical for fine-tuning cellular lipid metabolism [7,8]. The mechanisms by which loss-of-function Lpin2 mutations contribute to autoinflammatory bone disorder development are largely unknown.
Toll-like receptors (TLRs) are a family of pattern recognition receptors (PRRs) that are critical for proper innate immune responses. Among the 10 TLRs in humans, TLR2/4 are activated by lipopolysaccharides (LPS) to transmit downstream signaling, such as the NF-κB and MAP kinase pathways, to elicit proinflammatory transcription [9,10]. Notably, recent findings link lipin2 function to innate immunity and inflammation and are consistent with the pathophysiological conditions in Majeed syndrome [8,11]. Lpin2 deficiency in murine and human macrophages augmented the proinflammatory cytokines IL-1β and TNFα [12,13]. Lipin2-deficient macrophages displayed enhanced MAP kinase and P2X7 signaling pathway activation and NLRP3 inflammasome formation in response to LPS and ATP stimulation [12]. Lpin2 knockout mice exhibited elevated serum IL-1β and TNFα levels and upregulated hepatic and splenic proinflammatory transcripts in response to a high intraperitoneal LPS dose [12]. These data suggest that lipin2 constrains proinflammatory responses in vitro and in vivo. However, the molecular mechanisms by which lipin2 modulates cellular inflammatory signaling have not been clarified.
Monogenic Lpin2 mutation causes familial chronic multifocal osteomyelitis and osteolytic foci that are characteristic of Majeed syndrome [14,15]. Notably, a very recent study has reported enhanced osteoclastogenesis in monocyte-derived M2-like macrophages from a patient with Majeed syndrome [16]. In this study, we aimed to determine the molecular link between loss of lipin2 function and autoinflammatory bone disorder pathophysiology. Our findings may advance the understanding of the molecular pathogenesis and therapeutic intervention for Lpin2-mutation and other monogenic autoinflammatory bone disorders.

2. Results

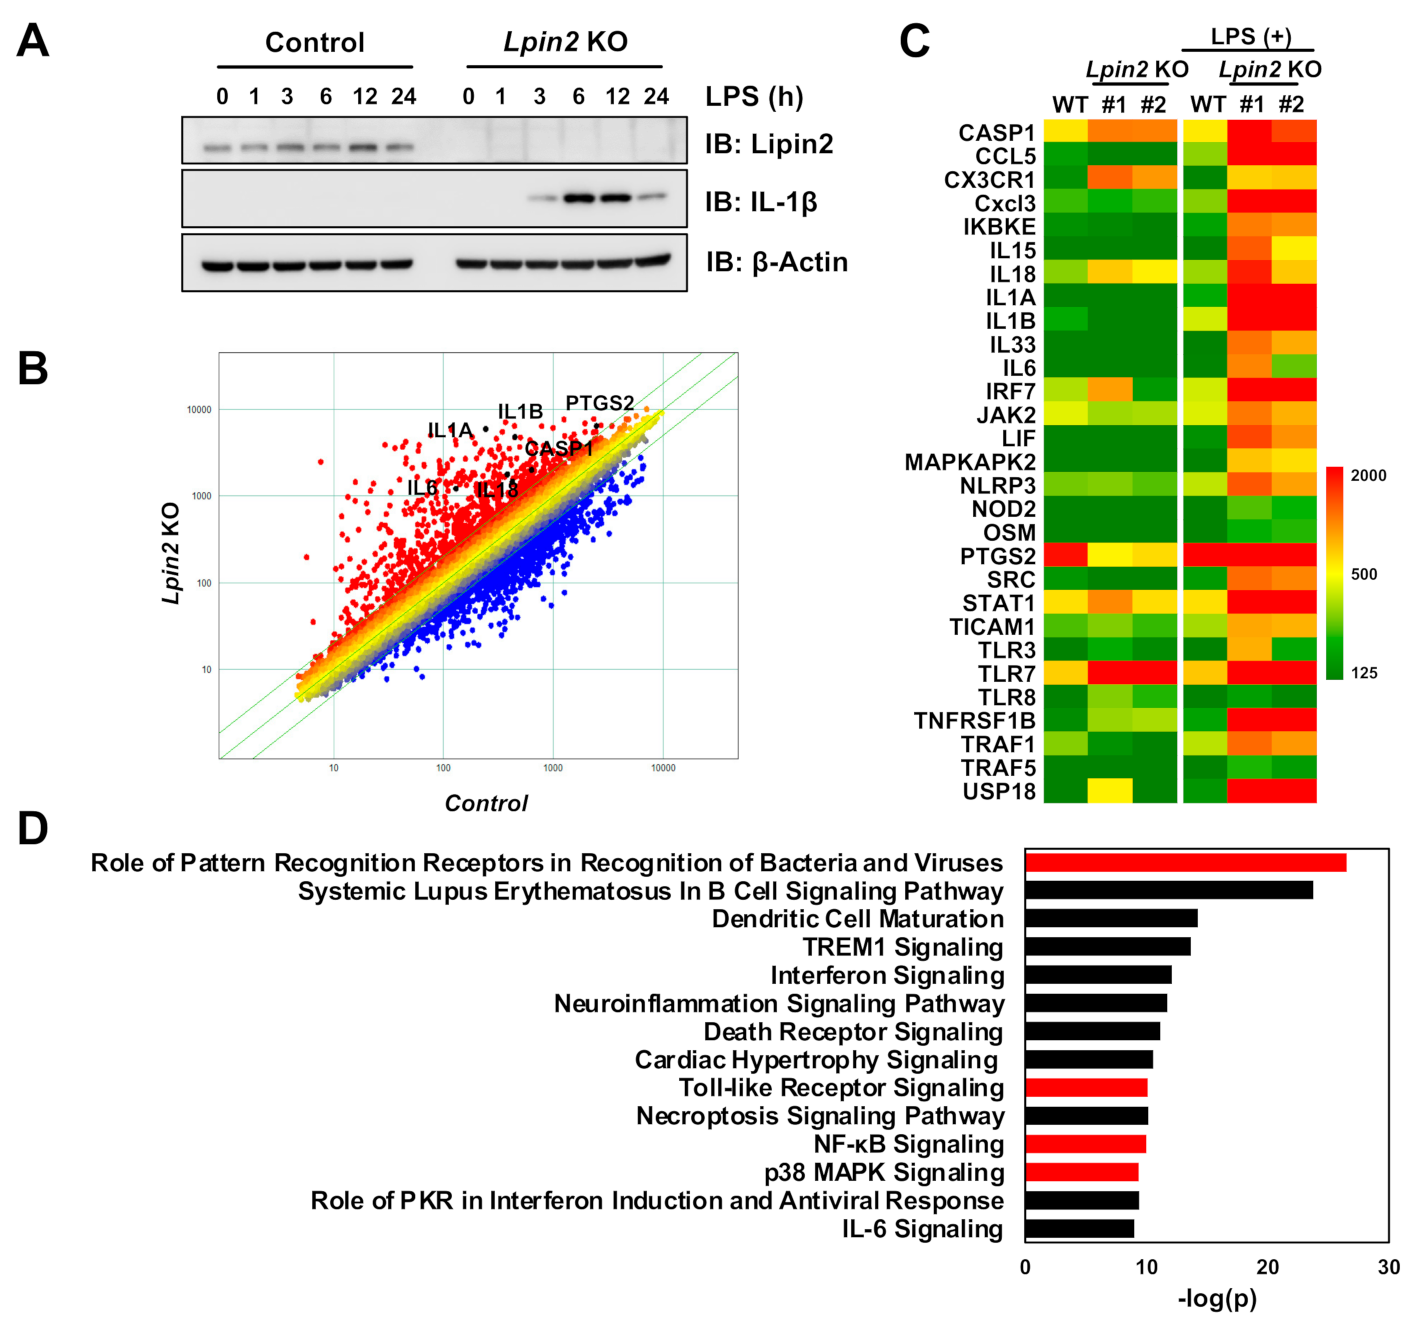
2.1. Lipin2 Deficiency Enhances Proinflammatory Responses in Macrophages by Modulating Inflammatory Transcription

To determine the physiological role of lipin2 in regulating macrophage proinflammatory and osteoclastic signaling, we knocked out Lpin2 in murine macrophage RAW-D cells, a RAW264.7 subclone with a higher potential to differentiate into osteoclasts [17,18]. We treated the control and the Lpin2 knockout cells with LPS and compared their responsiveness to proinflammatory stimulation. As shown in a previous study [12], marked IL-1β protein induction was observed in the Lpin2 knockout cells following LPS stimulation (Figure 1A). We then investigated the role of lipin2 in LPS-elicited proinflammatory transcription. We conducted a microarray expression analysis using LPS-treated or untreated Lpin2 knockout and control RAW-D cells. Scatterplots and heatmaps showed upregulated proinflammatory transcripts in response to LPS in Lpin2 knockout cells (Figure 1B,C). Qiagen ingenuity pathway analysis (IPA) of differentially expressed genes (DEGs) (fold change > 2) in Lpin2 knockout cells identified PRRs, TLRs, NF-κB, and p38 MAP kinase signaling (Figure 1D). These data indicate that lipin2 deficiency promotes macrophage proinflammatory responses.

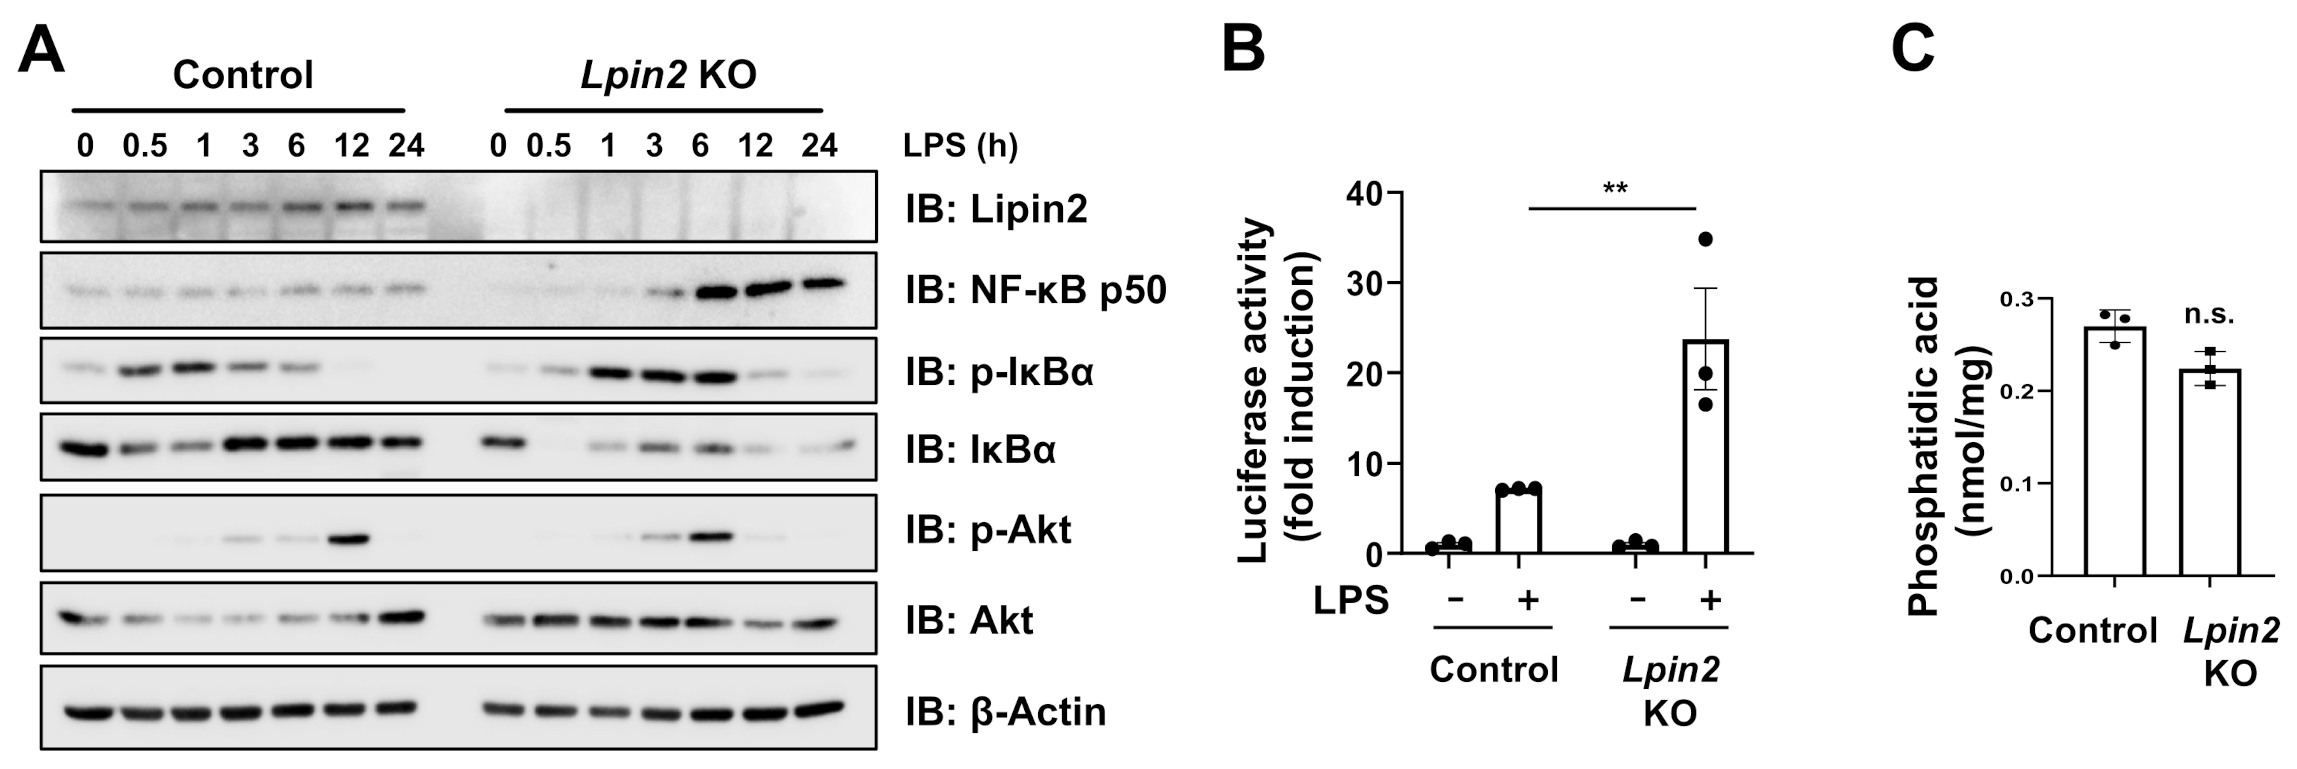
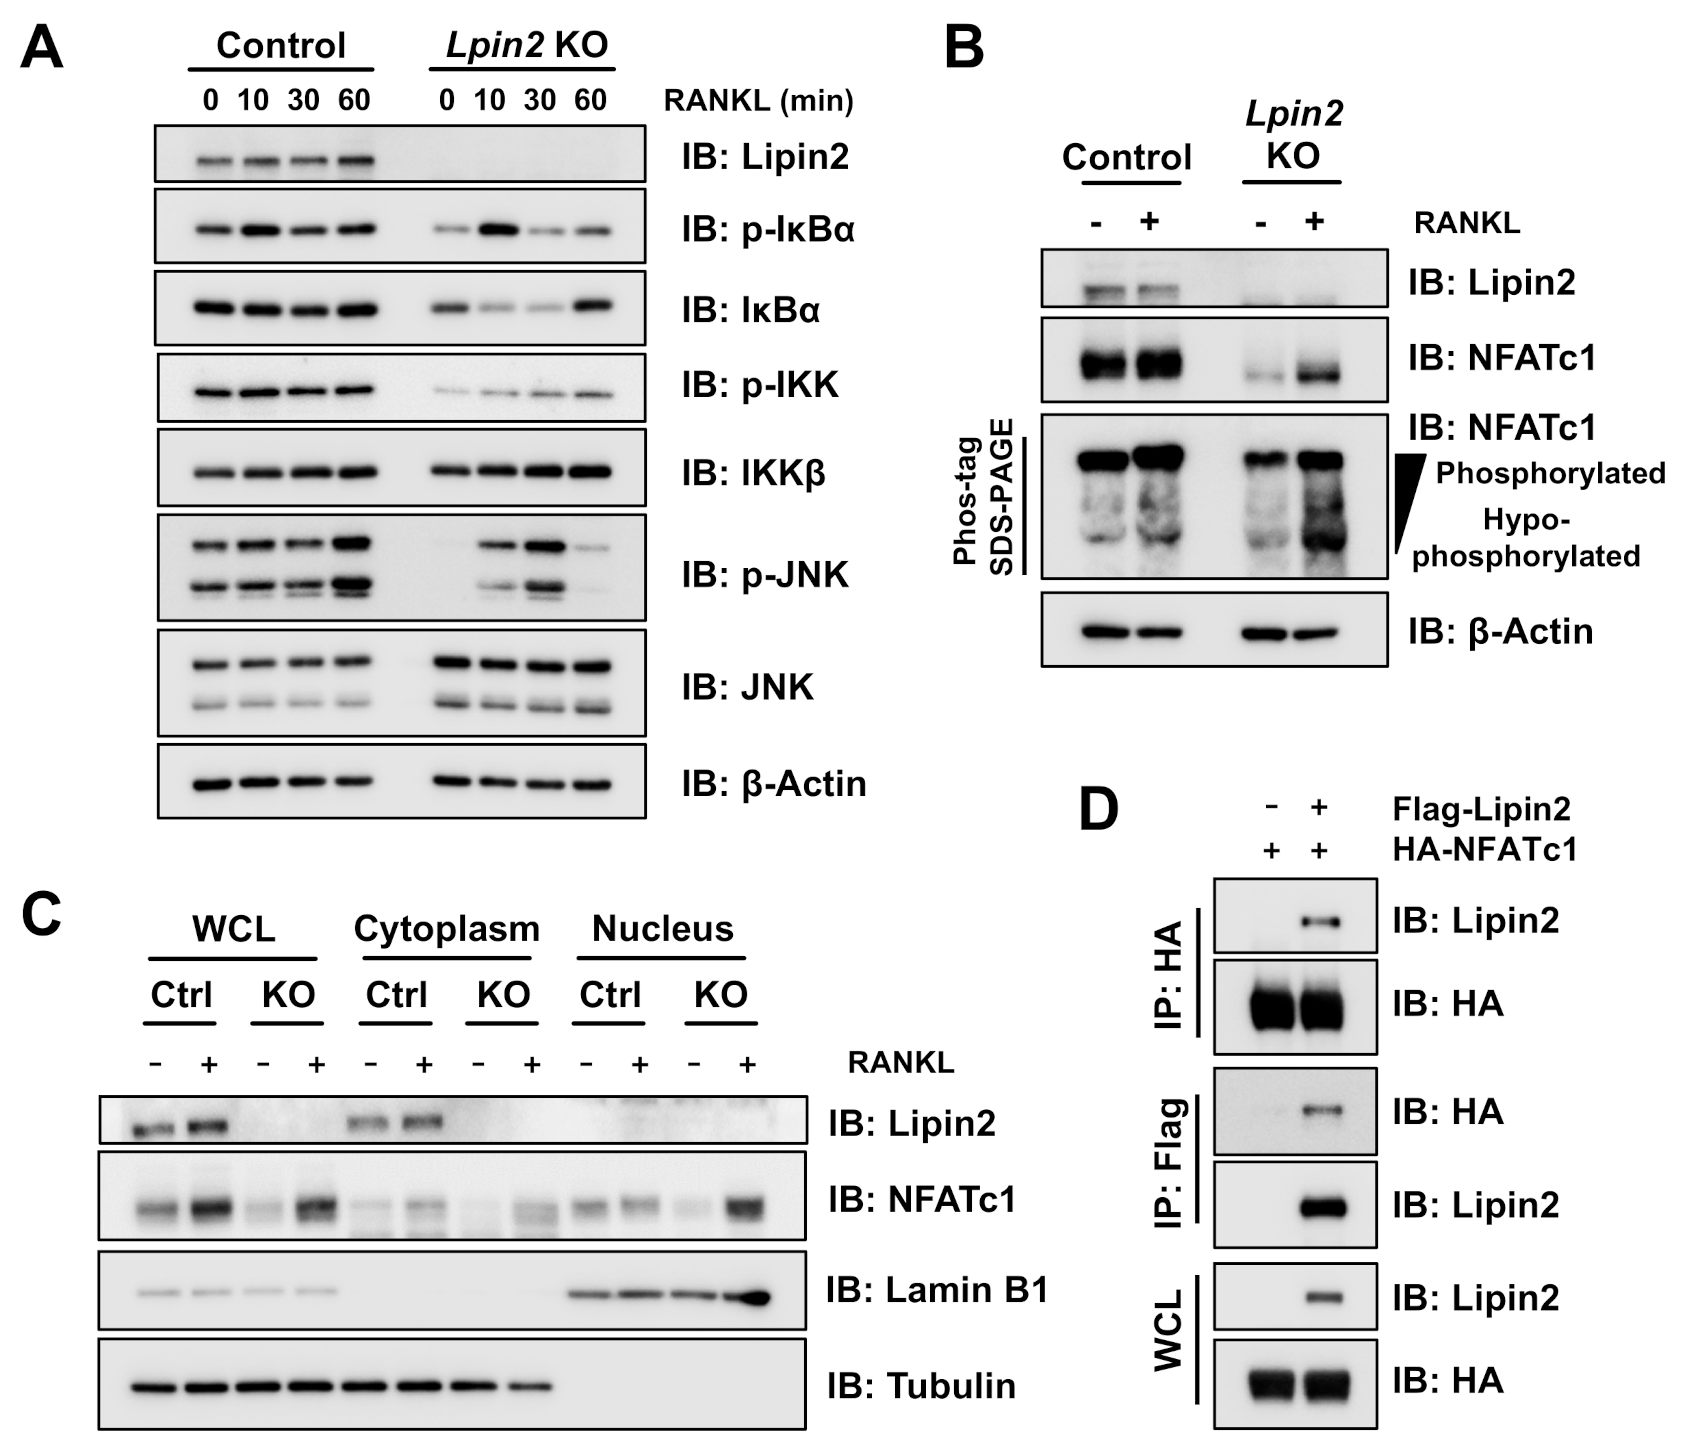
2.2. Lpin2 Knockout Enhances the NF-κB Signaling Pathway in RAW-D Cells

To confirm whether lipin2 modulates inflammatory responses via TLR signaling, we assessed the activation status of the TLR4 downstream inflammatory signaling. We observed that Lpin2 knockout cells showed IκB phosphorylation and downregulation, and accelerated p50 processing, which are NF-κB activation read-outs, while no impact on Akt pathway was observed (Figure 2A). A luciferase reporter assay validated the LPS-mediated NF-κB overactivation in Lpin2 knockout cells (Figure 2B). We investigated whether the NF-κB signaling pathway was altered in response to accumulation of phosphatidic acid (PA), a lipin2 PAP substrate functioning as a signaling molecule [19]. However, the gross PA level did not markedly differ between Lpin2 knockout and control cells (Figure 2C).

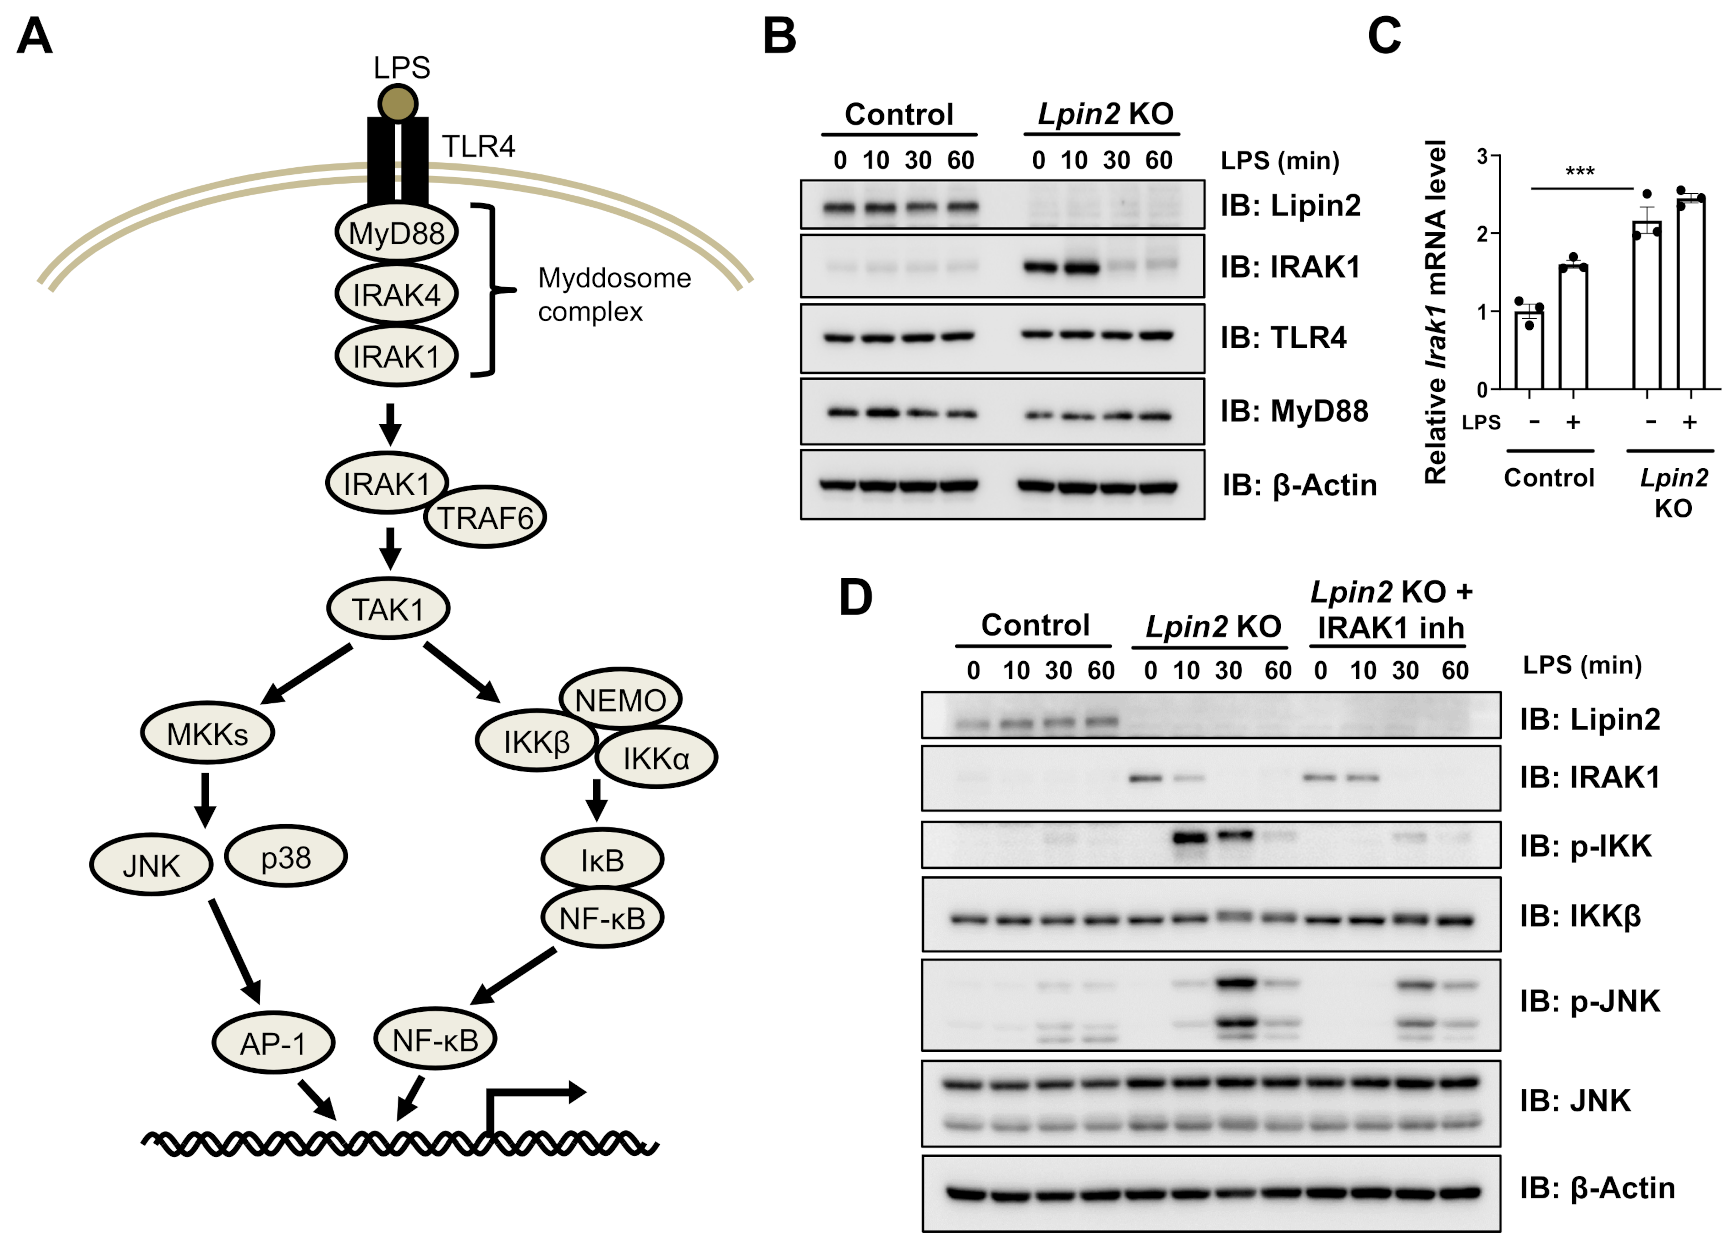
2.3. Elevated IRAK Signaling Induces Downstream Pathways in Lpin2 Knockout Macrophages

Our IPA and western blotting results demonstrated that lipin2 is vital to the TLR4 downstream signaling pathways (Figure 1 andFigure 2). To explore the underlying mechanism of lipin2 deficiency-induced proinflammatory signaling overactivation, we evaluated TLR-proximal adaptor protein and kinase, MyD88, and IRAK1, which comprise the Myddosome, a signaling complex formed in response to TLR activation [20,21] (Figure 3A). IRAK1 was remarkably upregulated, whereas the levels of TLR4 and MyD88 were unchanged in Lpin2 knockout cells stimulated by LPS within a short period of 60 min (Figure 3B). IRAK1 accumulation might be regulated by pre- and post-transcriptional control because the induction of the protein level in Lpin2 knockout cells is greater when compared to two-fold induction of transcription level (Figure 3C). IRAK1 transmits TLR4 signaling downstream by complexing with IRAK4 [22,23]. To test whether the IRAK complex activity results in the overactivation of downstream NF-κB signaling in Lpin2 knockout cells, we treated Lpin2 knockout cells with the IRAK inhibitor, IRAK1/4. The inhibitor treatment suppressed the activation of the downstream NF-κB signaling pathway as well as JNK signaling, the activity of which is reported to increase in lipin2-deficient macrophages [12,13] (Figure 3D).

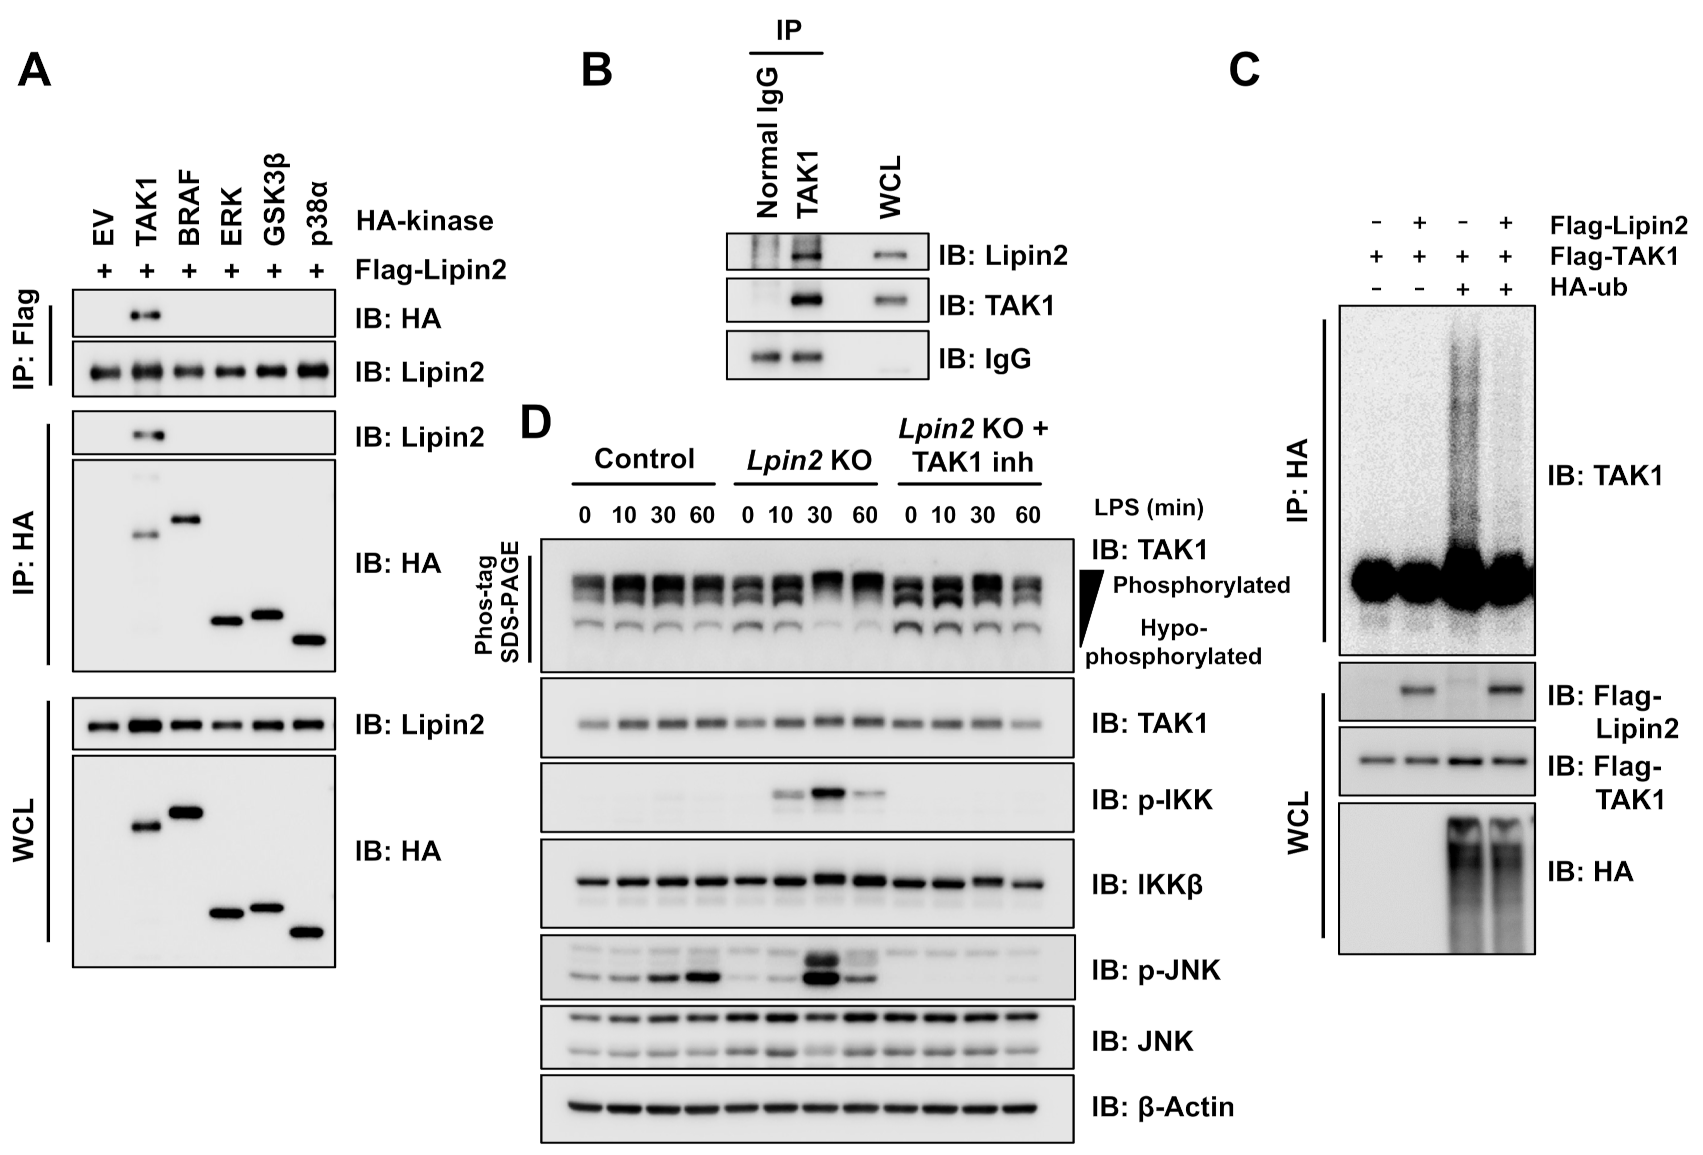
2.4. Elevated TAK1 Activity Induces Downstream Signaling in Lpin2 Knockout Macrophages

It was reported that the founding family member lipin1 serves as a scaffold for several cytoplasmic and nuclear signaling molecules to regulate lipid and energy metabolism [24,25,26,27,28,29]. We hypothesized that lipin2 also has a similar ability for proinflammatory signaling control in macrophages. We screened lipin2 interacting proteins by Flag-lipin2 co-immunoprecipitation (IP)/mass spectrometry and identified TAK1 as a potential lipin2 interacting protein (data not shown). The TAK1–TAB complex transduces proinflammatory signaling by activating NF-κB and MAP kinase signaling via IKKβ and MAPKK phosphorylation [30,31] (Figure 3A). We speculated that this signaling complex might be a potential lipin2 target. To confirm the interaction between lipin2 and TAK1, we ectopically co-expressed different HA-tagged protein kinases and Flag-lipin2 in 293T cells and performed a co-IP assay. Lipin2 only interacted with TAK1 (Figure 4A). We also demonstrated endogenous interaction between TAK1 and lipin2 (Figure 4B). TAK1 activity is positively controlled by phosphorylation and K63-linked polyubiquitination [32,33]. Thus, we examined whether lipin2 interaction affects TAK1 polyubiquitination. Lipin2 co-expression markedly impaired TAK1 polyubiquitination (Figure 4C). We observed the phosphorylated active form of TAK1 in LPS-treated Lpin2 knockout cells (Figure 4D). TAK1 inhibitor treatment suppressed NF-κB signaling as well as JNK activation (Figure 4D).

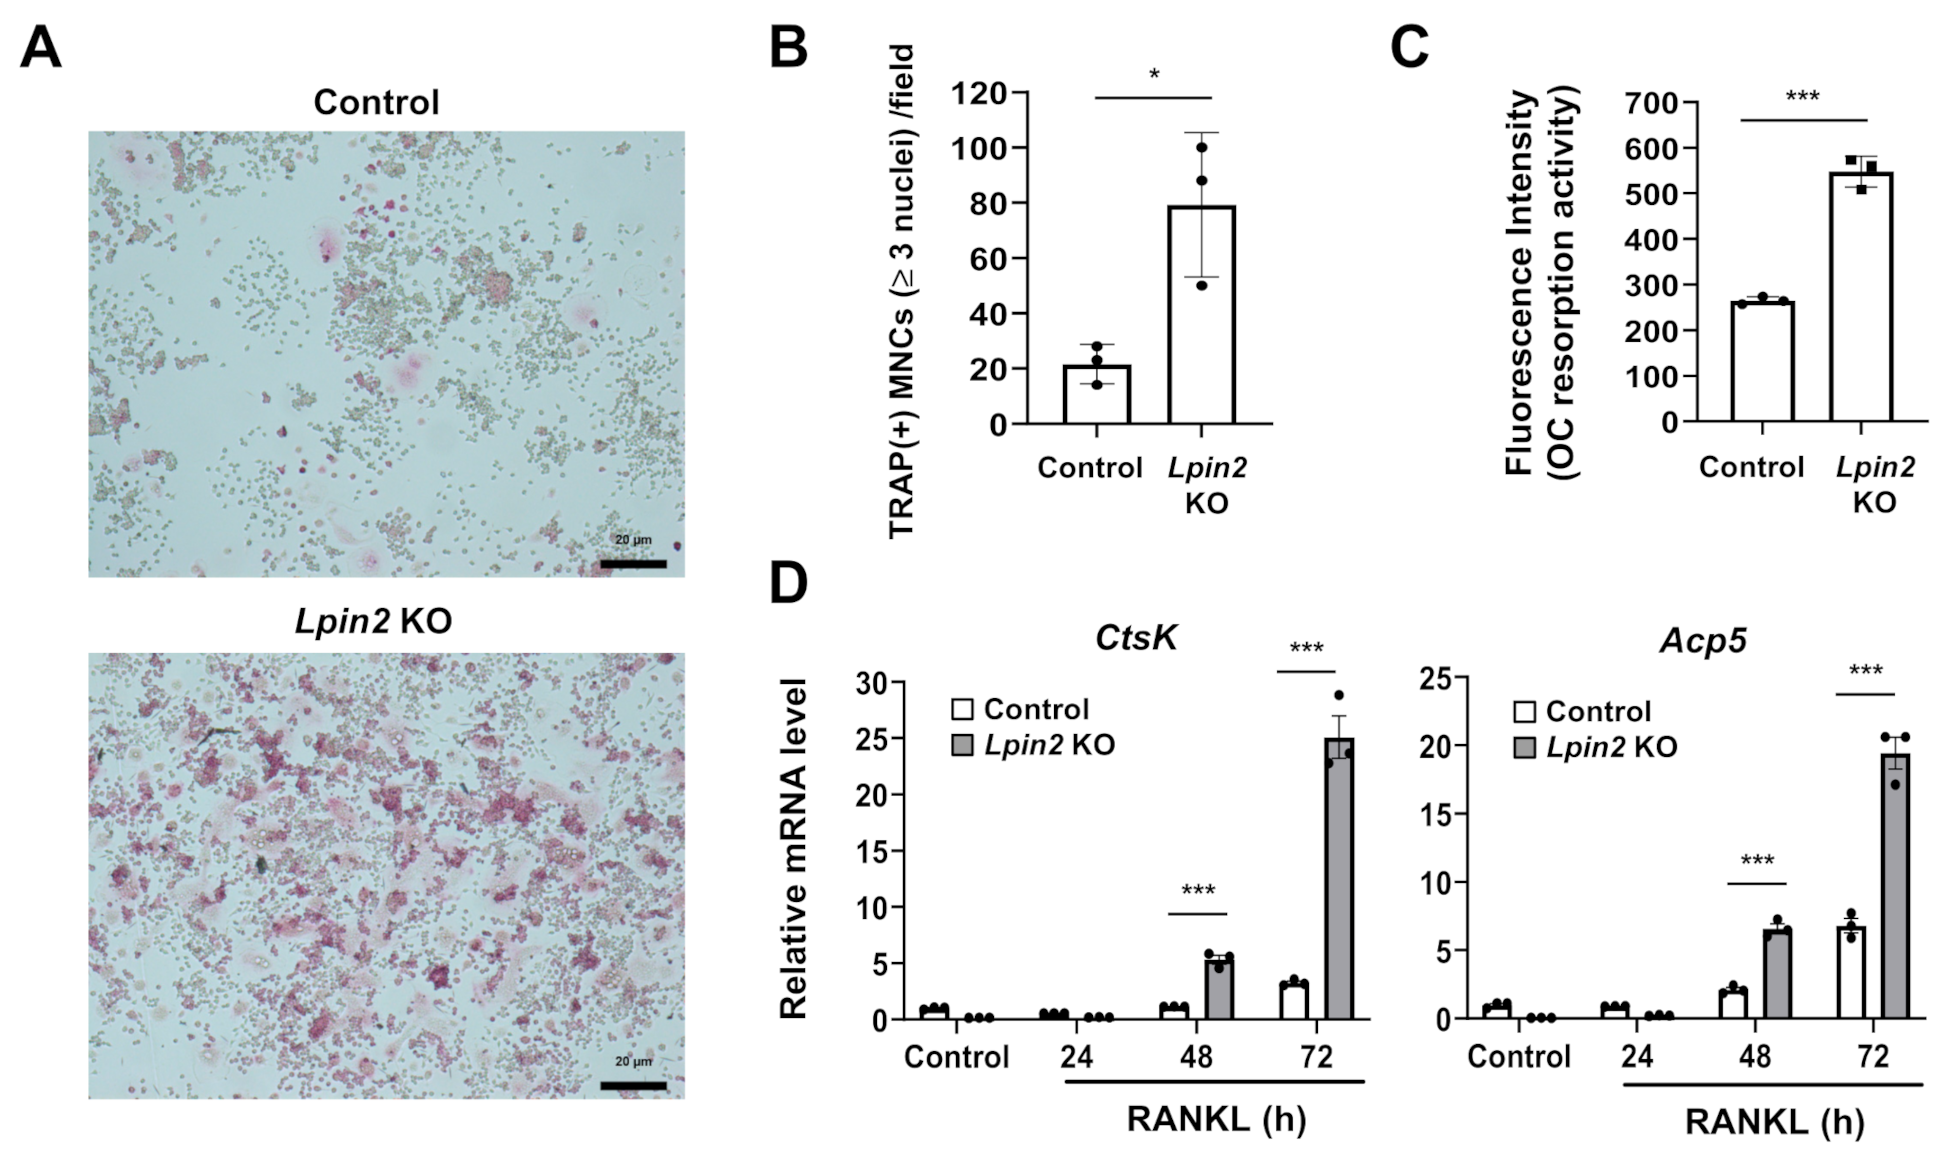
2.5. Lipin2 Deficiency Promotes RANKL-Dependent Osteoclastogenesis and Osteoclastic Resorption Activity in RAW-D Macrophages

Lpin2 alterations cause multifocal osteomyelitis, and there might be a major link between lipin2 function and the intrinsic osteolytic pathophysiology. Thus, we explored the possibility that lipin2 deficiency promotes osteoclastogenesis in macrophages. Lpin2 knockout cells displayed higher potential than control cells for RANKL-mediated osteoclast-like multinuclear cell (MNC) formation (Figure 5A,B). Lpin2 knockout cells showed increased osteoclastic resorption activity (Figure 5C). The transcription levels of the osteoclast markers, Ctsk and Acp5, were markedly increased in Lpin2 knockout cells (Figure 5D). These data demonstrate that lipin2 deficiency increases RANKL-dependent formation of osteoclast-like MNCs.

2.6. Lipin2 Negatively Regulates NFATc1 Activity

Since MAP kinase and NF-κB signaling play critical roles in osteoclast differentiation [34], we conducted western blot analysis to evaluate their activation status. RANKL stimulation unexpectedly did not induce excessive MAP kinase and NF-κB pathway activation in Lpin2 knockout cells (Figure 6A). However, we observed impaired NFATc1 phosphorylation in Lpin2 knockout cells (Figure 6B). NFATc1 is a master transcription regulator of osteoclastogenesis. RANKL stimulation is known to promote calcineurin-mediated NFATc1 dephosphorylation, inducing its nuclear translocation and transactivation activity [35,36,37]. We observed an enhanced RANKL-induced NFATc1 accumulation in the nucleus of Lpin2 knockout cells (Figure 6C). A previous study demonstrated the physical interaction between lipin1 and NFATc4, which resulted in the suppression of NFATc4 transcriptional activity and downstream proinflammatory cytokine expression [28]. For this reason, we tested whether lipin2 interacts with NFATc1. A co-IP assay with transfected 293T cells demonstrated that lipin2 binds to NFATc1 (Figure 6D).

3. Discussion

Lpin2 alterations cause Majeed syndrome, which is characterized by chronic autoinflammatory multifocal osteomyelitis [3,4,5,6]. Therefore, lipin2 could prevent excessive proinflammatory signal activation. A previous study demonstrated that lipin2 plays a crucial role in limiting p38, ERK, and JNK activities in inflammatory macrophages. Overactivation of these kinases by lipin2 deficiency facilitates excessive Il1b mRNA expression and mature IL-1β overproduction [12]. In the present study, we showed that Lpin2 depletion in a murine macrophage cell line resulted in an elevated NF-κB signaling pathway. Therefore, lipin2 may modulate the TLR4 downstream inflammatory signaling axes, MAP kinase, and NF-κB pathways.
Besides PAP function, lipin1 acts as a scaffold for various signaling molecules, such as PPARα, NFATc4, SREBP1, and ERK1/2 [24,25,27,28]. Lipin2, like lipin1, interacts with PPARα and modifies its transcriptional activity [38]. These foregoing studies suggest that lipin family members are multifunctional in nature. In this study, we demonstrated that lipin2 negatively modulates TAK1 activity. We also found that IRAK1 is upregulated in Lpin2 knockout cells. Since IRAK1 is an unstable protein subjected to proteasomal degradation [22,39], lipin2 may possibly contribute to this process. However, further investigations are required to elucidate the precise molecular mechanisms through which lipin2 controls the related signaling pathways. In summary, our findings suggest that lipin2 may play a critical role in suppressing NF-κB signaling in part through the TAK1 pathway. Targeting the overactivated signaling might be an efficient therapeutic strategy, and the use of specific inhibitors should be explored for their effectiveness in the treatment of lipin2-deficient autoinflammatory disorder.
A recent study has identified that the disease-associated Lpin2 mutation is linked to elevated osteoclast formation. M2-like macrophages derived from the patient with Majeed syndrome display enhanced osteoclastogenesis. The macrophages show a proinflammatory phenotype with elevated NFATc1 and phosphorylated JNK levels [16]. Here, we revealed that Lpin2 knockout in RAW-D macrophages promotes osteoclast-like MNC formation by activating the NFATc1 pathway. These findings may provide evidence of the involvement of lipin2 in bone metabolism. However, one limitation is that Lpin2 knockout mice lack phenotypes resembling osteomyelitis. Hence, in-depth studies may be necessary to bridge the gap between human pathophysiology and the absence of osteomyelitis phenotype in mice [8]. In this work, we presented a model demonstrating that lipin2 regulates proinflammatory and osteoclastic signaling via upstream modulation of NF-κB and NFATc1 signaling. This research may lay the foundation for elucidating the pathogenesis of monogenic autoinflammatory bone disorders, which may help in the development of novel therapeutic strategies.

4. Materials and Methods

4.1. Cell Culture

Murine macrophage RAW-D cells are subclones of RAW264.7 and were kindly gifted by Dr. Toshio Kukita [17,18]. The 293T (RRID:CVCL_0063) and HeLa (RRID:CVCL_0030) cells were obtained from the American Type Culture Collection (ATCC; Manassas, VA, USA). The RAW-D cells were cultured in α-MEM (modified Eagle’s medium). The 293T and HeLa cells were cultured in DMEM (Dulbecco’s modified Eagle’s medium). Each medium was supplemented with 10% (v/v) fetal bovine serum (FBS), 100 U penicillin, and 100 μg/mL streptomycin. Transfection was performed with polyethylenimine (PEI) [40]. Lpin2 knockout cells were generated using a previously described method [41]. Briefly, RAW-D cells were transfected with mouse Lipin-2 CRISPR/Cas9 KO and HDR plasmids (Santa Cruz Biotechnology, Dallas, TX, USA). At 48 h after transfection, the cells were selected with 1.5 μg/mL puromycin for 3 d and reseeded for clonal isolation on a 96-well plate. Lipopolysaccharides (LPS-EB: standard LPS from E. coli 0111) were purchased from Nacalai Tesque (Kyoto, Japan). Recombinant human sRANKL was procured from Fujifilm Wako (Osaka, Japan). IRAK1/4 (IRAK inhibitor) and 5Z-7-oxozeaenol (TAK1 inhibitor) were obtained from Merck (Darmstadt, Germany).

4.2. Antibodies and Plasmids

The anti-Lipin-2 antibody (A303-703A) was purchased from Bethyl Laboratories (Montgomery, TX, USA). Anti-IL-1β (3A6) (12242), anti-phospho-IκBα (S32/36) (5A5) (9246), anti-IκBα (44D4) (4812), anti-Phospho-SAPK/JNK (Thr183/Tyr185) (81E11) (4668), anti-JNK2 (56G8) (9258), Anti-phospho-Akt (ser473) (D9E) (4060), anti-Akt (pan) (40D4) (2920), anti-IRAK1 (D51G7) (4504), anti-MyD88 (D80F5) (4283), anti-TAK1 (D94D7) (4505), anti-phospho-IKKα/β (Ser176/180) (16A6) (2697), anti-IKKβ (D30C6) (8943), and anti-Myc-Tag (71D10) (2278) antibodies were purchased from Cell Signaling Technology (Danvers, MA, USA). Anti-HA (Y-11) (sc-805), anti-NFATc1 (7A6) (sc-7294), anti-Lamin B1 (S-20) (sc-30264), anti-α-Tubulin (TU-02) (sc-8035), and anti-β-Actin (C4) (sc-47778), anti-NF-κB p50 (sc-8414), anti-TLR4 (sc-293072) antibodies, and anti-Tak1 (C-9) antibody agarose conjugated (sc-7967 AC) were purchased from Santa Cruz Biotechnology. Anti-Flag monoclonal (018-22381) antibodies were purchased from Fujifilm Wako. Flag-TAK1 and HA-NFATc1 expression plasmids were constructed by subcloning the appropriate PCR fragments into pcDNA3-Flag and pcDNA3-HA, respectively. HA-BRAF, HA-ERK, and HA-p38 expression plasmids were kindly provided by Dr. Wenyi Wei. pRK6-HA-TAK1 (14753), pRK5-HA-ubiquitin (HA-ub) (17608), and pcDNA-HA-GSK3β (14753) were purchased from Addgene (Watertown, MA, USA). pcDNA-Flag-mouse lipin-2 was a kind gift from Dr. Seung-Hoi Koo.

4.3. Immunoblots and Immunoprecipitation

The cells were lysed in an NP-40 cell lysis buffer (50 mM Tris-Cl [pH 7.5], 120 mM NaCl, and 0.5% (v/v) NP-40) supplemented with a cOmplete protease inhibitor cocktail (Sigma-Aldrich Corp., St. Louis, MO, USA) and phosphatase inhibitors (PhosSTOP; Roche Diagnostics, Mannheim, Germany). The lysate protein concentrations were measured with Bio-Rad protein assay dye (Bio-Rad Laboratories, Hercules, CA, USA). Forty micrograms of whole-cell lysate was dissolved in an SDS sample buffer and resolved by SDS-PAGE. For Phos-tag SDS-PAGE, each sample was resolved in an SDS-PAGE gel containing 50 μM Phos-tag (Fujifilm Wako) according to the manufacturer’s instructions. The gels were transferred to polyvinylidene difluoride (PVDF) membranes (Bio-Rad Laboratories), which were then blocked with 5% (w/v) nonfat dry milk in Tris-buffered saline with 0.05% (v/v) Tween 20 (TBST; pH 8.0) and probed with primary antibodies, as indicated in the figures (1:1000–1:4000 with 5% (w/v) nonfat dry milk in TBST). For immunoprecipitation, the cells were harvested in an NP-40 cell lysis buffer containing protease and phosphatase inhibitors. Six hundred microliters (corresponding to 1 mg of cell lysate) were incubated with 8 μL of anti-HA or Flag-tag antibody-conjugated bead slurry or 20 μL of anti-TAK1 antibody-conjugated bead slurry at 4 °C, with gentle rocking for 4 h. The beads were washed 5× with 1 mL of an NP-40 washing buffer (20 mM Tris [pH 8.0], 100 mM NaCl, 1 mM EDTA, and 0.5% (v/v) NP-40), resuspended in 50 μL of 2×SDS sample buffer, and heated at 90 °C for 5 min. Each 15 μL of eluate and 60 μg of whole-cell lysate were separated by SDS-PAGE followed by immunoblot analysis with primary antibodies, as indicated and TrueBlot IgG HRP secondary antibodies (Rockland Immunochemicals, Limerick, PA, USA).

4.4. RT-PCR and Microarray Expression Analyses

Total RNA was extracted with TRIzol reagent (Thermo Fisher Scientific, Waltham, MA, USA). The reverse transcription (RT) reaction was performed with ReverTra Ace qPCR RT Master Mix (TOYOBO, Osaka, Japan). RT-PCR was performed with SYBR Select Master Mix (Thermo Fisher Scientific). Relative gene expression was calculated by the 2−ΔΔCt method [42]. Gapdh normalized the transcript levels. All procedures were performed according to the manufacturers’ instructions. The primers used for the PCR reactions are as follows: mouse Irak1, Forward, 5′-CAGAACCACCACAGATCATCATC-3′, Reverse, 5′-AGGCTTCAATTCCAATAGCATCA-3′; mouse Ctsk, Forward, 5′-GAAGAAGACTCACCAGAAGCAG-3′, Reverse, 5′-TCCAGGTTATGGGCAGAGATT-3′; mouse Acp5, Forward, 5′-CACTCCCACCCTGAGATTTGT-3′, Reverse, 5′-CATCGTCTGCACGGTTCTG-3′; mouse Gapdh, Forward, 5′-GGAGCGAGATCCCTCCAAAAT-3′, Reverse, 5′-AGTGATGGCATGGACTGTGGT-3′. For the DNA microarray analysis, total RNA was extracted with the RNeasy mini kit and QIAshredder (Qiagen, Hilden, Germany). RNA quality and microarray expression analyses were conducted by Riken Genesis (Kawasaki, Japan) using mouse ClariomTM S arrays (Affymetrix, Santa Clara, CA, USA). Data were analyzed by Tohoku Kagaku (Sendai, Japan). All microarray data were deposited in the NCBI Gene Expression Omnibus (GEO) database (GSE166741). Pathway analysis was carried out using the ingenuity pathway analysis (IPA) tool (Qiagen).

4.5. Osteoclast Formation and Osteoclastic Resorption Activity Assays

Murine macrophage RAW-D cells were cultured with 50 ng/mL RANKL for 3 d to induce osteoclastogenesis. The cells were fixed with 3.7% (v/v) formaldehyde, and osteoclast formation was detected by tartrate-resistant acid phosphatase (TRAP) staining. Images were acquired using Vert A1 microscopy and ZEN software (ZEISS, Jena, Germany). TRAP-positive MNCs containing ≥3 nuclei were scored as differentiated osteoclast-like cells. Osteoclastic resorption activity measurement was conducted with a bone resorption assay kit (PG Research, Kodaira, Japan) according to the manufacturer’s instructions. Briefly, RAW-D cells were seeded at 1 × 10⁴/well on a 48-well plate coated with fluoresceinated calcium phosphate and cultured for 3 d in phenol red-free medium containing 100 ng/mL RANKL. Osteoclastic resorption activity was evaluated by measuring the fluorescence intensity of 100 μL of conditioned medium at excitation/emission (Ex/Em) wavelengths of 485/535 nm in a SpectraMax M2e microplate reader (Molecular Devices LLC, San Jose, CA, USA).

4.6. Cellular Fractionation

Cells were fractioned according to a previously described protocol [43]. Briefly, 107 RAW-D cells were collected in 1 mL of ice-cold phosphate-buffered saline (PBS), centrifuged at 1000× g for 3 min at 4 °C, and the cell pellets were resuspended in 900 μL of ice-cold PBS containing 0.1% (v/v) NP-40 plus protease inhibitor. Afterwards, 300 μL of whole-cell lysate fraction was withdrawn, and the remainder was centrifuged at 10,000× g for 10 s at 4 °C. After that, 400 μL of supernatant was collected and centrifuged at 10,000× g for 10 s at 4 °C, and 200 μL of supernatant (cytosolic fraction) was collected. The pellets (nuclear fraction) obtained after the first spin were washed twice with 1 mL of ice-cold 0.1% (v/v) NP40/PBS and dissolved in a 1×SDS sample buffer. The nuclear and whole-cell lysate fractions dissolved in the SDS sample buffer were sonicated with a VP-050 microprobe (TAITEC, Koshigaya, Japan).

4.7. Phosphatidic Acid (PA) Measurement

The PA content was measured with a PicoProbe phosphatidic acid assay kit (BioVision, Milpitas, CA, USA) according to the manufacturer’s instructions. Briefly, 106 WT and 106 Lpin2 knockout cells were harvested and lysed with 1 mL of a PA assay buffer, and their protein concentrations were determined with Bio-Rad protein assay dye. The lipids were extracted by adding 3.75 mL of chloroform/methanol/12 N HCl (2:4:0.1), 1.25 mL of chloroform, and 1.25 mL of 1 M NaCl, vortexing, centrifuging at 3000× g for 10 min at RT, and collecting the organic layer. The chloroform was evaporated in the hood for overnight, and the PA was dissolved in 5% (w/v) Triton X-100, converted to a fluoresceinated PA intermediate, and quantified by measuring the latter at Ex/Em wavelengths of 535 nm/587 nm in a SpectraMax M2e microplate reader (Molecular Devices LLC).

4.8. Luciferase Reporter Assay

Luciferase assay was carried out using the Dual-Glo Luciferase Assay System (Promega, Madison, WI, USA) according to the manufacturer’s instructions. Briefly, control or Lpin2 knockout RAW-D cells were transfected with pGL4.32[Luc2P/NF-kB-RE] firefly luciferase reporter and pRL-TK renilla luciferase expression plasmids (Promega) at a ratio of 50:1. At 24 h after transfection, cells were stimulated with 200 ng/mL LPS. After 4 h, cells were harvested for evaluating reporter activities. The firefly and renilla luciferase activities were measured in a multimode reader, TriStar2 LB942 (Berthold Technologies, Bad Wildbad, Germany). The values of firefly luciferase activities were normalized with that of renilla luciferase.

4.9. Mass Spectrometry

HeLa cells were transfected with pcDNA3-Flag-lipin2. After 36 h, the cells were treated with 10 μM MG132 for 12 h and harvested in an NP-40 cell lysis buffer containing protease and phosphatase inhibitors. Lysate from empty vector-transfected cells was prepared and used as the control IP sample. Five hundred microliters corresponding to 0.5 mg of cell lysate was incubated with 10 μL of anti-Flag antibody-conjugated bead slurry (Sigma-Aldrich Corp) at 4 °C, with gentle rocking for 2 h. The beads were washed twice with 1 mL of an NP-40 washing buffer and twice with TBST. Samples were purified by liquid chromatography/tandem mass spectrometry (LC-MS/MS) as previously described [44] at Kazusa Genome Technologies in the Kazusa DNA Research Institute (Kisarazu, Japan).

4.10. Quantification and Statistical Analysis

Data are means ± SD or SEM for ≥3 independent experiments or biological replicates. Between-group differences were analyzed by one-way ANOVA with multiple comparison tests or Student’s t-test. Statistical analyses were performed in GraphPad Prism9 (GraphPad Software, San Diego, CA, USA). P < 0.05 was considered a statistically significant difference.

Author Contributions

Conceptualization, A.W., H.E., S.F., and H.I.; formal analysis, A.W.; investigation, A.W., S.H., and M.C.; writing—original draft preparation, H.I.; writing—review and editing, A.W., H.E., and S.F.; visualization, A.W.; supervision, H.E., S.F., and H.I.; funding acquisition, A.W. and H.I. All authors have read and agreed to the published version of the manuscript.

Funding

This research was funded by JSPS Grants-in-Aid for Scientific Research, grant number 19H03834 and 20K20612.

Institutional Review Board Statement

Not applicable.

Informed Consent Statement

Not applicable.

Data Availability Statement

Microarray data was deposited in the GEO database (GSE166741).

Acknowledgments

We thank Toshio Kukita for providing RAW-D cells and Seung-Hoi Koo for providing the pcDNA-Flag-lipin-2 plasmid.

Conflicts of Interest

The authors declare no conflict of interest.

References

  1. Majeed, H.A.; Kalaawi, M.; Mohanty, D.; Teebi, A.S.; Tunjekar, M.F.; al-Gharbawy, F.; Majeed, S.A.; al-Gazzar, A.H. Congen-ital dyserythropoietic anemia and chronic recurrent multifocal osteomyelitis in three related children and the association with Sweet syndrome in two siblings. J. Pediatr. 1989, 115, 730–734. [Google Scholar] [CrossRef]
  2. Majeed, H.A.; Al-Tarawna, M.; El-Shanti, H.; Kamel, B.; Al-Khalaileh, F. The syndrome of chronic recurrent multifocal os-teomyelitis and congenital dyserythropoietic anaemia. Report of a new family and a review. Eur. J. Pediatr. 2001, 160, 705–710. [Google Scholar] [CrossRef] [PubMed]
  3. Ferguson, P.J.; Chen, S.; Tayeh, M.K.; Ochoa, L.; Leal, S.M.; Pelet, A.; Munnich, A.; Lyonnet, S.; Majeed, H.A.; El-Shanti, H. Homozygous mutations in LPIN2 are responsible for the syndrome of chronic recurrent multifocal osteomyelitis and con-genital dyserythropoietic anaemia (Majeed syndrome). J. Med. Genet. 2005, 42, 551–557. [Google Scholar] [CrossRef] [Green Version]
  4. Al-Mosawi, Z.S.; Al-Saad, K.K.; Ijadi-Maghsoodi, R.; El-Shanti, H.I.; Ferguson, P.J. A splice site mutation confirms the role of LPIN2 in Majeed syndrome. Arthritis Rheum. 2007, 56, 960–964. [Google Scholar] [CrossRef] [PubMed]
  5. Liu, J.; Hu, X.Y.; Zhao, Z.P.; Guo, R.L.; Guo, J.; Li, W.; Hao, C.J.; Xu, B.P. Compound heterozygous LPIN2 pathogenic variants in a patient with Majeed syndrome with recurrent fever and severe neutropenia: Case report. BMC Med. Genet. 2019, 20, 182. [Google Scholar] [CrossRef] [PubMed] [Green Version]
  6. Herlin, T.; Fiirgaard, B.; Bjerre, M.; Kerndrup, G.; Hasle, H.; Bing, X.; Ferguson, P.J. Efficacy of anti-IL-1 treatment in Majeed syndrome. Ann. Rheum. Dis. 2013, 72, 410–413. [Google Scholar] [CrossRef]
  7. Wang, H.; Airola, M.V.; Reue, K. How lipid droplets “TAG” along: Glycerolipid synthetic enzymes and lipid storage. Biochim. Biophys. Acta Mol. Cell Biol. Lipids 2017, 1862, 1131–1145. [Google Scholar] [CrossRef]
  8. Reue, K.; Wang, H. Mammalian lipin phosphatidic acid phosphatases in lipid synthesis and beyond: Metabolic and inflam-matory disorders. J. Lipid Res. 2019, 60, 728–733. [Google Scholar] [CrossRef] [Green Version]
  9. Takeuchi, O.; Akira, S. Pattern recognition receptors and inflammation. Cell 2010, 140, 805–820. [Google Scholar] [CrossRef] [PubMed] [Green Version]
  10. Kawai, T.; Akira, S. Toll-like receptors and their crosstalk with other innate receptors in infection and immunity. Immunity 2011, 34, 637–650. [Google Scholar] [CrossRef] [PubMed] [Green Version]
  11. Balboa, M.A.; de Pablo, N.; Meana, C.; Balsinde, J. The role of lipins in innate immunity and inflammation. Biochim. Biophys. Acta Mol. Cell Biol. Lipids 2019, 1864, 1328–1337. [Google Scholar] [CrossRef] [PubMed]
  12. Lorden, G.; Sanjuan-Garcia, I.; de Pablo, N.; Meana, C.; Alvarez-Miguel, I.; Perez-Garcia, M.T.; Pelegrin, P.; Balsinde, J.; Bal-boa, M.A. Lipin-2 regulates NLRP3 inflammasome by affecting P2X7 receptor activation. J. Exp. Med. 2017, 214, 511–528. [Google Scholar] [CrossRef] [PubMed] [Green Version]
  13. Valdearcos, M.; Esquinas, E.; Meana, C.; Pena, L.; Gil-de-Gomez, L.; Balsinde, J.; Balboa, M.A. Lipin-2 reduces proinflamma-tory signaling induced by saturated fatty acids in macrophages. J. Biol. Chem. 2012, 287, 10894–10904. [Google Scholar] [CrossRef] [Green Version]
  14. El-Shanti, H.I.; Ferguson, P.J. Chronic recurrent multifocal osteomyelitis: A concise review and genetic update. Clin. Orthop. Relat. Res. 2007, 462, 11–19. [Google Scholar] [CrossRef] [PubMed]
  15. Hedrich, C.M.; Hofmann, S.R.; Pablik, J.; Morbach, H.; Girschick, H.J. Autoinflammatory bone disorders with special focus on chronic recurrent multifocal osteomyelitis (CRMO). Pediatr. Rheumatol. Online J. 2013, 11, 47. [Google Scholar] [CrossRef] [PubMed] [Green Version]
  16. Bhuyan, F.; de Jesus, A.A.; Mitchell, J.; Leikina, E.; VanTries, R.; Herzog, R.; Onel, K.B.; Oler, A.; Montealegre Sanchez, G.A.; Johnson, K.A.; et al. Novel Majeed syndrome causing LPIN2 mutations link bone inflamma tion to inflammatory M2 macrophages and accelerated osteoclastogenesis. Arthritis Rheumatol. 2020. [Google Scholar] [CrossRef]
  17. Kukita, T.; Wada, N.; Kukita, A.; Kakimoto, T.; Sandra, F.; Toh, K.; Nagata, K.; Iijima, T.; Horiuchi, M.; Matsusaki, H.; et al. RANKL-induced DC-STAMP is essential for osteoclastogenesis. J. Exp. Med. 2004, 200, 941–946. [Google Scholar] [CrossRef] [Green Version]
  18. Watanabe, T.; Kukita, T.; Kukita, A.; Wada, N.; Toh, K.; Nagata, K.; Nomiyama, H.; Iijima, T. Direct stimulation of osteo-clastogenesis by MIP-1alpha: Evidence obtained from studies using RAW264 cell clone highly responsive to RANKL. J. Endocrinol. 2004, 180, 193–201. [Google Scholar] [CrossRef] [PubMed] [Green Version]
  19. Csaki, L.S.; Dwyer, J.R.; Fong, L.G.; Tontonoz, P.; Young, S.G.; Reue, K. Lipins, lipinopathies, and the modulation of cellular lipid storage and signaling. Prog. Lipid Res. 2013, 52, 305–316. [Google Scholar] [CrossRef] [Green Version]
  20. Motshwene, P.G.; Moncrieffe, M.C.; Grossmann, J.G.; Kao, C.; Ayaluru, M.; Sandercock, A.M.; Robinson, C.V.; Latz, E.; Gay, N.J. An oligomeric signaling platform formed by the Toll-like receptor signal transducers MyD88 and IRAK-4. J. Biol. Chem. 2009, 284, 25404–25411. [Google Scholar] [CrossRef] [Green Version]
  21. Lin, S.C.; Lo, Y.C.; Wu, H. Helical assembly in the MyD88-IRAK4-IRAK2 complex in TLR/IL-1R signalling. Nature 2010, 465, 885–890. [Google Scholar] [CrossRef] [Green Version]
  22. Gottipati, S.; Rao, N.L.; Fung-Leung, W.P. IRAK1: A critical signaling mediator of innate immunity. Cell Signal 2008, 20, 269–276. [Google Scholar] [CrossRef] [PubMed]
  23. Jain, A.; Kaczanowska, S.; Davila, E. IL-1 Receptor-Associated Kinase Signaling and Its Role in Inflammation, Cancer Pro-gression, and Therapy Resistance. Front Immunol. 2014, 5, 553. [Google Scholar] [CrossRef] [Green Version]
  24. Jiang, W.; Zhu, J.; Zhuang, X.; Zhang, X.; Luo, T.; Esser, K.A.; Ren, H. Lipin1 Regulates Skeletal Muscle Differentia-tion through Extracellular Signal-regulated Kinase (ERK) Activation and Cyclin D Complex-regulated Cell Cycle With-drawal. J. Biol. Chem. 2015, 290, 23646–23655. [Google Scholar] [CrossRef] [PubMed] [Green Version]
  25. Finck, B.N.; Gropler, M.C.; Chen, Z.; Leone, T.C.; Croce, M.A.; Harris, T.E.; Lawrence, J.C., Jr.; Kelly, D.P. Lipin 1 is an in-ducible amplifier of the hepatic PGC-1alpha/PPARalpha regulatory pathway. Cell Metab. 2006, 4, 199–210. [Google Scholar] [CrossRef] [PubMed] [Green Version]
  26. Koh, Y.K.; Lee, M.Y.; Kim, J.W.; Kim, M.; Moon, J.S.; Lee, Y.J.; Ahn, Y.H.; Kim, K.S. Lipin1 is a key factor for the maturation and maintenance of adipocytes in the regulatory network with CCAAT/enhancer-binding protein alpha and peroxisome proliferator-activated receptor gamma 2. J. Biol. Chem. 2008, 283, 34896–34906. [Google Scholar] [CrossRef] [PubMed] [Green Version]
  27. Peterson, T.R.; Sengupta, S.S.; Harris, T.E.; Carmack, A.E.; Kang, S.A.; Balderas, E.; Guertin, D.A.; Madden, K.L.; Carpenter, A.E.; Finck, B.N.; et al. mTOR complex 1 regulates lipin 1 localization to control the SREBP pathway. Cell 2011, 146, 408–420. [Google Scholar] [CrossRef] [PubMed] [Green Version]
  28. Kim, H.B.; Kumar, A.; Wang, L.; Liu, G.H.; Keller, S.R.; Lawrence, J.C., Jr.; Finck, B.N.; Harris, T.E. Lipin 1 represses NFATc4 transcriptional activity in adipocytes to inhibit secretion of inflammatory factors. Mol. Cell Biol. 2010, 30, 3126–3139. [Google Scholar] [CrossRef] [Green Version]
  29. Manmontri, B.; Sariahmetoglu, M.; Donkor, J.; Bou Khalil, M.; Sundaram, M.; Yao, Z.; Reue, K.; Lehner, R.; Brindley, D.N. Glucocorticoids and cyclic AMP selectively increase hepatic lipin-1 expression, and insulin acts antagonistically. J. Lipid Res. 2008, 49, 1056–1067. [Google Scholar] [CrossRef] [Green Version]
  30. Sakurai, H. Targeting of TAK1 in inflammatory disorders and cancer. Trends Pharmacol. Sci. 2012, 33, 522–530. [Google Scholar] [CrossRef]
  31. Ajibade, A.A.; Wang, H.Y.; Wang, R.F. Cell type-specific function of TAK1 in innate immune signaling. Trends Immunol. 2013, 34, 307–316. [Google Scholar] [CrossRef]
  32. Yamazaki, K.; Gohda, J.; Kanayama, A.; Miyamoto, Y.; Sakurai, H.; Yamamoto, M.; Akira, S.; Hayashi, H.; Su, B.; Inoue, J. Two mechanistically and temporally distinct NF-kappaB activation pathways in IL-1 signaling. Sci. Signal 2009, 2, ra66. [Google Scholar] [CrossRef]
  33. Fan, Y.; Yu, Y.; Shi, Y.; Sun, W.; Xie, M.; Ge, N.; Mao, R.; Chang, A.; Xu, G.; Schneider, M.D.; et al. Lysine 63-linked polyubiq-uitination of TAK1 at lysine 158 is required for tumor necrosis factor alpha- and interleukin-1beta-induced IKK/NF-kappaB and JNK/AP-1 activation. J. Biol. Chem. 2010, 285, 5347–5360. [Google Scholar] [CrossRef] [Green Version]
  34. Boyle, W.J.; Simonet, W.S.; Lacey, D.L. Osteoclast differentiation and activation. Nature 2003, 423, 337–342. [Google Scholar] [CrossRef] [PubMed]
  35. Hogan, P.G.; Chen, L.; Nardone, J.; Rao, A. Transcriptional regulation by calcium, calcineurin, and NFAT. Genes Dev. 2003, 17, 2205–2232. [Google Scholar] [CrossRef] [Green Version]
  36. Okamura, H.; Aramburu, J.; Garcia-Rodriguez, C.; Viola, J.P.; Raghavan, A.; Tahiliani, M.; Zhang, X.; Qin, J.; Hogan, P.G.; Rao, A. Concerted dephosphorylation of the transcription factor NFAT1 induces a conformational switch that regulates transcriptional activity. Mol. Cell 2000, 6, 539–550. [Google Scholar] [CrossRef]
  37. Takayanagi, H.; Kim, S.; Koga, T.; Nishina, H.; Isshiki, M.; Yoshida, H.; Saiura, A.; Isobe, M.; Yokochi, T.; Inoue, J.; et al. In-duction and activation of the transcription factor NFATc1 (NFAT2) integrate RANKL signaling in terminal differentiation of osteoclasts. Dev. Cell 2002, 3, 889–901. [Google Scholar] [CrossRef] [Green Version]
  38. Donkor, J.; Zhang, P.; Wong, S.; O’Loughlin, L.; Dewald, J.; Kok, B.P.; Brindley, D.N.; Reue, K. A conserved serine residue is required for the phosphatidate phosphatase activity but not the transcriptional coactivator functions of lipin-1 and lipin-2. J. Biol. Chem. 2009, 284, 29968–29978. [Google Scholar] [CrossRef] [Green Version]
  39. Yamin, T.T.; Miller, D.K. The interleukin-1 receptor-associated kinase is degraded by proteasomes following its phosphor-ylation. J. Biol. Chem. 1997, 272, 21540–21547. [Google Scholar] [CrossRef] [Green Version]
  40. Longo, P.A.; Kavran, J.M.; Kim, M.S.; Leahy, D.J. Transient mammalian cell transfection with polyethylenimine (PEI). Methods Enzymol. 2013, 529, 227–240. [Google Scholar]
  41. Watahiki, A.; Shimizu, K.; Hoshikawa, S.; Chiba, M.; Kitamura, H.; Egusa, H.; Fukumoto, S.; Inuzuka, H. Lipin-2 degrada-tion elicits a proinflammatory gene signature in macrophages. Biochem. Biophys. Res. Commun. 2020, 524, 477–483. [Google Scholar] [CrossRef] [PubMed]
  42. Livak, K.J.; Schmittgen, T.D. Analysis of relative gene expression data using real-time quantitative PCR and the 2(-Delta Delta C(T)). Method. Methods 2001, 25, 402–408. [Google Scholar] [CrossRef] [PubMed]
  43. Suzuki, K.; Bose, P.; Leong-Quong, R.Y.; Fujita, D.J.; Riabowol, K. REAP: A two minute cell fractionation method. BMC Res. Notes 2010, 3, 294. [Google Scholar] [CrossRef] [PubMed] [Green Version]
  44. Kawashima, Y.; Watanabe, E.; Umeyama, T.; Nakajima, D.; Hattori, M.; Honda, K.; Ohara, O. Optimization of Da-ta-Independent Acquisition Mass Spectrometry for Deep and Highly Sensitive Proteomic Analysis. Int. J. Mol. Sci. 2019, 20, 5932. [Google Scholar] [CrossRef] [Green Version]
Figure 1. Lpin2 knockout elicits proinflammatory gene signature in RAW-D macrophages. (A) Immunoblot (IB) analysis of whole-cell lysates (WCLs) derived from control and Lpin2 knockout (KO) RAW-D cells treated with 200 ng/mL lipopolysaccharide (LPS). The cells were harvested for the IB analysis at the indicated time points. Wild-type (WT) cells were used as control. (B) Scatterplot comparing gene expression profiles of control (WT) (x-axis) and Lpin2 KO (y-axis) RAW-D cells treated with 200 ng/mL LPS for 4 h (red, upregulation; blue, downregulation; fold change > 2.0). (C) Heatmap of transcription levels of selected inflammation-related genes in control and Lpin2 KO RAW-D cells (clone #1 and #2) treated with 200 ng/mL LPS for 4 h. (D) “Canonical Pathways” analyzed by Qiagen ingenuity pathway analysis software for differentially expressed genes (DEGs) in Lpin2 KO RAW-D cells (fold change > 2.0) treated with 200 ng/mL LPS for 4 h.
Ijms 22 02893 g001
Figure 2. Lpin2 knockout induces NF-κB signaling in RAW-D macrophages. (A) IB analysis of WCLs derived from control and Lpin2 KO RAW-D cells treated with 200 ng/mL LPS. The cells were harvested for IB analysis at the indicated time points. (B) A luciferase reporter assay showing relative NF-κB activity in control and Lpin2 KO RAW-D cells with or without 200 ng/mL LPS treatment for 4 h. Data are means ± SD (n = 3). ** P < 0.01; not significant, One-way ANOVA followed by multiple comparisons test. (C) Quantification of intracellular phosphatidic acid (PA) in control (WT) and Lpin2 KO RAW-D cells. Data are means ± SD (n = 3), n.s., not significant, Student’s t-test.
Ijms 22 02893 g002
Figure 3. Elevated IRAK signaling induces downstream pathways in Lpin2 knockout RAW-D cells. (A) A scheme of the TLR4 signaling pathway. (B) IB analysis of WCLs derived from control (WT) and Lpin2 KO RAW-D cells treated with 200 ng/mL LPS. The cells were harvested for IB analysis at the indicated time points. (C) RT-PCR was performed to determine relative Irak1 mRNA expression in control and Lpin2 KO RAW-D cells treated with 200 ng/mL LPS for 4 h. Gapdh was used for normalization. Data are means ± SEM (n = 3). *** P < 0.001, One-way ANOVA followed by multiple comparison test. (D) IB analysis of WCLs derived from control and Lpin2 KO RAW-D cells treated with 200 ng/mL LPS. Cells were treated with either DMSO or 10 µM IRAK inhibitor IRAK1/4 as indicated for 1 h before LPS treatment. The cells were harvested for IB analysis at the indicated time points.
Ijms 22 02893 g003
Figure 4. Elevated TAK1 activity induces downstream pathways in Lpin2 knockout RAW-D cells. (A) IB analysis of WCLs and anti-Flag/anti-HA IPs derived from 293T cells transfected with the indicated expression plasmids. At 48 h after transfection, the cells were harvested for IP. (B) IB analysis of WCLs and anti-TAK1 IPs derived from RAW-D cells. Normal mouse IgG was used as control IP. (C) In-cell TAK1 ubiquitination assay. IB analysis of WCLs and anti-HA IPs derived from 293T cells transfected with the indicated expression plasmids. At 36 h after transfection, the cells were pretreated with 15 µM MG132 proteasome inhibitor for 12 h before harvesting. (D) IB analysis of WCLs derived from control (WT) and Lpin2 KO RAW-D cells treated with 200 ng/mL LPS. Cells were pretreated with DMSO or 1 µM 5Z-7-oxozeaenol TAK1 inhibitor as indicated for 1 h before LPS treatment. The cells were harvested for IB analysis at the indicated time points. For enhanced electrophoretic separation of phosphorylated TAK1 species, the WCLs were resolved by Phos-tag SDS-PAGE as indicated.
Ijms 22 02893 g004
Figure 5. Lipin2 deficiency promotes RANKL-mediated osteoclast formation in RAW-D cells. (A) Tartrate-resistant acid phosphatase (TRAP) staining of multinuclear cells (MNCs). Control (WT) and Lpin2 KO RAW-D cells were cultured in the presence of 50 ng/mL RANKL for 3 d and fixed for staining. Scale bar, 20 μm. Magnification, 50×. (B) TRAP-positive MNCs with ≥3 nuclei were counted for each group. Data are means ± SD (n = 3). * P < 0.05, Student’s t-test. (C) Quantification of osteoclastic (OC) resorption activity. Control and Lpin2 KO RAW-D cells were cultured in fluoresceinated calcium phosphate-coated plates in the presence of 100 ng/mL RANKL for 3 d. OC resorption activity was evaluated by measuring fluorescence intensity in conditioned medium. Data are means ± SD (n = 3). *** P < 0.001, Student’s t-test. (D) RT-PCR was performed to determine relative mRNA expression levels of the osteoclastic marker genes Ctsk and Acp5 in control and Lpin2 KO RAW-D cells treated with 50 ng/mL RANKL. The cells were harvested for RNA extraction at the indicated time points. Gapdh was used for normalization. Data are means ± SEM (n = 3). *** P < 0.001. One-way ANOVA followed by the multiple comparisons test.
Ijms 22 02893 g005
Figure 6. Lipin2 negatively regulates NFATc1 nuclear translocation in RAW-D cells. (A) IB analysis of WCLs derived from control (WT) and Lpin2 KO RAW-D cells treated with 50 ng/mL RANKL. The cells were harvested for IB analysis at the indicated time points. (B) IB analysis of WCLs derived from control and Lpin2 KO RAW-D cells treated with 50 ng/mL RANKL for 24 h. The cells were harvested for IB analysis at the indicated time points. For enhanced electrophoretic separation of phosphorylated NFATc1 species, the WCLs were resolved by Phos-tag SDS-PAGE as indicated. (C) IB analysis of WCL, cytoplasmic, and nuclear fractions derived from control (Ctrl) and Lpin2 KO RAW-D cells treated with 50 ng/mL RANKL for 24 h. Tubulin and Lamin B1 are shown as markers of cytoplasm and nucleus, respectively. (D) IB analysis of WCLs and anti-HA/anti-Flag IPs derived from 293T cells transfected with the indicated expression plasmids.
Ijms 22 02893 g006
Publisher’s Note: MDPI stays neutral with regard to jurisdictional claims in published maps and institutional affiliations.

