Article

High-Throughput Screening for CEBPD-Modulating Compounds in THP-1-Derived Reporter Macrophages Identifies Anti-Inflammatory HDAC and BET Inhibitors

1
Fraunhofer Institute for Translational Medicine and Pharmacology ITMP, Theodor-Stern-Kai 7, 60596 Frankfurt am Main, Germany
2
Fraunhofer Institute for Translational Medicine and Pharmacology ITMP, Schnackenburgallee 114, 22525 Hamburg, Germany
3
EpiEndo Pharmaceuticals ehf, Eiðistorg 13-15, 170 Seltjarnarnes, Iceland
*
Author to whom correspondence should be addressed.
Int. J. Mol. Sci. 2021, 22(6), 3022; https://0-doi-org.brum.beds.ac.uk/10.3390/ijms22063022
Submission received: 10 February 2021 / Revised: 7 March 2021 / Accepted: 11 March 2021 / Published: 16 March 2021

Abstract

:
This study aimed to identify alternative anti-inflammatory compounds that modulate the activity of a relevant transcription factor, CCAAT/enhancer binding protein delta (C/EBPδ). C/EBPδ is a master regulator of inflammatory responses in macrophages (Mϕ) and is mainly regulated at the level of CEBPD gene transcription initiation. To screen for CEBPD-modulating compounds, we generated a THP-1-derived reporter cell line stably expressing secreted alkaline phosphatase (SEAP) under control of the defined CEBPD promoter (CEBPD::SEAP). A high-throughput screening of LOPAC®1280 and ENZO®774 libraries on LPS- and IFN-γ-activated THP-1 reporter Mϕ identified four epigenetically active hits: two bromodomain and extraterminal domain (BET) inhibitors, I-BET151 and Ro 11-1464, as well as two histone deacetylase (HDAC) inhibitors, SAHA and TSA. All four hits markedly and reproducibly upregulated SEAP secretion and CEBPD::SEAP mRNA expression, confirming screening assay reliability. Whereas BET inhibitors also upregulated the mRNA expression of the endogenous CEBPD, HDAC inhibitors completely abolished it. All hits displayed anti-inflammatory activity through the suppression of IL-6 and CCL2 gene expression. However, I-BET151 and HDAC inhibitors simultaneously upregulated the mRNA expression of pro-inflammatory IL-1ß. The modulation of CEBPD gene expression shown in this study contributes to our understanding of inflammatory responses in Mϕ and may offer an approach to therapy for inflammation-driven disorders.

1. Introduction

Inflammation is a protective host response to pathogens and cell or tissue damage that maintains tissue homeostasis and enables the organism to survive during injury or infection. However, chronic inflammation can have negative effects in the context of inflammatory disorders. Inflammatory responses are mediated by multiple interactions between immune cells and regulated by molecular mediators and their corresponding signaling pathways. However, inflammation is believed to be regulated mainly at the level of gene transcription [1,2,3].
Human CCAAT/enhancer binding protein delta (CEBPD) gene encodes C/EBPδ transcription factor (TF), which belongs to a family of basic-leucine zipper (bZIP) domain TFs [4,5,6]. C/EBPδ functions as a key regulator of inflammatory responses [7,8], which can be activated by various stimuli, such as lipopolysaccharide (LPS) [9,10,11,12,13,14], interferon-gamma (IFN-γ) [9,14], other cytokines [4,9,13,14,15,16,17,18,19], glucocorticoids [20,21], or prostaglandins [22,23]. Inflammation-mediated C/EBPδ is expressed in multiple cell types, including macrophages (Mϕ) [10,24,25,26,27], where the regulatory activity of C/EBPδ has been studied the most.
Human CEBPD is a hub gene that integrates signal-dependent pathways in a cell type- and context-specific manner. Inflammation-induced C/EBPδ regulates or co-regulates a number of inflammatory genes encoding cytokines [10,28,29], chemokines [29], cyclooxygenase-2 (COX2) [28,30], inducible nitric oxide synthase (iNOS) [28], but also anti-inflammatory interleukin-10 (IL-10) [31]. Toll-like receptor 4 (TLR4)-stimulated C/EBPδ directly activates 63 LPS-induced genes in murine Mϕ, as identified by “chip-on-chip” analysis [10]. In LPS-activated murine Mϕ, C/EBPδ amplifies LPS signaling and is essential for the clearance of persistent bacterial infection [10]. Over 400 genes display significantly different (˃1.5-fold) mRNA expression detected by mRNA microarray analysis in tumor necrosis factor-alpha (TNF-α) treated C/EBPδ-deficient THP-1 cells [29]. Cytokine array analysis of the conditioning medium from C/EBPδ-overexpressing THP-1 cells revealed the up-regulated secretion of 25 cyto- and chemokines including IFN-γ, interleukin-1 beta (IL-1ß), and interleukin-6 (IL-6) [29].
Interestingly, C/EBPδ can also act in an anti-inflammatory manner [8,32]. It mediates by LPS or prostaglandin E2 (PGE2)-induced gene expression of anti-inflammatory IL-10 in mouse Mϕ [22,31]. In rat pancreatic ß-cells, C/EBPδ ameliorated apoptosis and attenuated IL-1ß and IFN-γ-induced production of chemokines by the promotion of interferon regulatory factor 1 (IRF-1) expression [33]. Activated C/EBPδ may prevent inflammatory responses in human pericytes [34] and protect against radiation-induced sepsis suppressing inflammation [35].
The structural and regulatory characteristics of CEBPD allow the monitoring of CEBPD promoter activity using a gene reporter (e.g., SEAP). The human CEBPD gene has a very simple gene structure containing a distinct promoter and a single exon [36]. Lacking introns, alternative promoters, and alternative polyadenylation sites [36], a single and highly instable CEBPD mRNA is produced (half-life of 35–40 min) [7,37]. Intronless CEBPD pre-mRNA is not processed by the splicing machinery and is translated to a single C/EBPδ protein with one known full-length functional C/EBPδ protein isoform [7,32]. Additionally, C/EBPδ protein displays a short biological half-life ranging between two and four hours in epithelial cells [37] and Mϕ [32]. C/EBPδ is predominantly a nuclear protein, it immediately translocates to the nucleus after protein synthesis and does not exist in an inactive form in cytoplasm [7,38].
C/EBPδ protein expression is largely regulated at the level of CEBPD gene transcription initiation [7]. To date, 92 TFs have been confirmed experimentally by chromatin immunoprecipitation sequencing (ChIP-Seq) to bind the human CEBPD promoter [39]. The proximal CEBPD promoter region, approximately 200 base pairs (bp) upstream from transcription start site (TSS), contains most of the characterized TF binding sites [7]. Among the most important TFs regulating C/EBPδ expression is cyclic adenosine monophosphate (cAMP) responsive element-binding protein (CREB) [40,41], specificity protein 1 (SP1) [16,42,43], and a signal transducer and activator of transcription 3 (STAT3) [16,43,44], but also nuclear factor-kappa B (NF-kB) [10,45] and activating transcription factor 3 (ATF3) [10]. However, less robust evidence exists for the position of NF-kB and ATF3 binding sites. Based on the alignment of the mouse cebpd and human CEBPD promoter sequences, we propose NF-kB and ATF3 TF binding sites for the human sequence (Supplementary Materials, Figure S1).
Considering its versatile function during inflammation, both the pharmacological activation and inhibition of CEBPD expression may result in a desired anti-inflammatory effect. However, only a few anti-inflammatory compounds, such as rosmanol [29] and inotilone [29], are known to modulate CEBPD gene expression. Here, we describe the development and application of a phenotypic assay to identify CEBPD-modulating compounds in LPS- and IFN-γ-activated THP-1-derived Mϕ.
The high-throughput screening (HTS) of LOPAC®1280 and ENZO®774 libraries, containing 2054 compounds in total, identified four hits that showed a pronounced effect on CEBPD transcription activity. The identified hits, two bromodomain and extraterminal domain (BET) inhibitors and two histone deacetylase (HDAC) inhibitors, displayed significant anti-inflammatory effects, downregulating IL-6 and CC-chemokine ligand 2 (CCL2) expression, but differentially affected the mRNA expression of endogenous CEBPD and IL-1ß. In this study, we report that the CEBPD-modulating compounds act as anti-inflammatory agents, as shown in LPS- and IFN-γ-activated THP-1-derived Mϕ, and may, therefore, be considered as potential drug candidates for the treatment of inflammation-driven disorders.

2. Results

2.1. Screening Assay Development

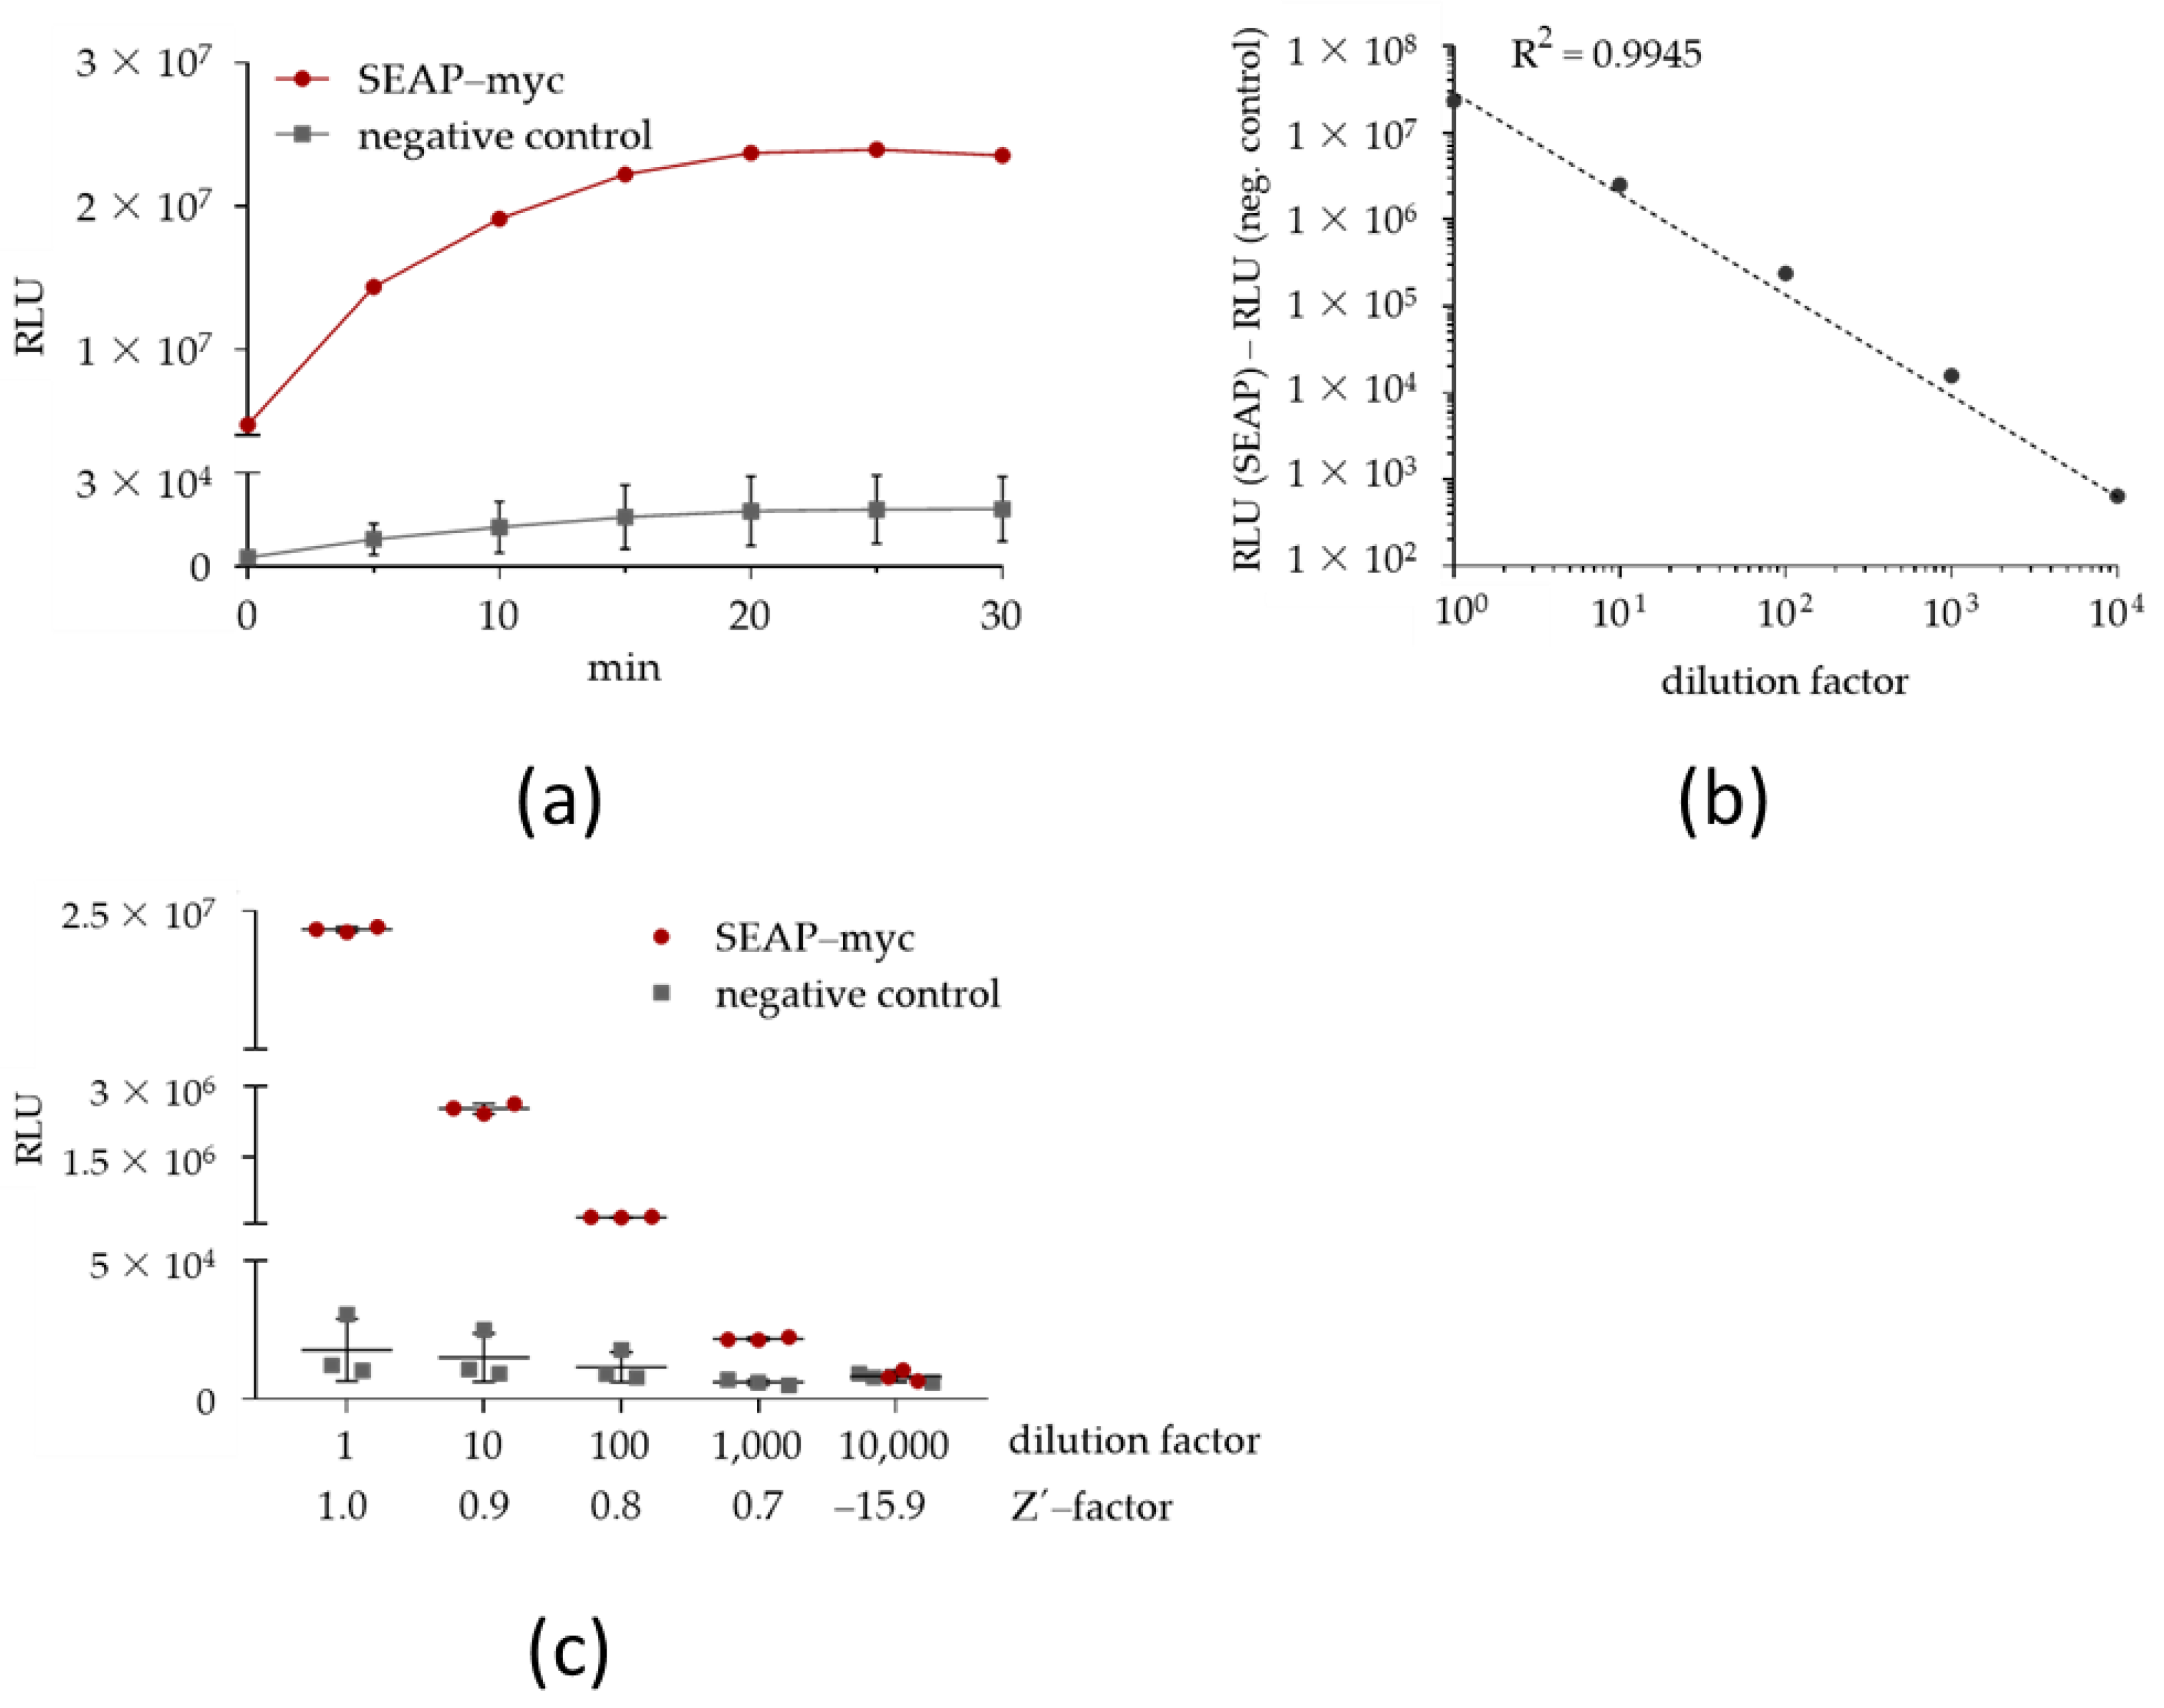
2.1.1. Characterization of the Chemiluminescent SEAP Assay

Secreted alkaline phosphatase (SEAP) is a well-established gene reporter, secreted levels in the conditioned medium of which are proportional to the changes in its intracellular mRNA, protein levels, and cell number [46,47]. SEAP displays a high protein stability with a half-life of over 20 days [48] leading to its accumulation in the cell culture supernatant upon promoter activation and its subsequent expression. It is easy to distinguish the protein from endogenous phosphatases, as SEAP is resistant to inhibition by L-homoarginine and shows high heat tolerance [46,49]. These propensities of the SEAP reporter allow its monitoring for rather long exposure times, which is advantageous, particularly when the time point of reporter activation is unclear. Additionally, weak reporter activation can also be detected, because SEAP reporter and, therefore, the SEAP enzymatic signal accumulates in the supernatants.
First, we generated two HEK293T reporter cell lines by stable vector transfection to characterize the chemiluminescent SEAP assay that we used subsequently as the readout assay. While the CMV::SEAP HEK293T reporter cells stably expressed myc-tagged SEAP (SEAP-myc) under control of the strong constitutive cytomegalovirus (CMV) promoter, the negative control HEK293T reporter cells stably expressed the empty vector backbone without the SEAP gene.
As expected, the SEAP reporter was detectable as enzymatic activity in cellular supernatants of established HEK293T reporter cells (Figure 1a). SEAP assay linearity, sensitivity, and variability were estimated in undiluted and serially-diluted cellular supernatants of HEK293T reporter cells (Figure 1b,c; Table 1). The chemiluminescent SEAP assay was linear (R2 = 0.99) over four 10-fold dilutions (1 to 10,000) (Figure 1b), demonstrated a broad dynamic range, and displayed a high assay sensitivity, as indicated by a Z’-factor of 0.7 for the 1000-fold diluted sample (Figure 1c). The Z’-factor is a statistical criterion that takes into account means and signal deviations indicating a clear difference between a positive (SEAP) and a negative (background) signal [50]. An optimal Z´-factor is typically set at ≥ 0.5.
Assay variability is expressed by the coefficient of variation (CV) [51]. The intra-assay CV indicates the variability of signal values between multiple technical replicates of the same sample. The SEAP assay displayed a low intra-assay CV (<10%) for up to 1000-fold diluted samples (Table 1). Assay reproducibility is expressed by the inter-assay CV that indicates the variability of signal values of samples that belong to different individual experiments (biological replicates). The chemiluminescent SEAP assay displayed a low inter-assay CV (< 5%) for up to 1000-fold diluted samples and thus a high assay reproducibility. From these experiments, we concluded that SEAP in combination with the chemiluminescent assay provides a suitable reporter system for the screening of CEBPD-modulating compounds.

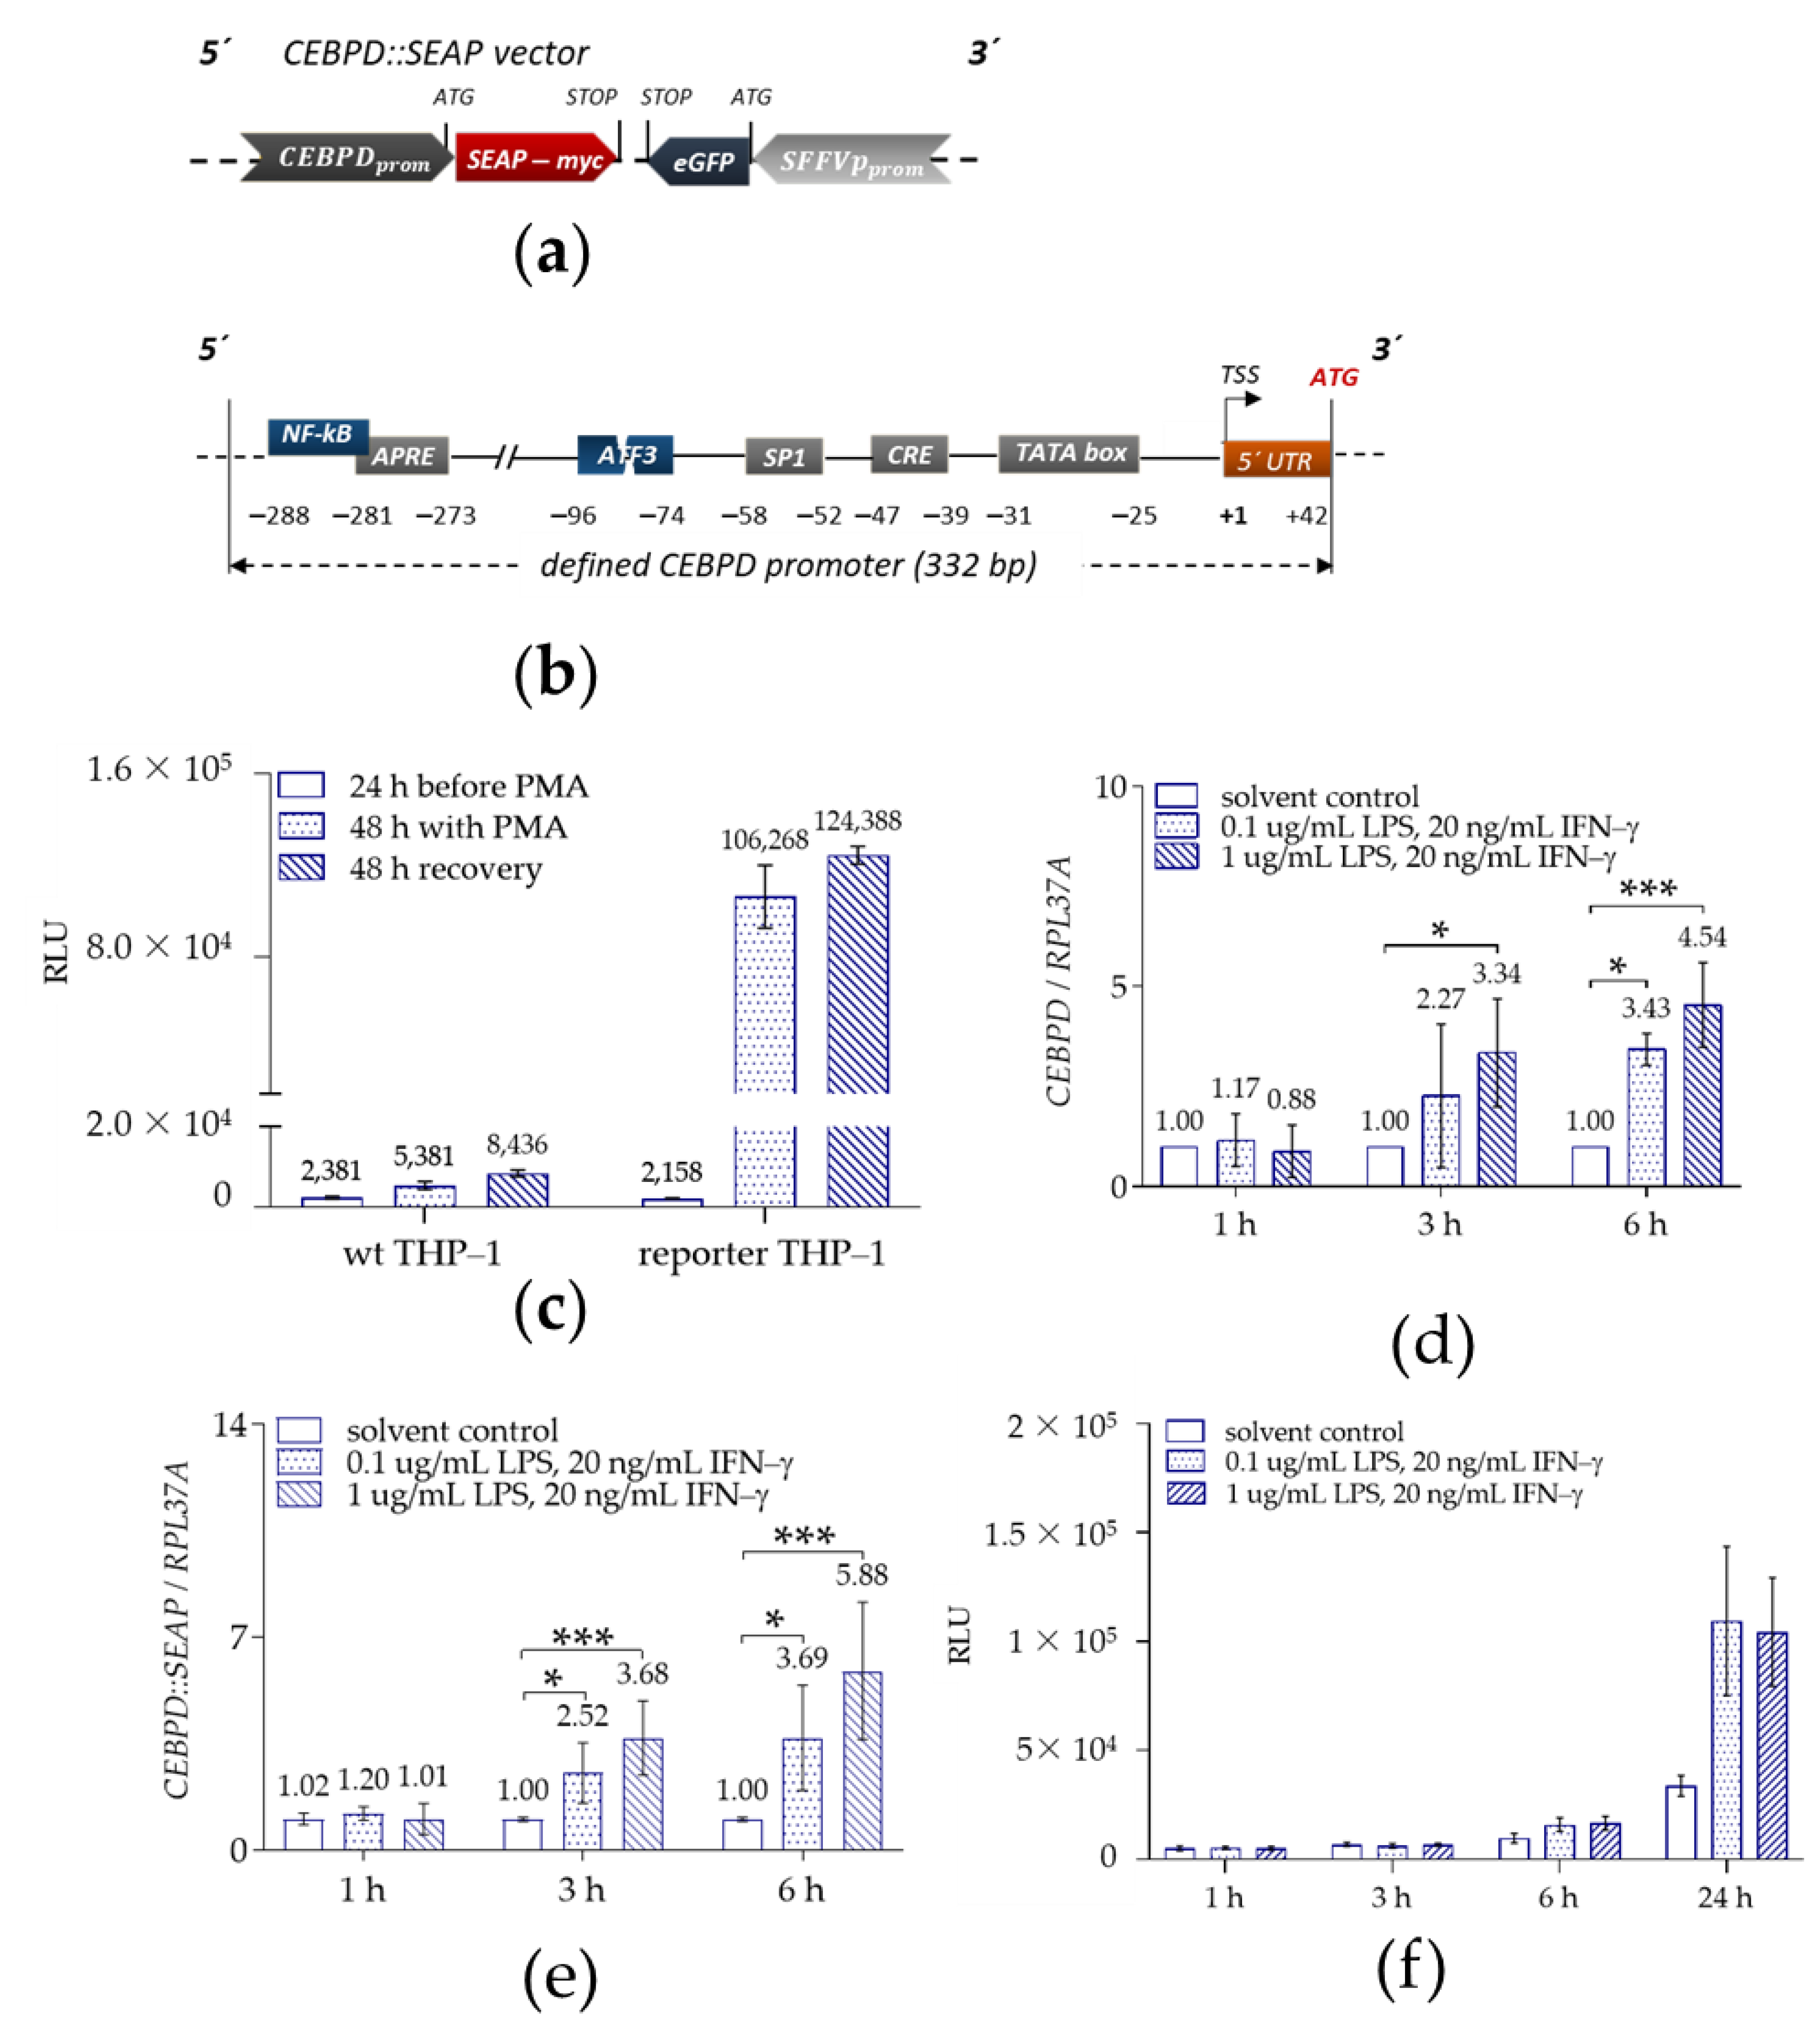
2.1.2. Validation of THP-1-Derived Mϕ Reporter Cell Line

In this study, phorbol 12-myristate 13-acetate (PMA) differentiated and inflammatory-activated THP-1-derived reporter Mϕ constituted the cellular system for the screening of CEBPD-modulating compounds.
Therefore, we generated THP-1 reporter cells by viral transduction of wild type THP-1 cells using viral particles containing the CEBPD::SEAP vector, in which the SEAP reporter gene was placed under the control of the defined CEBPD promoter (Figure 2a). The generated CEBPD::SEAP vector incorporated the proximal promoter region (approximately 330 bp upstream from TSS) containing the already known (SP1, CREB, and APRE) and proposed (NF-kB and ATF3) binding sites of regulatory TFs (Figure 2b). Upon generation, we tested the THP-1 reporter cells for their ability to differentiate into Mϕ. Like wild-type THP-1 cells, THP-1 reporter monocyte-like cells in suspension differentiated into adherent THP-1-derived reporter Mϕ in response to 50 ng/mL PMA treatment for 48 h (Supplementary Materials, Figure S2).
We then tested the effect of PMA on SEAP secretion into cellular supernatants of the THP-1 reporter cells, collected before, during, and after PMA treatment. As expected, SEAP enzymatic activity was at background levels in cellular supernatants of undifferentiated THP-1 reporter cells (Figure 2c, 24 h before PMA addition), since CEBPD gene displays low basal expression in monocytes [41]. PMA-activated CEBPD promoter activity and consequently SEAP secretion were detected in cellular supernatants of THP-1 reporter cells collected during (48 h with PMA) and after (48 h recovery) PMA treatment (Figure 2c).
We aimed to perform a HTS for CEBPD-modulating compounds in the cellular context of inflammation. Therefore, we activated non-polarized PMA-differentiated THP-1 reporter Mϕ (M0) to a pro-inflammatory M1 phenotype state with LPS- and IFN-γ to evaluate the inflammation-induced CEBPD gene expression. Treatment with 20 ng/mL IFN-γ and 0.1 or 1 μg/mL LPS significantly activated the mRNA expression of endogenous CEBPD up to 4.5-fold, 6 h after treatment (Figure 2d).
As a last step, we tested whether the CEBPD::SEAP construct is able to adequately report the endogenous CEBPD mRNA expression. In fact, we found that the SEAP reporter mRNA expression under the control of the CEBPD::SEAP construct closely mirrored the mRNA expression of the endogenous CEBPD with even similar fold changes at 3 and 6 h after treatment (Figure 2e). In the supernatant, however, activation of the CEBPD::SEAP reporter, due to the additional protein translation, transport and secretion, showed a lag in detecting the response. As a consequence, the most prominent reporter signal was measured 24 h post-treatment (Figure 2f). In total, these observations suggested that the generated THP-1 reporter cell line was appropriate for the intended screening assay, as the cell line still possessed its differentiation and polarization capabilities, compared to the wild type THP-1 cells and the SEAP reporter activation matched the activation of CEBPD.

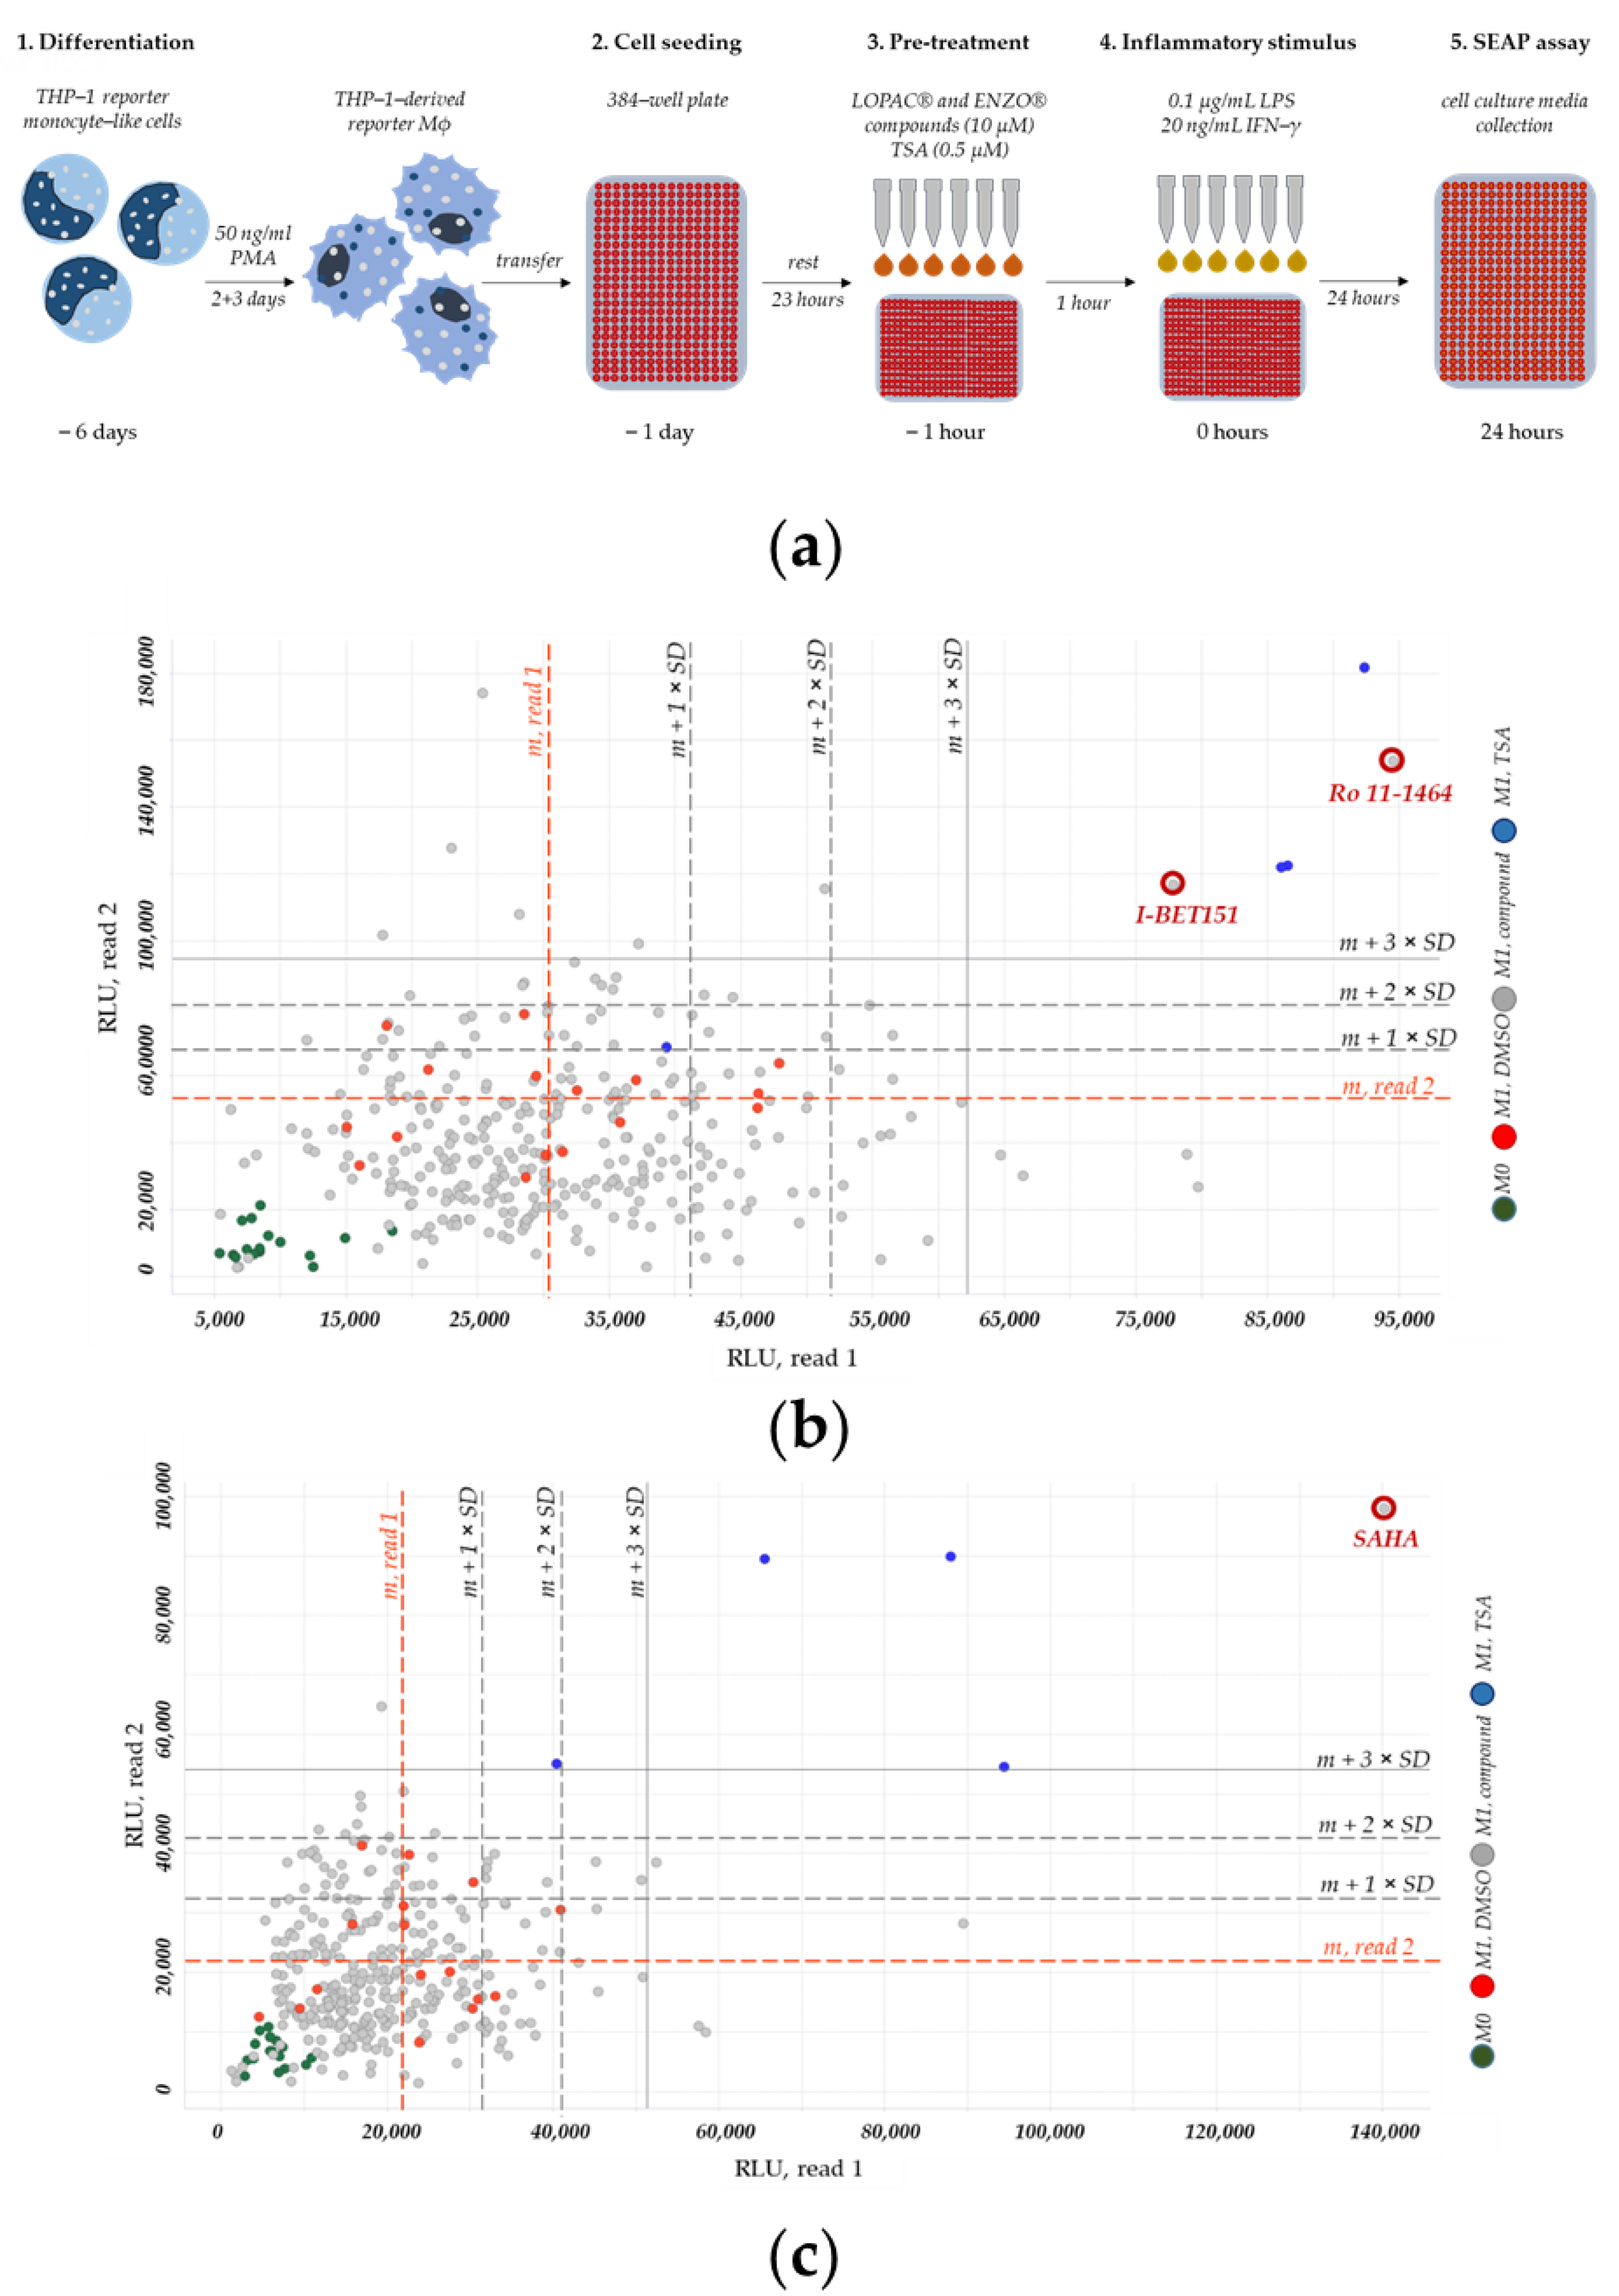
2.2. A High-Throughput Screening for CEBPD-Modulationg Compounds

We specified the final screening protocol with regard to the semi-automatic screening performance (Figure 3a). In total, we screened 2054 compounds, 1280 from the list of pharmacological active compounds (LOPAC®) and 774 from the ENZO® (Screen-Well® FDA approved drug library V2) libraries.
The HTS for CEBPD-modulating compounds included seven 384-well plates: four with LOPAC® and three with ENZO® screening compounds. Here, we show one plate containing hit compounds from the LOPAC® (Figure 3b) and one plate containing hit compounds from the ENZO® (Figure 3c) libraries. The primary screening data for all plates from LOPAC® and ENZO® libraries are summarized in supplementary Tables S1 and S2, respectively.
Each screening plate contained PMA-differentiated, THP-1 reporter Mϕ under the following conditions: M0 controls (non-polarized, non-treated), M1 solvent controls (M1-polarized, DMSO-treated), M1 trichostatin A (TSA) controls (M1-polarized, TSA-treated), and the M1 cells treated with the compounds (M1-polarized, compound-treated).
We performed the primary screening twice (read 1 and read 2). For each screening plate, we displayed enzymatic SEAP signals from read 1 (x-axis) in correlation to corresponding signals from read 2 (y-axis) (example shown in Figure 3b,c). As already seen during screening development, M1 solvent control (Figure 3b,c; red dots) produced elevated SEAP signals relative to the M0 control background signal (Figure 3b,c; green dots), whereas the M1 TSA control (Figure 3b,c; blue dots) produced the highest SEAP signals. These effects were observed on each screening plate, as representatively shown in Figure 3b,c.
To identify hit compounds, we characterized each compound-caused SEAP signal (representatively shown in Figure 3b,c; gray dots) according to its difference to an average signal of the corresponding M1 solvent control (representatively shown in Figure 3b,c; red lines). We calculated the means (m) and standard deviations (SD) of SEAP signals from M1 solvent control for each read and plate. After, we added up to three-fold SDs to the corresponding average signals of M1 solvent control (Figure 3b,c; black lines), for each read and plate. A compound, for which the SEAP signal was clearly different (>3 SDs) from the average SEAP signal of the corresponding M1 solvent control in both reads, we considered as a hit. Here, we identified three hit compounds: I-BET151, Ro 11-1464, and suberoylanilide hydroxamic acid (SAHA).
I-BET151 and Ro 11-1464 are members of the family of BET inhibitors, while SAHA is an HDAC inhibitor [52]. We also included TSA in the hit compound list, as it reproducibly activated SEAP secretion and is also an epigenetically active HDAC inhibitor [53].
As both LOPAC® and ENZO® libraries also contain well-characterized cytotoxic compounds, we performed a cell viability test (CellTiter-Glo® Assay) during read 2. Notably, cells treated with compounds such as lasofoxifene tartrate, sanguinarine chloride, auranofin, or mitoxantrone hydrochloride exhibited decreased cell viability as well as decreased SEAP activity, pointing out cell viability as a confounding factor of the assay (Supplementary Materials, Tables S1 and S2). We repeated the cell viability test for the four identified hits, I-BET151, Ro 11-1464, SAHA, and TSA, and confirmed that the increase in SEAP activity was not associated with an increase in cell viability or proliferation (Supplementary Materials, Figure S3). On the contrary, I-BET151 and TSA even reduced cell viability, but by far not as much as lasofoxifene tartrate, sanguinarine chloride, auranofin, or mitoxantrone hydrochloride.
In the HTS, we observed that the correlation of the signals from read 1 and 2 was rather weak, negatively affecting assay robustness and sensitivity. Exemplarily calculated CV (range: 27.7 to 48.9%) for the M0 and M1 DMSO control of the two plates and the corresponding Z´-factor (−0.4; −1.3) demonstrated the limitations of the assay to identify inhibitory compounds (Figure 3b,c). We, therefore, restricted the hit selection to compounds which displayed a prominent activatory effect in both reads, taking into account that further potential CEBPD-modulating compounds would be missed by that selection.

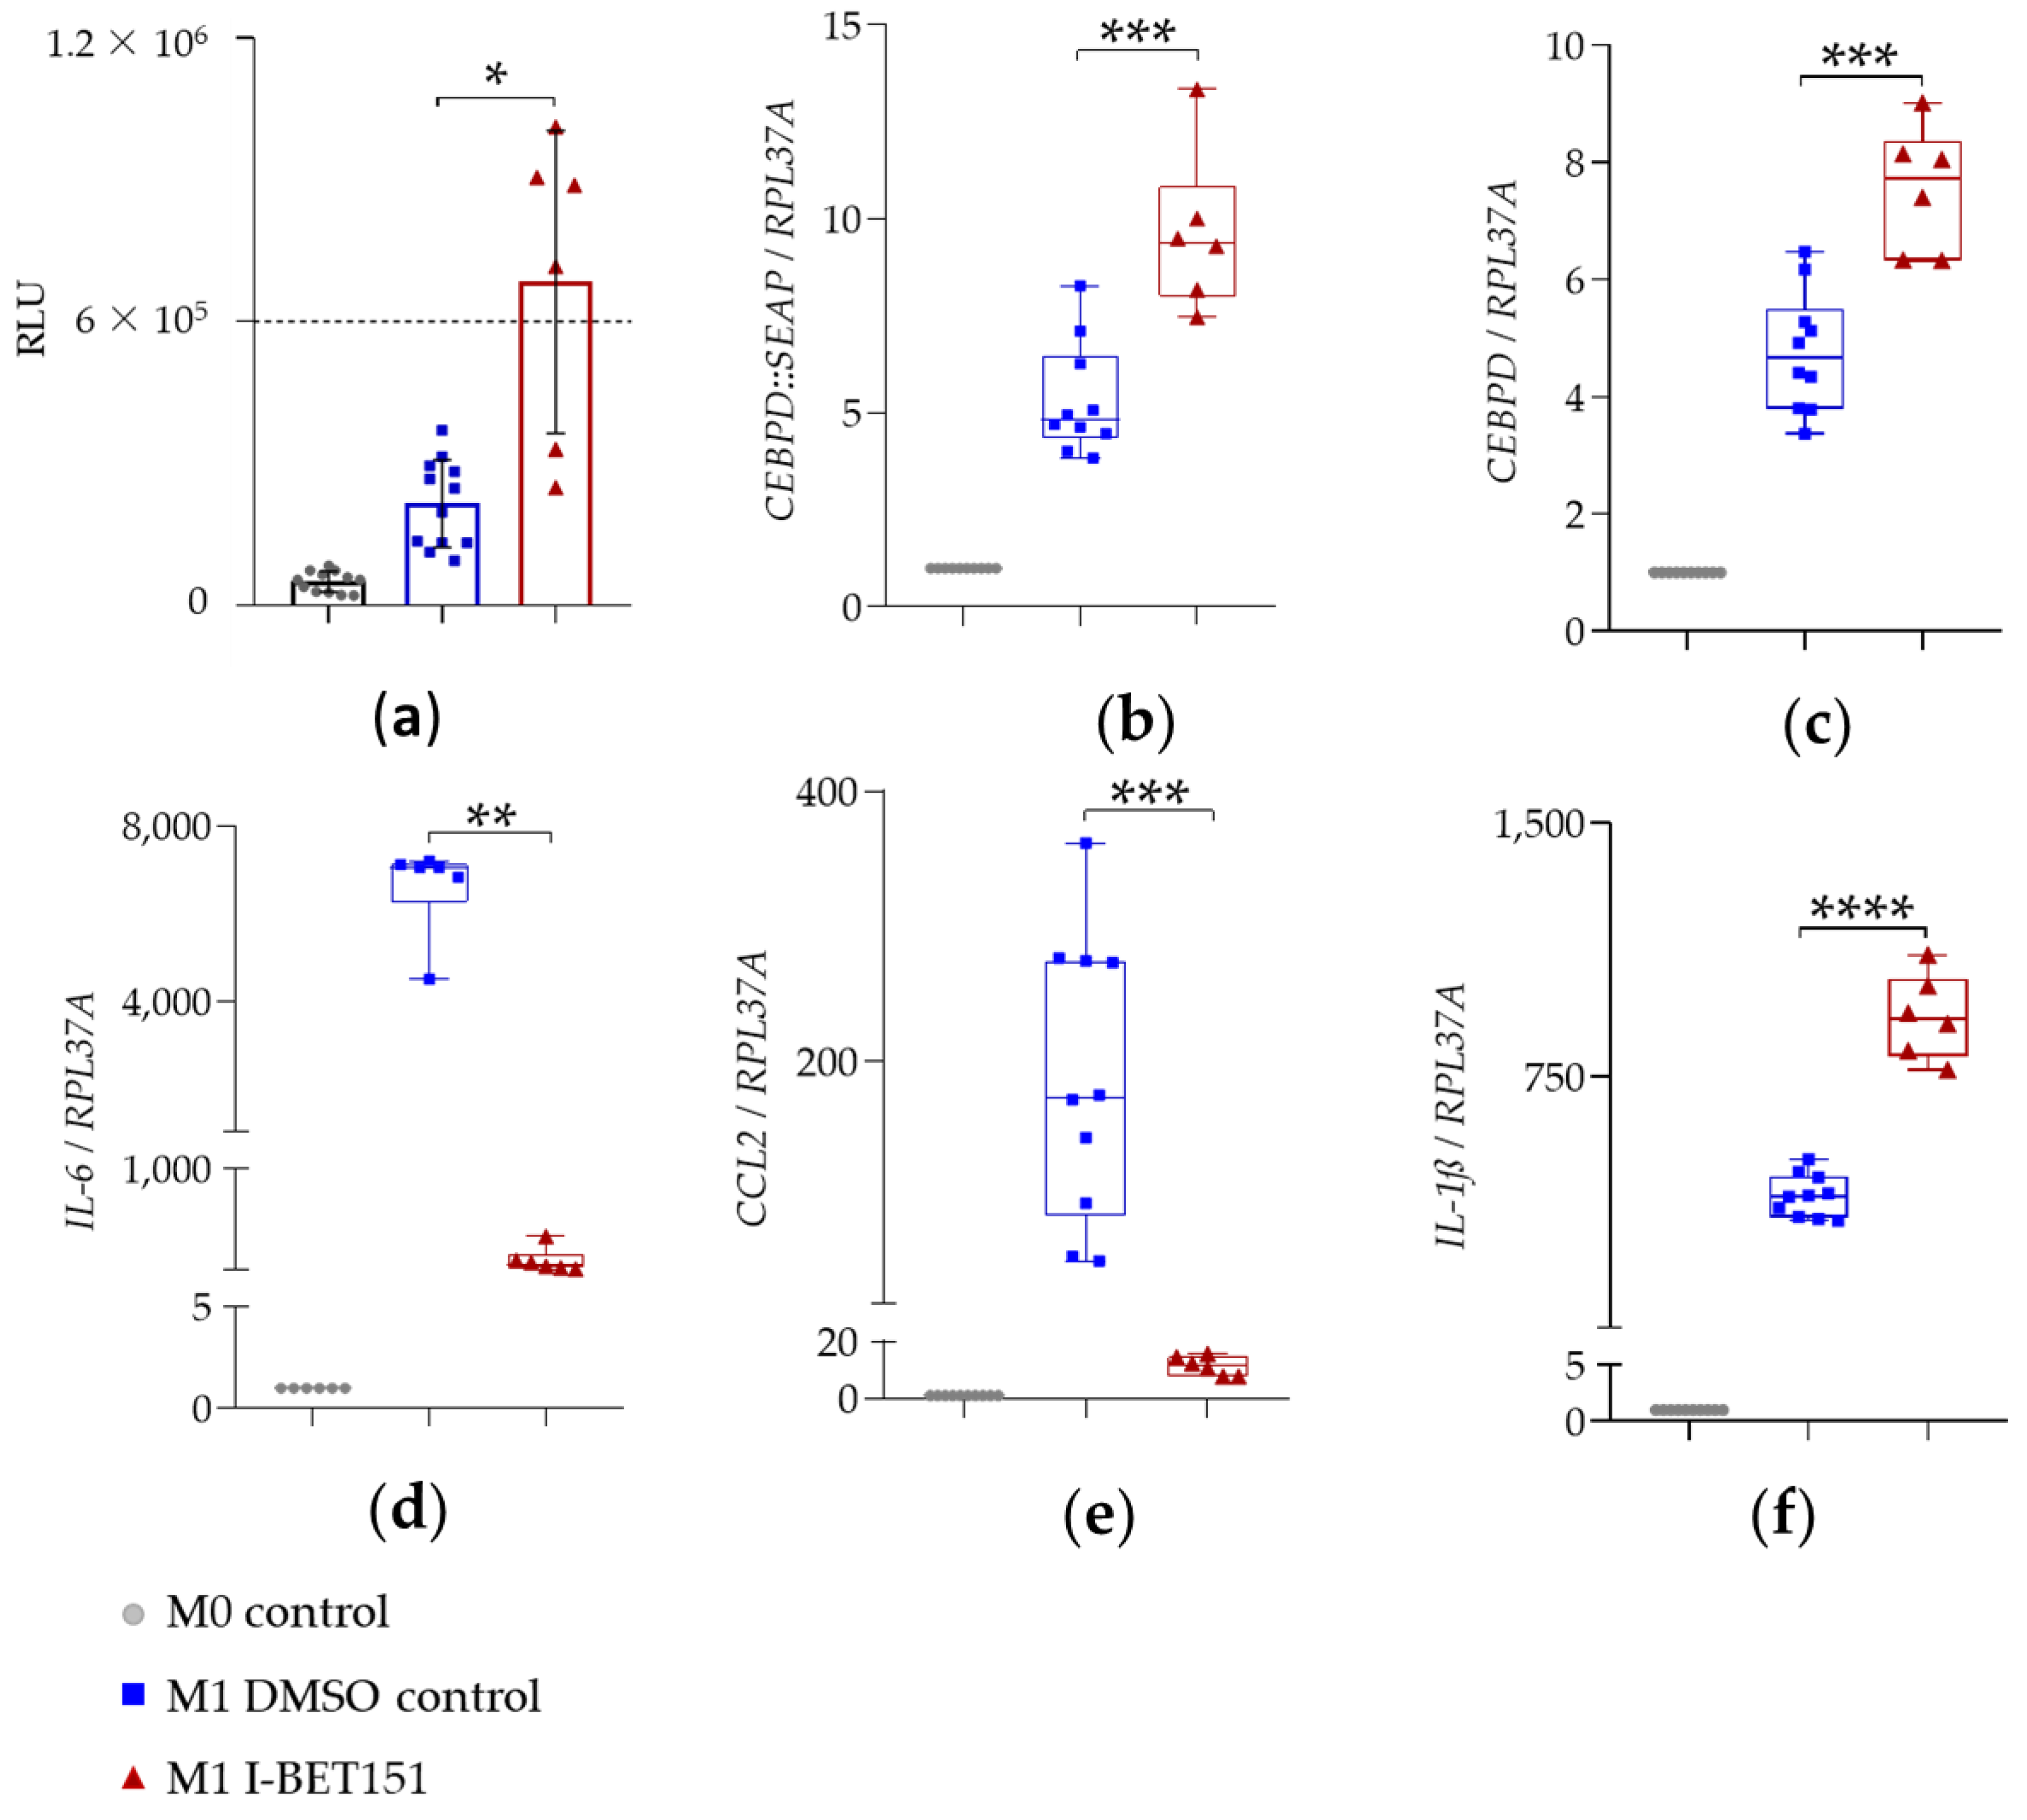
2.3. Analysis of Hit Compound Effects on Gene Expression

Following HTS, we analyzed the identified hits according to their ability to modulate the mRNA expression of CEBPD and other inflammation-related genes. We observed compound-mediated changes in the mRNA expression of endogenous CEBPD, reporter CEBPD::SEAP, IL-6, IL-1ß, and CCL2.
Elevated SEAP secretion in cellular supernatants of LPS- and IFN-γ-stimulated THP-1 reporter cells indicated the corresponding upregulation of CEBPD::SEAP mRNA expression (Figure 4a; Figure 5a; Figure 6a; blue squares). The expression of reporter CEBPD::SEAP and endogenous CEBPD mRNA was similar and displayed a significant 5 to 6-fold activation (Table 2, Table 3 and Table 4) in response to the LPS + IFN-γ treatment (Figure 4b,c; Figure 5b,c; Figure 6b,c; blue squares). The expression of IL-6, IL-1ß, and CCL2 pro-inflammatory genes was also significantly activated in response to treatment with LPS- and IFN-γ, relative to the M0 control (Figure 4d–f; Figure 5d–f; Figure 6d–f; blue squares). The sustained upregulation of these pro-inflammatory genes demonstrated the expected M1 polarization of THP-1 reporter Mϕ.

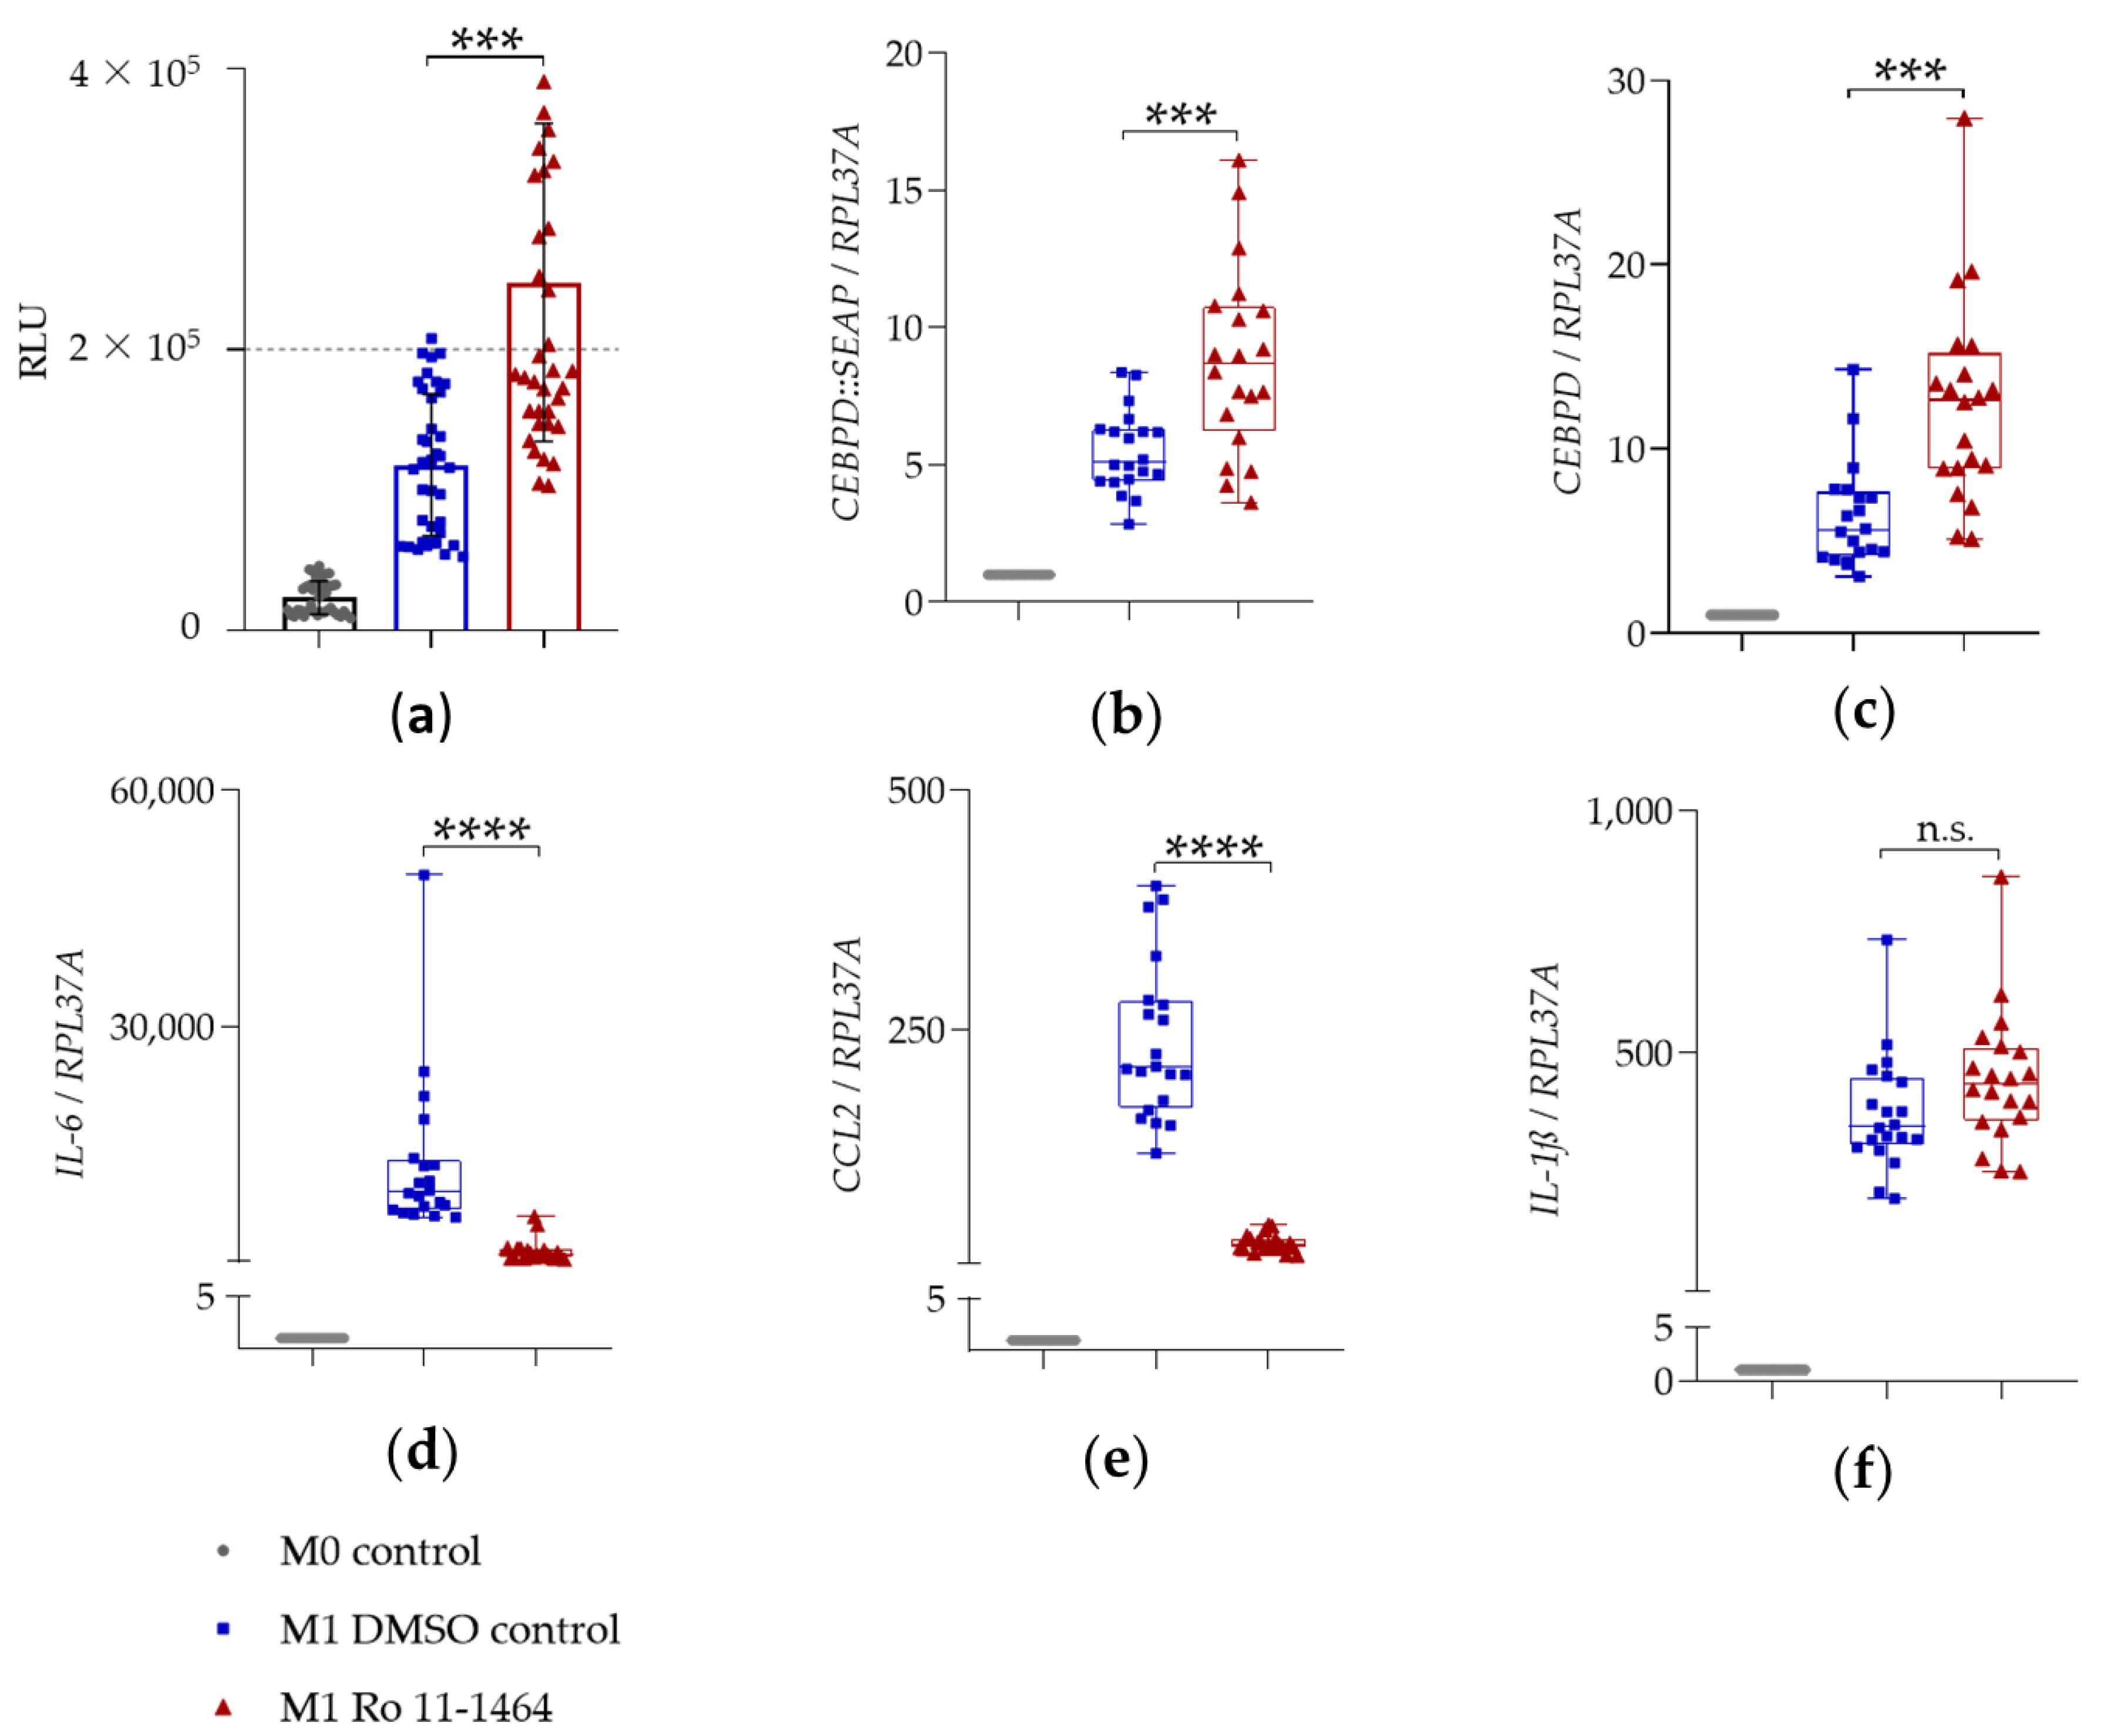
2.3.1. BET Inhibitors I-BET151 and Ro 11-1464

I-BET151 and Ro 11-1464 displayed similar effects on the expression of selected genes in THP-1 reporter cells. Thus, I-BET151 and Ro 11-1464 significantly upregulated the mRNA expression of reporter CEBPD::SEAP (Figure 4b or Figure 5b; red triangles) and of endogenous CEBPD (Figure 4c; Figure 5c; red triangles) genes, relative to the M1 DMSO control. BET inhibitors displayed anti-inflammatory activity as the significant suppression of IL-6 (Figure 4d; Figure 5d; red triangles) and CCL2 (Figure 4e; Figure 5e; red triangles) mRNA expression, 4 h after LPS + IFN-γ treatment. Thus, I-BET151 significantly suppressed mRNA expression over 65-fold for IL-6 and over 15-fold for CCL2 (Table 2). Ro 11-1464 caused approximately 9-fold suppression in the mRNA expression of IL-6 and CCL2 (Table 3). Whereas Ro 11-1464 showed no effect on IL-1ß mRNA expression (Figure 5f; red triangles), this was more than doubled (Table 2) by I-BET151, indicating a pro-inflammatory action at the same time point (Figure 4f; red triangles).

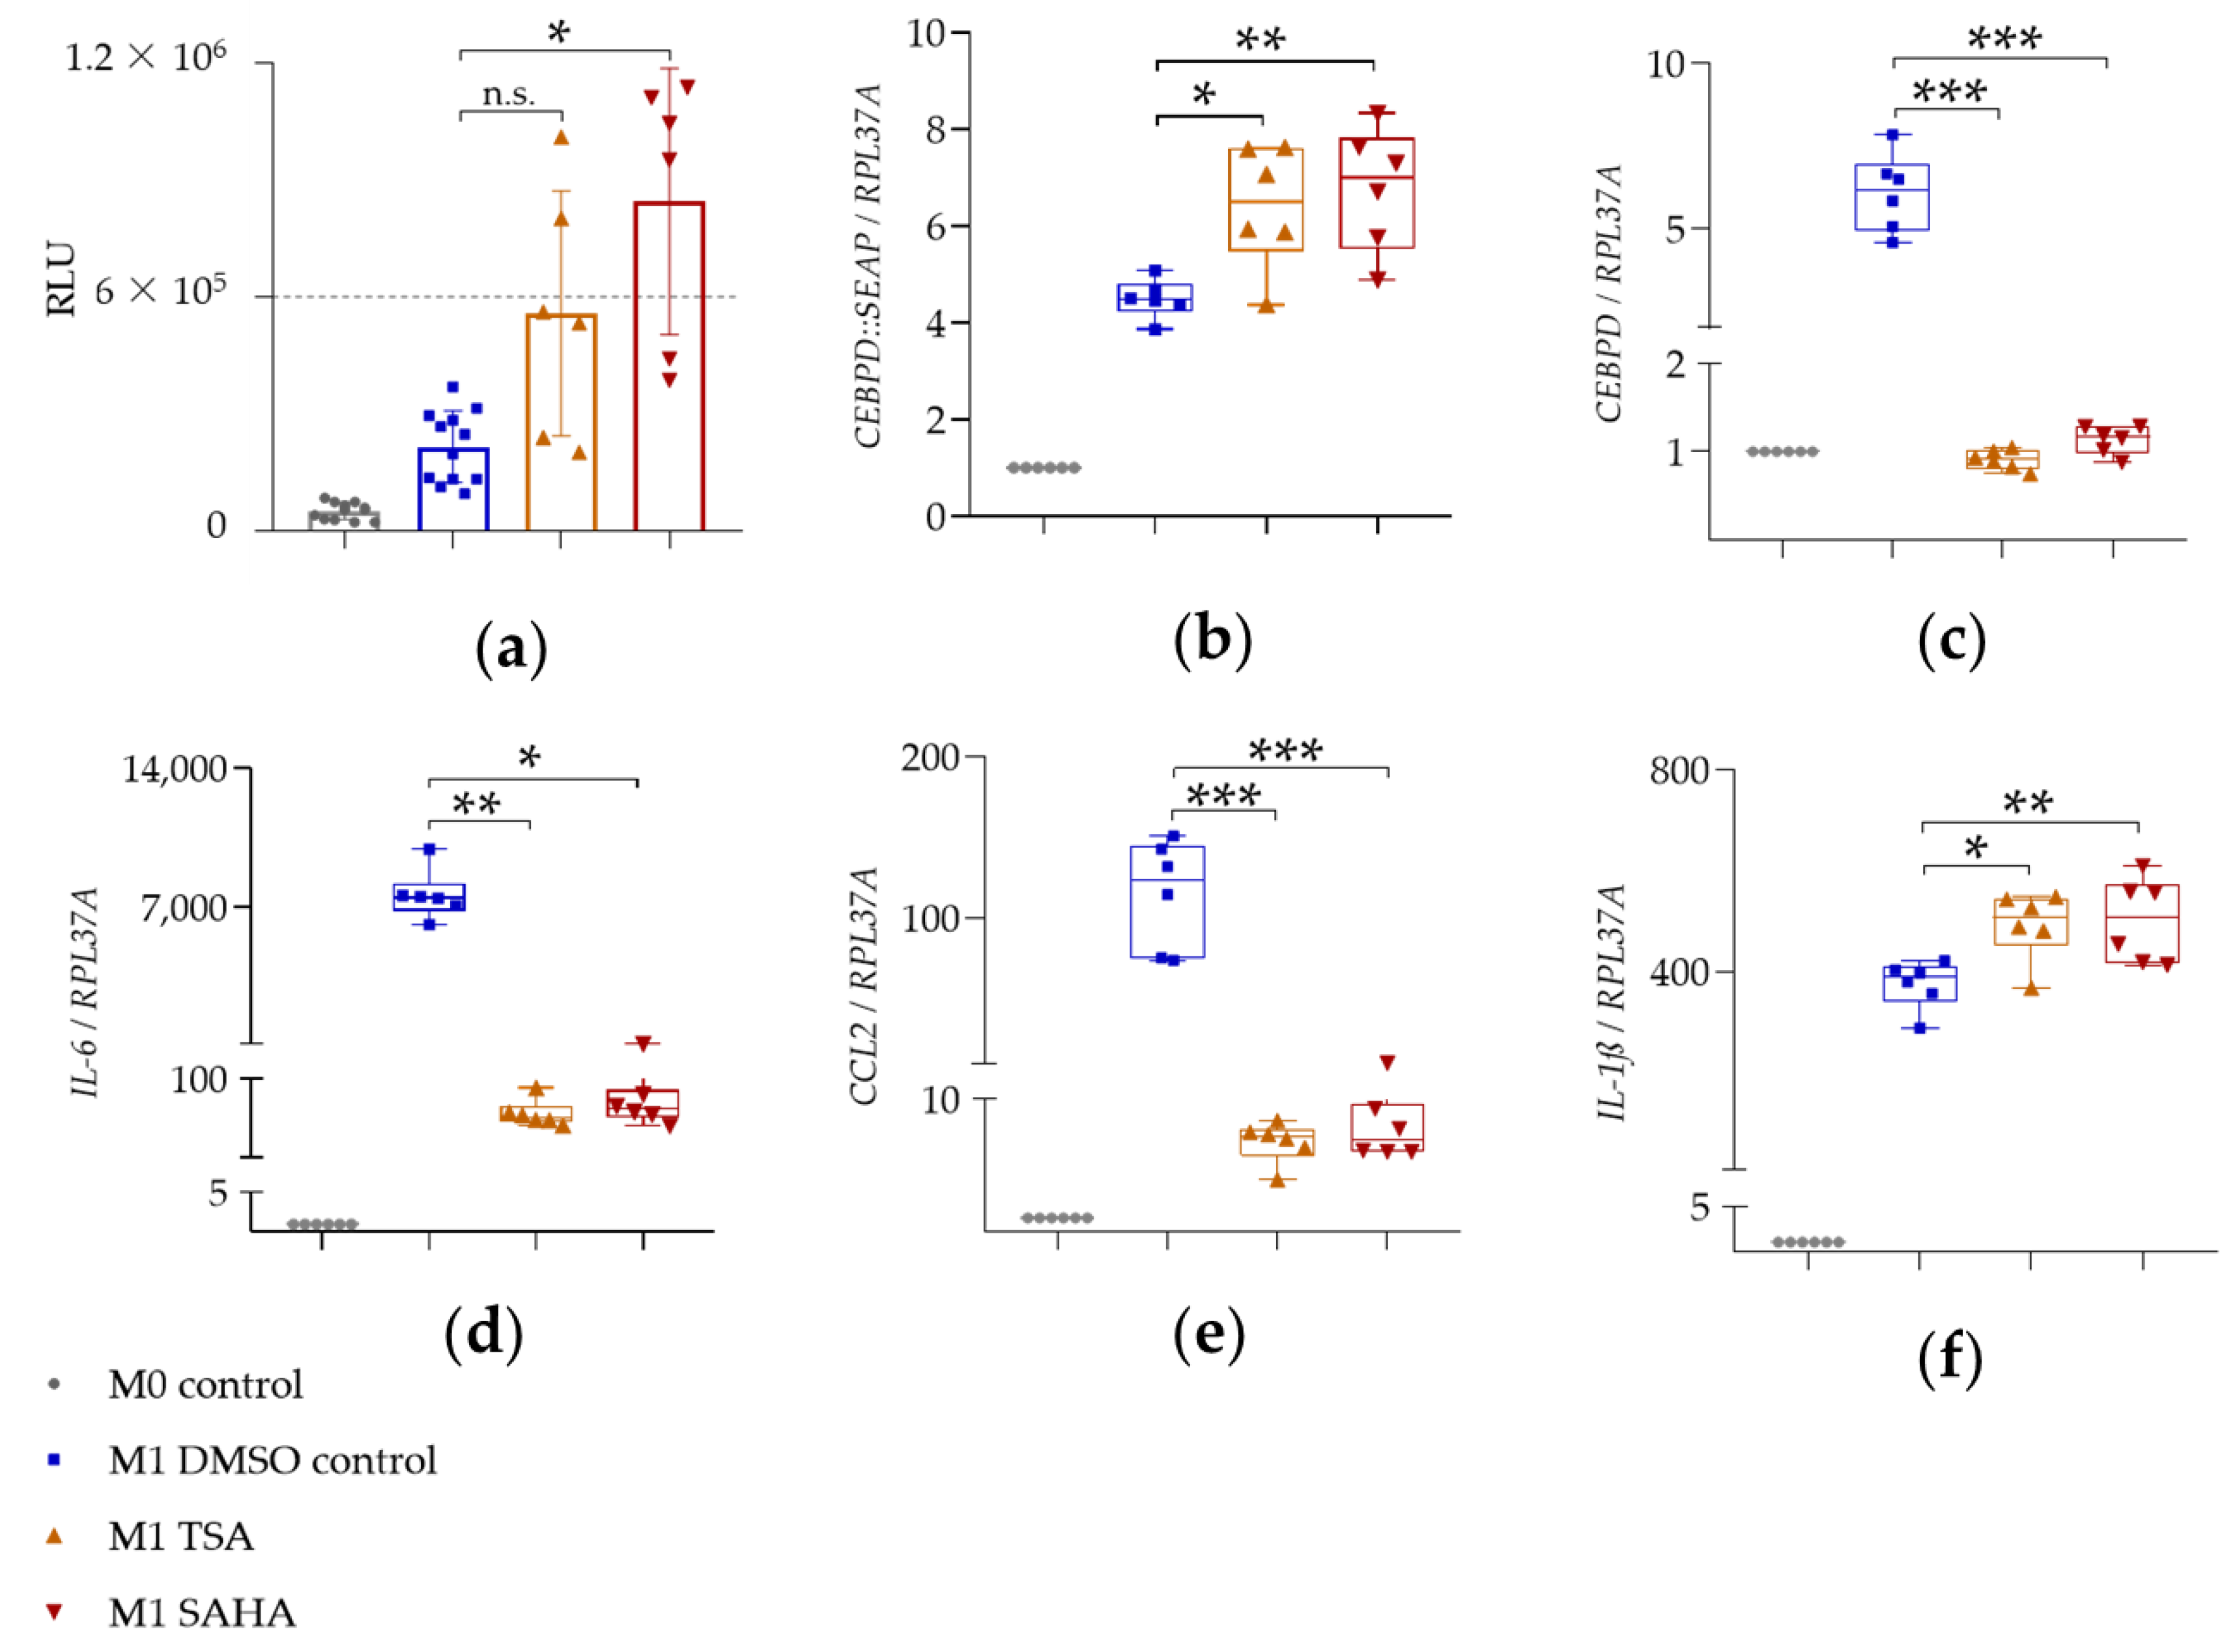
2.3.2. HDAC Inhibitors SAHA and TSA

SAHA and TSA displayed similar effects on the mRNA expression of selected genes. Surprisingly, the two HDAC inhibitors showed opposite effects on the mRNA expression of reporter CEBPD::SEAP and endogenous CEBPD genes. Whereas the mRNA expression of reporter CEBPD::SEAP displayed a significant increase (Figure 6b; red and orange triangles), that of endogenous CEBPD was completely abolished (Figure 6c; red and orange triangles) by TSA and SAHA, 4 h after LPS + IFN-γ treatment. HDAC inhibitors also significantly reduced the gene expression of IL-6 (Figure 6d; red and orange triangles) and CCL2 (Figure 6e; red and orange triangles) relative to the M1 DMSO control. Thus, SAHA reduced the mRNA expression of IL-6 over 110-fold and that of CCL2 over 15-fold (Table 4). HDAC inhibitor TSA suppressed the mRNA expression of IL-6 over 130-fold and that of CCL2 over 17-fold (Table 4). Interestingly, as observed for I-BET151, the mRNA expression of IL-1ß was slightly but significantly upregulated by the two HDAC inhibitors, 4 h after LPS + IFN-γ treatment (Figure 6f; red and orange triangles).

3. Discussion

3.1. Hit Compounds Modulate Gene Expression in THP-1-Derived Reporter Mϕ

Chronic inflammation is usually a debilitating condition, as in disorders such as osteoarthritis [54,55], multiple sclerosis [56,57], rheumatoid arthritis [58], and atherosclerosis [59,60]. Routine anti-inflammatory therapy includes the use of steroids, immunosuppressant drugs, and non-steroidal anti-inflammatory drugs (NSAID) [61], which, however, also have pronounced adverse effects [62,63]. Alternative anti-inflammatory agents may act by affecting transcription factor activity, as inflammatory responses are thought to be regulated mainly at the level of gene transcription [1,2,3].
In this study, we used the in vitro-differentiated and LPS + IFN-γ-activated THP-1 Mϕ reporter cell line to screen for CEBPD expression-modulating compounds. CEBPD encodes the C/EBPδ TF, functioning as a key regulator of inflammatory gene transcription in Mϕ [8,9,10]. We identified I-BET151, Ro 11-1464, SAHA, and TSA as showing prominent and reproducible effects on the SEAP reporter, in terms of its mRNA expression, as well as its secretion into the cell supernatant, the primary readout of the reporter assay. However, subsequent gene expression analysis of the endogenous CEBPD revealed that BET inhibitors I-BET151 and Ro 11-1464, as expected, upregulated CEBPD expression, whereas HDAC inhibitors SAHA and TSA, in contrast, downregulated CEBPD expression to the baseline level.
Compounds of both inhibitor classes display epigenetic activity by the direct regulation of gene transcription [64]. Opposite effects of hits on the mRNA expression of the endogenous CEBPD and reporter CEBPD::SEAP were, therefore, highly unexpected. As a possible explanation, HDAC inhibitors may, coincidently, show an activatory cis- and a stronger inhibitory trans-effect on the CEBPD promoter. The activatory cis-effect may result in the upregulated gene expression of both endogenous CEBPD and reporter CEBPD::SEAP. The domination of the inhibitory trans-effect over the cis-activation may, however, require distal CEBPD promoter regions, which are absent in the gene reporter setting of CEBPD::SEAP, as only the proximal 332 bp promoter region was used (Figure 2b). BET inhibitors may exclusively control the activatory cis-mechanisms.
On the other hand, BET inhibitors may activate CREB-, SP1-, and STAT3-related signaling pathways, resulting in the elevated gene expression of the endogenous CEBPD and reporter CEBPD::SEAP, as the defined CEBPD promoter contains only the most proximal and well-known TF binding sites. HDAC inhibitors may inhibit the mRNA transcription of the endogenous CEBPD through the activation of the ATF3 TF binding site, which is crucial for CEBPD gene transcription inhibition in Mϕ [10]. As the defined CEBPD promoter may contain a disrupted and, therefore, non-functional ATF3 binding site (Supplementary Materials, Figure S1), the mRNA expression of reporter CEBPD::SEAP could not be inhibited by HDAC inhibitors.

3.1.1. BET Inhibitor I-BET151

I-BET151 (alternative names GSK 1210151, GSK-151, and iBET-151) is a potent BET inhibitor that selectively inhibits bromodomains (BRD), BRD2, BRD3, and BRD4, displaying a very strong binding mode (pIC50 6.1–6.6 [65]), and acts as a potent apolipoprotein A-I (apoA-I) activator [66]. I-BET151 is known to act as an anti-inflammatory agent through the regulation of pro-inflammatory cytokine production in LPS-treated peripheral blood mononuclear cells (PBMCs) [66,67] and RAW264.7 cells [68], as well as by the transcription control of inflammation-linked genes in rheumatoid-associated synovial fibroblasts (RASF) [69] and gingival fibroblasts (GF) [70].
This study is the first report on the ability of I-BET151 to regulate the mRNA expression of CEBPD in general and that of IL-6, IL-1ß, and CCL2 in THP-1 Mϕ. I-BET151 significantly suppressed the mRNA expression of IL-6 and CCL2, but upregulated that of IL-1ß, demonstrating simultaneous anti- and pro-inflammatory effects in LPS + IFN-γ-stimulated THP-1 reporter Mϕ.
The anti-inflammatory activity of I-BET151 is consistent with published data, as it inhibits the basal, TNF-α, or IL-1ß-induced IL-6 secretion from RASF [69], as well as the LPS-induced secretion of IL-6 in murine RAW264.7 [68] and human PBMCs [66,67]. Presumably, I-BET151 controls IL-6 gene transcription by preventing the binding of the CREB-binding protein (CBP) transcriptional co-regulator to the IL-6 promoter, as seen in LPS-treated RAW264.7 [68].
I-BET151 may suppress CCL2 mRNA expression by the inhibition of LPS- or IFN-γ-signaling mediated by the corresponding TLR4 and Janus kinase (JAK) and STAT pathways. Thus, I-BET151 represses the transcription of STAT target genes and TLR4-induced IFN responses in IFN-γ-activated human monocytes [71]. The inhibited CCL2 gene expression may also result from the I-BET151-modulated suppression of positive transcription elongation factor b (pTEFb) leading to a reduced transcription elongation [71]. Further, the gene expression of CCL2 may be epigenetically repressed by I-BET151 via the inhibition of BRD4, as shown for other BET inhibitors, IBET and JQ1, in activated Mϕ [72,73].
The upregulation of IL-1ß mRNA expression by I-BET151 was highly unexpected, as I-BET151 significantly reduced IL-1ß secretion in bone marrow-derived macrophages (BMDM) [72] and IL-1ß gene expression in GFs in the context of inflammatory periodontitis [70]. Presumably, the IL-1ß mRNA expression may be upregulated at higher concentrations of I-BET151 used in this study or due to cell-specific gene expression regulation of IL-1ß [74].

3.1.2. BET Inhibitor Ro 11-1464

Ro 11-1464 was first reported to stimulate the production of high-density lipid protein apoA-I, a well-known anti-inflammatory agent [75], in cultured liver cells Hep G2 [76]. Ro 11-1464 also binds BETs, but displays weak inhibitory potential [77]. To date, the known therapeutic potential of Ro 11-1464 is mostly based on its action as a potent apoA-I inducer and thus, as a potential anti-atherosclerotic agent [78].
This study is the first report to show that Ro 11-1464 affects the gene expression of CEBPD, IL-6, CCL2, and IL-1ß in general and to show an anti-inflammatory effect in THP-1 Mϕ. Ro 11-1464 significantly reduced the mRNA expression of IL-6 and CCL2, but had no effect on IL-1ß mRNA expression in LPS + IFN-γ-stimulated THP-1 Mϕ.
Ro 11-1464 may suppress IL-6 and CCL2 mRNA expression by BRD4 inhibition or by the apoA-I-mediated blunting of TLR4 and INF-γ signaling pathways. Thus, silencing of BRD4 results in the reduced secretion of IL-6 in LPS-stimulated Mϕ [72,79]. Endogenous apoA-I decreases the expression of LPS-induced pro-inflammatory genes through a selective dampening of TLR4 signaling in Mϕ [80]. ApoA-I also decreases CCL2 mRNA, CCL2 protein synthesis, and secretion in a dose-dependent manner by the reduction in nuclear NF-kB-p65 subunit [81].

3.1.3. HDAC Inhibitor SAHA

SAHA (vorinostat) is a potent (IC50 < 86 nM [82]) class I and class II HDAC inhibitor that displays anti-inflammatory properties detected in human primary Mϕ [83] and in rodent models of inflammation [84]. It is a synthetic compound that was approved by the Food and Drug Administration (FDA) for the treatment of cutaneous T-cell lymphoma (CTCL) in the United States of America in 2006 [85].
This study is the first report to show that SAHA regulates the mRNA expression of CEBPD in general, and that of IL-6, CCL2, and IL-1ß in THP-1 Mϕ. SAHA reduced the mRNA expression of IL-6 and CCL2, but slightly upregulated that of IL-1ß, demonstrating its simultaneous anti- and pro-inflammatory action in LPS + IFN-γ-stimulated THP-1 Mϕ.
A simultaneous anti- and pro-inflammatory activity of SAHA is also observed in human monocyte-derived macrophages (HMDMs), collagen-induced arthritis (CIA) rat [84], and murine RAW264.7 [86]. Whereas at lower concentrations (<3 μM), SAHA suppresses IL-6 secretion, at higher concentrations (˃3 μM), it amplifies IL-1ß production in LPS-stimulated HMDMs [84]. Additionally, in CIA-rat, only a low dose of SAHA (1 mg/kg/day subcutaneously) shows anti-inflammatory activity [84]. In LPS-stimulated RAW264.7 cells, SAHA reduced the gene expression of IL-1ß, but upregulated that of COX2 [86].
IL-6 is a target gene of NF-kB [87], while IL-1ß promoter contains a functional NF-kB binding site [74], and IL-1ß mRNA generation depends on the non-impaired function of STAT3 in LPS-stimulated Mϕ [88]. Thus, SAHA may affect the gene expression of IL-6 and IL-1ß by the control of acetylation-sensitive transcription factors, such as NF-kB [89,90] and STAT3 [91].
The Lys122 and Lys123 acetylation of NF-kB reduces the DNA binding affinity of the p65 NF-kB subunit, resulting in NF-kB nuclear export [89]. In LPS-stimulated THP-1 cells, SAHA reduced the nuclear accumulation of NF-kB accompanied by the suppressed secretion of pro-inflammatory cytokines, including IL-6 [92]. SAHA-mediated sustained Lys122 and Lys123 acetylation of NF-kB may, therefore, have resulted in reduced transcription of IL-6.
On the other hand, the HDAC3 deacetylation of acetylated p65 NF-kB subunit causes the IkBα-dependent nuclear export of NF-kB and the suppressed expression of its target genes [90]. The enhanced expression of IL-1ß may result from SAHA-mediated HDAC3 inhibition that can restore NF-kB nuclear localization.
STAT3 acetylation by CBP/p300 enhances its DNA binding and transactivation, while STAT3 deacetylation by HDAC1-3 inhibits the transcription of its target genes [93]. The sustained STAT3 acetylation may, therefore, result in an enhanced STAT3 transcriptional activity leading to the upregulation of IL-1ß mRNA transcription.
CCL2 gene expression is activated by the interaction of HDAC3 with SP1 and c-Jun [94] and HDAC11 with PU.1 [95]. SAHA may downregulate CCL2 gene expression by HDAC3 and HDAC11 inhibition, preventing their interaction with the relevant TFs.

3.1.4. HDAC Inhibitor TSA

TSA is a natural compound from Streptomyces spp., which displays not only antifungal, antibiotic, but also HDAC inhibitory activity in mammalian cells [96]. TSA functions as a potent (IC50 of 1.9–2.9 nM [97]) class I and class II HDAC inhibitor [98] causing the altered expression of various genes in the context of inflammation [99] and cancer [100].
This study is the first report of TSA to regulate gene the expression of CEBPD, IL-6, CCL2, and IL-1ß in THP-1 Mϕ. TSA suppressed the mRNA expression of IL-6 and CCL2, but slightly upregulated that of IL-1ß, demonstrating anti- and pro-inflammatory action in LPS + IFN-γ-stimulated THP-1 Mϕ.
The anti-inflammatory effect of TSA is consistent with the literature, as it also reduced pro-inflammatory gene expression and cytokine secretion in murine BMDMs [101,102]. TSA inhibits IFN-γ production as well as increases LPS-depressed acetylation and decreased the LPS-induced phosphorylation of NF-kB-p65 in U-937 cells [103]. TSA also suppresses NF-kB-p65 DNA binding activity and TLR4 protein expression in LPS-activated RAW264.7 [104]. The suppressed expression of IL-6 may, therefore, result from the TSA-mediated prevention of TLR4-dependent NF-kB-p65 binding and interruption of IFN-γ signaling.
In Mϕ, PU.1 functions as a master TF, activating CCL2 expression [102] and regulating Mϕ differentiation at mRNA and protein levels [105]. TSA may downregulate CCL2 mRNA expression by the suppression of PU.1 gene expression, as seen in multiple murine Mϕ cell lines, including RAW264 [105].
As the IL-1ß gene displays an SP1 TF binding site in its promoter [74], TSA may upregulate IL-1ß mRNA expression by the regulation of the SP1 TF acetylation status. Thus, TSA increases SP1 acetylation at Lys703, leading to the elevation of its DNA binding activity to target promoters, as seen in human Jurkat T cells [106].

3.2. The Role of C/EBPδ TF in Gene Expression Regulation

C/EBPδ TF acts as an integrator of cellular responses in a cell context-dependent manner and is believed to be regulated mainly at the level of CEBPD gene transcription initiation. Thus, the modulation by the hit compounds of C/EBPδ TF may contribute to the regulation of IL-6, CCL2, and IL-1ß gene expression in inflammatory-activated THP-1 Mϕ.
C/EBPδ TF can display activatory or inhibitory transcriptional activity, resulting in the up- or downregulation of its target genes [7]. While C/EBPδ TF can directly target IL-6 [10] and IL-1ß [29,74], it participates in the pro-inflammatory induction of CCL2 [107]. However, there is no experimental confirmation of direct C/EBPδ TF binding to the CCL2 promoter.
Heterodimerization, post-translational modification, and interaction with regulatory proteins determine the transcriptional activity of C/EBPδ TF [7]. Thus, the upregulation of C/EBPδ TF by BET inhibitors may suppress the mRNA expression of IL-6 and CCL2 by heterodimerization with LIP (isoform of C/EBPβ) [108], C/EBPγ [109], or CHOP [110]; sumoylation [30,111]; or interaction with inhibitory co-regulators, such as Rad [112], DIPA [113], Smad3, or Smad4 [7]. The upregulation of C/EBPδ TF by I-BET151 may contribute to the enhanced IL-1ß gene expression by phosphorylation or Lys120 acetylation [25,30].
On the other hand, the HDAC inhibitor-mediated abolition of CEBPD gene expression may also contribute to the suppressed expression of IL-6 and CCL2. Thus, C/EBPδ-null Mϕ display a reduced induction of IL-6 in response to several TLR ligands [6,114,115] and decreased IL-6 plasma levels contributing to a reduction in endotoxin-induced systemic inflammation in C/EBPδ-null mice [116].
In this study, we showed that epigenetically active BET and HDAC inhibitors are able to modulate CEBPD gene expression and to elicit an anti-inflammatory effect in LPS + IFN-γ-activated THP-1-derived Mϕ. Macrophage C/EBPδ has been proposed to be a possible target for the treatment of inflammation-driven rheumatoid arthritis [29]. The anti-inflammatory effects of BET and HDAC inhibitors are widely suggested to be novel approaches to the therapy of inflammation-linked or -driven disorders, including atherosclerosis, multiple sclerosis, or sepsis [117,118]. However, further research is needed to determine which mechanisms of action (MOA) of each of the four identified hits might be the most promising for potential therapeutics for epigenetic CEBPD modulation in vivo.

4. Materials and Methods

4.1. Cloning

The empty and CMV::SEAP vectors were cloned to characterize the enzymatic chemiluminescent SEAP assay. The empty vector, containing enhanced green fluorescent protein (eGFP) reporter that was linked via T2A self-cleavage peptide to a puromycin resistance gene (G2P), was generated first. To do so, the G2P insert was amplified via PCR from a pX335A-G2P template and ligated into the BsaBI and BstBI (NEB, Ipswich, MA, USA) double-digested pcDNA3.1(-) backbone following a heat-shock transformation in SCS110 bacteria (Agilent, Santa Clara, CA, USA) and positive clone selection using 100 μg/mL ampicillin (Carl Roth, Karlsruhe, Germany). A CMV::SEAP vector was generated using the empty vector as a backbone. An insert encoding SEAP reporter (GenBank acc# U89937) was generated via XhoI and HindIII-HF (NEB) restriction digestion of SEAP-myc encoding plasmid and ligated into the correspondingly double-digested empty vector following heat-shock transformation in DH-5α bacteria and positive clone selection using 100 μg/mL ampicillin (Carl Roth).
The CEBPD::SEAP vector was cloned to generate THP-1 reporter cells for HTS. An insert encoding the CEBPD promoter was generated via PCR from the bacterial artificial chromosome (BAC) clone CH17-293N3 (BACPAC services, CHORI [119], Emeryville, CA, USA) that encodes a 200,000 bp fragment of the human chromosome 8 containing the CEBPD gene. The insert encoding the SEAP reporter was generated via PCR using the CMV::SEAP vector as a template. The second PCR combined two inserts to the CEBPD::SEAP construct that was double digested by Acc65I and XhoI (NEB), following its ligation into the correspondingly digested pSEW-eGFP backbone and positive clone selection using 100 μg/mL ampicillin (Carl Roth).

4.2. Cell Culture

HEK293T wild type (ATCC CRL-11268) and THP-1 wild type (ATCC TIB-202) cells were purchased from Leibniz Institute DSMZ, Braunschweig, Germany. HEK293T cells were cultured in DMEM GlutaMAX™ (Thermo Fisher Scientific, Oberhausen, Germany) supplemented with 10% (v/v) heat-inactivated FBS (Thermo Fisher Scientific), 1% (v/v) pen-strep (10,000 U/mL, Thermo Fisher Scientific), and 10 µg/mL puromycin dihydrochlorid (Carl Roth, Karlsruhe, Germany) (reporter cells only) and incubated at 37°C in a humidified atmosphere of 5% CO2 and 95% air. THP-1 cells were cultured in RPMI 1640 GlutaMAX™ medium (Thermo Fisher Scientific) supplemented with 10% (v/v) heat-inactivated FBS and 1% (v/v) pen-strep (10,000 U/mL), and incubated at 37 °C in a humidified atmosphere of 5% CO2 and 95% air.
During screening, CEBPD::SEAP THP-1 reporter cells were cultured in RPMI 1640 medium without phenol red (Thermo Fisher Scientific), supplemented with 10% (v/v) heat-inactivated FBS, 1% (v/v) pen-strep (10,000 U/mL), and 2 mM glutamine (Thermo Fisher Scientific) and incubated at 37 °C in a humidified atmosphere of 5% CO2 and 95% air.
The HEK293T and THP-1 reporter cells generated were tested for mycoplasma contamination using a mycoplasma detection kit (Lonza, Basel, Switzerland) after cell sorting.

4.3. Generation of HEK293T Reporter Cell Lines

Wild type HEK293T cells were transfected with the transfection reagent Lipofectamine® 2000 (Invitrogen™, Thermo Fischer Scientific, Oberhausen, Germany) according to the manufacturer’s protocol. Lipofectamine-plasmid DNA complexes (2.5 µg DNA and 9 µL Lipofectamine 2000 per well) were added to wild type HEK293T cells, in 6-well format with 450,000 cells per well, 48 h after cell seeding. The transfected HEK293T cells were cultured in selective DMEM GlutaMAX™ medium (Thermo Fisher Scientific) containing 10 µg/mL puromycin (Carl Roth, Karlsruhe, Germany), 24 h post-transfection. Stable transfected HEK293T cells expressing eGFP were selected via fluorescence-activated cell sorting (FACS, FACSAriaTM Cell Sorter, BD Biosciences, San Jose, CA, USA) approximately three weeks after transfection.

4.4. Generation of THP-1 Reporter Cell Line

The CEBPD::SEAP THP-1 reporter cell line was generated via viral transduction. Viral particles, containing CEBPD::SEAP vector, were produced using HEK293T wild type cells, transfected with jetPRIME® transfection reagent (Polyplus transfection®, New York, NY, USA) in 10 cm2-dishes with 2 million cells per dish. A single reaction with 0.5 mL volume comprised 20 µL jetPRIME® transfection reagent, 2 µg vector DNA, 1.5 µg PSPAX2 plasmid, 0.5 µg PMD2.G plasmid, and JetPrime® reaction buffer ad 500 µL. The day after transfection, cellular supernatant of transfected HEK293T cells was collected and centrifuged at 500× g for 5 min. Next, viral particles were concentrated by incubation of sterile-filtered virus-containing supernatant with a polyethylene glycol (PEG) virus precipitation kit (Abcam, Cambridge, England, United Kingdom) according to the manufacturer’s protocol, at 4 °C for 24 h. The concentrated viral particles were obtained by centrifugation at 3200× g for 30 min at 4 °C. The virus-enriched pellet was aliquoted and stored at −80 °C. A fresh aliquot of viral particles was added to 1 million wild type THP-1 cells and incubated at 37 °C in a humidified atmosphere of 5% CO2 and 95% air for 24 h. Virally transduced cells were cultured for approximately two weeks before positive eGFP-expressing cell clones were selected via FACS (FACSAriaTM Cell Sorter, BD Biosciences, San Jose, CA, USA).

4.5. In Vitro PMA-Induced Differentiation

Phorbol 12-myristate 13-acetate (PMA) was purchased from Sigma Aldrich (St. Louis, MO, USA). THP-1 wild type and THP-1 reporter cells were differentiated to Mϕ by treatment with 50 ng/mL PMA for 48 h with an additional recovery step in fresh PMA-free cell culture medium for 72 h, as described previously [120]. During HTS, THP-1 reporter cells were PMA-differentiated in a bulk format in T175 flasks with 10 million cells per flask in 30–45 mL of cell culture medium.

4.6. LPS and IFN-γ Treatment

Interferon-gamma (IFN-γ) recombinant human protein was purchased from Thermo Fisher Scientific (Oberhausen, Germany), and Escherichia coli lipopolysaccharide (LPS) was purchased from Sigma Aldrich (St. Louis, MO, USA). Stock solutions of IFN-γ (0.1 µg/mL) and LPS (1 mg/mL) were prepared in cell culture-grade DPBS (Thermo Fisher Scientific). Stock solution of IFN-γ was stored at −80 °C, and that of LPS at −20 °C. The conditioned medium was freshly prepared before treatment. PMA-differentiated wild type THP-1 and THP-1 reporter Mϕ were stimulated with either 0.1 or 1 µg/mL LPS + 20 ng/mL IFN-γ for 24 h, as described previously [120].

4.7. Reagents and Compound Libraries

The list of pharmacologically active compounds (LOPAC®) library contains 1280 experimentally validated small molecules that belong to diverse chemical classes. The ENZO® SCREEN-WELL® FDA-approved drug library V2 contains 774 FDA drug compounds belonging to various indication classes. LOPAC® and ENZO® compound libraries were kindly provided by Fraunhofer ITMP in Hamburg. Screening compounds were maintained in DMSO at 10 mM and stored on 384-well plates (Echo Qualified 384-well plates, Labcyte, San Jose, CA, USA) at −20 °C. The composition of the LOPAC® and ENZO® libraries is shown in supplementary Tables S1 and S2, respectively.
I-BET151, Ro 11-1464, trichostatin A (TSA), and suberoylanilide hydroxamic acid (SAHA) were purchased from Sigma Aldrich (St. Louis, MO, USA). Stock solutions of I-BET151 (10 mM), Ro 11-1464 (10 mM), TSA (6.6 mM), and SAHA (10 mM) were prepared in DMSO (Sigma Aldrich) and stored at −20 °C. Each of the conditioned media was freshly prepared before treatment.

4.8. High-Throughput Screening

HTS for CEBPD-modulating compounds was performed at Fraunhofer ITMP in Hamburg. First, THP-1 reporter cells were differentiated to Mϕ in a bulk format for five days, detached using Accutase® solution (Sigma-Aldrich, St. Louis, MO, USA) for 1 h at 37 °C, centrifuged at 300× g for 5 min, and seeded in a 384-well format with 10,000 cells per well in 50 µL RPMI 1640 cell culture medium without phenol red (Thermo Fisher Scientific, Oberhausen, Germany). The next day, cell culture medium was robotically removed, and 20 µL of fresh cell culture medium was manually added. PMA-differentiated THP-1-derived Mϕ were pre-treated by screening compounds (end concentration of 10 μM), TSA control compound (end concentration of 0.5 μM), and DMSO solvent control (0.001% v/v), which were added robotically (Echo 550 Liquid Handler, Beckman Coulter, Inc., Brea, CA, USA), for 1 h at 37 °C. Next, pre-treated cells were stimulated with 20 µL of M1 conditioned medium (0.1 μg/mL LPS + 20 ng/mL IFN-γ) and incubated in a humidified atmosphere of 5% CO2 and 95% air for 24 h. The final concentrations of screening compounds and controls were restored after the addition of the M1 conditioned medium. The next day, cellular supernatants were robotically (JANUS Mini Platform, Perkin Elmer, Waltham, MA, USA) collected for a chemiluminescent SEAP assay (performed in 384-well format). LOPAC® and ENZO® libraries were screened twice (read 1 and read 2) in a 384-well format. Read 1 was conducted in phenol-red containing medium, and read 2 was conducted in phenol-red-free medium, resulting in higher net signal values. During read 2, the remaining cells were used for the cell viability assay using the CellTiter-Glo® Kit (Promega, Madison, WI, USA), which was performed according to the manufacturer´s protocol. In short, 100 µL of freshly prepared CellTiter-Glo® reagent was added to the cells, mixed for 2 min on an orbital shaker, and incubated for 10 min at room temperature. The luminescence was recorded on an EnSpire plate reader with 0.25 s/well integration time.

4.9. SEAP Assay

The SEAP assay protocol was conducted according to the Phospha-Light™ SEAP Kit (Applied Biosystems™, Thermo Fischer Scientific, Oberhausen, Germany). Cellular supernatants from wild type and reporter cells were collected 24 h after cell seeding (for stable transfected HEK293T cells) or 24 h after LPS + IFN-γ-treatment (for THP-1 reporter cells). Cellular supernatants were heat-inactivated at 65 °C for 30 min, cooled to room temperature, and diluted 1:1 (v/v) in a supplied dilution buffer. For assay in a 96-well format used during SEAP assay characterization, a single reaction mixture composed of 50 µL of assay buffer and 50 µL of a diluted sample was incubated for 5 min at room temperature. The enzymatic reaction was started by addition of 50 µL of a substrate buffer. For assay in a 384-well format used during HTS, a single reaction mixture composed of 10 µL of assay buffer and 10 µL of diluted sample was incubated for 5 min at room temperature. The enzymatic reaction was started by addition of 10 µL of a substrate buffer. Samples were measured at least in technical triplicates. The chemiluminescent SEAP signal was monitored using the multimode Plate Reader EnSpire plus (0.1 s/well) plate reader (Perkin Elmer, Waltham, MA, USA) for up to 40 min immediately after substrate buffer addition.

4.10. SEAP Assay Characterization Parameters

The chemiluminescent SEAP assay was characterized according to assay linearity, sensitivity, and variability in a 96-well format using non- and serially diluted cellular supernatants of CMV::SEAP-expressing HEK293T reporter cells. The intra-assay coefficient of variation was calculated as follows: CV = 100 * (standard deviation technical replicates / mean technical replicates). The inter-assay coefficient of variation was calculated as follows: CV = 100 * (standard deviation biological replicates / mean biological replicates). Z´-factor values were calculated using cellular supernatants of CMV::SEAP-expressing (sample) and empty vector-expressing (negative control) HEK293T reporter cells. The Z´-factor was calculated as follows: Z´ = 1 − [3 * (standard deviation sample + standard deviation negative control) / absolute value (mean sample − mean negative control)] [50].

4.11. qRT-PCR Analysis

For gene expression analysis, THP-1 reporter cells were PMA-differentiated in a bulk format, seeded in a 24-well format with 120,000 cells per well in 0.5 mL of RPMI 1640 cell culture medium without phenol red, and treated as described for HTS. Total RNA was collected 4 h after stimulation with 0.1 μg/mL LPS + 20 ng/mL IFN-γ and extracted using an RNeasy Mini Kit (Qiagen, Valencia, CA, USA) according to the manufacturer’s protocol. Lysis buffer was supplemented with 1:100 (v/v) ß-mercaptoethanol (Applichem, Darmstadt, Germany), and sample DNA was digested on-column using an RNase-free DNase kit (Qiagen). Up to 1 µg of the total RNA was reverse transcribed using a First Strand cDNA Synthesis Kit (Thermo Scientific, Waltham, MA, USA) with random primers according to the manufacturer´s instructions. The qRT-PCR analysis was carried out in a 10-µL reaction mixture containing 10 ng reverse-transcribed RNA, SYBR® Select Master Mix (Thermo Fischer Scientific, Oberhausen, Germany), and 0.35–0.5 µM of gene-specific primer pair (Microsynth, Balgach, Switzerland). The primer pairs used in this study are listed in Table 5.
The reaction protocol was as follows: initial incubation at 95 °C for 10 min; denaturation at 95 °C for 15 s; annealing and extension at 60 °C for 1 min and 40 cycles. In each PCR run, the melting curve analysis was performed to ensure the homogeneity of the PCR product. The qRT-PCR analysis was conducted in a 384-well format, at least in technical duplicates on an Applied BiosystemsTM QuantStudioTM 12K Flex system (Thermo Fischer Scientific, Waltham, MA, USA). The mRNA expression levels of selected genes were determined using the comparative Ct method (ΔΔCt) and normalized to an internal reference gene ribosomal protein L37a (RPL37A) [121]. Fold changes in the test group (M1 DMSO or M1 compound) compared to the M0 control group were calculated as 2−∆∆Ct, where ∆∆Ct = ∆Ct mean (test) − ∆Ct mean (M0 control) = [Ct mean (gene, test) − Ct mean (reference, test)] − [Ct mean (gene, M0 control) − Ct mean (reference, M0 control)].

4.12. Live-Cell Imaging

Phase contrast (transmitted light) and fluorescent pictures of CEBPD::SEAP-expressing THP-1 reporter cells were taken by the ZOE Fluorescent Cell Imager (Bio-Rad, Hercules, CA, USA).

4.13. Statistical Analysis

All independent experiments were repeated at least three times. Significant differences were evaluated using GraphPad Prism 8.0.1 software (GraphPad Software, San Diego, CA, USA). The criteria for significance were set with the following p-values: * p < 0.05; ** p < 0.005; *** p < 0.001; **** p < 0.0001.

5. Conclusions

In conclusion, this study identified the BET inhibitors I-BET151 and Ro 11-1464 as well as the HDAC inhibitors SAHA and TSA from LOPAC® and ENZO® libraries as potent CEBPD-modulating compounds in LPS- and IFN-γ-stimulated THP-1 reporter Mϕ. The identified hit compounds also showed pronounced and compound-specific effects on the expression of IL-6, IL-1ß, and CCL2 inflammation-linked genes. The results suggest that CEBPD modulation results in an anti-inflammatory effect in THP-1 Mϕ and can be considered as an approach to the treatment of inflammation. Further studies are needed to characterize the compound-specific mechanism of action on CEBPD expression regulation and the clinical efficacy of epigenetic CEBPD-modulation in vivo.

Supplementary Materials

Author Contributions

Conceptualization, E.R. and T.U.; investigation, T.U.; methodology, T.U., M.W. and E.R.; data acquisition, T.U. and S.L.; software, T.U.; validation, T.U., M.W. and E.R.; formal analysis, T.U.; statistical analysis, T.U.; data curation, T.U.; writing—original draft preparation, T.U.; writing—review and editing, T.U., E.R. and M.J.P.; visualization, T.U.; supervision, E.R.; funding acquisition, E.R. and M.J.P. All authors have read and agreed to the published version of the manuscript.

Funding

This research was funded by the Doktor Robert Pfleger-Stiftung (E.R.) and the Landes-Offensive zur Entwicklung Wissenschaftlich-ökonomischer Exzellenz (LOEWE) of the State of Hesse (M.J.P.).

Institutional Review Board Statement

Not applicable.

Informed Consent Statement

Not applicable.

Data Availability Statement

Not applicable.

Acknowledgments

We thank Doktor Robert Pfleger-Stiftung and the State of Hesse (LOEWE) for the financial support. The pSEW-eGFP backbone and pX335A-G2P template vectors were kindly provided by Phillip Grothe, Goethe University. The SEAP-myc encoding plasmid was kindly provided by Anna Starzinski-Powitz, Goethe University. PSPAX2 and PMD2.G plasmids were kindly provided by Bernhard Brüne, Goethe University. We thank Praveen Mathoor and Verena Trümper, members of the scientific group of Bernhard Brüne at Goethe University, for the technical support for FACS and for the viral transduction.

Conflicts of Interest

Author M.J.P. is currently the CSO of EpiEndo Pharmaceuticals ehf, Iceland, and member of the scientific advisory board of Cyclone Therapeutics, USA. Other authors declare no conflict of interest.

Abbreviations

apoA-Iapolipoprotein A-I
ATF3activating transcription factor 3
BACbacterial artificial chromosome
BETbromodomain and extraterminal domain
BRDbromodomain
cAMPcyclic adenosine monophosphate
CCLCC-chemokine ligand
CEBPDCCAAT/enhancer binding protein delta
CMVcytomegalovirus
CREBcAMP responsive element-binding protein
DMSOdimethyl sulfoxide
HDAChistone deacetylase
HTShigh-throughput screening
IFNinterferon
ILinterleukin
IRF-1interferon regulatory factor 1
LPSlipopolysaccharide
marithmetical mean
macrophages
nnumber of individual experiments
NF-kBnuclear factor-kappa B
PBSphosphate buffered saline
PMAphorbol 12-myristate 13-acetate
pTEFbpositive transcription elongation factor b
RLUrelative luminescence units
RPL37Aribosomal protein L37a
SAHAsuberoylanilide hydroxamic acid
SDstandard deviation
SEAPsecreted alkaline phosphatase
SP1specificity protein 1
STATsignal transducer and activator of transcription
TLRtoll-like receptor
TNFtumor necrosis factor
TSAtrichostatin A
TSStranscription start site
UTRuntranslated region

References

  1. Nau, G.J.; Richmond, J.F.; Schlesinger, A.; Jennings, E.G.; Lander, E.S.; Young, R.A. Human macrophage activation programs induced by bacterial pathogens. Proc. Natl. Acad. Sci. USA 2002, 99, 1503–1508. [Google Scholar] [CrossRef] [PubMed] [Green Version]
  2. Boldrick, J.C.; Alizadeh, A.A.; Diehn, M.; Dudoit, S.; Liu, C.L.; Belcher, C.E.; Botstein, D.; Staudt, L.M.; Brown, P.O.; Relman, D.A. Stereotyped and specific gene expression programs in human innate immune responses to bacteria. Proc. Natl. Acad. Sci. USA 2002, 99, 972–977. [Google Scholar] [CrossRef] [PubMed] [Green Version]
  3. Medzhitov, R.; Horng, T. Transcriptional control of the inflammatory response. Nat. Rev. Immunol. 2009, 9, 692–703. [Google Scholar] [CrossRef]
  4. Ramji, D.P.; Foka, P. CCAAT/enhancer-binding proteins: Structure, function and regulation. Biochem. J. 2002, 365, 561–575. [Google Scholar] [CrossRef] [PubMed] [Green Version]
  5. Landschulz, W.H.; Johnson, P.F.; Adashi, E.Y.; Graves, B.J.; McKnight, S.L. Isolation of a recombinant copy of the gene encoding C/EBP. Genes Dev. 1988, 2, 786–800. [Google Scholar] [CrossRef] [PubMed] [Green Version]
  6. Tsukada, J.; Yoshida, Y.; Kominato, Y.; Auron, P.E. The CCAAT/enhancer (C/EBP) family of basic-leucine zipper (bZIP) transcription factors is a multifaceted highly-regulated system for gene regulation. Cytokine 2011, 54, 6–19. [Google Scholar] [CrossRef] [PubMed]
  7. Pulido-Salgado, M.; Vidal-Taboada, J.M.; Saura, J. C/EBPβ and C/EBPδ transcription factors: Basic biology and roles in the CNS. Prog. Neurobiol. 2015, 132, 1–33. [Google Scholar] [CrossRef]
  8. Ko, C.Y.; Chang, W.C.; Wang, J.M. Biological roles of CCAAT/Enhancer-binding protein delta during inflammation. J. Biomed. Sci. 2015, 22, 6. [Google Scholar] [CrossRef] [PubMed] [Green Version]
  9. Tengku-Muhammad, T.S.; Hughes, T.R.; Ranki, H.; Cryer, A.; Ramji, D.P. Differential regulation of macrophage CCAAT-enhancer binding protein isoforms by lipopolysaccharide and cytokines. Cytokine 2000, 12, 1430–1436. [Google Scholar] [CrossRef] [PubMed]
  10. Litvak, V.; Ramsey, S.A.; Rust, A.G.; Zak, D.E.; Kennedy, K.A.; Lampano, A.E.; Nykter, M.; Shmulevich, I.; Aderem, A. Function of C/EBPdelta in a regulatory circuit that discriminates between transient and persistent TLR4-induced signals. Nat. Immunol. 2009, 10, 437–443. [Google Scholar] [CrossRef] [Green Version]
  11. Kinoshita, S.; Akira, S.; Kishimoto, T. A member of the C/EBP family, NF-IL6 beta, forms a heterodimer and transcriptionally synergizes with NF-IL6. Proc. Natl. Acad. Sci. USA 1992, 89, 1473–1476. [Google Scholar] [CrossRef] [Green Version]
  12. Alam, T.; An, M.R.; Papaconstantinou, J. Differential expression of three C/EBP isoforms in multiple tissues during the acute phase response. J. Biol. Chem. 1992, 267, 5021–5024. [Google Scholar] [CrossRef]
  13. Cardinaux, J.R.; Allaman, I.; Magistretti, P.J. Pro-inflammatory cytokines induce the transcription factors C/EBPbeta and C/EBPdelta in astrocytes. Glia 2000, 29, 91–97. [Google Scholar] [CrossRef]
  14. Granger, R.L.; Hughes, T.R.; Ramji, D.P. Stimulus- and cell-type-specific regulation of CCAAT-enhancer binding protein isoforms in glomerular mesangial cells by lipopolysaccharide and cytokines. Biochim. Biophys. Acta Mol. Basis Dis. 2000, 1501, 171–179. [Google Scholar] [CrossRef] [Green Version]
  15. Yin, M.; Yang, S.Q.; Lin, H.Z.; Lane, M.D.; Chatterjee, S.; Diehl, A.M. Tumor necrosis factor alpha promotes nuclear localization of cytokine-inducible CCAAT/enhancer binding protein isoforms in hepatocytes. J. Biol. Chem. 1996, 271, 17974–17978. [Google Scholar] [CrossRef] [Green Version]
  16. Cantwell, C.A.; Sterneck, E.; Johnson, P.F. Interleukin-6-specific activation of the C/EBPdelta gene in hepatocytes is mediated by Stat3 and Sp1. Mol. Cell Biol. 1998, 18, 2108–2117. [Google Scholar] [CrossRef] [PubMed] [Green Version]
  17. Sanford, D.C.; DeWille, J.W. C/EBPdelta is a downstream mediator of IL-6 induced growth inhibition of prostate cancer cells. Prostate 2005, 63, 143–154. [Google Scholar] [CrossRef] [PubMed]
  18. Ko, C.Y.; Wang, W.L.; Wang, S.M.; Chu, Y.Y.; Chang, W.C.; Wang, J.M. Glycogen synthase kinase-3beta-mediated CCAAT/enhancer-binding protein delta phosphorylation in astrocytes promotes migration and activation of microglia/macrophages. Neurobiol. Aging 2014, 35, 24–34. [Google Scholar] [CrossRef] [Green Version]
  19. Ko, C.Y.; Chang, L.H.; Lee, Y.C.; Sterneck, E.; Cheng, C.P.; Chen, S.H.; Huang, A.M.; Tseng, J.T.; Wang, J.M. CCAAT/enhancer binding protein delta (CEBPD) elevating PTX3 expression inhibits macrophage-mediated phagocytosis of dying neuron cells. Neurobiol. Aging 2012, 33, 422.e11–422.e25. [Google Scholar] [CrossRef]
  20. MacDougald, O.A.; Cornelius, P.; Lin, F.T.; Chen, S.S.; Lane, M.D. Glucocorticoids reciprocally regulate expression of the CCAAT/enhancer-binding protein alpha and delta genes in 3T3-L1 adipocytes and white adipose tissue. J. Biol. Chem. 1994, 269, 19041–19047. [Google Scholar] [CrossRef]
  21. Yang, H.; Mammen, J.; Wei, W.; Menconi, M.; Evenson, A.; Fareed, M.; Petkova, V.; Hasselgren, P.O. Expression and activity of C/EBPbeta and delta are upregulated by dexamethasone in skeletal muscle. J. Cell Physiol. 2005, 204, 219–226. [Google Scholar] [CrossRef]
  22. Hsiao, Y.-W.; Li, C.-F.; Chi, J.-Y.; Tseng, J.T.; Chang, Y.; Hsu, L.-J.; Lee, C.-H.; Chang, T.-H.; Wang, S.-M.; Wang, D.D.H.; et al. CCAAT/enhancer binding protein delta in macrophages contributes to immunosuppression and inhibits phagocytosis in nasopharyngeal carcinoma. Sci. Signal. 2013, 6, ra59. [Google Scholar] [CrossRef] [PubMed]
  23. Ji, C.; Chang, W.; Centrella, M.; McCarthy, T.L. Activation domains of CCAAT enhancer binding protein delta: Regions required for native activity and prostaglandin E2-dependent transactivation of insulin-like growth factor I gene expression in rat osteoblasts. Mol. Endocrinol. 2003, 17, 1834–1843. [Google Scholar] [CrossRef] [PubMed] [Green Version]
  24. Banerjee, S.; Xie, N.; Cui, H.; Tan, Z.; Yang, S.; Icyuz, M.; Abraham, E.; Liu, G. MicroRNA let-7c regulates macrophage polarization. J. Immunol. 2013, 190, 6542–6549. [Google Scholar] [CrossRef] [PubMed]
  25. Kravchenko, V.V.; Mathison, J.C.; Schwamborn, K.; Mercurio, F.; Ulevitch, R.J. IKKi/IKKepsilon plays a key role in integrating signals induced by pro-inflammatory stimuli. J. Biol. Chem. 2003, 278, 26612–26619. [Google Scholar] [CrossRef] [Green Version]
  26. Balamurugan, K.; Sharan, S.; Klarmann, K.D.; Zhang, Y.; Coppola, V.; Summers, G.H.; Roger, T.; Morrison, D.K.; Keller, J.R.; Sterneck, E. FBXW7alpha attenuates inflammatory signalling by downregulating C/EBPdelta and its target gene Tlr4. Nat. Commun. 2013, 4, 1662. [Google Scholar] [CrossRef] [Green Version]
  27. Maitra, U.; Gan, L.; Chang, S.; Li, L. Low-dose endotoxin induces inflammation by selectively removing nuclear receptors and activating CCAAT/enhancer-binding protein δ. J. Immunol. 2011, 186, 4467–4473. [Google Scholar] [CrossRef]
  28. Poli, V. The role of C/EBP isoforms in the control of inflammatory and native immunity functions. J. Biol. Chem. 1998, 273, 29279–29282. [Google Scholar] [CrossRef] [Green Version]
  29. Chang, L.H.; Huang, H.S.; Wu, P.T.; Jou, I.M.; Pan, M.H.; Chang, W.C.; Wang, D.D.; Wang, J.M. Role of macrophage CCAAT/enhancer binding protein delta in the pathogenesis of rheumatoid arthritis in collagen-induced arthritic mice. PLoS ONE 2012, 7, e45378. [Google Scholar] [CrossRef] [PubMed]
  30. Wang, J.M.; Ko, C.Y.; Chen, L.C.; Wang, W.L.; Chang, W.C. Functional role of NF-IL6beta and its sumoylation and acetylation modifications in promoter activation of cyclooxygenase 2 gene. Nucleic Acids Res. 2006, 34, 217–231. [Google Scholar] [CrossRef] [Green Version]
  31. Liu, Y.-W.; Chen, C.-C.; Tseng, H.-P.; Chang, W.-C. Lipopolysaccharide-induced transcriptional activation of interleukin-10 is mediated by MAPK-and NF-κB-induced CCAAT/enhancer-binding protein δ in mouse macrophages. Cell. Signal. 2006, 18, 1492–1500. [Google Scholar] [CrossRef]
  32. Balamurugan, K.; Sterneck, E. The many faces of C/EBPdelta and their relevance for inflammation and cancer. Int. J. Biol. Sci. 2013, 9, 917–933. [Google Scholar] [CrossRef] [Green Version]
  33. Moore, F.; Santin, I.; Nogueira, T.C.; Gurzov, E.N.; Marselli, L.; Marchetti, P.; Eizirik, D.L. The transcription factor C/EBP delta has anti-apoptotic and anti-inflammatory roles in pancreatic beta cells. PLoS ONE 2012, 7, e31062. [Google Scholar] [CrossRef] [Green Version]
  34. Rustenhoven, J.; Scotter, E.L.; Jansson, D.; Kho, D.T.; Oldfield, R.L.; Bergin, P.S.; Mee, E.W.; Faull, R.L.; Curtis, M.A.; Graham, S.E. An anti-inflammatory role for C/EBPδ in human brain pericytes. Sci. Rep. 2015, 5, 1–14. [Google Scholar] [CrossRef] [Green Version]
  35. Banerjee, S.; Fu, Q.; Shah, S.K.; Melnyk, S.B.; Sterneck, E.; Hauer-Jensen, M.; Pawar, S.A. C/EBPδ protects from radiation-induced intestinal injury and sepsis by suppression of inflammatory and nitrosative stress. Sci. Rep. 2019, 9, 1–12. [Google Scholar] [CrossRef] [Green Version]
  36. Cao, Z.; Umek, R.M.; McKnight, S.L. Regulated expression of three C/EBP isoforms during adipose conversion of 3T3-L1 cells. Genes Dev. 1991, 5, 1538–1552. [Google Scholar] [CrossRef] [Green Version]
  37. Dearth, L.R.; DeWille, J. Posttranscriptional and posttranslational regulation of C/EBP delta in G0 growth-arrested mammary epithelial cells. J. Biol. Chem. 2003, 278, 11246–11255. [Google Scholar] [CrossRef] [Green Version]
  38. Balamurugan, K.; Wang, J.M.; Tsai, H.H.; Sharan, S.; Anver, M.; Leighty, R.; Sterneck, E. The tumour suppressor C/EBPdelta inhibits FBXW7 expression and promotes mammary tumour metastasis. EMBO J. 2010, 29, 4106–4117. [Google Scholar] [CrossRef] [Green Version]
  39. Rouillard, A.D.; Gundersen, G.W.; Fernandez, N.F.; Wang, Z.; Monteiro, C.D.; McDermott, M.G.; Ma’ayan, A. The harmonizome: A collection of processed datasets gathered to serve and mine knowledge about genes and proteins. Database 2016, 2016, baw100. [Google Scholar] [CrossRef]
  40. Huang, Y.C.; Chang, W.C.; Su, J.G.; Cai, J.L.; Chen, C.C.; Hung, J.J.; Liu, Y.W. Peptidoglycan enhances transcriptional expression of CCAAT/enhancer-binding protein delta gene in mouse macrophages. J. Biomed. Sci. 2007, 14, 407–418. [Google Scholar] [CrossRef]
  41. Liu, Y.-W.; Chen, C.-C.; Wang, J.-M.; Chang, W.-C.; Huang, Y.-C.; Chung, S.-Y.; Chen, B.-K.; Hung, J.-J. Role of transcriptional factors Sp1, c-Rel, and c-Jun in LPS-induced C/EBPδ gene expression of mouse macrophages. Cell. Mol. Life Sci. 2007, 64, 3282–3294. [Google Scholar] [CrossRef]
  42. Sivko, G.S.; Sanford, D.C.; Dearth, L.D.; Tang, D.; DeWille, J.W. CCAAT/Enhancer binding protein delta (c/EBPdelta) regulation and expression in human mammary epithelial cells: II. Analysis of activating signal transduction pathways, transcriptional, post-transcriptional, and post-translational control. J. Cell Biochem. 2004, 93, 844–856. [Google Scholar] [CrossRef] [PubMed]
  43. Zhang, Y.; Sif, S.; DeWille, J. The mouse C/EBPdelta gene promoter is regulated by STAT3 and Sp1 transcriptional activators, chromatin remodeling and c-Myc repression. J. Cell Biochem. 2007, 102, 1256–1270. [Google Scholar] [CrossRef] [PubMed]
  44. Yamada, T.; Tobita, K.; Osada, S.; Nishihara, T.; Imagawa, M. CCAAT/enhancer-binding protein delta gene expression is mediated by APRF/STAT3. J. Biochem. 1997, 121, 731–738. [Google Scholar] [CrossRef]
  45. Ali, S.; Singh, N.N.; Yildirim, H.; Ramji, D.P. Requirement for nuclear factor kappa B signalling in the interleukin-1-induced expression of the CCAAT/enhancer binding protein-delta gene in hepatocytes. Int. J. Biochem. Cell Biol. 2010, 42, 113–119. [Google Scholar] [CrossRef] [PubMed] [Green Version]
  46. Berger, J.; Hauber, J.; Hauber, R.; Geiger, R.; Cullen, B.R. Secreted placental alkaline phosphatase: A powerful new quantitative indicator of gene expression in eukaryotic cells. Gene 1988, 66, 1–10. [Google Scholar] [CrossRef]
  47. Bettan, M.; Darteil, R.; Scherman, D. Secreted human placental alkaline phosphatase as a reporter gene for in vivo gene transfer. Anal. Biochem. 1999, 271, 187–189. [Google Scholar] [CrossRef]
  48. Schlatter, S.; Rimann, M.; Kelm, J.; Fussenegger, M. SAMY, a novel mammalian reporter gene derived from Bacillus stearothermophilus alpha-amylase. Gene 2002, 282, 19–31. [Google Scholar] [CrossRef]
  49. Cullen, B.R.; Malim, M.H. Secreted placental alkaline phosphatase as a eukaryotic reporter gene. Methods Enzymol. 1992, 216, 362–368. [Google Scholar] [PubMed]
  50. Sui, Y.; Wu, Z. Alternative statistical parameter for high-throughput screening assay quality assessment. J. Biomol. Screen. 2007, 12, 229–234. [Google Scholar] [CrossRef] [PubMed] [Green Version]
  51. Hewings, D.S.; Wang, M.; Philpott, M.; Fedorov, O.; Uttarkar, S.; Filippakopoulos, P.; Picaud, S.; Vuppusetty, C.; Marsden, B.; Knapp, S. 3,5-dimethylisoxazoles act as acetyl-lysine-mimetic bromodomain ligands. J. Med. Chem. 2011, 54, 6761–6770. [Google Scholar] [CrossRef]
  52. Filippakopoulos, P.; Knapp, S. Targeting bromodomains: Epigenetic readers of lysine acetylation. Nat. Rev. Drug Discov. 2014, 13, 337–356. [Google Scholar] [CrossRef]
  53. Falkenberg, K.J.; Johnstone, R.W. Histone deacetylases and their inhibitors in cancer, neurological diseases and immune disorders. Nat. Rev. Drug Discov. 2014, 13, 673–691. [Google Scholar] [CrossRef]
  54. Stefik, D.; Vranic, V.; Ivkovic, N.; Abazovic, D.; Maric, D.; Vojvodic, D.; Supic, G. An insight into osteoarthritis susceptibility: Integration of immunological and genetic background. Bosn. J. Basic Med. Sci. 2020, 1-8. [Google Scholar] [CrossRef]
  55. Latourte, A.; Kloppenburg, M.; Richette, P. Emerging pharmaceutical therapies for osteoarthritis. Nat. Rev. Rheumatol. 2020, 16, 673–688. [Google Scholar] [CrossRef]
  56. Monaco, S.; Nicholas, R.; Reynolds, R.; Magliozzi, R. Intrathecal Inflammation in Progressive Multiple Sclerosis. Int. J. Mol. Sci. 2020, 21, 8217. [Google Scholar] [CrossRef]
  57. Wang, A.; Rojas, O.; Lee, D.; Gommerman, J.L. Regulation of neuroinflammation by B cells and plasma cells. Immunol. Rev. 2020, 299, 1–16. [Google Scholar] [CrossRef]
  58. Laria, A.; Lurati, A.; Marrazza, M.; Mazzocchi, D.; Re, K.A.; Scarpellini, M. The macrophages in rheumatic diseases. J. Inflamm. Res. 2016, 9, 1–11. [Google Scholar] [CrossRef] [PubMed] [Green Version]
  59. Lu, X. Impact of Macrophages in Atherosclerosis. Curr. Med. Chem. 2016, 23, 1926–1937. [Google Scholar] [CrossRef]
  60. Libby, P.; Ridker, P.M.; Hansson, G.K. Progress and challenges in translating the biology of atherosclerosis. Nature 2011, 473, 317–325. [Google Scholar] [CrossRef]
  61. Hanke, T.; Merk, D.; Steinhilber, D.; Geisslinger, G.; Schubert-Zsilavecz, M. Small molecules with anti-inflammatory properties in clinical development. Pharmacol. Ther. 2016, 157, 163–187. [Google Scholar] [CrossRef]
  62. Bindu, S.; Mazumder, S.; Bandyopadhyay, U. Non-steroidal anti-inflammatory drugs (NSAIDs) and organ damage: A current perspective. Biochem. Pharmacol. 2020, 180, 114147. [Google Scholar] [CrossRef]
  63. Saad, J.; Pellegrini, M.V. Nonsteroidal Anti-Inflammatory Drugs (NSAID) Toxicity. In StatPearls; StatPearls Publishing: St. Petersburg, FL, USA, 2019. [Google Scholar]
  64. Taniguchi, Y. The bromodomain and extra-terminal domain (BET) family: Functional anatomy of BET paralogous proteins. Int. J. Mol. Sci. 2016, 17, 1849. [Google Scholar] [CrossRef] [PubMed] [Green Version]
  65. Seal, J.; Lamotte, Y.; Donche, F.; Bouillot, A.; Mirguet, O.; Gellibert, F.; Nicodeme, E.; Krysa, G.; Kirilovsky, J.; Beinke, S. Identification of a novel series of BET family bromodomain inhibitors: Binding mode and profile of I-BET151 (GSK1210151A). Bioorg. Med. Chem. Lett. 2012, 22, 2968–2972. [Google Scholar] [CrossRef] [PubMed]
  66. Mirguet, O.; Lamotte, Y.; Donche, F.; Toum, J.; Gellibert, F.; Bouillot, A.; Gosmini, R.; Nguyen, V.-L.; Delannée, D.; Seal, J. From ApoA1 upregulation to BET family bromodomain inhibition: Discovery of I-BET151. Bioorg. Med. Chem. Lett. 2012, 22, 2963–2967. [Google Scholar] [CrossRef] [PubMed]
  67. de Bont, N.; Netea, M.G.; Rovers, C.; Smilde, T.; Demacker, P.N.; van der Meer, J.W.; Stalenhoef, A.F. LPS-induced cytokine production and expression of LPS-receptors by peripheral blood mononuclear cells of patients with familial hypercholesterolemia and the effect of HMG-CoA reductase inhibitors. Atherosclerosis 1998, 139, 147–152. [Google Scholar] [CrossRef]
  68. Barrett, E.; Brothers, S.; Wahlestedt, C.; Beurel, E. I-BET151 selectively regulates IL-6 production. Biochim. Biophys. Acta Mol. Basis Dis. 2014, 1842, 1549–1555. [Google Scholar] [CrossRef] [Green Version]
  69. Klein, K.; Kabala, P.A.; Grabiec, A.M.; Gay, R.E.; Kolling, C.; Lin, L.-L.; Gay, S.; Tak, P.P.; Prinjha, R.K.; Ospelt, C. The bromodomain protein inhibitor I-BET151 suppresses expression of inflammatory genes and matrix degrading enzymes in rheumatoid arthritis synovial fibroblasts. Ann. Rheum. Dis. 2016, 75, 422–429. [Google Scholar] [CrossRef] [PubMed]
  70. Maksylewicz, A.; Bysiek, A.; Lagosz, K.B.; Macina, J.M.; Kantorowicz, M.; Bereta, G.; Sochalska, M.; Gawron, K.; Chomyszyn-Gajewska, M.; Potempa, J. BET bromodomain inhibitors suppress inflammatory activation of gingival fibroblasts and epithelial cells from periodontitis patients. Front. Immunol. 2019, 10, 933. [Google Scholar] [CrossRef] [Green Version]
  71. Chan, C.H.; Fang, C.; Qiao, Y.; Yarilina, A.; Prinjha, R.K.; Ivashkiv, L.B. BET bromodomain inhibition suppresses transcriptional responses to cytokine-Jak-STAT signaling in a gene-specific manner in human monocytes. Eur. J. Immunol. 2015, 45, 287–297. [Google Scholar] [CrossRef] [PubMed]
  72. Nicodeme, E.; Jeffrey, K.L.; Schaefer, U.; Beinke, S.; Dewell, S.; Chung, C.-W.; Chandwani, R.; Marazzi, I.; Wilson, P.; Coste, H. Suppression of inflammation by a synthetic histone mimic. Nature 2010, 468, 1119–1123. [Google Scholar] [CrossRef]
  73. Belkina, A.C.; Denis, G.V. BET domain co-regulators in obesity, inflammation and cancer. Nat. Rev. Cancer 2012, 12, 465–477. [Google Scholar] [CrossRef] [Green Version]
  74. Bent, R.; Moll, L.; Grabbe, S.; Bros, M. Interleukin-1 beta—A friend or foe in malignancies? Int. J. Mol. Sci. 2018, 19, 2155. [Google Scholar] [CrossRef] [PubMed] [Green Version]
  75. Georgila, K.; Vyrla, D.; Drakos, E. Apolipoprotein AI (ApoA-I), immunity, inflammation and cancer. Cancers 2019, 11, 1097. [Google Scholar] [CrossRef] [PubMed] [Green Version]
  76. Kempen, H. Use of a Thienotriazolodiazephine to Increase Apolipoprotein A-I Levels. International Patent Application No. WO1997009048A1, 29 December 1998. [Google Scholar]
  77. Kempen, H.J.; Bellus, D.; Fedorov, O.; Nicklisch, S.; Filippakopoulos, P.; Picaud, S.; Knapp, S. Stimulation of Hepatic Apolipoprotein AI Production by Novel Thieno-Triazolodiazepines: Roles of the Classical Benzodiazepine Receptor, PAF Receptor, and Bromodomain Binding; SAGE Publications: London, UK, 2013. [Google Scholar]
  78. Chen, W.; Wu, Y.; Lu, Q.; Wang, S.; Xing, D. Endogenous ApoA-I expression in macrophages: A potential target for protection against atherosclerosis. Clin. Chim. Acta 2020, 505, 55–59. [Google Scholar] [CrossRef]
  79. Belkina, A.C.; Nikolajczyk, B.S.; Denis, G.V. BET protein function is required for inflammation: Brd2 genetic disruption and BET inhibitor JQ1 impair mouse macrophage inflammatory responses. J. Immunol. 2013, 190, 3670–3678. [Google Scholar] [CrossRef] [PubMed] [Green Version]
  80. Mogilenko, D.A.; Orlov, S.V.; Trulioff, A.S.; Ivanov, A.V.; Nagumanov, V.K.; Kudriavtsev, I.V.; Shavva, V.S.; Tanyanskiy, D.A.; Perevozchikov, A.P. Endogenous apolipoprotein AI stabilizes ATP-binding cassette transporter A1 and modulates Toll-like receptor 4 signaling in human macrophages. FASEB J. 2012, 26, 2019–2030. [Google Scholar] [CrossRef]
  81. Bursill, C.A.; Castro, M.L.; Beattie, D.T.; Nakhla, S.; van der Vorst, E.; Heather, A.K.; Barter, P.J.; Rye, K.-A. High-density lipoproteins suppress chemokines and chemokine receptors in vitro and in vivo. Arterioscler. Thromb. Vasc. Biol. 2010, 30, 1773–1778. [Google Scholar] [CrossRef] [Green Version]
  82. Zhang, Q.; Wang, S.; Chen, J.; Yu, Z. Histone deacetylases (HDACs) guided novel therapies for T-cell lymphomas. Int. J. Med. Sci. 2019, 16, 424. [Google Scholar] [CrossRef] [Green Version]
  83. Leoni, F.; Zaliani, A.; Bertolini, G.; Porro, G.; Pagani, P.; Pozzi, P.; Dona, G.; Fossati, G.; Sozzani, S.; Azam, T.; et al. The antitumor histone deacetylase inhibitor suberoylanilide hydroxamic acid exhibits antiinflammatory properties via suppression of cytokines. Proc. Natl. Acad. Sci. USA 2002, 99, 2995–3000. [Google Scholar] [CrossRef] [Green Version]
  84. Lohman, R.J.; Iyer, A.; Fairlie, T.J.; Cotterell, A.; Gupta, P.; Reid, R.C.; Vesey, D.A.; Sweet, M.J.; Fairlie, D.P. Differential Anti-inflammatory Activity of HDAC Inhibitors in Human Macrophages and Rat Arthritis. J. Pharmacol. Exp. Ther. 2016, 356, 387–396. [Google Scholar] [CrossRef]
  85. Mann, B.S.; Johnson, J.R.; Cohen, M.H.; Justice, R.; Pazdur, R. FDA approval summary: Vorinostat for treatment of advanced primary cutaneous T-cell lymphoma. Oncologist 2007, 12, 1247–1252. [Google Scholar] [CrossRef]
  86. Weiss, U.; Möller, M.; Husseini, S.A.; Manderscheid, C.; Häusler, J.; Geisslinger, G.; Niederberger, E. Inhibition of HDAC Enzymes Contributes to Differential Expression of Pro-Inflammatory Proteins in the TLR-4 Signaling Cascade. Int. J. Mol. Sci. 2020, 21, 8943. [Google Scholar] [CrossRef] [PubMed]
  87. Matsusaka, T.; Fujikawa, K.; Nishio, Y.; Mukaida, N.; Matsushima, K.; Kishimoto, T.; Akira, S. Transcription factors NF-IL6 and NF-kappa B synergistically activate transcription of the inflammatory cytokines, interleukin 6 and interleukin 8. Proc. Natl. Acad. Sci. USA 1993, 90, 10193–10197. [Google Scholar] [CrossRef] [Green Version]
  88. Weiss, H.J.; O’Neill, L.A. Bridging the gap—A new role for STAT3 in TLR4-mediated metabolic reprogramming. Immunol. Cell Biol. 2021, 99, 122–125. [Google Scholar] [CrossRef] [PubMed]
  89. Kiernan, R.; Bres, V.; Ng, R.W.; Coudart, M.P.; El Messaoudi, S.; Sardet, C.; Jin, D.Y.; Emiliani, S.; Benkirane, M. Post-activation turn-off of NF-kappa B-dependent transcription is regulated by acetylation of p65. J. Biol. Chem. 2003, 278, 2758–2766. [Google Scholar] [CrossRef] [PubMed] [Green Version]
  90. Chen, L.; Fischle, W.; Verdin, E.; Greene, W.C. Duration of nuclear NF-kappaB action regulated by reversible acetylation. Science 2001, 293, 1653–1657. [Google Scholar] [CrossRef] [Green Version]
  91. Glozak, M.A.; Sengupta, N.; Zhang, X.; Seto, E. Acetylation and deacetylation of non-histone proteins. Gene 2005, 363, 15–23. [Google Scholar] [CrossRef]
  92. Choo, Q.Y.; Ho, P.C.; Tanaka, Y.; Lin, H.S. Histone deacetylase inhibitors MS-275 and SAHA induced growth arrest and suppressed lipopolysaccharide-stimulated NF-kappaB p65 nuclear accumulation in human rheumatoid arthritis synovial fibroblastic E11 cells. Rheumatology 2010, 49, 1447–1460. [Google Scholar] [CrossRef] [Green Version]
  93. Yuan, Z.L.; Guan, Y.J.; Chatterjee, D.; Chin, Y.E. Stat3 dimerization regulated by reversible acetylation of a single lysine residue. Science 2005, 307, 269–273. [Google Scholar] [CrossRef]
  94. Kim, Y.; Kim, K.; Park, D.; Lee, E.; Lee, H.; Lee, Y.S.; Choe, J.; Jeoung, D. Histone deacetylase 3 mediates allergic skin inflammation by regulating expression of MCP1 protein. J. Biol. Chem. 2012, 287, 25844–25859. [Google Scholar] [CrossRef] [PubMed] [Green Version]
  95. Sun, L.; Telles, E.; Karl, M.; Cheng, F.; Luetteke, N.; Sotomayor, E.M.; Miller, R.H.; Seto, E. Loss of HDAC11 ameliorates clinical symptoms in a multiple sclerosis mouse model. Life Sci. Alliance 2018, 1, e201800039. [Google Scholar] [CrossRef] [PubMed]
  96. Salvador, L.A.; Luesch, H. Discovery and mechanism of natural products as modulators of histone acetylation. Curr. Drug Targets 2012, 13, 1029–1047. [Google Scholar] [CrossRef] [PubMed] [Green Version]
  97. Vigushin, D.M.; Ali, S.; Pace, P.E.; Mirsaidi, N.; Ito, K.; Adcock, I.; Coombes, R.C. Trichostatin A is a histone deacetylase inhibitor with potent antitumor activity against breast cancer in vivo. Clin. Cancer Res. 2001, 7, 971–976. [Google Scholar] [PubMed]
  98. Lobera, M.; Madauss, K.P.; Pohlhaus, D.T.; Wright, Q.G.; Trocha, M.; Schmidt, D.R.; Baloglu, E.; Trump, R.P.; Head, M.S.; Hofmann, G.A.; et al. Selective class IIa histone deacetylase inhibition via a nonchelating zinc-binding group. Nat. Chem. Biol. 2013, 9, 319–325. [Google Scholar] [CrossRef]
  99. Hull, E.E.; Montgomery, M.R.; Leyva, K.J. HDAC Inhibitors as Epigenetic Regulators of the Immune System: Impacts on Cancer Therapy and Inflammatory Diseases. Biomed. Res. Int. 2016, 2016, 8797206. [Google Scholar] [CrossRef] [PubMed] [Green Version]
  100. Eckschlager, T.; Plch, J.; Stiborova, M.; Hrabeta, J. Histone Deacetylase Inhibitors as Anticancer Drugs. Int. J. Mol. Sci. 2017, 18, 1414. [Google Scholar] [CrossRef]
  101. Han, S.B.; Lee, J.K. Anti-inflammatory effect of Trichostatin-A on murine bone marrow-derived macrophages. Arch. Pharm. Res. 2009, 32, 613–624. [Google Scholar] [CrossRef]
  102. Aung, H.T.; Schroder, K.; Himes, S.R.; Brion, K.; van Zuylen, W.; Trieu, A.; Suzuki, H.; Hayashizaki, Y.; Hume, D.A.; Sweet, M.J.; et al. LPS regulates proinflammatory gene expression in macrophages by altering histone deacetylase expression. FASEB J. 2006, 20, 1315–1327. [Google Scholar] [CrossRef]
  103. Zhang, Q.; Yang, F.; Li, X.; Wang, L.; Chu, X.; Zhang, H.; Gong, Z. Trichostatin A inhibits inflammation in phorbol myristate acetateinduced macrophages by regulating the acetylation of histone and/or nonhistone proteins. Mol. Med. Rep. 2016, 13, 845–852. [Google Scholar] [CrossRef]
  104. Hu, X.L.; Zhang, X.; Li, Q.; Qiu, S.F.; Mei, R.H. Effects of trichostatin A on the expressions of inflammatory cytokines and toll-like receptor 4 and the acetylation of nuclear factor-κB induced by lipopolysaccharide in macrophage. Acta Physiol. Sin. 2012, 64, 651–656. [Google Scholar]
  105. Laribee, R.N.; Klemsz, M.J. Loss of PU.1 expression following inhibition of histone deacetylases. J. Immunol. 2001, 167, 5160–5166. [Google Scholar] [CrossRef] [Green Version]
  106. Hepp, M.I.; Escobar, D.; Farkas, C.; Hermosilla, V.E.; Alvarez, C.; Amigo, R.; Gutierrez, J.L.; Castro, A.F.; Pincheira, R. A Trichostatin A (TSA)/Sp1-mediated mechanism for the regulation of SALL2 tumor suppressor in Jurkat T cells. Biochim. Biophys. Acta Gene Regul. Mech. 2018, 1861, 623–636. [Google Scholar] [CrossRef]
  107. Hu, H.-M.; Baer, M.; Williams, S.C.; Johnson, P.F.; Schwartz, R.C. Redundancy of C/EBPα,-β, and-δ in supporting the lipopolysaccharide-induced transcription of IL-6 and monocyte chemoattractant protein-1. J. Immunol. 1998, 160, 2334–2342. [Google Scholar]
  108. Descombes, P.; Schibler, U. A liver-enriched transcriptional activator protein, LAP, and a transcriptional inhibitory protein, LIP, are translated from the same mRNA. Cell 1991, 67, 569–579. [Google Scholar] [CrossRef]
  109. Parkin, S.E.; Baer, M.; Copeland, T.D.; Schwartz, R.C.; Johnson, P.F. Regulation of CCAAT/enhancer-binding protein (C/EBP) activator proteins by heterodimerization with C/EBPgamma (Ig/EBP). J. Biol. Chem. 2002, 277, 23563–23572. [Google Scholar] [CrossRef] [Green Version]
  110. Ron, D.; Habener, J.F. CHOP, a novel developmentally regulated nuclear protein that dimerizes with transcription factors C/EBP and LAP and functions as a dominant-negative inhibitor of gene transcription. Genes Dev. 1992, 6, 439–453. [Google Scholar] [CrossRef] [Green Version]
  111. Wang, W.L.; Lee, Y.C.; Yang, W.M.; Chang, W.C.; Wang, J.M. Sumoylation of LAP1 is involved in the HDAC4-mediated repression of COX-2 transcription. Nucleic Acids Res. 2008, 36, 6066–6079. [Google Scholar] [CrossRef] [PubMed] [Green Version]
  112. Zhang, J.; Chang, L.; Chen, C.; Zhang, M.; Luo, Y.; Hamblin, M.; Villacorta, L.; Xiong, J.W.; Chen, Y.E.; Zhang, J.; et al. Rad GTPase inhibits cardiac fibrosis through connective tissue growth factor. Cardiovasc. Res. 2011, 91, 90–98. [Google Scholar] [CrossRef] [PubMed] [Green Version]
  113. Bezy, O.; Elabd, C.; Cochet, O.; Petersen, R.K.; Kristiansen, K.; Dani, C.; Ailhaud, G.; Amri, E.Z. Delta-interacting protein A, a new inhibitory partner of CCAAT/enhancer-binding protein beta, implicated in adipocyte differentiation. J. Biol. Chem. 2005, 280, 11432–11438. [Google Scholar] [CrossRef] [Green Version]
  114. Lu, Y.C.; Kim, I.; Lye, E.; Shen, F.; Suzuki, N.; Suzuki, S.; Gerondakis, S.; Akira, S.; Gaffen, S.L.; Yeh, W.C.; et al. Differential role for c-Rel and C/EBPbeta/delta in TLR-mediated induction of proinflammatory cytokines. J. Immunol. 2009, 182, 7212–7221. [Google Scholar] [CrossRef]
  115. Yan, C.; Johnson, P.F.; Tang, H.; Ye, Y.; Wu, M.; Gao, H. CCAAT/enhancer-binding protein delta is a critical mediator of lipopolysaccharide-induced acute lung injury. Am. J. Pathol. 2013, 182, 420–430. [Google Scholar] [CrossRef] [Green Version]
  116. Slofstra, S.H.; Groot, A.P.; Obdeijn, M.H.P.; Reitsma, P.H.; Cate, H.T.; Spek, C.A. Gene expression profiling identifies C/EBPdelta as a candidate regulator of endotoxin-induced disseminated intravascular coagulation. Am. J. Respir. Crit. Care Med. 2007, 176, 602–609. [Google Scholar] [CrossRef]
  117. Gatla, H.R.; Muniraj, N.; Thevkar, P.; Yavvari, S.; Sukhavasi, S.; Makena, M.R. Regulation of Chemokines and Cytokines by Histone Deacetylases and an Update on Histone Decetylase Inhibitors in Human Diseases. Int. J. Mol. Sci. 2019, 20, 1110. [Google Scholar] [CrossRef] [PubMed] [Green Version]
  118. von Knethen, A.; Brüne, B. Histone deacetylation inhibitors as therapy concept in sepsis. Int. J. Mol. Sci. 2019, 20, 346. [Google Scholar] [CrossRef] [PubMed] [Green Version]
  119. Osoegawa, K.; Woon, P.Y.; Zhao, B.; Frengen, E.; Tateno, M.; Catanese, J.J.; de Jong, P.J. An improved approach for construction of bacterial artificial chromosome libraries. Genomics 1998, 52, 1–8. [Google Scholar] [CrossRef] [PubMed]
  120. Shiratori, H.; Feinweber, C.; Luckhardt, S.; Linke, B.; Resch, E.; Geisslinger, G.; Weigert, A.; Parnham, M.J. THP-1 and human peripheral blood mononuclear cell-derived macrophages differ in their capacity to polarize in vitro. Mol. Immunol. 2017, 88, 58–68. [Google Scholar] [CrossRef]
  121. Maess, M.B.; Sendelbach, S.; Lorkowski, S. Selection of reliable reference genes during THP-1 monocyte differentiation into macrophages. BMC Mol. Biol. 2010, 11, 90. [Google Scholar] [CrossRef] [Green Version]
Figure 1. Characterization of chemiluminescent secreted alkaline phosphatase (SEAP) assay. (ac) SEAP enzymatic activity (a), assay linearity (b), and assay sensitivity (c) were determined in undiluted and up to 10,000-fold diluted cellular supernatants of HEK293T reporter cells, 24 h after cell seeding (mean ± SD, n = 3). Negative control is represented by the cell culture supernatant from empty vector-expressing HEK293T cells. RLU: relative luminescence units.
Ijms 22 03022 g001
Figure 2. SEAP is a reliable gene reporter for CEBPD monitoring in THP-1 reporter macrophages (Mϕ). Schematic drawing of the generated CEBPD::SEAP vector (a) and of the defined CEBPD promoter (b) containing 5’UTR, TSS, TATA box, known (gray boxes), and proposed (blue boxes) binding sites of regulatory TFs. Positions in base pairs (bp) are indicated relative to the TSS (0). (c) The cell culture medium from THP-1 wild type (wt) and reporter cells was collected 24 h before, during (48 h with PMA), and after (48 h recovery) treatment with 50 ng/mL PMA for SEAP assay (mean ± SD, n = 3). In (d,e) PMA-differentiated THP-1 reporter Mϕ were stimulated with PBS (solvent control), 1 µg/mL or 0.1 µg/mL LPS + 20 ng/mL IFN-γ for up to 6 h for mRNA expression analysis of endogenous CEBPD (d) and reporter CEBPD::SEAP (e) (mean ± SD, n = 3). mRNA expression analysis was performed via qRT-PCR (ΔΔCt method) using RPL37A as an internal reference gene. Differences in CEBPD gene expression levels were analyzed relative to PBS via one-way ANOVA or Kruskal–Wallis test with Dunn’s correction for multiple comparisons. * p < 0.05; *** p < 0.001. (f) The cell culture medium from PMA-differentiated THP-1 reporter Mϕ were collected after treatment with PBS (solvent control), 1 µg/mL or 0.1 µg/mL LPS + 20 ng/mL IFN-γ for 1, 3, 6, or 24 h (mean ± SD, n = 3). SEAP enzymatic signal was monitored for 40 min after substrate addition. RLU: relative luminescence units.
Ijms 22 03022 g002
Figure 3. HTS for CEBPD-modulating compounds and identification of hits. (a) A schematic drawing of the developed screening assay in THP-1 reporter Mϕ using SEAP reporter. (b,c) Here, we show the hit-contained screening plate from the LOPAC® (b) and the hit-containing screening plate from the ENZO® (c) compound libraries. The primary screening data from all plates is summarized in supplementary Tables S1 and S2. PMA-differentiated THP-1 reporter Mϕ were not treated (M0), pre-treated with 0.001% (v/v) DMSO (solvent control), 10 μM compound from LOPAC® (b) and ENZO® (c) libraries, or 0.5 μM TSA for 1 h and stimulated (M1) with 0.1 µg/mL LPS + 20 ng/mL IFN-γ for 24 h for SEAP assay (read 1 and 2). Hit compounds (I-BET151, Ro 11-1464, and SAHA) showing a strong activatory effect on SEAP secretion were identified in areas >3 SDs (m + 3 × SD, black line) of an average signal (m, read line), calculated for the corresponding “M1, DMSO” condition. For read 2, CV was calculated for M0 and M1 DMSO controls (b: 48.9% and 27.7%, respectively; c: 36.6% and 44.4%, respectively). The corresponding Z´-factor was −0.4 (b) and −1.3 (c). RLU: relative luminescence units.
Ijms 22 03022 g003
Figure 4. The effect of BET inhibitor I-BET151 on SEAP secretion and mRNA expression. In (a), PMA-differentiated THP-1 reporter Mϕ were pre-treated with 10 μM I-BET151 for 1 h and stimulated with 0.1 µg/mL LPS + 20 ng/mL IFN-γ for 24 h for SEAP assay (mean ± SD, n = 3 with 2–3 wells per condition). Changes in SEAP enzymatic activity were analyzed relative to M1 DMSO control via Brown–Forsythe and Welch ANOVA test with Dunnett’s correction for multiple comparisons. * p < 0.05. In (bf), PMA-differentiated THP-1 reporter Mϕ were pre-treated with 10 μM I-BET151 for 1 h and stimulated with 0.1 µg/mL LPS + 20 ng/mL IFN-γ for 4 h for mRNA expression analysis of reporter CEBPD::SEAP (b), endogenous CEBPD (c), IL-6 (d), CCL2 (e), and IL-1ß (f) (median and range, n = 3 with 2–3 wells per condition). mRNA expression analysis was performed via qRT-PCR (ΔΔCt method) using RPL37A as an internal reference gene. Fold change in mRNA expression is displayed relative to M0 control, set as 1. Changes in mRNA expression were analyzed relative to M1 DMSO control via unpaired t-test with (for normally distributed data and different SDs) and without (for normally distributed data and equal SDs) Welch’s correction. ** p < 0.005; *** p < 0.001; **** p < 0.0001.
Ijms 22 03022 g004
Figure 5. The effect of BET inhibitor Ro 11-1464 on SEAP secretion and mRNA expression. In (a), PMA-differentiated THP-1 reporter Mϕ were pre-treated with 10 μM Ro 11-1464 for 1 h and stimulated with 0.1 µg/mL LPS + 20 ng/mL IFN-γ for 24 h for SEAP assay (mean ± SD, n = 5 with 4 wells per condition). Changes in SEAP enzymatic activity were analyzed relative to M1 DMSO control via Kruskal–Wallis test with Dunn’s correction for multiple comparisons. *** p < 0.001. In (bf), PMA-differentiated THP-1 reporter Mϕ were pre-treated with 10 μM Ro 11-1464 for 1 h and stimulated with 0.1 µg/mL LPS + 20 ng/mL IFN-γ for 4 h for mRNA expression analysis of reporter CEBPD::SEAP (b), endogenous CEBPD (c), IL-6 (d), CCL2 (e), and IL-1ß (f) (median and range, n = 5 with 4 wells per condition). mRNA expression analysis was performed via qRT-PCR (ΔΔCt method) using RPL37A as internal reference gene. Fold change in mRNA expression is displayed relative to M0 control, set as 1. The Ro 11-1464-mediated changes in mRNA expression were analyzed relative to M1 DMSO control via unpaired t-test with (for normally distributed data and different SDs) and without (for normally distributed data and equal SDs) Welch’s correction. n.s.: not significant; *** p < 0.001; **** p < 0.0001.
Ijms 22 03022 g005
Figure 6. The effect of HDAC inhibitors SAHA and TSA on SEAP secretion and mRNA expression. In (a), PMA-differentiated THP-1 reporter Mϕ were pre-treated with 10 μM SAHA or 0.5 μM TSA for 1 h and stimulated with 0.1 µg/mL LPS + 20 ng/mL IFN-γ for 24 h for SEAP assay (mean ± SD, n = 3 with 2 wells per condition). Changes in SEAP enzymatic activity were analyzed relative to M1 DMSO control via Brown–Forsythe and Welch ANOVA test with Dunnett’s correction for multiple comparisons; n.s.: not significant; * p < 0.05. In (bf), PMA-differentiated THP-1 reporter Mϕ were pre-treated with 10 μM SAHA or 0.5 μM TSA for 1 h and stimulated with 0.1 µg/mL LPS + 20 ng/mL IFN-γ for 4 h for mRNA expression analysis of reporter CEBPD::SEAP (b), endogenous CEBPD (c), IL-6 (d), CCL2 (e), and IL-1ß (f) (median and range, n = 3 with 2 wells per condition). mRNA expression analysis was performed via qRT-PCR (ΔΔCt method) using RPL37A as an internal reference gene. Fold change in mRNA expression is displayed relative to M0 control, set as 1. The compound-mediated changes in mRNA expression were analyzed relative to M1 DMSO control via ordinary one-way ANOVA (for normally distributed data and equal SDs), Brown–Forsythe and Welch ANOVA test with Dunnett’s correction (for normally distributed data and different SDs), or Kruskal-Wallis test with Dunn´s correction for multiple comparisons (for non-normally distributed data). * p < 0.05; ** p < 0.005; *** p < 0.001.
Ijms 22 03022 g006
Table 1. SEAP assay variability.
Sample IDIntra-Assay
CV (%)
Inter-Assay
CV (%)
SEAP-myc, undiluted2.000.84
SEAP-myc, 1:10-diluted3.334.16
SEAP-myc, 1:100-diluted2.672.62
SEAP-myc, 1:1000-diluted5.332.71
SEAP-myc, 1:10,000-diluted15.6724.41
Table 2. Fold change (mean ± SD) for mRNA expression in I-BET151-pre-treated target cells compared to M0 controls (compare Figure 4).
GeneCondition4 h, Mean ± SD
CEBPD::SEAPM1 DMSO5.3 ± 1.4
M1 I-BET1519.6 ± 2.0
CEBPDM1 DMSO4.8 ± 1.0
M1 I-BET1517.5 ± 1.1
IL-6M1 DMSO6625.0 ± 1045.0
M1 I-BET151102.3 ± 118.1
CCL2M1 DMSO187.7 ± 105.4
M1 I-BET15111.5 ± 3.3
IL-1ßM1 DMSO396.0 ± 62.4
M1 I-BET151927.1 ± 124.2
Table 3. Fold change (mean ± SD) for mRNA expression in Ro 11-1464-pre-treated target cells compared to M0 controls (compare Figure 5).
GeneCondition4 h, Mean ± SD
CEBPD::SEAPM1 DMSO5.5 ± 1.5
M1 Ro 11-14648.8 ± 3.4
CEBPDM1 DMSO6.3 ± 2.8
M1 Ro 11-146412.4 ± 5.5
IL-6M1 DMSO12,432.0 ± 10092.0
M1 Ro 11-14641364.0 ± 1426.0
CCL2M1 DMSO237.2 ± 82.8
M1 Ro 11-146426.6 ± 9.0
IL-1ßM1 DMSO344.8 ± 119.0
M1 Ro 11-1464445.3 ± 138.6
Table 4. Fold change (mean ± SD) for mRNA expression in SAHA-pre-treated and TSA-pre-treated target cells compared to M0 controls (compare Figure 6).
GeneCondition4 h, Mean ± SD
CEBPD::SEAPM1 DMSO4.5 ± 0.4
M1 TSA6.4 ± 1.3
M1 SAHA6.8 ± 1.3
CEBPDM1 DMSO6.1 ± 1.2
M1 TSA0.9 ± 0.1
M1 SAHA1.1 ± 0.2
IL-6M1 DMSO7617.0 ± 1258.0
M1 TSA58.1 ± 16.1
M1 SAHA68.7 ± 20.1
CCL2M1 DMSO114.9 ± 33.4
M1 TSA6.8 ± 1.5
M1 SAHA7.6 ± 1.9
IL-1ßM1 DMSO374.3 ± 47.9
M1 TSA492.5 ± 67.1
M1 SAHA501.9 ± 83.6
Table 5. Sequences of primers used for quantitative reverse transcriptase polymerase chain reaction.
Gene NameGenBank Accession NumberPrimer SequencesReference
CEBPDNM_005195.4Forward: 5′-CAG CAA CGA CCC ATA CCT CA-3′this study
Reverse: 5′-TCT TTG CGC TCC TAT GTC CC-3′
CEBPD::SEAPU89937Forward: 5′-GAG ATG AGT TTT TGT TCA CCC G-3′this study
Reverse: 5′-GAC CTT CAT AGC GCA CGT CA-3′
RPL37ANM_000998.5Forward: 5′-CTC GTC CGC CTA ATA CCG C-3′this study
Reverse: 5′-TAC CGA CGA TCC CGA CTT TC-3′
IL-6NM_000600.5Forward: 5′-GTG TGA AAG CAG CAA AGA GGC-3′[120]
Reverse: 5′-TCT GTT CTG GAG GTA CTC TAG GTA T-3′
IL-1ßNM_000576.3Forward: 5′-GTG GCA ATG AGG ATG ACT TGT TCT-3′[120]
Reverse: 5′-TGT AGT GGT GGT CGG AGA TTC G-3′
CCL2NM_002982.4Forward: 5′-AAA CTG AAG CTC GCA CTC TCG C-3′[120]
Reverse: 5′-AGG TGA CTG GGG CAT TGA TTG-3′
Publisher’s Note: MDPI stays neutral with regard to jurisdictional claims in published maps and institutional affiliations.

