
Simple Models to Study Spectral Properties of Microbial and Animal Rhodopsins: Evaluation of the Electrostatic Effect of Charged and Polar Residues on the First Absorption Band Maxima

 , , , , and
Abstract
:1. Introduction
2. Results
2.1. Steric and Electrostatic Factors in Rhodopsin Spectral Tuning
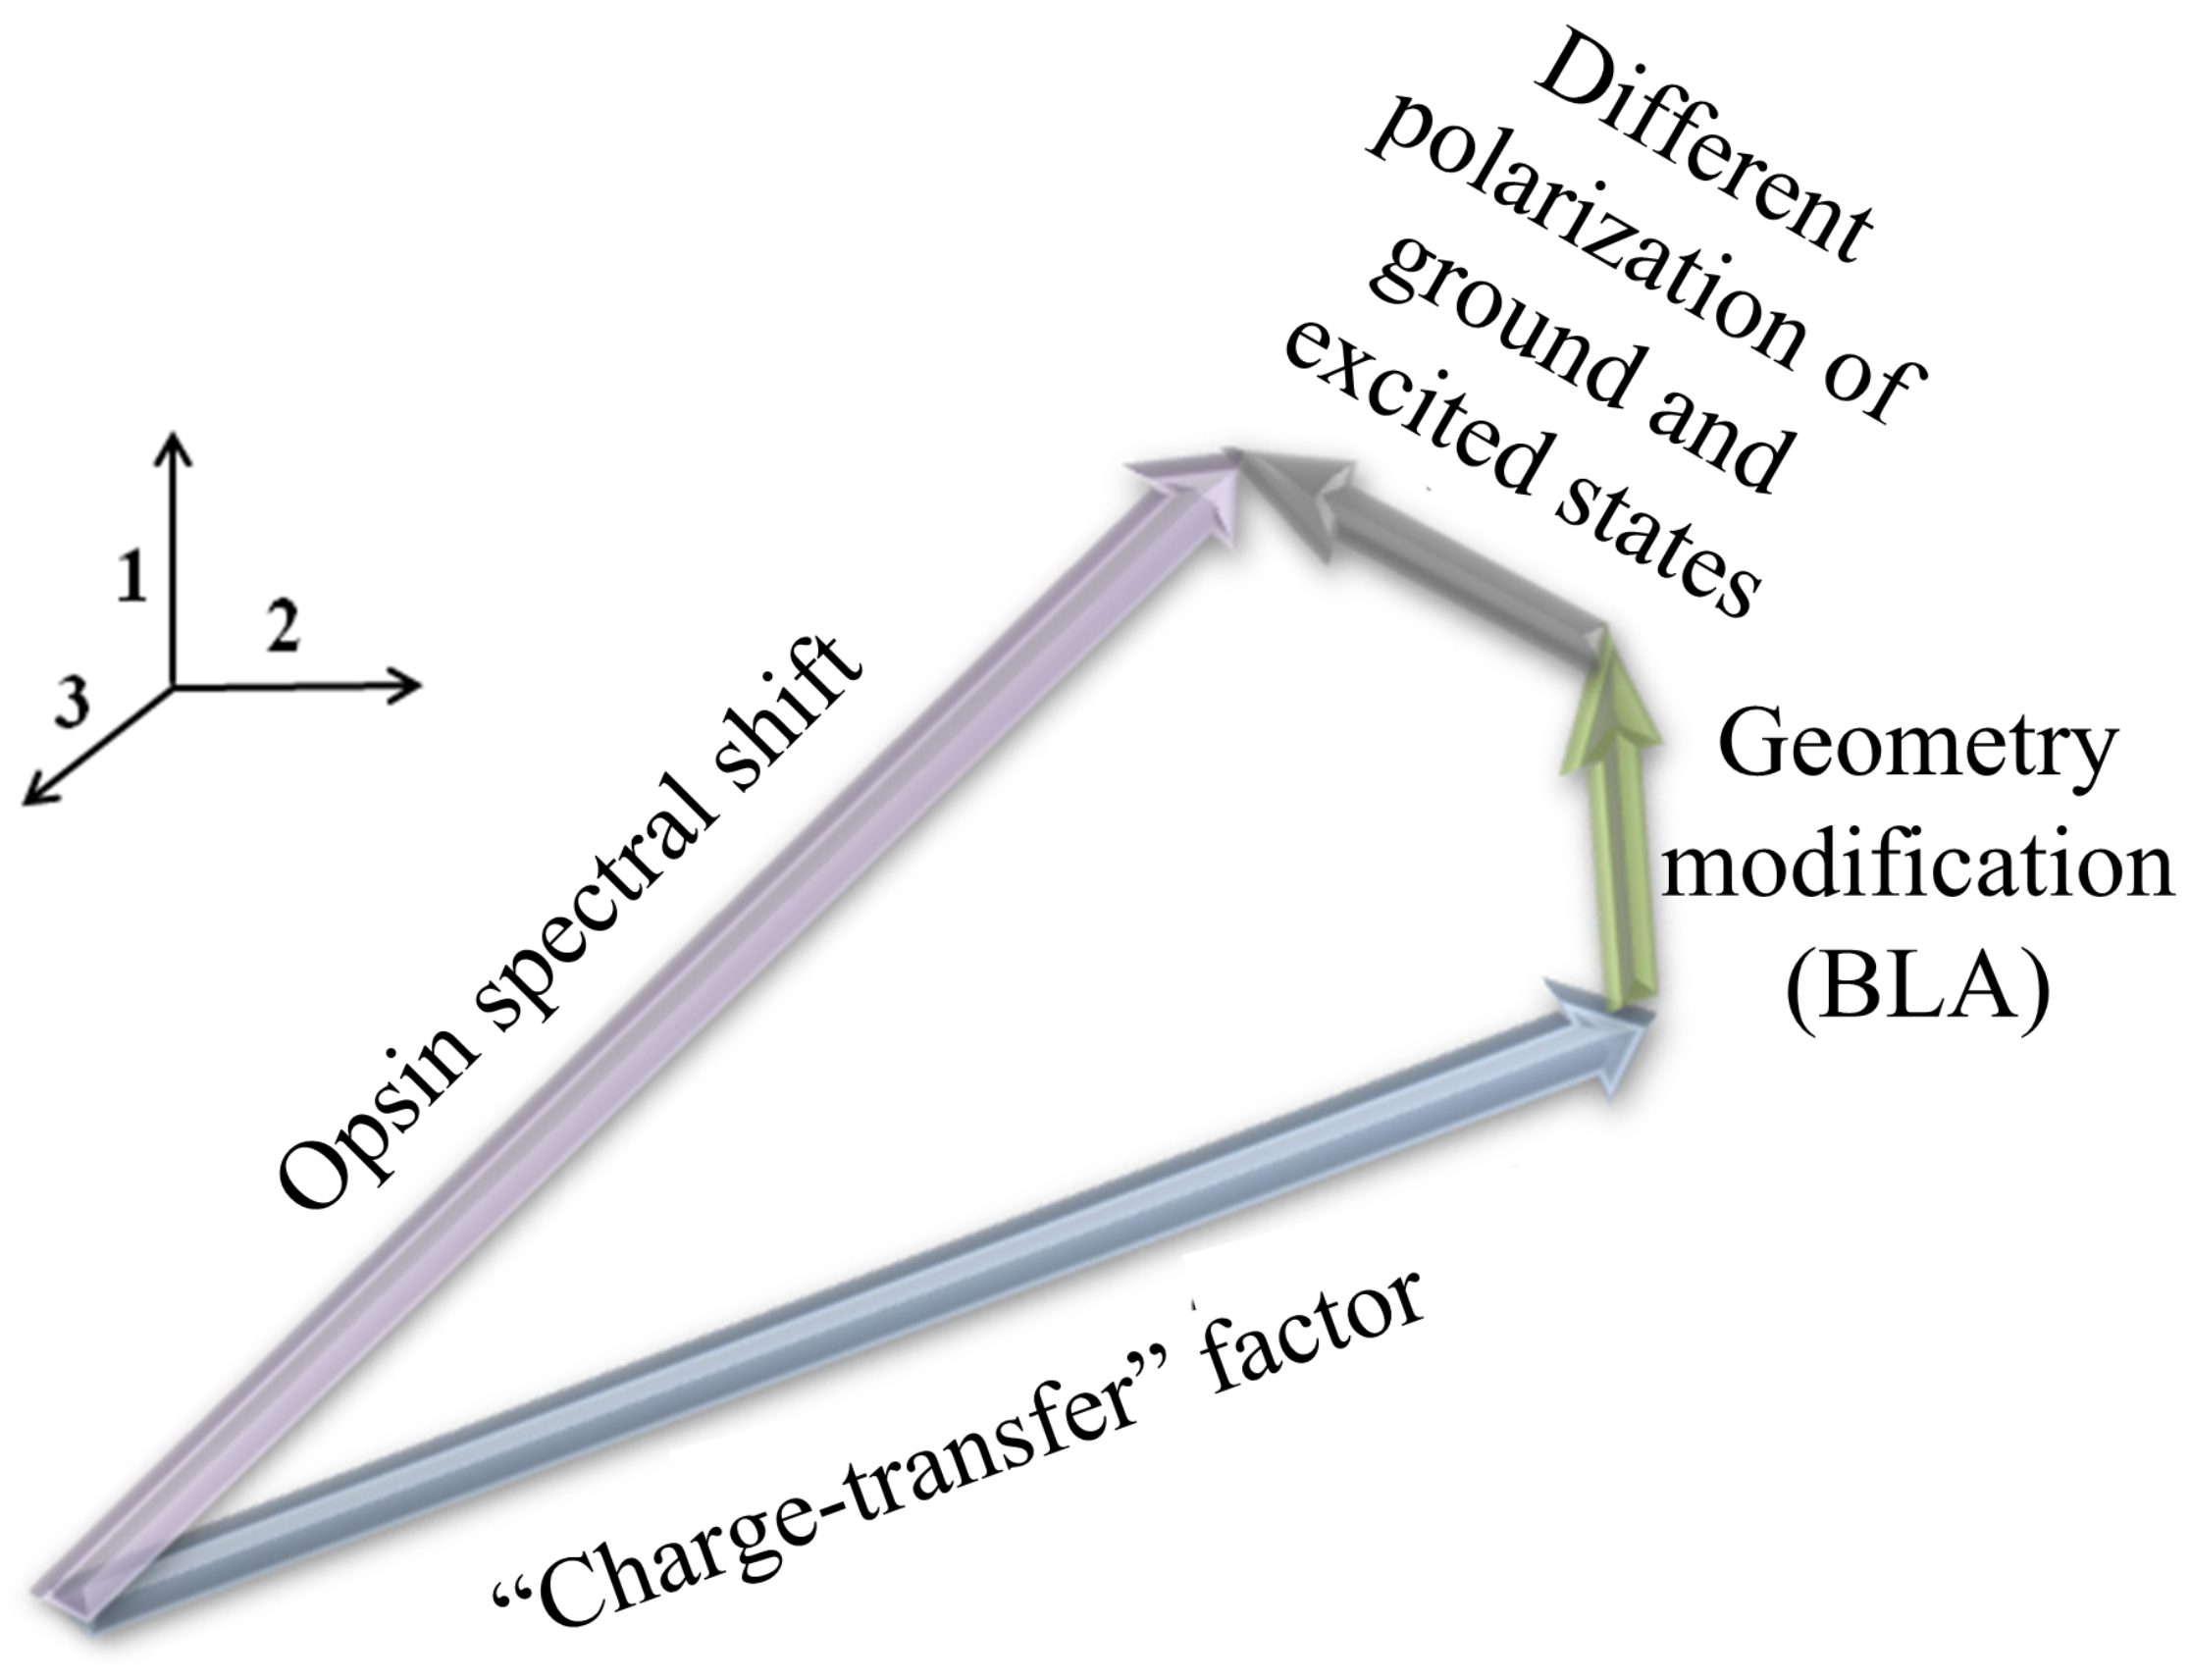
- can be evaluated as the vertical excitation energy of one characteristic snapshot that is close to the Gibbs free energy minimum of the whole protein. Protein dynamics can modify absorption band counters, but it does not affect the position of its maximum significantly.
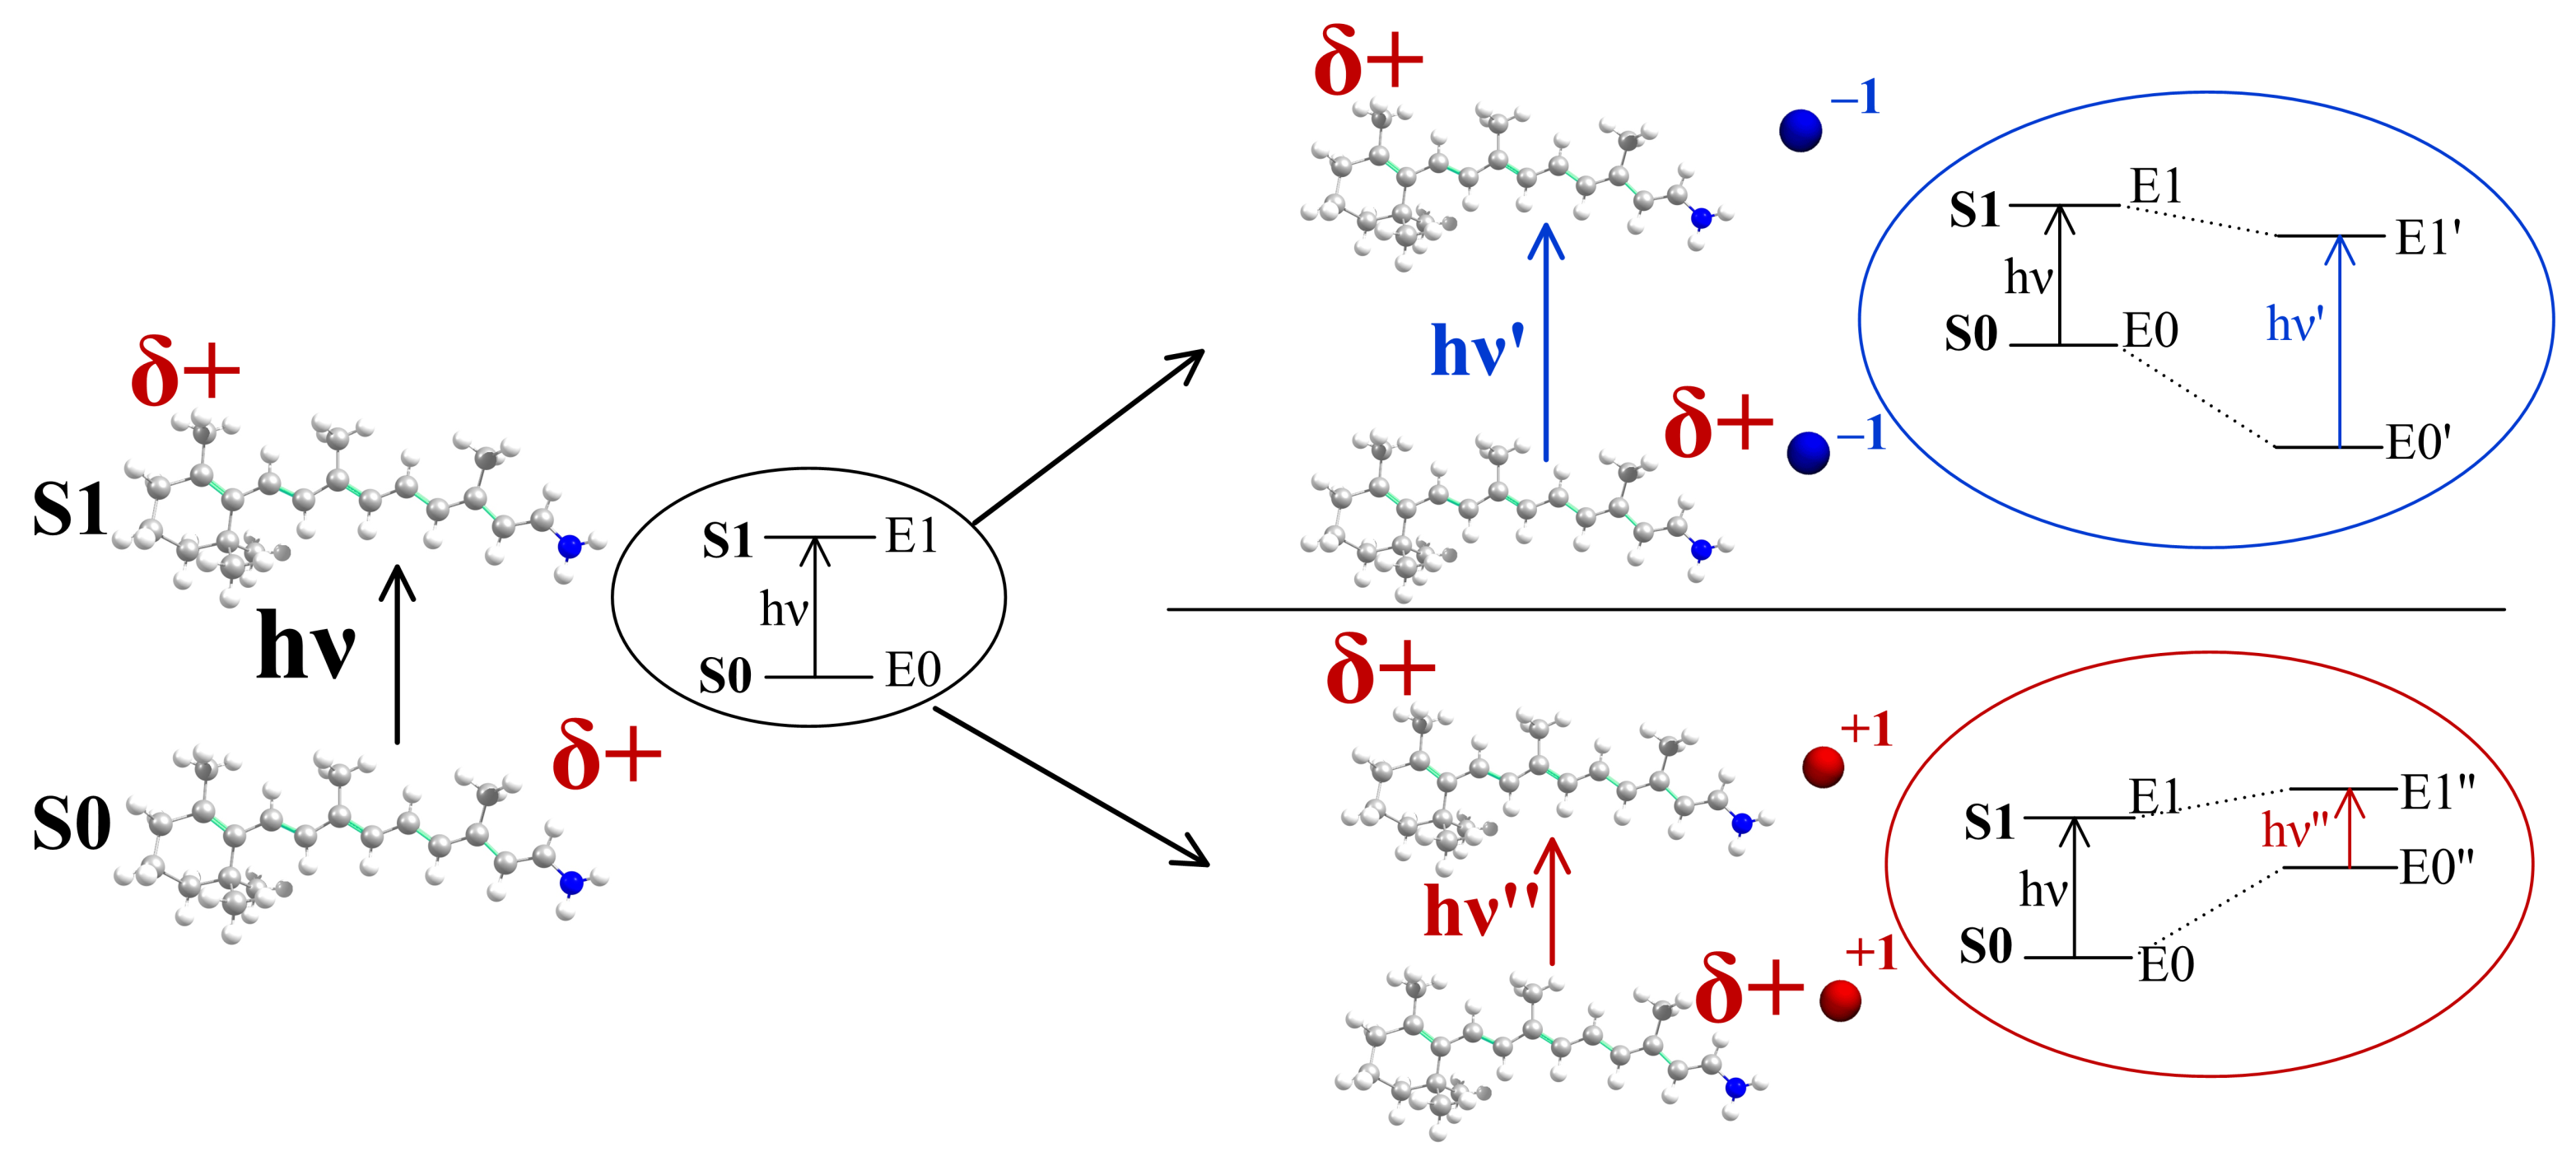
- The impact of a charged residue on is equal to the impact of a unit negative/positive charge located at the center of the charged group of this residue;
- The impact of a polar residue to is equal to the impact of a dipole located at the center of the polar group of the residue.
- If substantial reorganization of the H-bond network does not occur, the impact of each residue on can be treated independently from the rest of the residues; i.e., we assume that all impacts are additive.
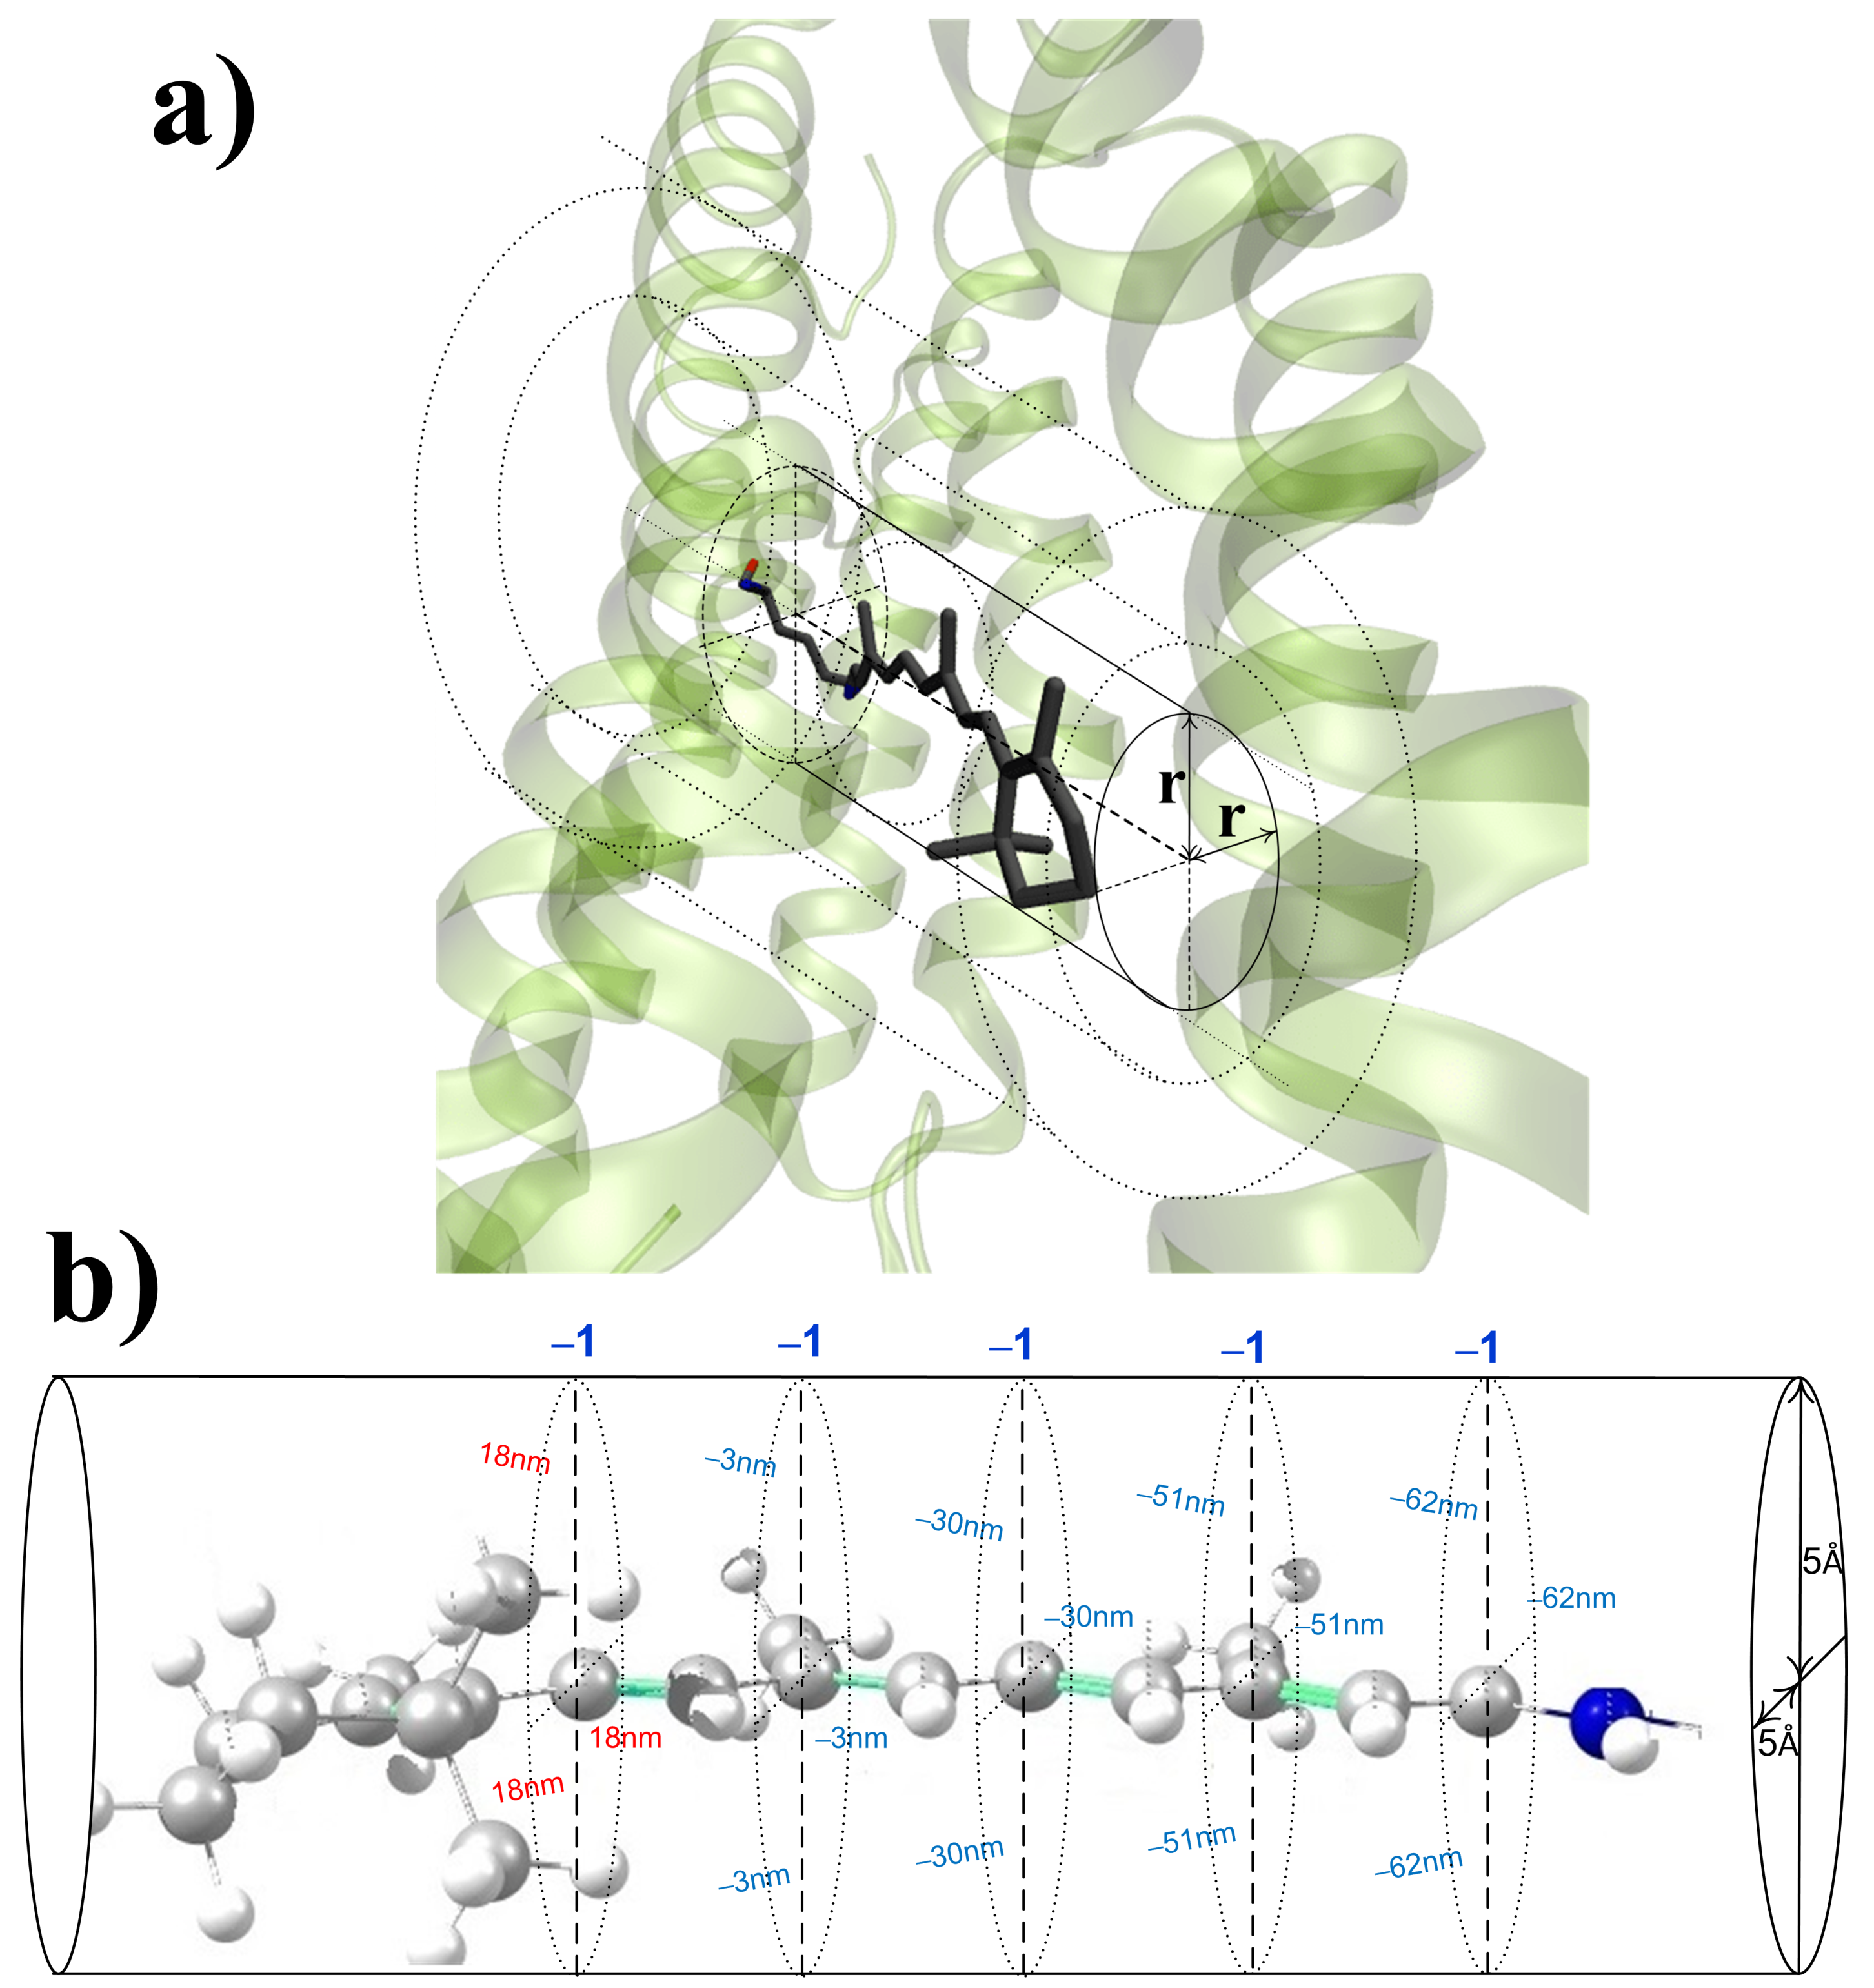
- The impact of a charged/polar residue on depends only on its charge/dipole moment and its distance to/orientation along the chromophore axis (see Figure 1). For charges, this “cylindrical” symmetry allows for reducing a four-dimensional function = f (three Cartesian coordinates for a charge location) to a simpler three-dimensional function = f(two Cartesian coordinates for a charge location). For polar residues, an additional argument, which describes the orientation of the dipole moment relative to the chromophore axis, should be added.
- Although the electrostatic field always modifies a chromophore geometry by alternate changing of the length of double and single bonds, the effect of this geometry change on can be neglected.
2.2. Models to Evaluate the Direct Electrostatic Effect of Charged Residues
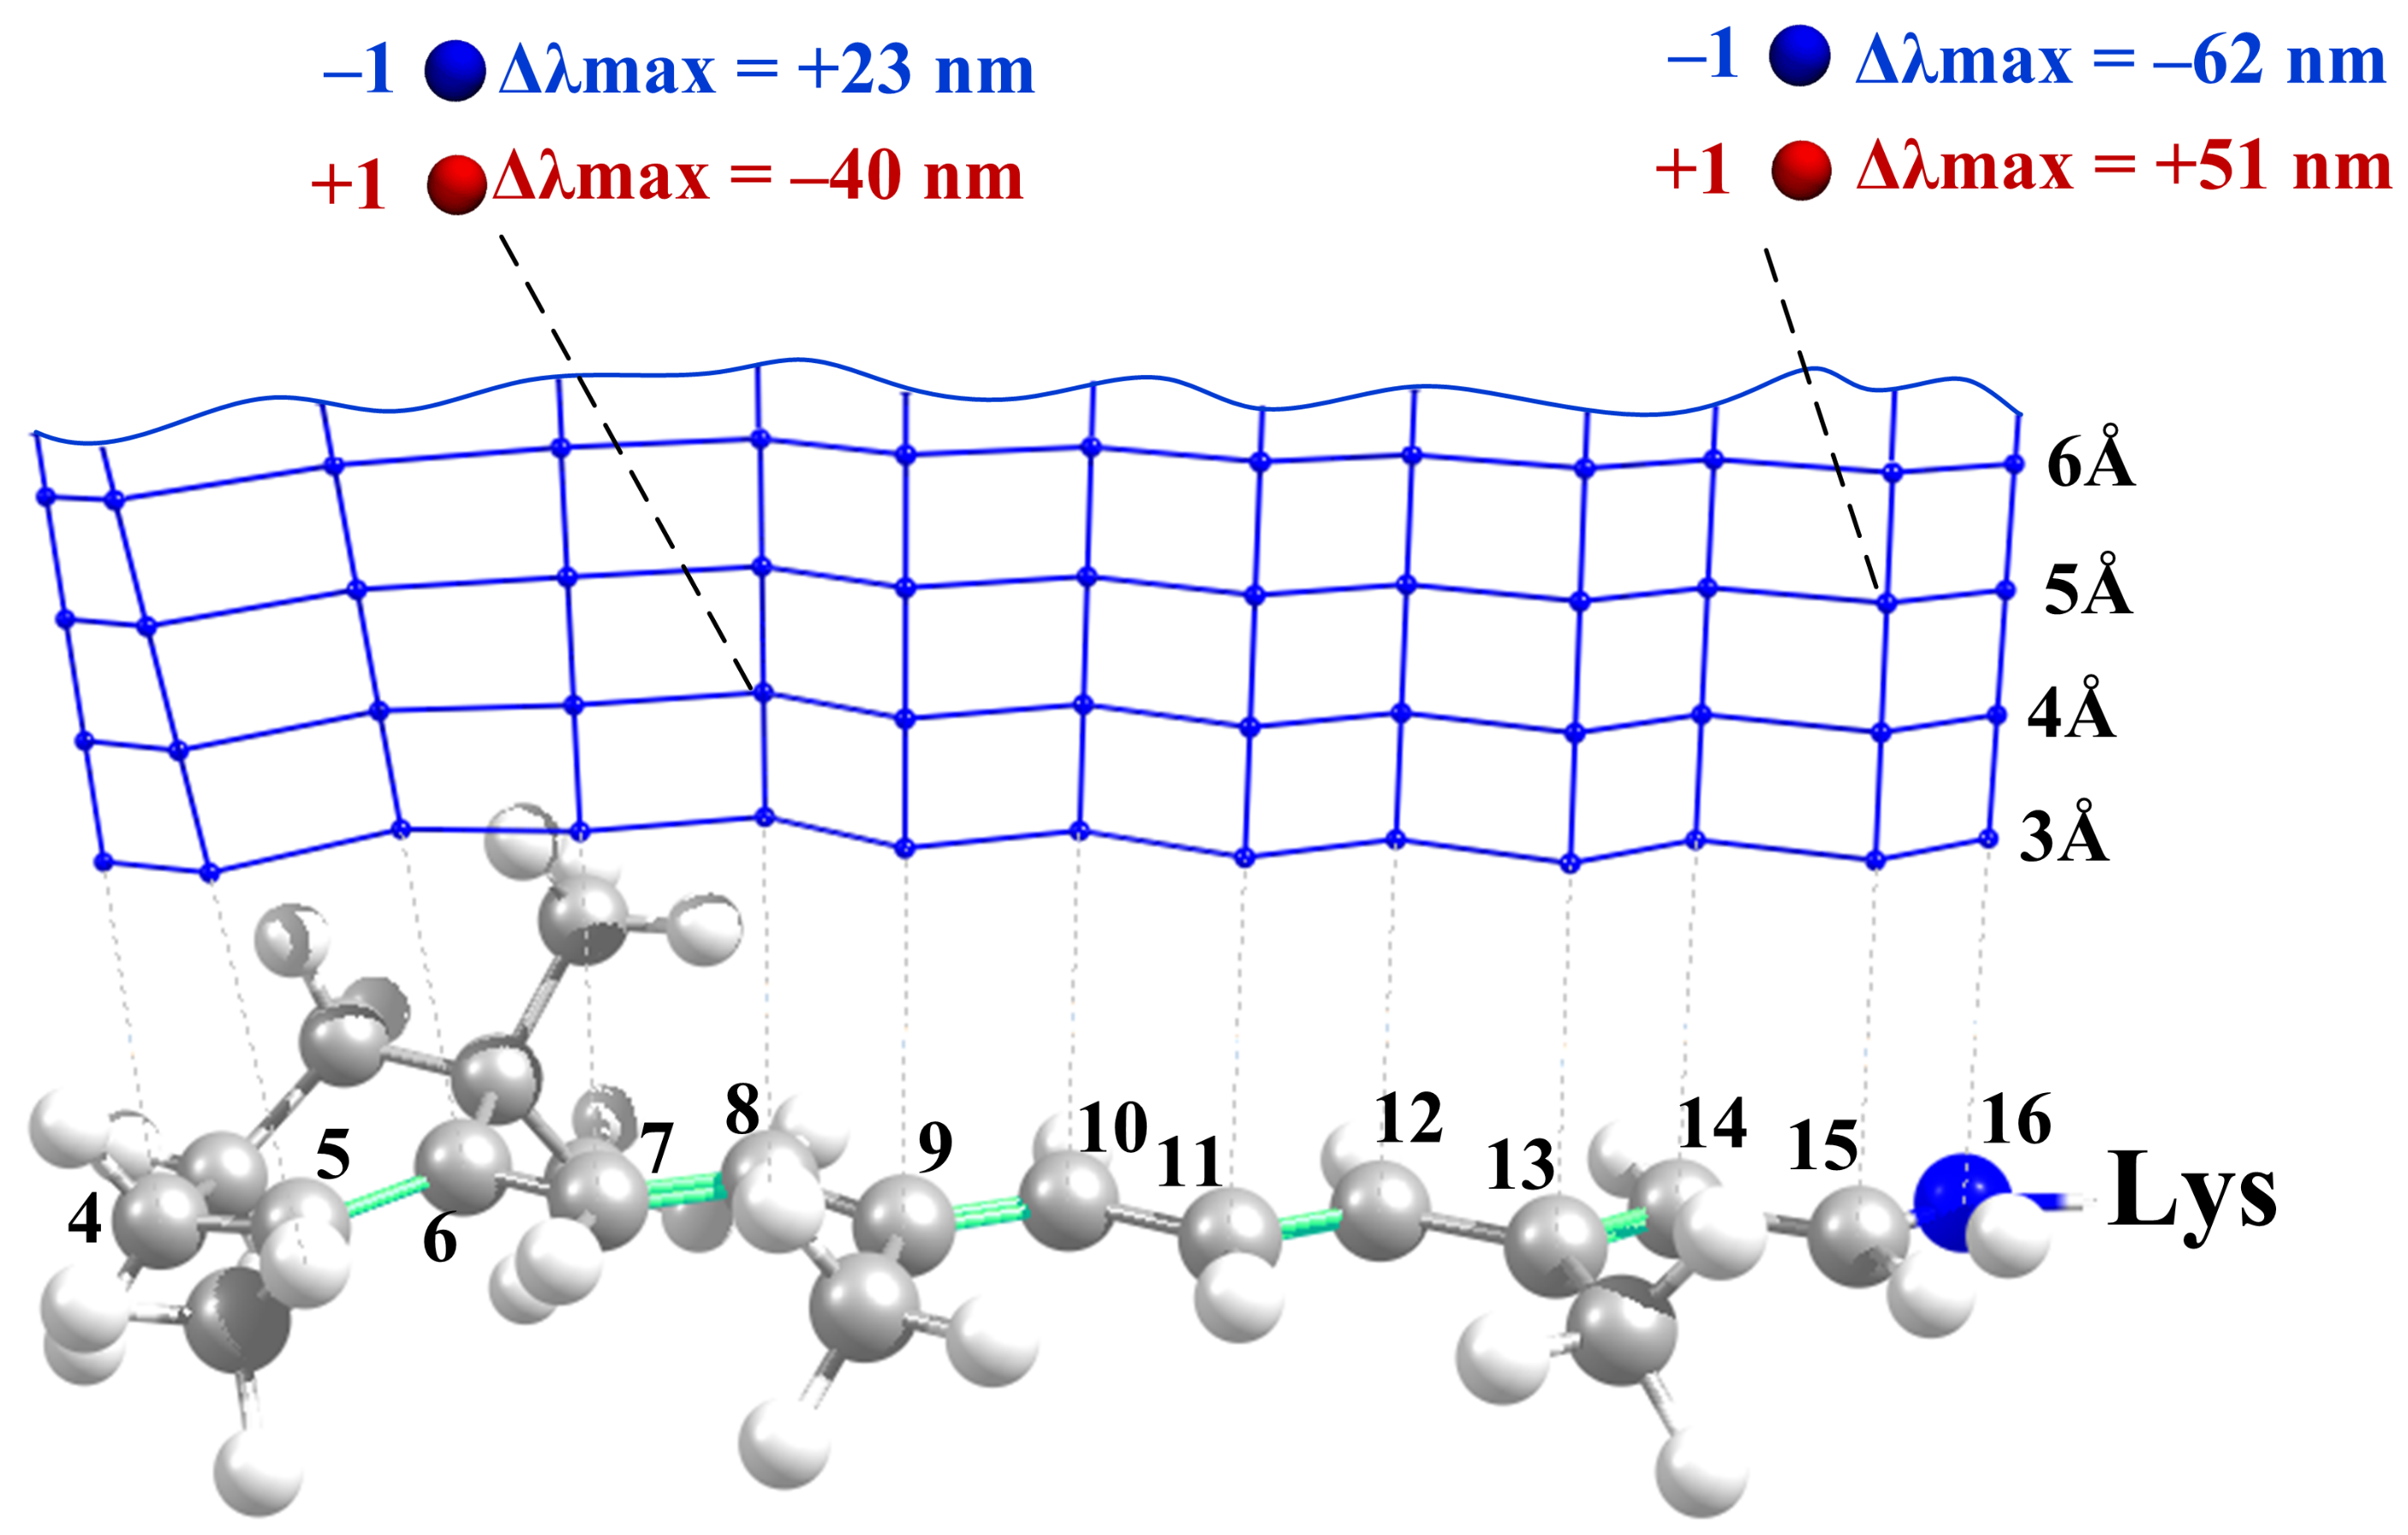
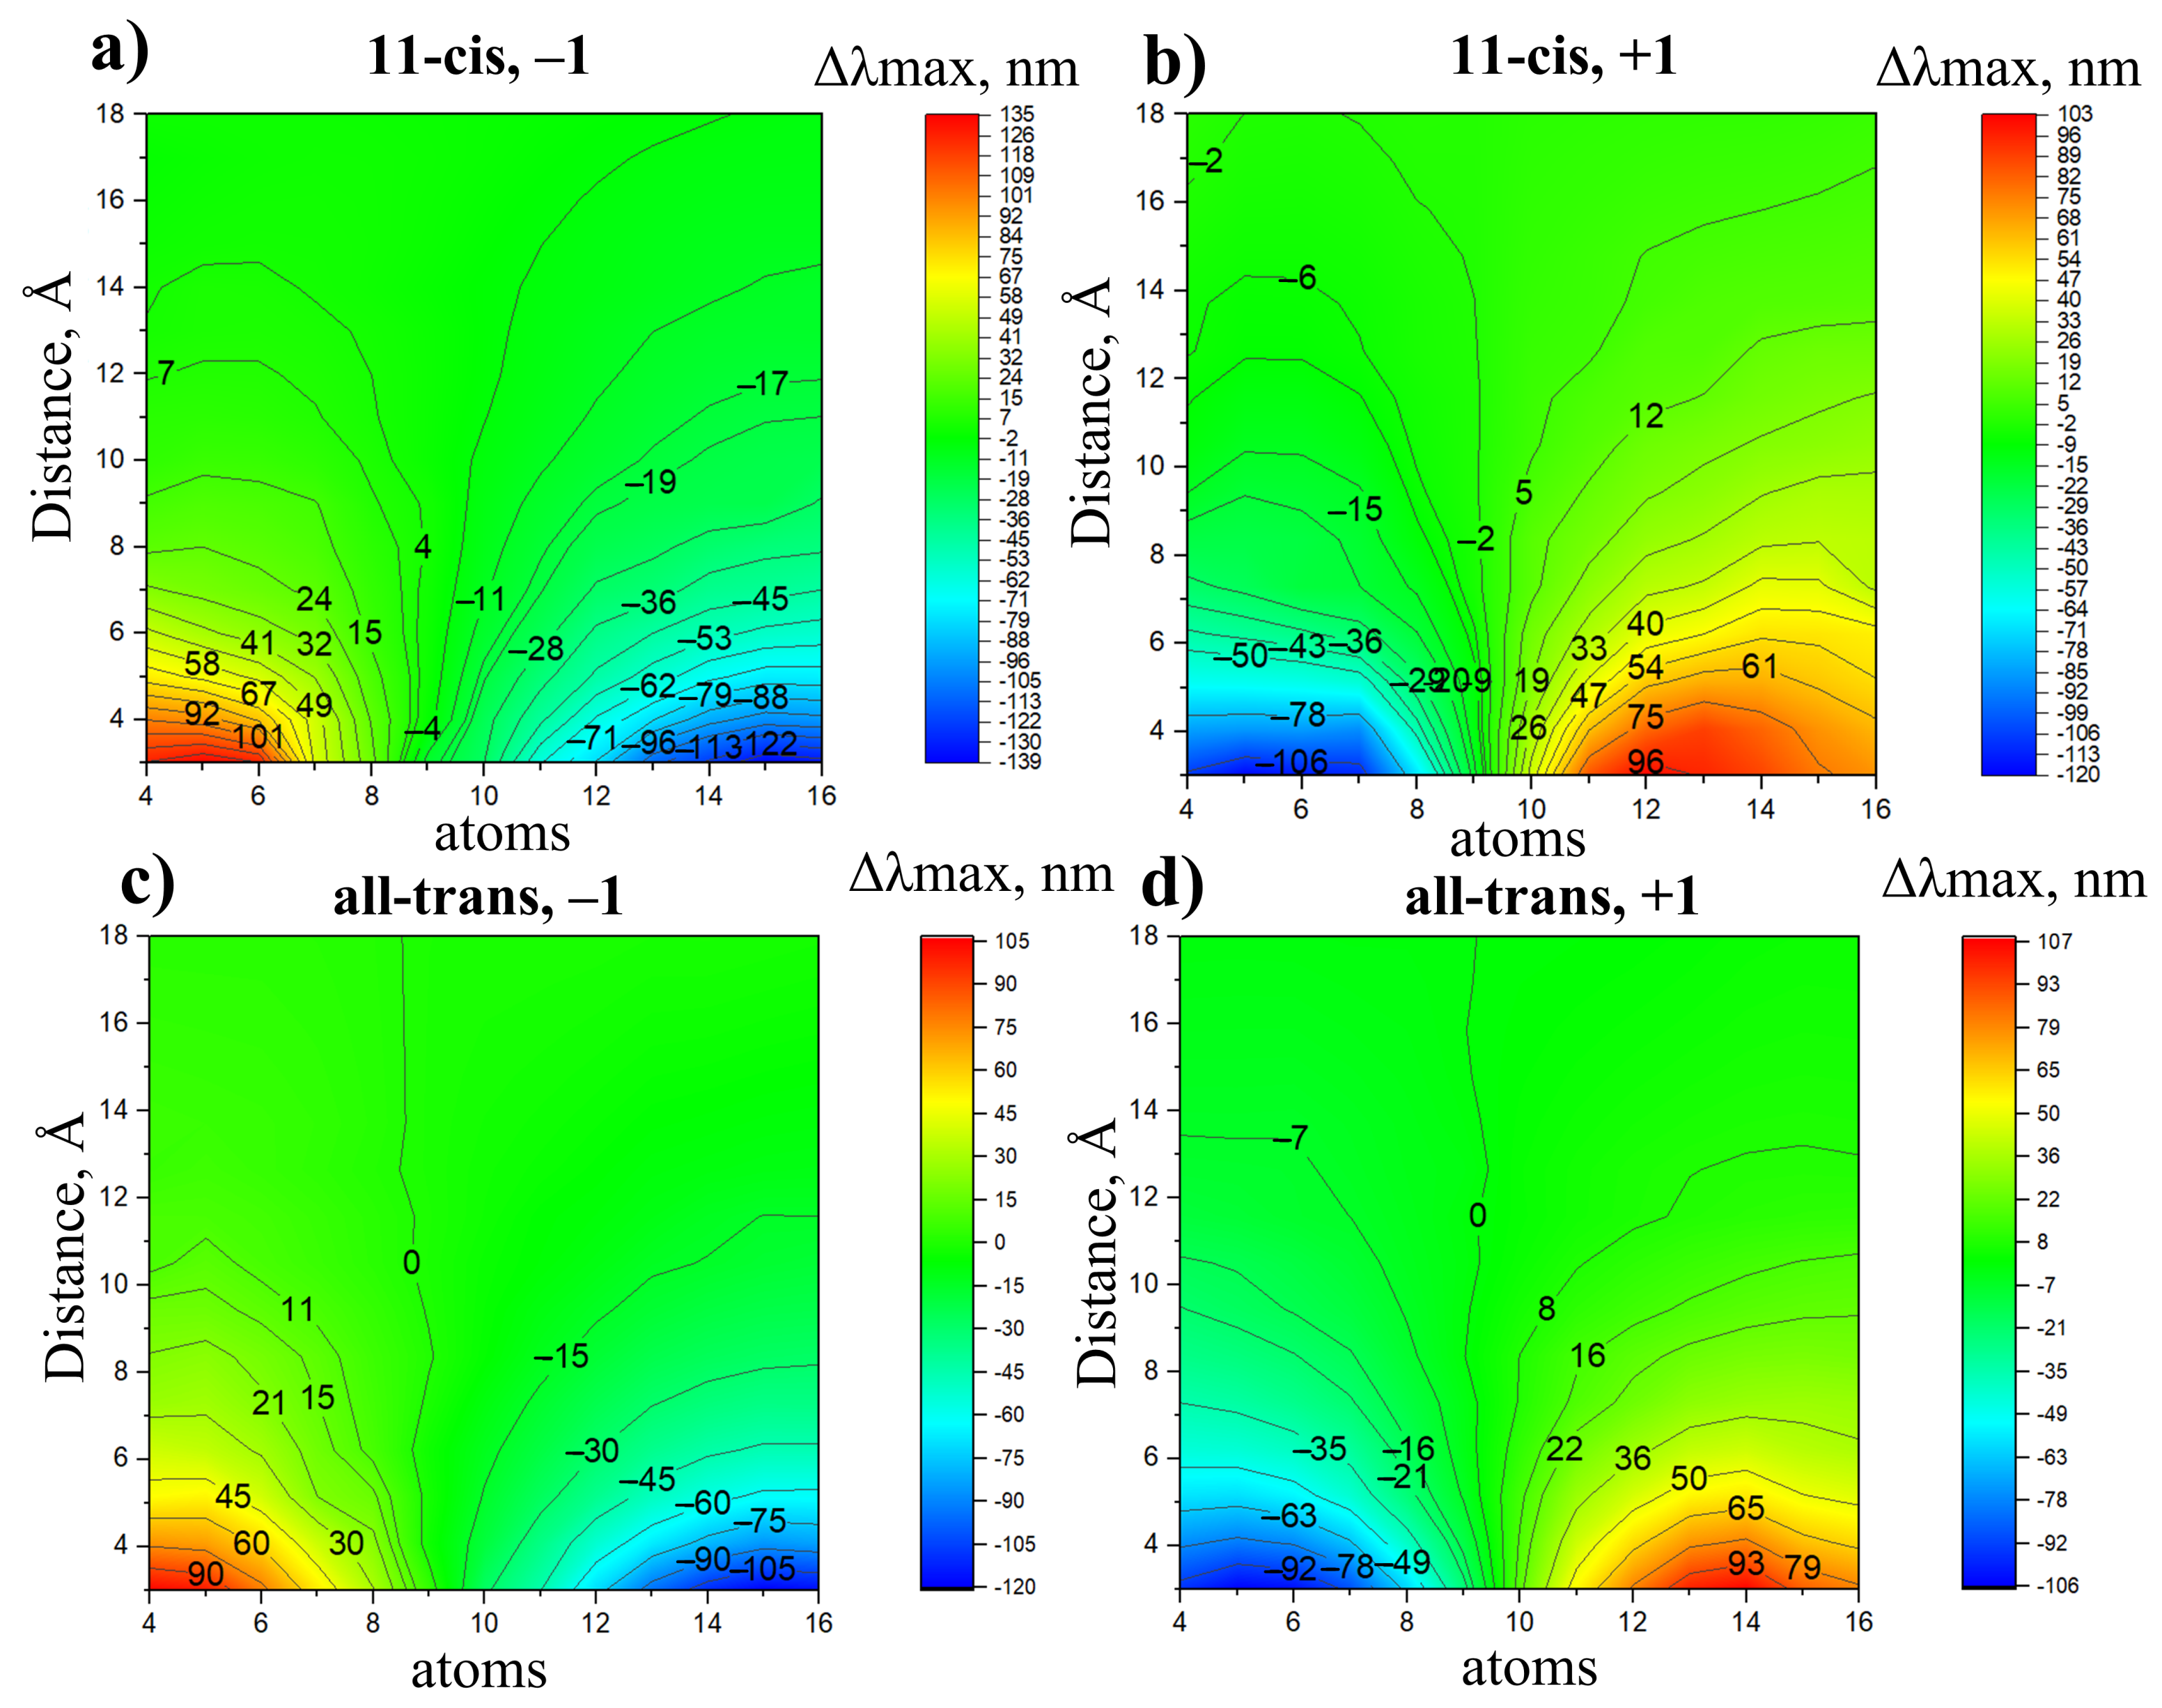
- The effect of a charged residue on depends on (a) the sign of the charge and (b) the distance from the charge to the closest atom of the retinal.
- A negative charge located in the NH region causes a blue shift; a negative charge located in the -ionone ring region causes a red shift.
- On the contrary, a positive charge located in the NH region causes a red shift; a positive charge located in the -ionone ring region causes a blue shift.
- The charges that are closer to the ends of the chromophore (atoms N, C, C, and C) cause larger shifts, while the charges that are close to the middle of the chromophore (atoms C, C, and C) cause smaller shifts.
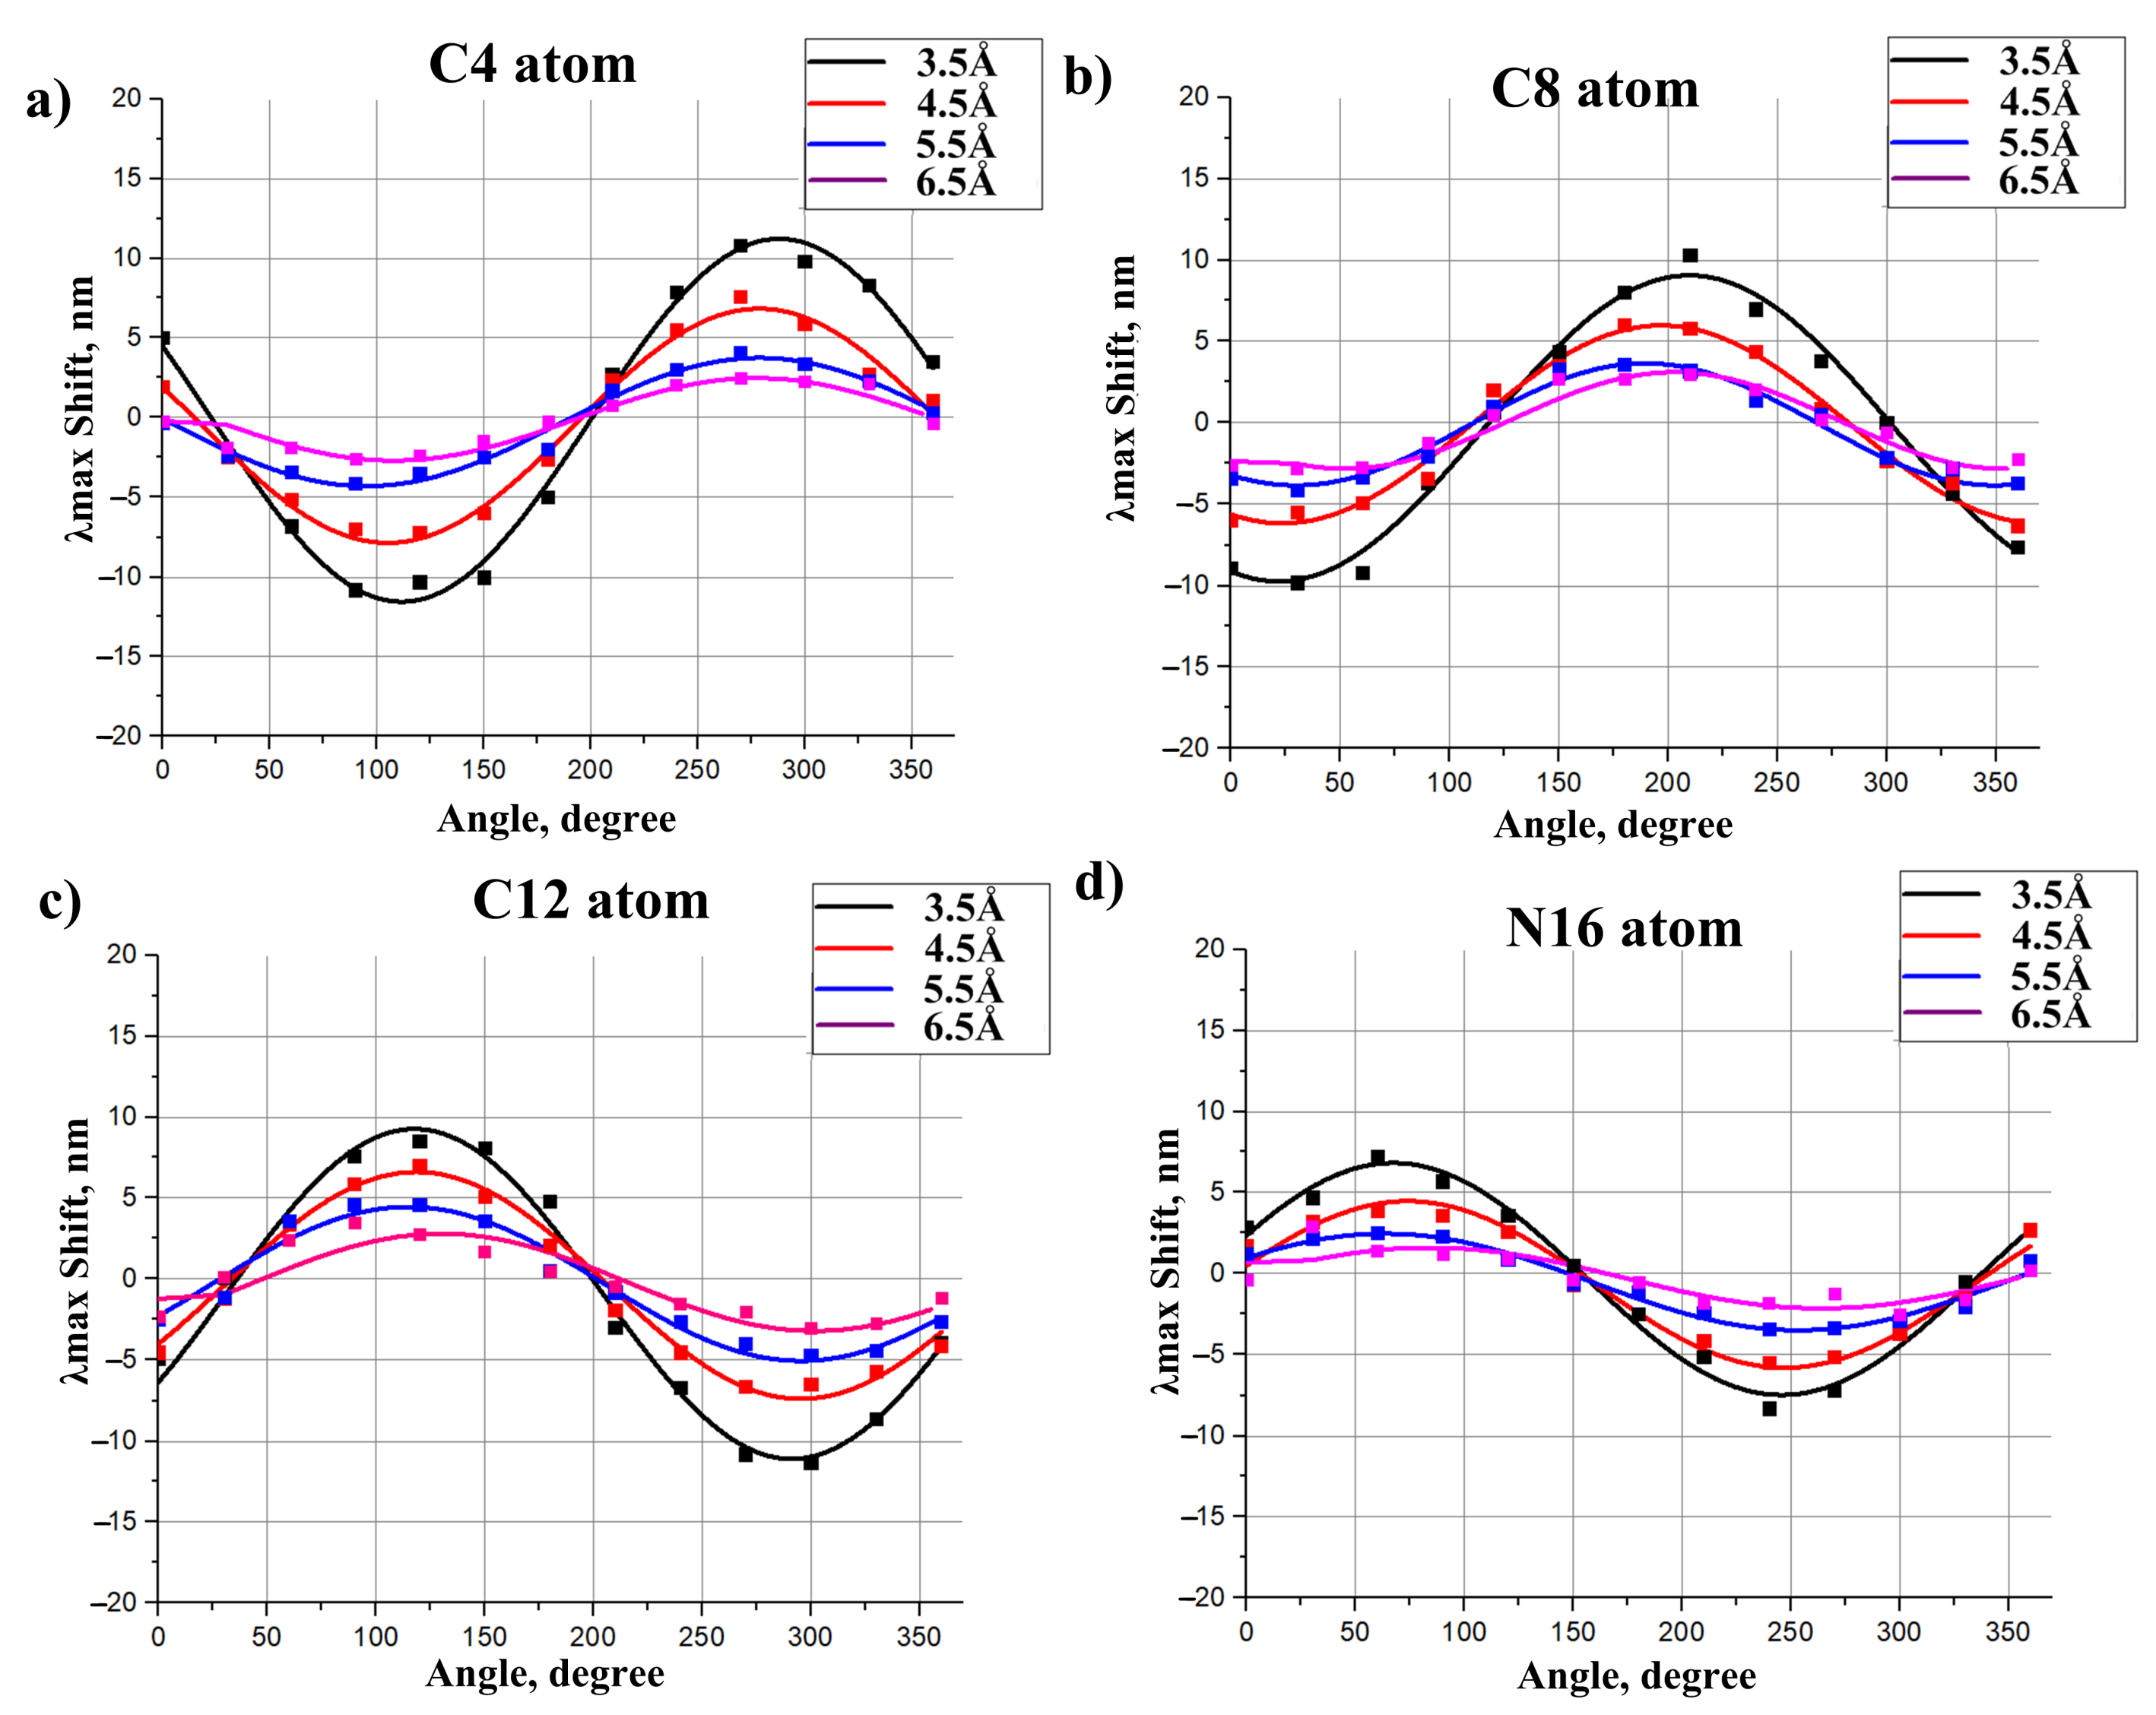
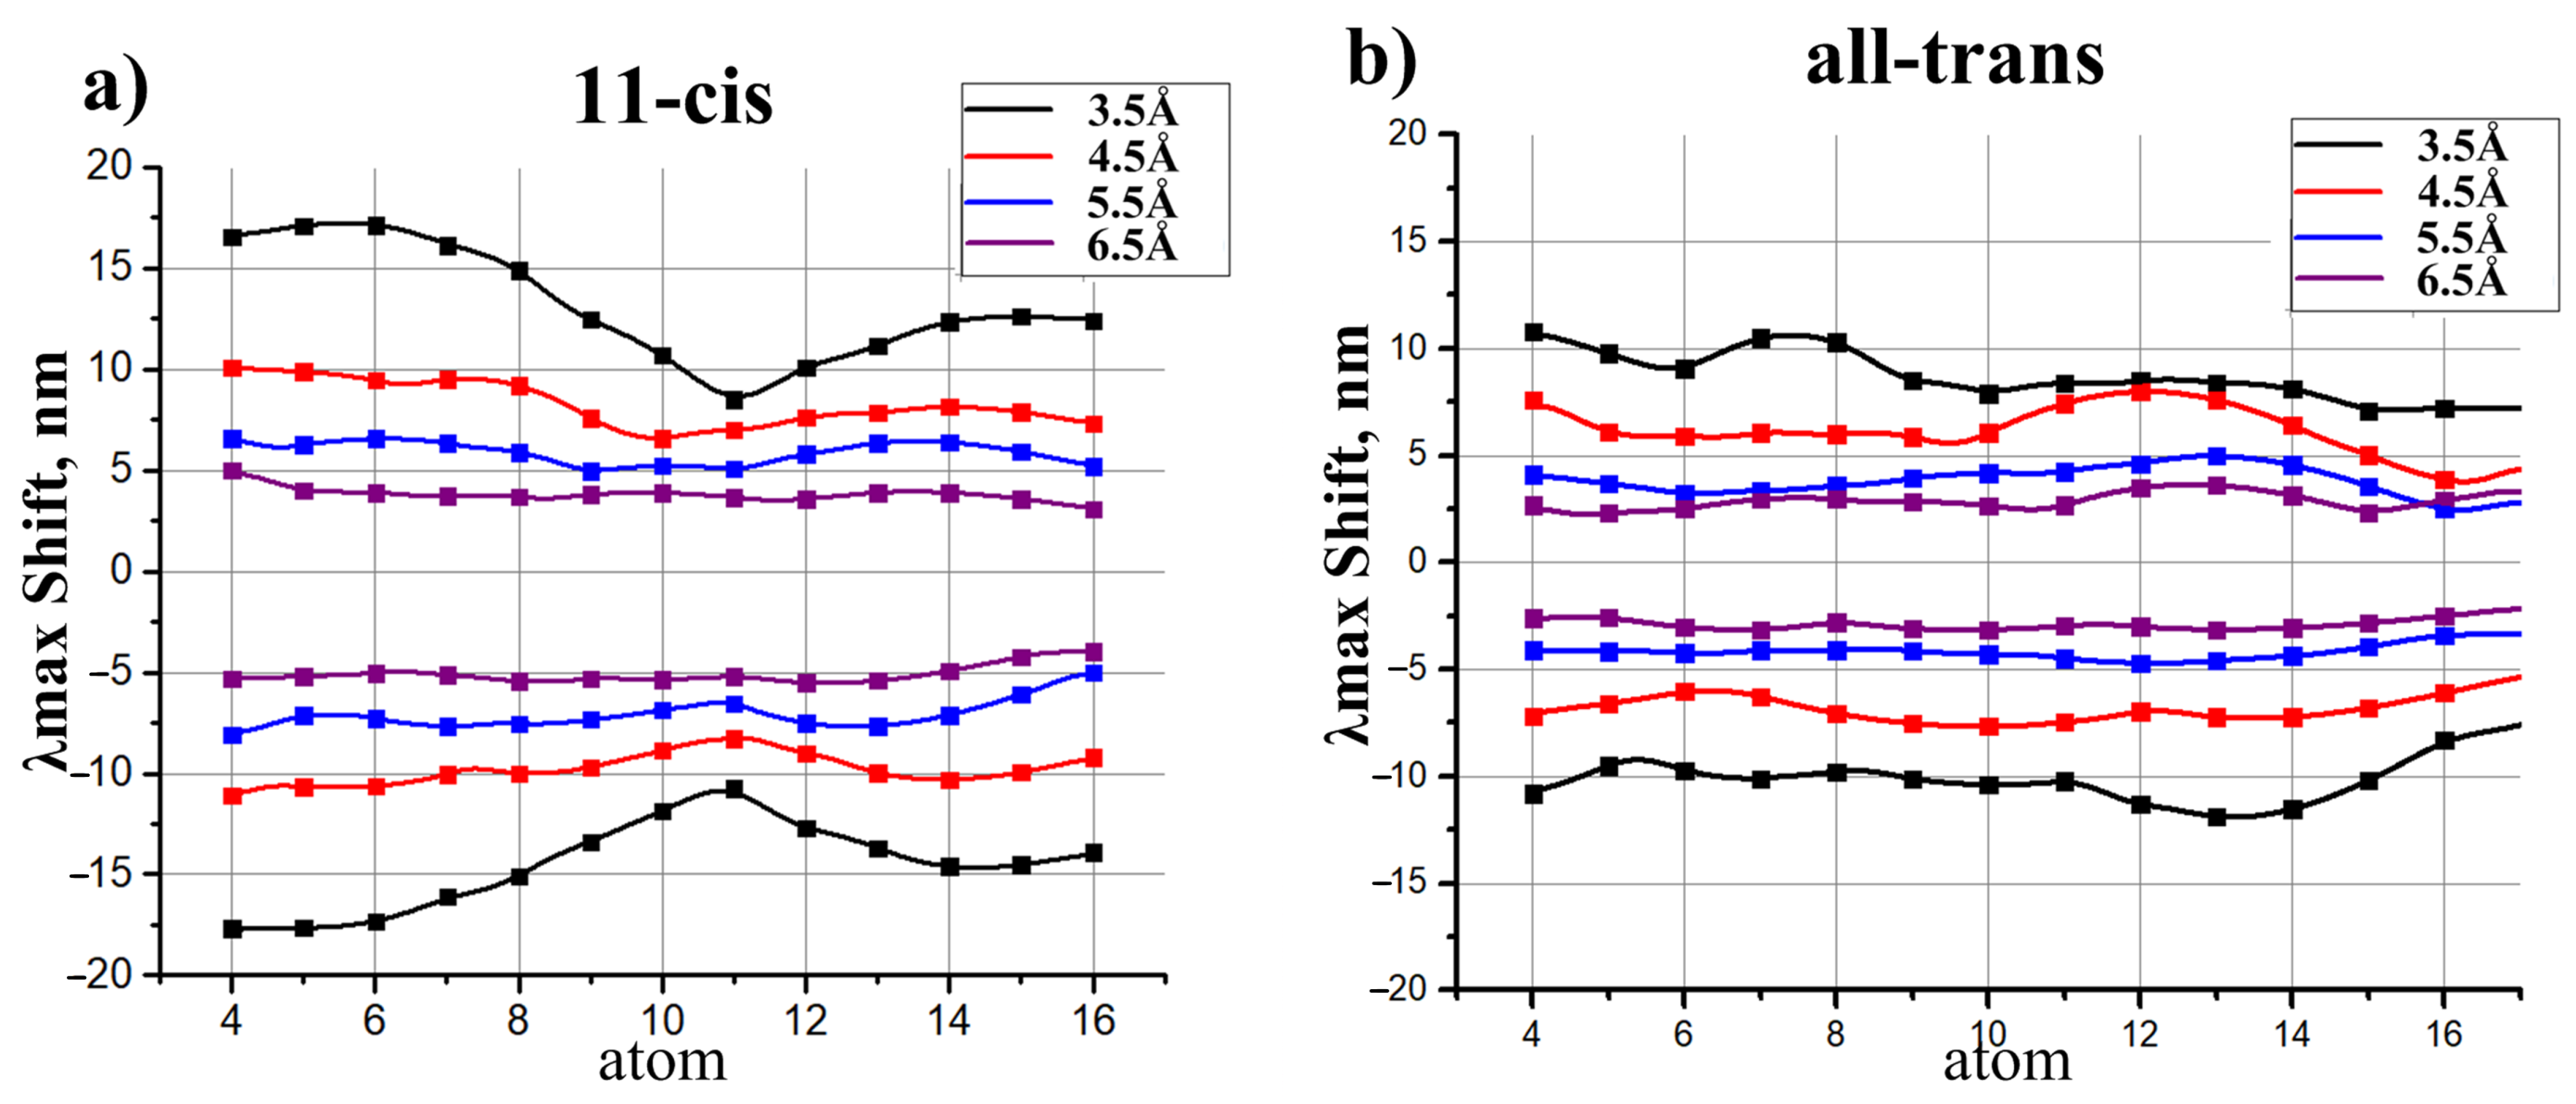
2.3. Models to Evaluate the Direct Electrostatic Effect of Polar Residues
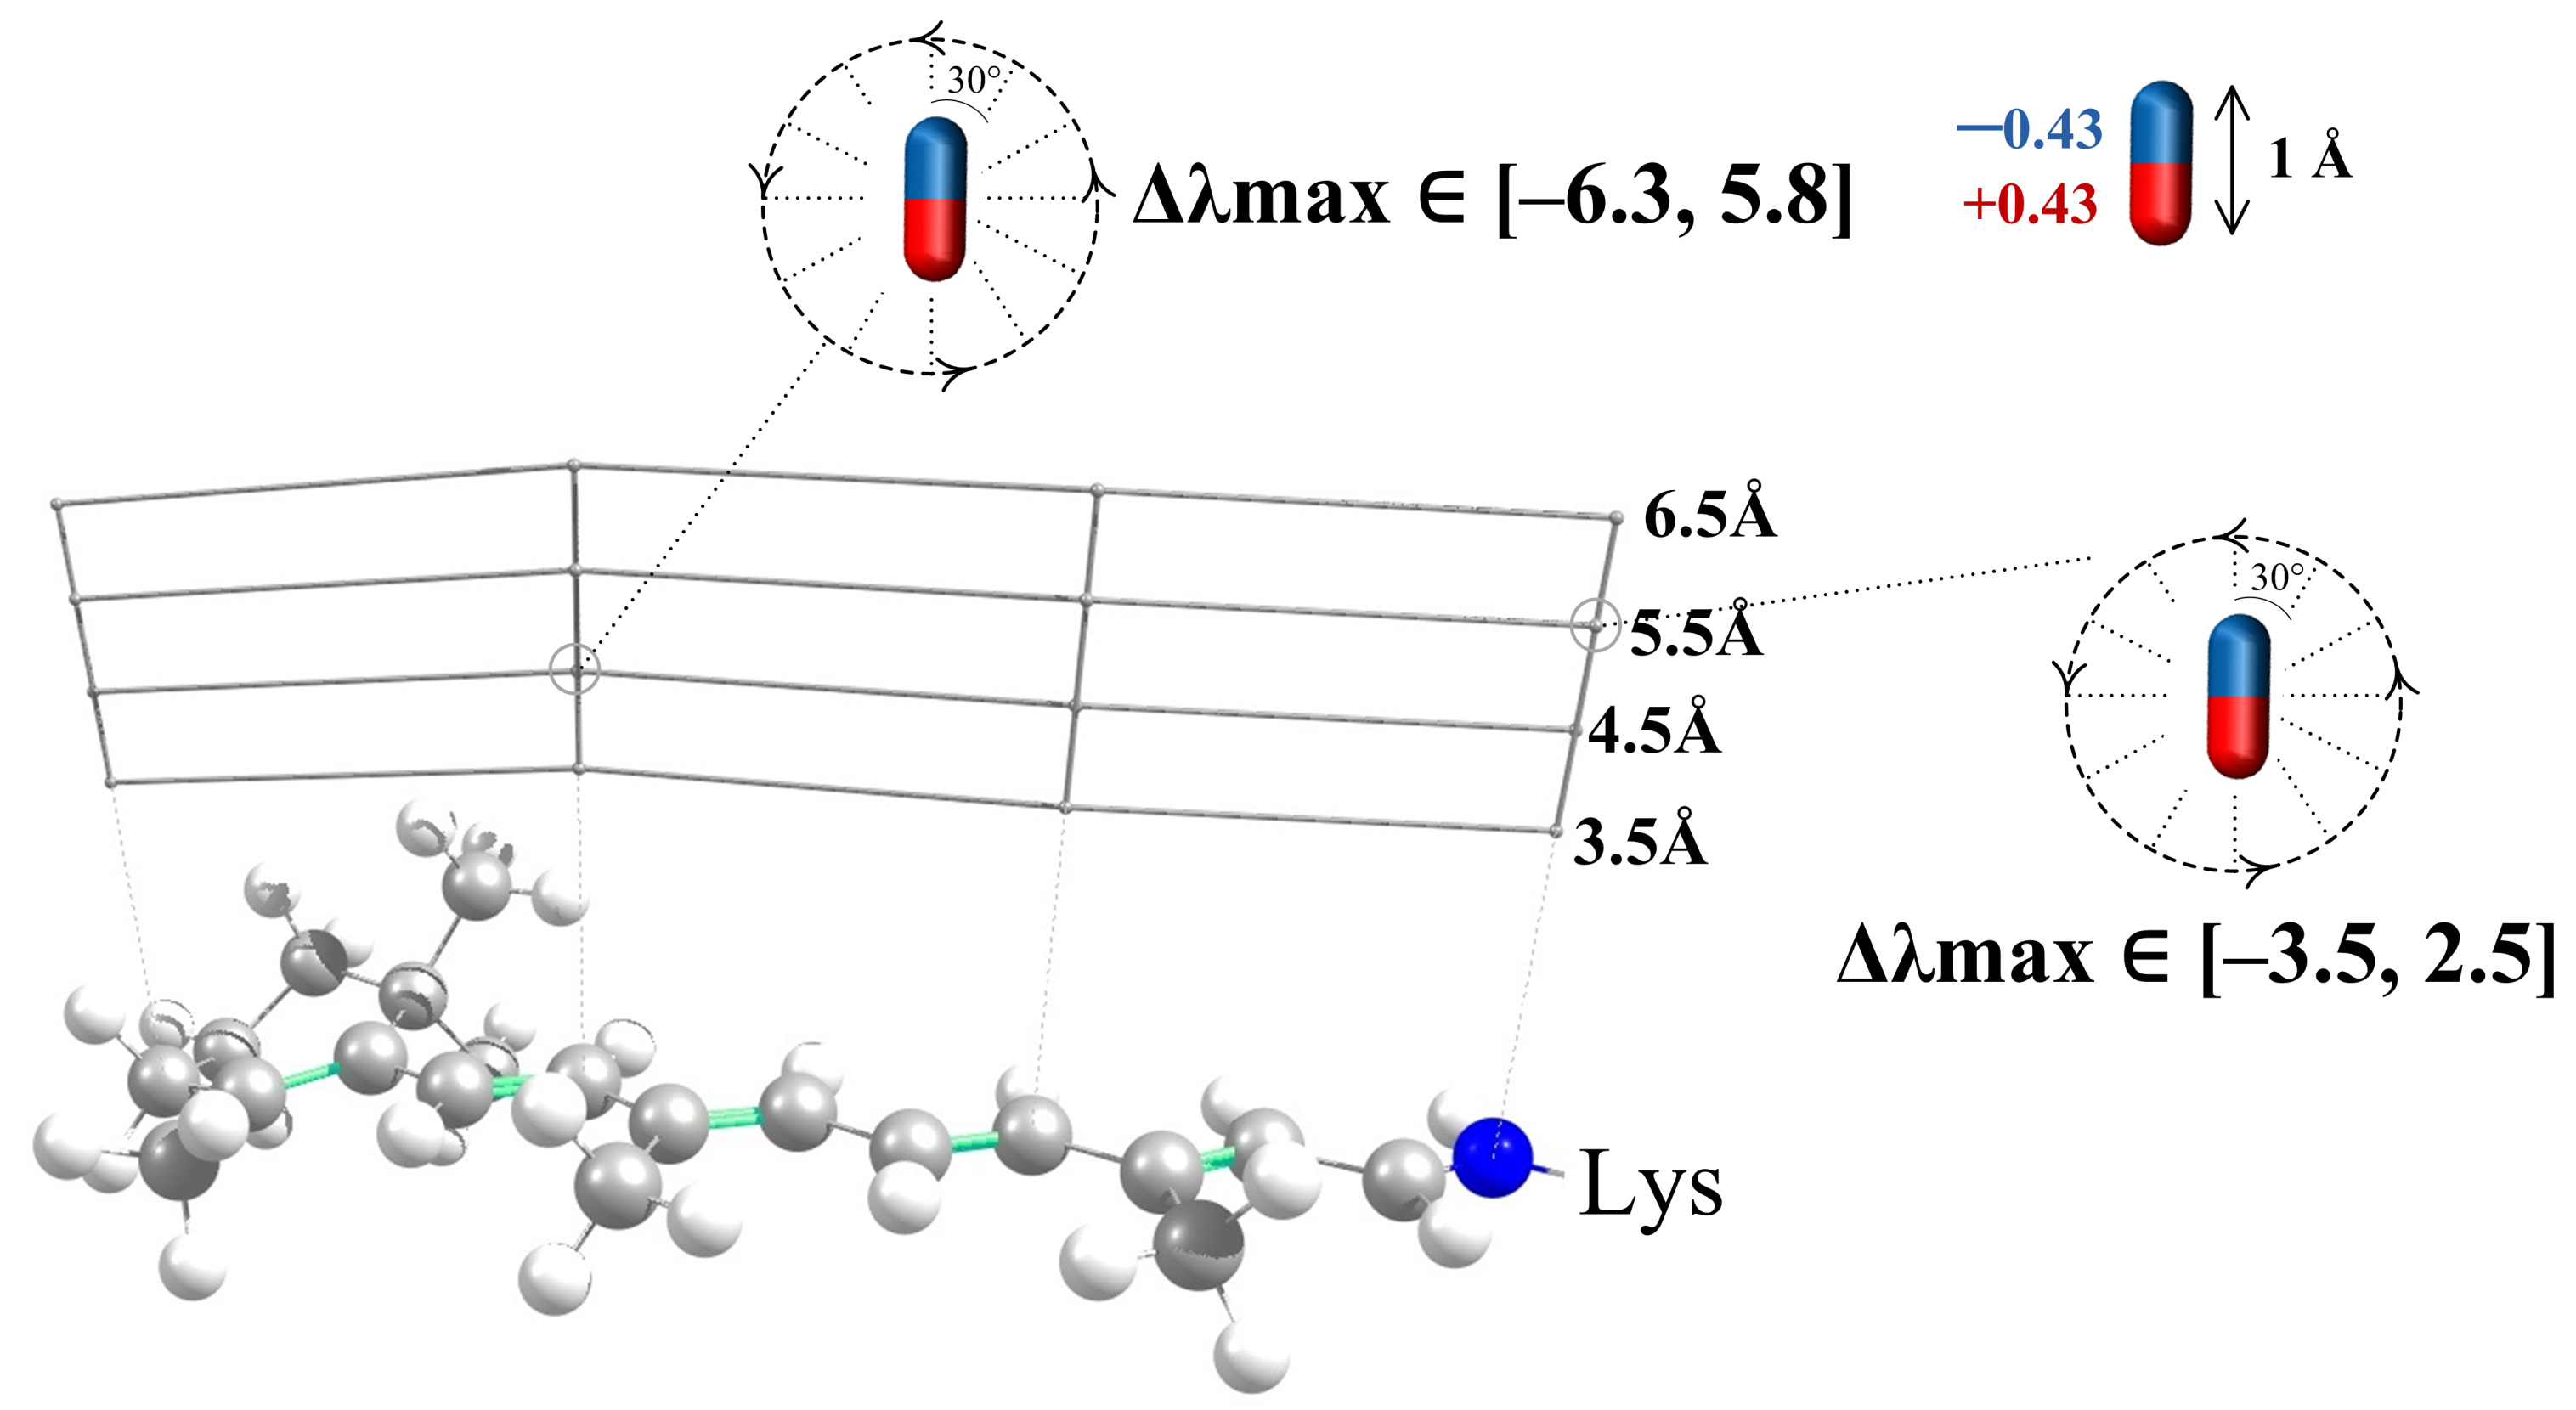
- The effect of polar residues located further than 6–7 Å from the PSB can be neglected.
- The impact of a polar residue on is determined not only by the distance from the polar group of the residue to a given atom of the chromophore, as it is for charged residues, but also by the orientation of a polar group relative to the chromophore.
- ranges from a negative value (for example, −9 nm for a dipole situated at 4.5 Å from an atom of 11-cis PSB) to zero and then to a positive value (+7.5 nm for this dipole). Therefore, to estimate the effect of a polar residue on the rhodopsin absorption maximum, accurate structural information is required.
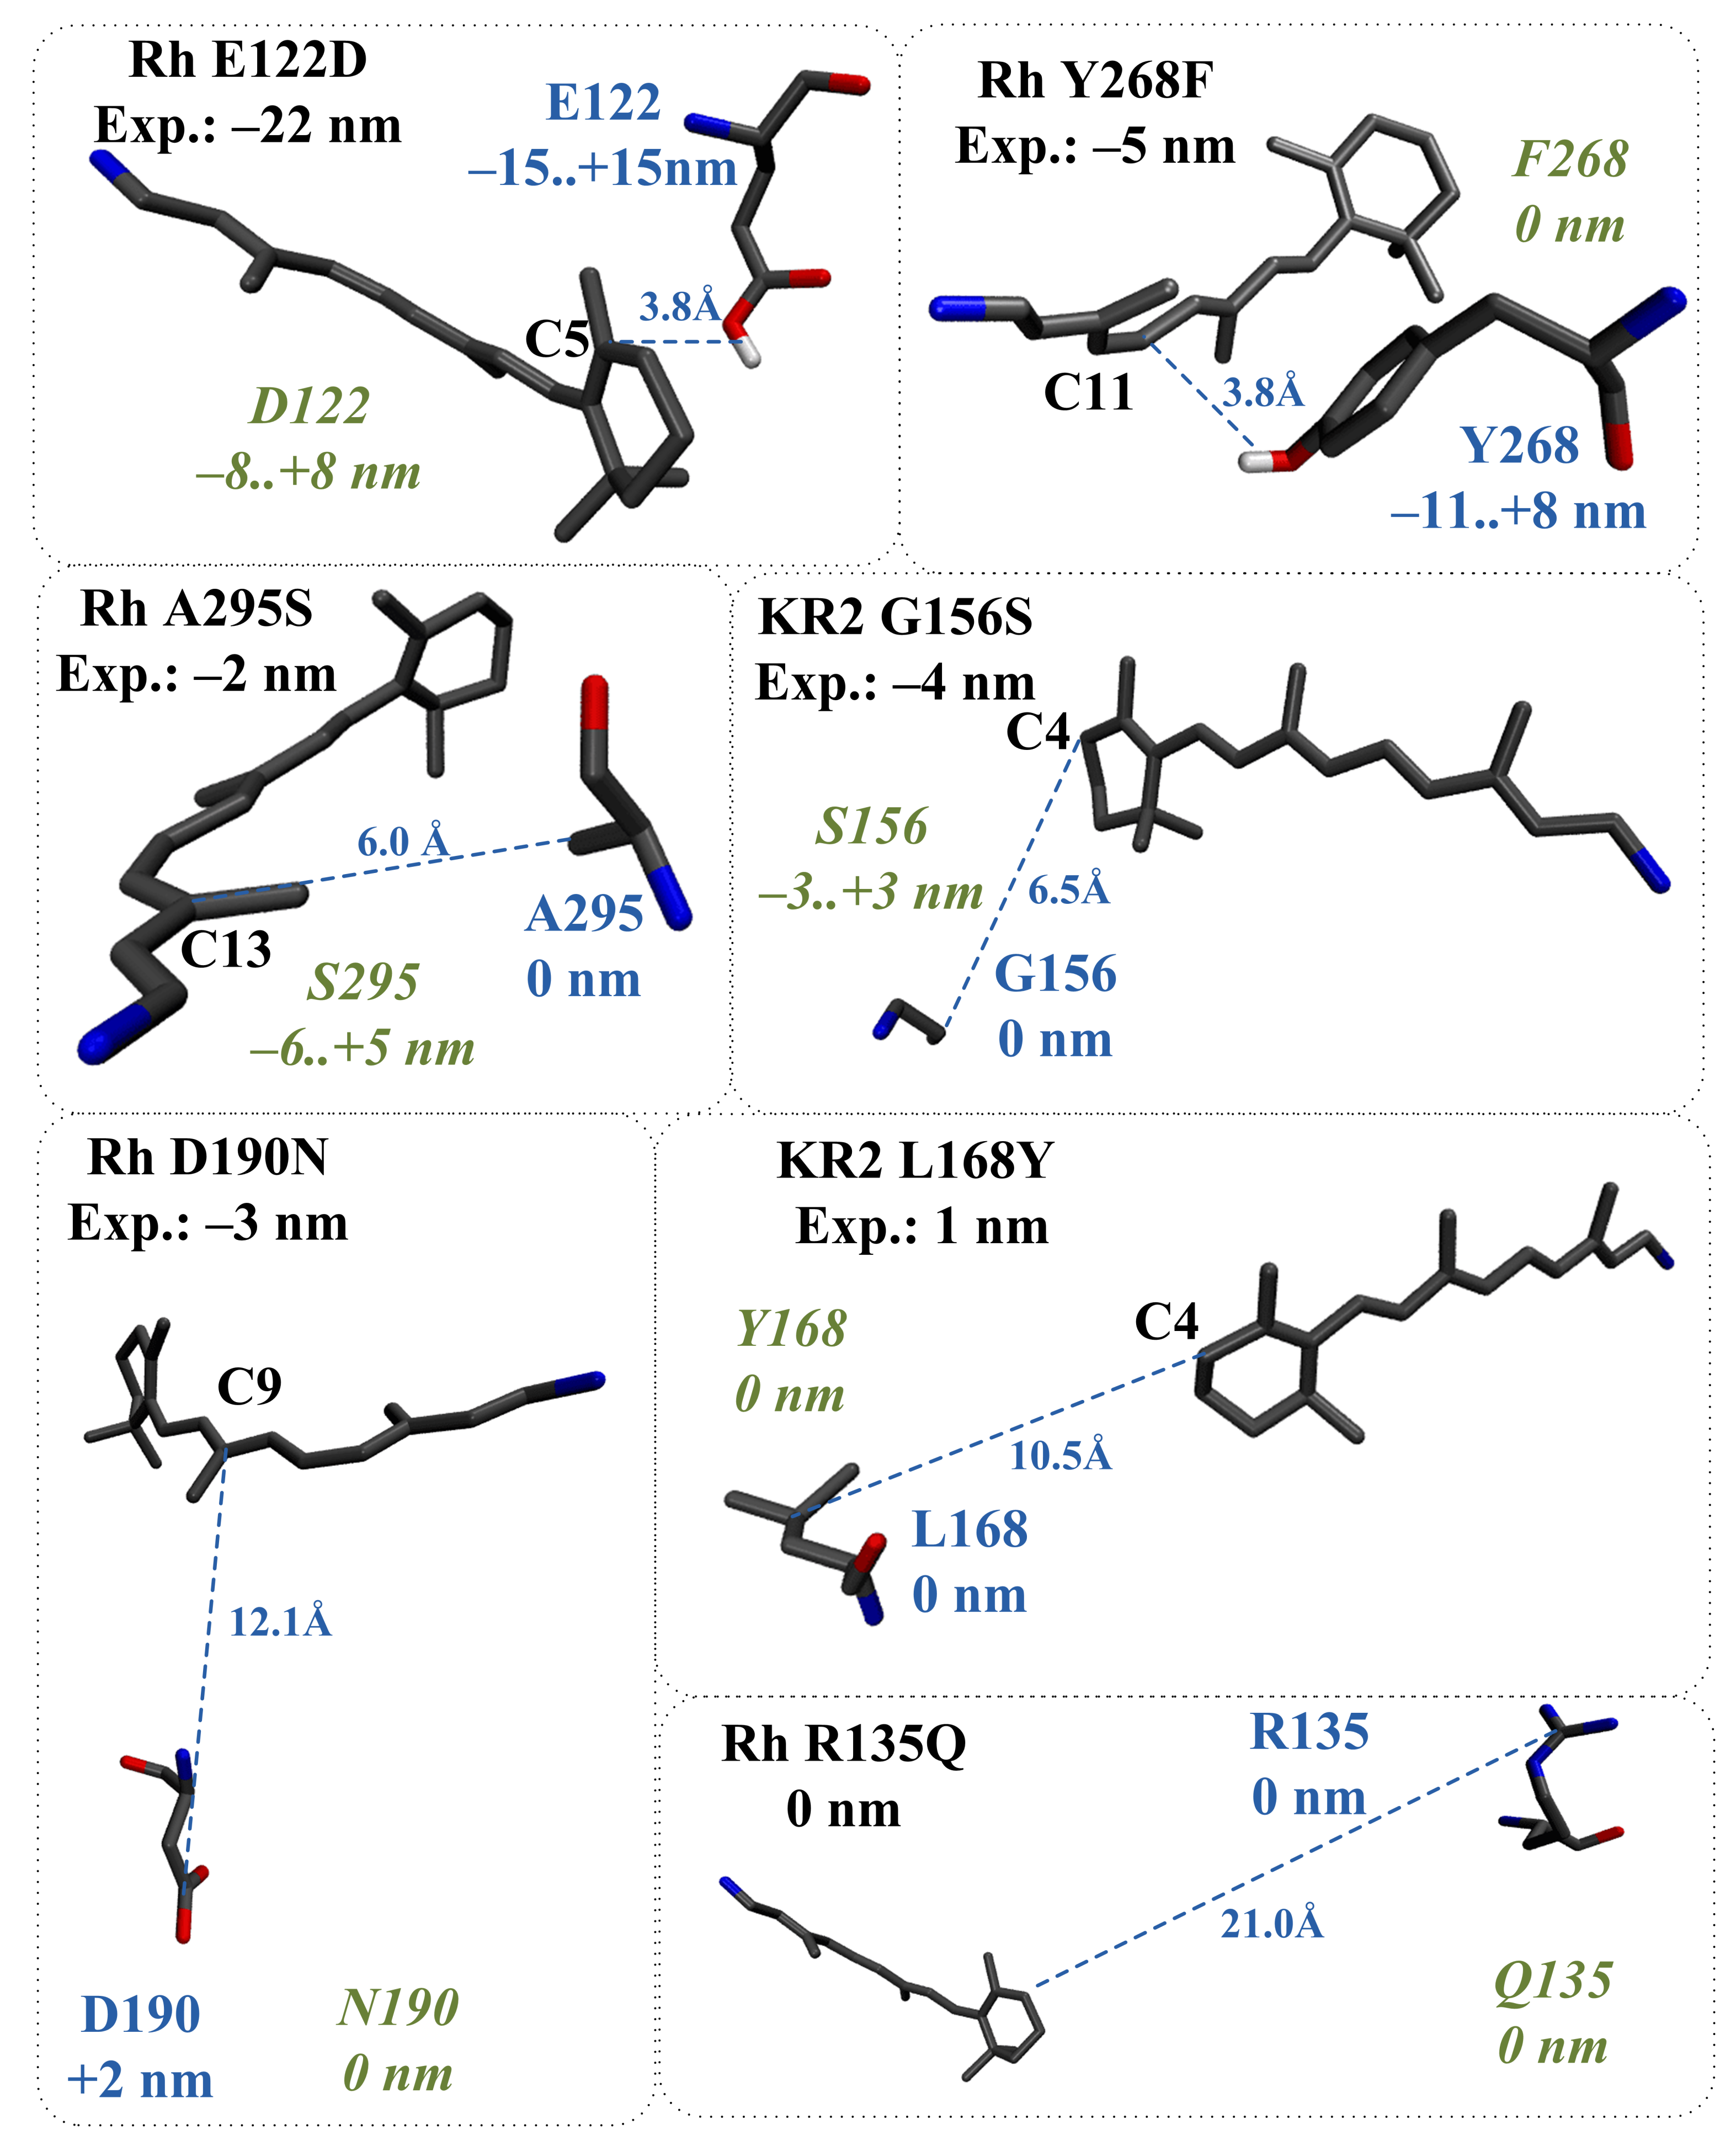
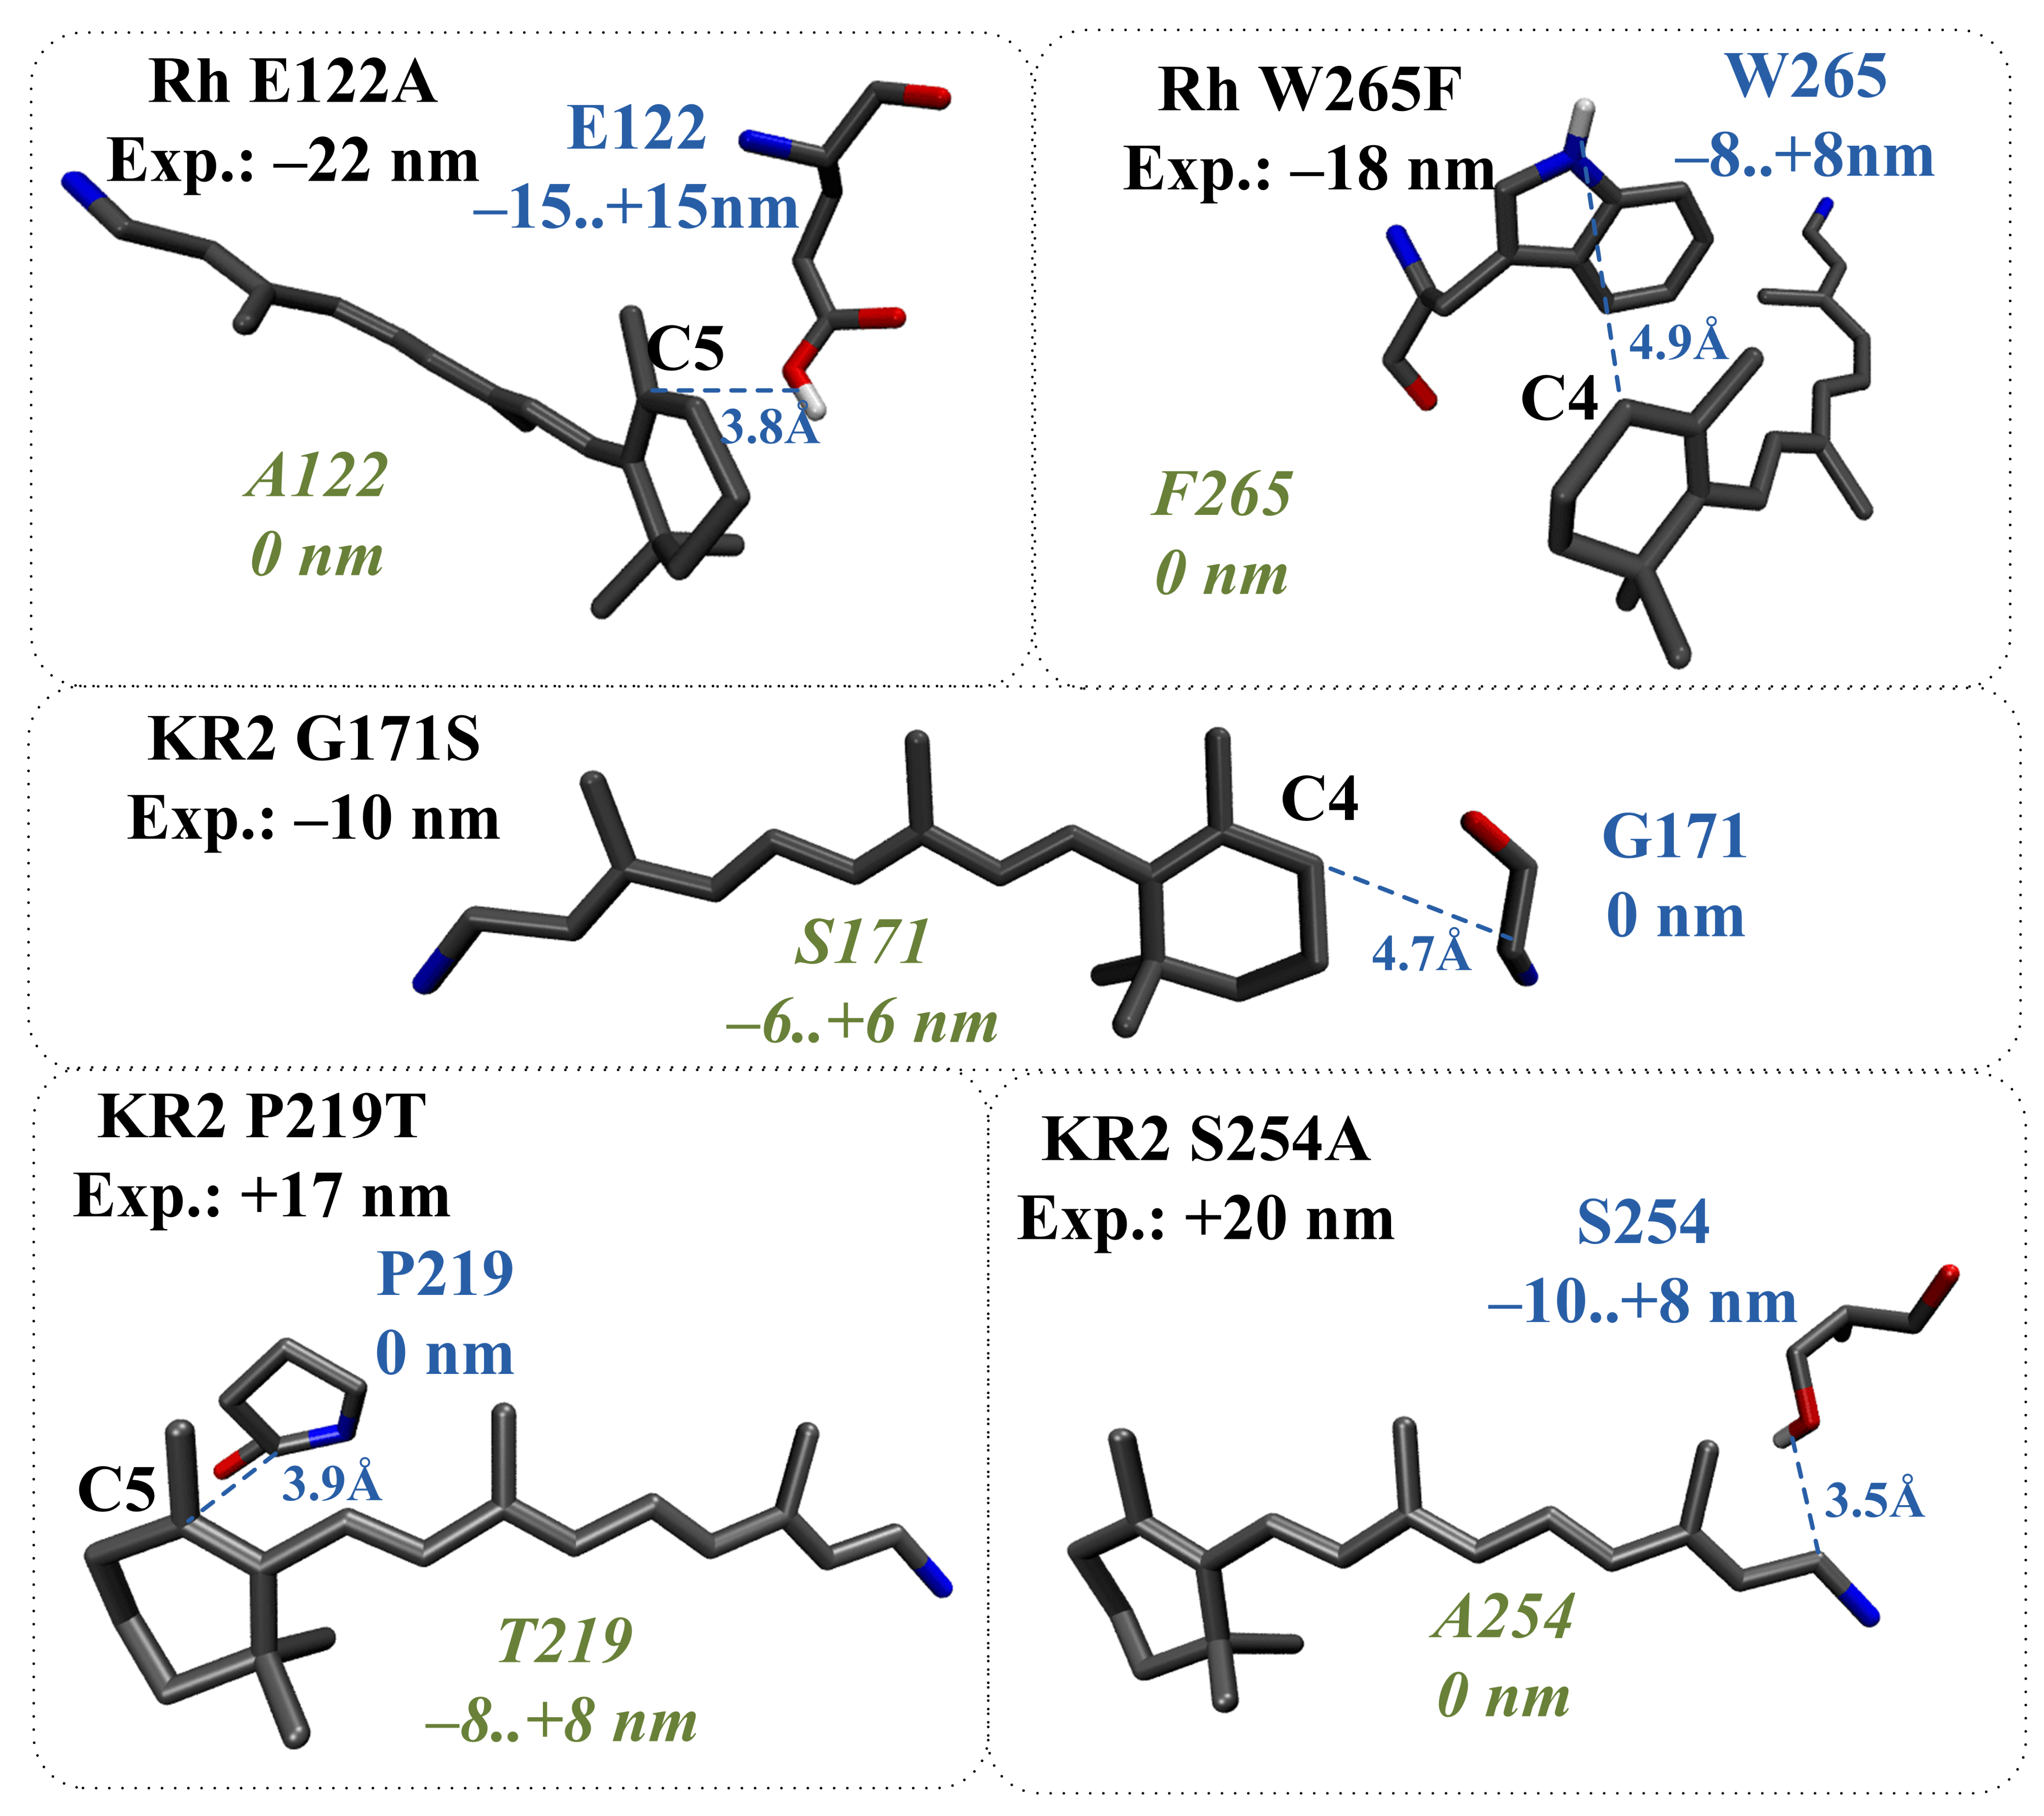
2.4. Application of the Proposed Models to Evaluate the Direct Effect of Amino Acid Substitutions
- (1)
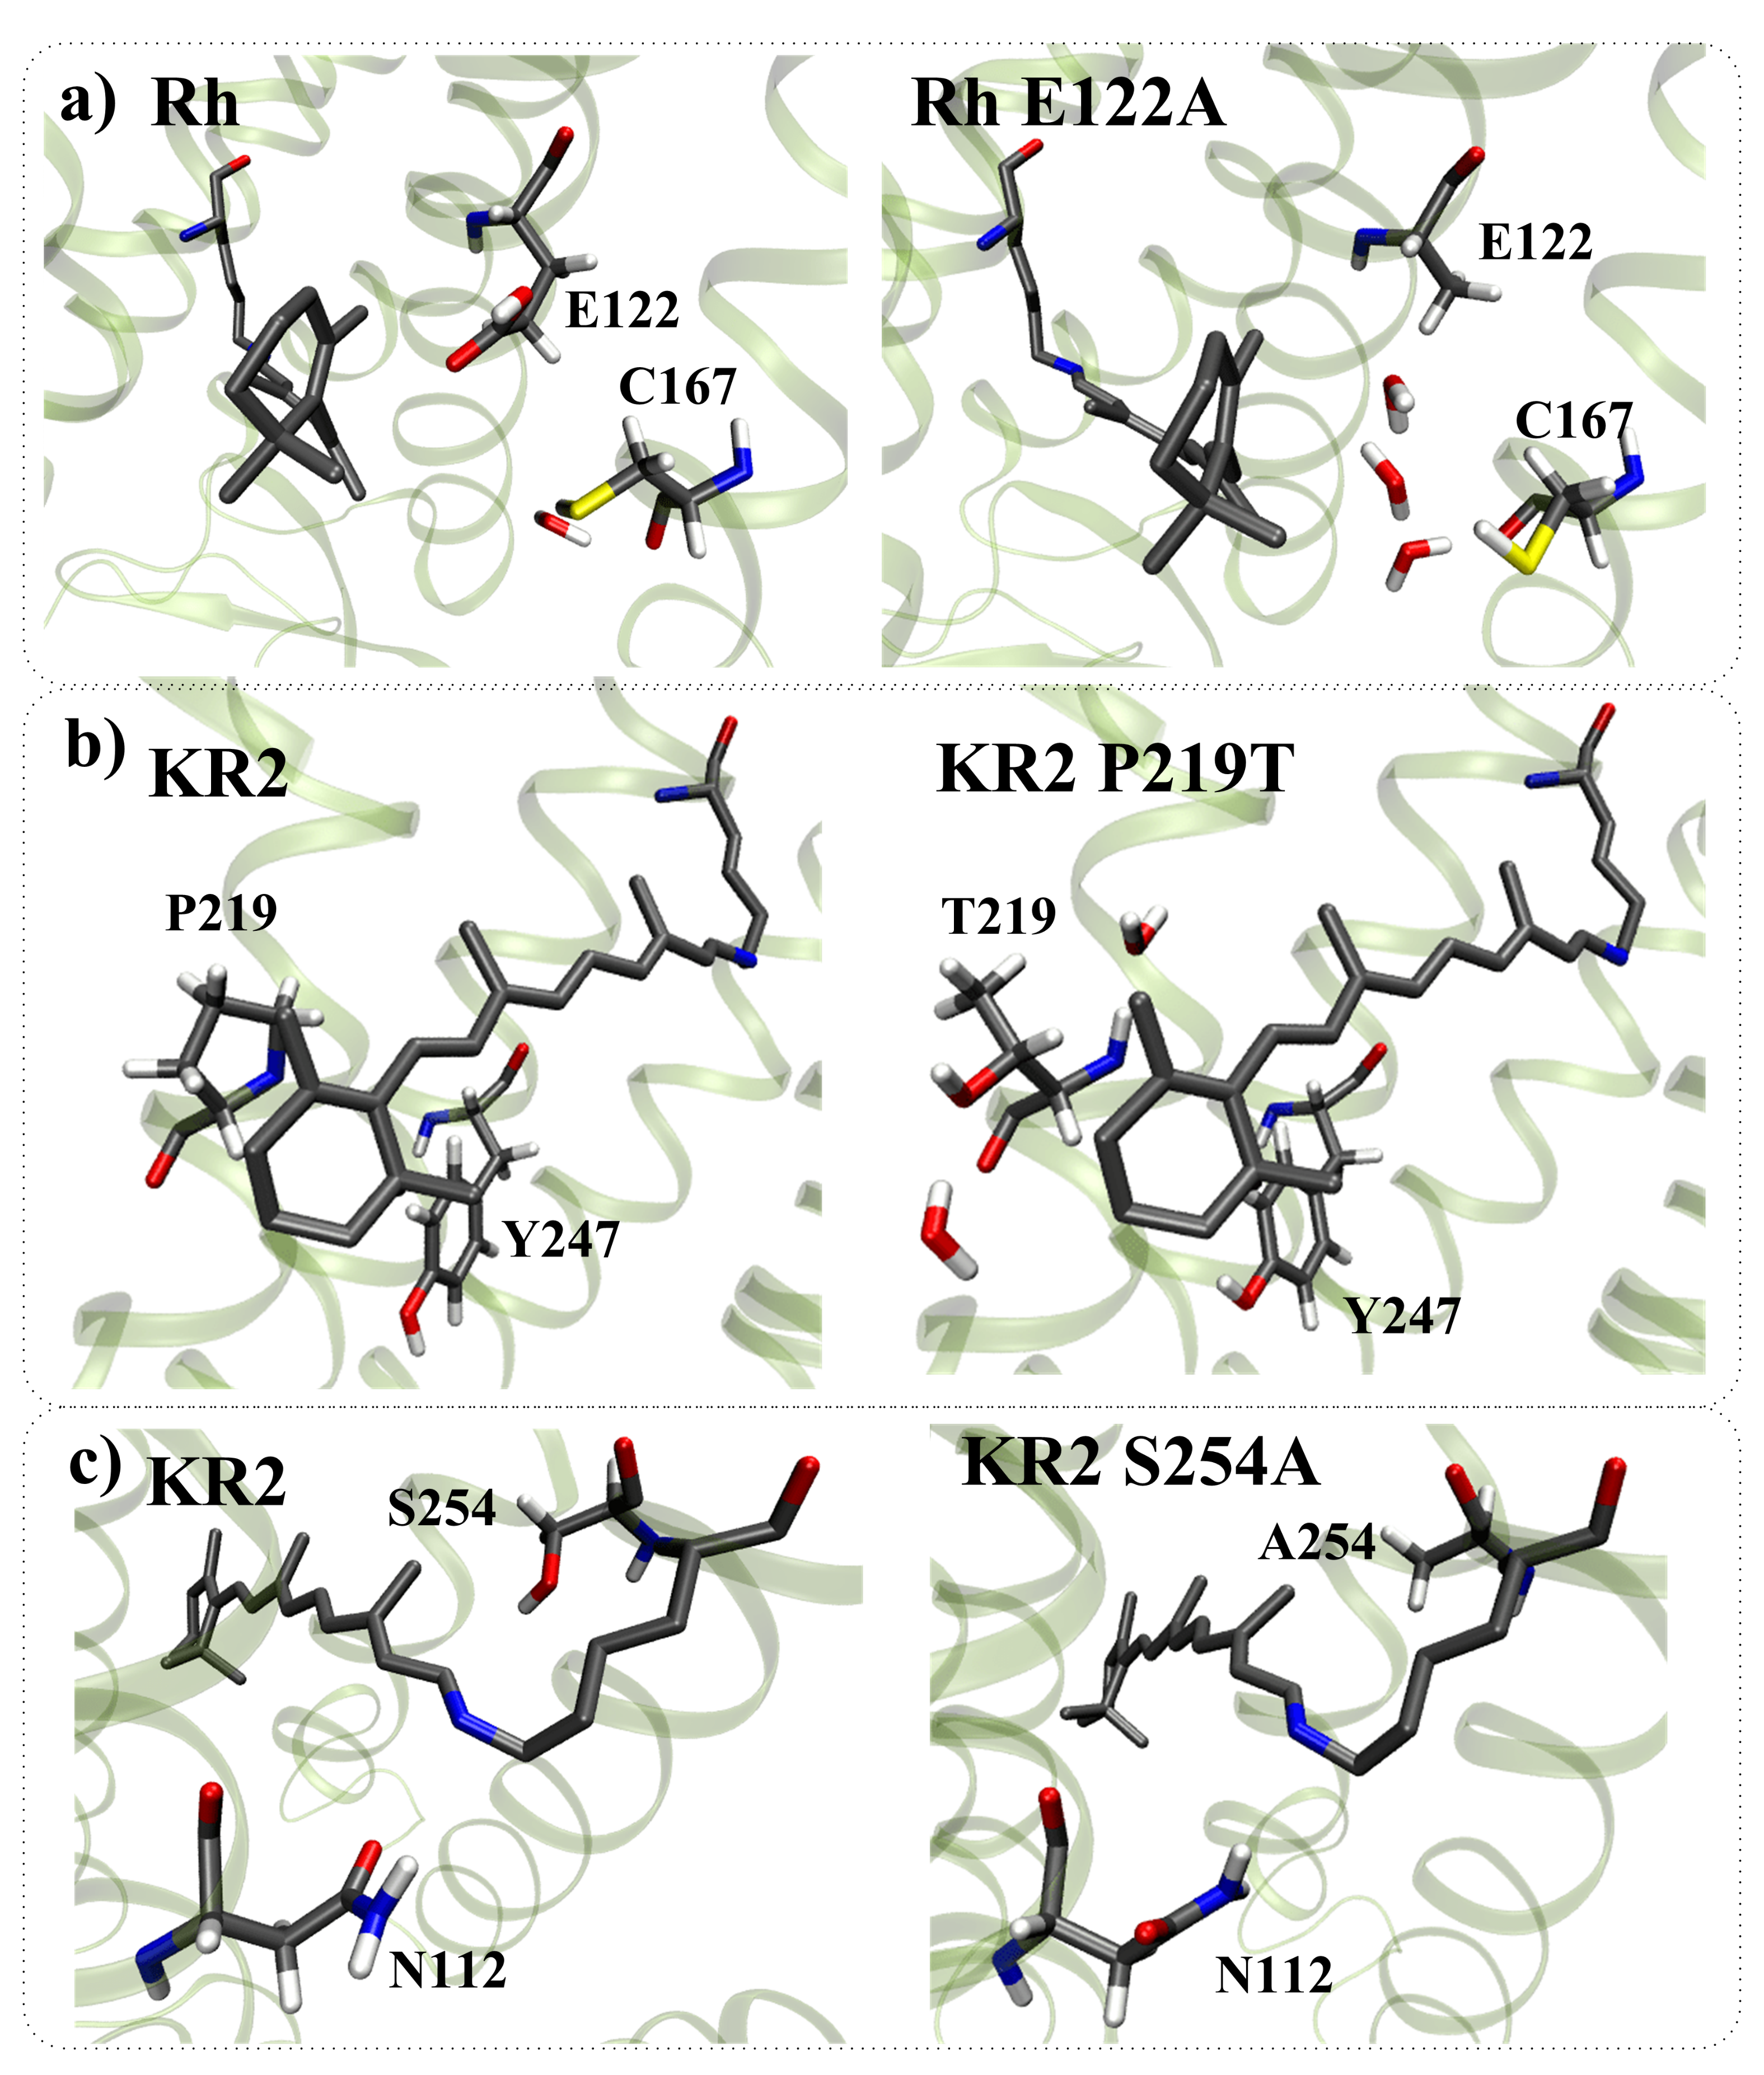
- The structural reorganization caused by E122A replacement in Rh (3.8 Å from C5 PSB atom) involves the reorientation of C167 residue and the addition of two water molecules located in the increased cavity at the substitution site (Figure 10a).
- (2)
- The structural reorganization caused by P219T replacement in KR2 (3.9 Å from C5 PSB atom) involves the reorientation of the polar Y247 residue and the addition of two water molecules at the substitution site (Figure 10b).
- (3)
- The structural reorganization caused by S254A replacement in KR2 (3.5 Å from C15 PSB atom) involves the reorientation of the polar N112 residue located in the vicinity of the N16 PSB atom (Figure 10c). The distance from the NH2 group of N112 to the N16 PSB atom decreases from 4.5 Å to 3.6 Å.
- (4)
- The structural reorganization caused by G171S replacement in KR2 (4.7 Å from C4 PSB atom) involves the reorientation of the positively charged R246 residue located at 12 Å from C6 PSB in the wild-type protein. The charged center of R246 comes closer to beta-ionone part of PSB, leading to an additional slight blue shift. The water molecule located between G171 and the beta-ionone ring of PSB in wild-type KR2 moves away in the KR2 G171S mutant.
- (5)
- The structural reorganization caused by W265F replacement in Rh (4.9 Å from C4 PSB atom) involves the reorientation of the polar Y191 residue and the addition of three water molecules in the increased cavity at the substitution site. According to our QM/MM model, W265F replacement has a non-negligible effect on retinal geometry. The spectral shift related to retinal geometry modification is −8 nm, while the experimentally observed spectral shift is −18 nm.
2.5. Limitations of the Proposed Models
3. Materials and Methods
3.1. Ab Initio-Based Models
3.2. Evaluation of Spectral Shifts Caused by Amino Acid Replacements
3.3. QM/MM Models Construction
4. Conclusions
- The contribution of charged residues to strongly depends on their positions and varies from over 100 nm for counterions at the distance of around 3.5 Å from the nitrogen atom of the chromophore to several nm for the residues located at 18 Å.
- The contribution of polar residues outside the binding pocket, i.e., more than 6–7 Å from the chromophore, is negligible.
- The distance from a charged/polar residue to the closest atom of the chromophore is the main parameter that is required to estimate the contribution of this residue to . In addition, the information about the dipole moment orientation relative to the chromophore is important for the evaluation of contributions of polar residues.
- An adequate model to evaluate of a rhodopsin must take into account the effect of polar/charged residues in the binding pocket, i.e., within 6–7 Å, and the charged residues at least up to 16–18 Å. On one hand, these findings explain the success of “binding pocket models” [14,53], in which the main difference in between two rhodopsins is attributed to the amino acid compositions of their binding pockets. On the other hand, these findings also reveal the limitations of the “binding pocket models” models, such as neglecting the charged residues beyond the binding pocket and the reorganization of polar/charged residues within the binding pocket due to distant amino acid substitutions.
Supplementary Materials
Author Contributions
Funding
Institutional Review Board Statement
Informed Consent Statement
Data Availability Statement
Acknowledgments
Conflicts of Interest
References
- Man, D.; Wang, W.; Sabehi, G.; Aravind, L.; Post, A.F.; Massana, R.; Spudich, E.N.; Spudich, J.L.; Béja, O. Diversification and spectral tuning in marine proteorhodopsins. EMBO Rep. 2003, 22, 1725–1731. [Google Scholar] [CrossRef] [Green Version]
- Spudich, J.L.; Jung, K.H. Microbial Rhodopsins. In Protein Science Encyclopedia: Online; Wiley-VCH: Weinheim, Germany, 2008. [Google Scholar]
- Engqvist, M.K.; McIsaac, R.S.; Dollinger, P.; Flytzanis, N.C.; Abrams, M.; Schor, S.; Arnold, F.H. Directed evolution of Gloeobacter violaceus rhodopsin spectral properties. J. Mol. Biol. 2015, 427, 205–220. [Google Scholar] [CrossRef] [Green Version]
- Lin, J.Y.; Knutsen, P.M.; Muller, A.; Kleinfeld, D.; Tsien, R.Y. ReaChR: A red-shifted variant of channelrhodopsin enables deep transcranial optogenetic excitation. Nat. Neurosci. 2013, 16, 1499. [Google Scholar] [CrossRef] [Green Version]
- McIsaac, R.S.; Engqvist, M.K.; Wannier, T.; Rosenthal, A.Z.; Herwig, L.; Flytzanis, N.C.; Imasheva, E.S.; Lanyi, J.K.; Balashov, S.P.; Gradinaru, V.; et al. Directed evolution of a far-red fluorescent rhodopsin. Proc. Natl. Acad. Sci. USA 2014, 111, 13034–13039. [Google Scholar] [CrossRef] [PubMed] [Green Version]
- Nikolaev, D.M.; Panov, M.S.; Shtyrov, A.A.; Boitsov, V.M.; Vyazmin, S.Y.; Chakchir, O.B.; Yakovlev, I.P.; Ryazantsev, M.N. Perspective tools for optogenetics and photopharmacology: From design to implementation. In Progress in Photon Science; Springer: Berlin/Heidelberg, Germany, 2019; pp. 139–172. [Google Scholar]
- Shimono, K.; Ikeura, Y.; Sudo, Y.; Iwamoto, M.; Kamo, N. Environment around the chromophore in pharaonis phoborhodopsin: Mutation analysis of the retinal binding site. Biochim. Biophys. Acta. Biomembr. 2001, 1515, 92–100. [Google Scholar] [CrossRef] [Green Version]
- Fasick, J.I.; Lee, N.; Oprian, D.D. Spectral tuning in the human blue cone pigment. Biochemistry 1999, 38, 11593–11596. [Google Scholar] [CrossRef] [PubMed]
- Kim, S.Y.; Waschuk, S.A.; Brown, L.S.; Jung, K.H. Screening and characterization of proteorhodopsin color-tuning mutations in Escherichia coli with endogenous retinal synthesis. Biochim. Biophys. Acta. Bioenerg. 2008, 1777, 504–513. [Google Scholar] [CrossRef] [PubMed] [Green Version]
- Ryazantsev, M.N.; Altun, A.; Morokuma, K. Color tuning in rhodopsins: The origin of the spectral shift between the chloride-bound and anion-free forms of halorhodopsin. J. Am. Chem. Soc. 2012, 134, 5520–5523. [Google Scholar] [CrossRef] [PubMed] [Green Version]
- Altun, A.; Morokuma, K.; Yokoyama, S. H-bond network around retinal regulates the evolution of ultraviolet and violet vision. ACS Chem. Biol. 2011, 6, 775–780. [Google Scholar] [CrossRef] [PubMed]
- Nikolaev, D.M.; Osipov, D.E.; Strashkov, D.M.; Vyazmin, S.Y.; Akulov, V.E.; Kravtcov, D.V.; Chakchir, O.B.; Panov, M.S.; Ryazantsev, M.N. Molecular mechanisms of adaptation to the habitat depth in visual pigments of A. subulata and L. forbesi squids: On the role of the S270F substitution. J. Integr. OMICS 2019, 9, 44–50. [Google Scholar]
- Altun, A.; Yokoyama, S.; Morokuma, K. Color tuning in short wavelength-sensitive human and mouse visual pigments: Ab initio quantum mechanics/molecular mechanics studies. J. Phys. Chem. A 2009, 113, 11685–11692. [Google Scholar] [CrossRef] [Green Version]
- Frahmcke, J.S.; Wanko, M.; Elstner, M. Building a model of the blue cone pigment based on the wild type rhodopsin structure with QM/MM methods. J. Phys. Chem. B 2012, 116, 3313–3321. [Google Scholar] [CrossRef]
- Ryazantsev, M.N.; Jamal, A.; Maeda, S.; Morokuma, K. Global investigation of potential energy surfaces for the pyrolysis of C1-C3 hydrocarbons: Toward the development of detailed kinetic models from first principles. Phys. Chem. Chem. Phys. 2015, 17, 27789–27805. [Google Scholar] [CrossRef] [PubMed]
- Hoffmann, M.; Wanko, M.; Strodel, P.; König, P.H.; Frauenheim, T.; Schulten, K.; Thiel, W.; Tajkhorshid, E.; Elstner, M. Color tuning in rhodopsins: The mechanism for the spectral shift between bacteriorhodopsin and sensory rhodopsin II. J. Am. Chem. Soc. 2006, 128, 10808–10818. [Google Scholar] [CrossRef] [PubMed]
- Ryazantsev, M.N.; Nikolaev, D.M.; Struts, A.V.; Brown, M.F. Quantum mechanical and molecular mechanics modeling of membrane-embedded rhodopsins. J. Membr. Biol. 2019, 252, 425–449. [Google Scholar] [CrossRef] [PubMed]
- Parker, D.S.; Dangi, B.B.; Kaiser, R.I.; Jamal, A.; Ryazantsev, M.; Morokuma, K. Formation of 6-Methyl-1, 4-dihydronaphthalene in the Reaction of the p-Tolyl Radical with 1, 3-Butadiene under Single-Collision Conditions. J. Phys. Chem. A 2014, 118, 12111–12119. [Google Scholar] [CrossRef]
- Fujimoto, K.; Hayashi, S.; Hasegawa, J.Y.; Nakatsuji, H. Theoretical studies on the color-tuning mechanism in retinal proteins. J. Chem. Theory Comput. 2007, 3, 605–618. [Google Scholar] [CrossRef]
- Tsujimura, M.; Ishikita, H. Insights into the Protein Functions and Absorption Wavelengths of Microbial Rhodopsins. J. Phys. Chem. B 2020, 124, 11819–11826. [Google Scholar] [CrossRef]
- Wanko, M.; Hoffmann, M.; Frauenheim, T.; Elstner, M. Effect of polarization on the opsin shift in rhodopsins. 1. A combined QM/QM/MM model for bacteriorhodopsin and pharaonis sensory rhodopsin II. J. Phys. Chem. B 2008, 112, 11462–11467. [Google Scholar] [CrossRef]
- Wanko, M.; Hoffmann, M.; Frahmcke, J.; Frauenheim, T.; Elstner, M. Effect of polarization on the opsin shift in rhodopsins. 2. Empirical polarization models for proteins. J. Phys. Chem. B 2008, 112, 11468–11478. [Google Scholar] [CrossRef]
- Mao, J.; Do, N.N.; Scholz, F.; Reggie, L.; Mehler, M.; Lakatos, A.; Ong, Y.S.; Ullrich, S.J.; Brown, L.J.; Brown, R.C.; et al. Structural basis of the green–blue color switching in proteorhodopsin as determined by NMR spectroscopy. J. Am. Chem. Soc. 2014, 136, 17578–17590. [Google Scholar] [CrossRef] [PubMed]
- Mathies, R.; Stryer, L. Retinal has a highly dipolar vertically excited singlet state: Implications for vision. Proc. Natl. Acad. Sci. USA 1976, 73, 2169–2173. [Google Scholar] [CrossRef] [Green Version]
- Schenkl, S.V.; Van Mourik, F.; Van der Zwan, G.; Haacke, S.; Chergui, M. Probing the ultrafast charge translocation of photoexcited retinal in bacteriorhodopsin. Science 2005, 309, 917–920. [Google Scholar] [CrossRef] [PubMed]
- Soderhjelm, P.; Husberg, C.; Strambi, A.; Olivucci, M.; Ryde, U. Protein influence on electronic spectra modeled by multipoles and polarizabilities. J. Chem. Theory Comput. 2009, 5, 649–658. [Google Scholar] [CrossRef]
- Wu, M.; Eriksson, L.A. Absorption Spectra of Riboflavin: A Difficult Case for Computational Chemistry. J. Phys. Chem. A 2010, 114, 10234–10242. [Google Scholar] [CrossRef]
- Schwinn, K.; Ferré, N.; Huix-Rotllant, M. Efficient analytic second derivative of electrostatic embedding QM/MM energy: Normal mode analysis of plant cryptochrome. J. Chem. Theory Comput. 2020, 16, 3816–3824. [Google Scholar] [CrossRef] [PubMed]
- Nikolaev, D.M.; Shtyrov, A.A.; Mereshchenko, A.S.; Panov, M.S.; Tveryanovich, Y.S.; Ryazantsev, M.N. An assessment of water placement algorithms in quantum mechanics/molecular mechanics modeling: The case of rhodopsins’ first spectral absorption band maxima. Phys. Chem. Chem. Phys. 2020, 22, 18114–18123. [Google Scholar] [CrossRef] [PubMed]
- Nikolaev, D.M.; Emelyanov, A.; Boitsov, V.M.; Panov, M.S.; Ryazantsev, M.N. A voltage-dependent fluorescent indicator for optogenetic applications, archaerhodopsin-3: Structure and optical properties from in silico modeling. F1000Research 2017, 6, 33. [Google Scholar] [CrossRef]
- Pieri, E.; Ledentu, V.; Sahlin, M.; Dehez, F.; Olivucci, M.; Ferré, N. CpHMD-Then-QM/MM identification of the amino acids responsible for the anabaena sensory rhodopsin pH-dependent electronic absorption spectrum. J. Chem. Theory Comput. 2019, 15, 4535–4546. [Google Scholar] [CrossRef]
- Marrink, S.J.; Risselada, H.J.; Yefimov, S.; Tieleman, D.P.; De Vries, A.H. The MARTINI force field: Coarse grained model for biomolecular simulations. J. Phys. Chem. B 2007, 111, 7812–7824. [Google Scholar] [CrossRef] [Green Version]
- Kmiecik, S.; Gront, D.; Kolinski, M.; Wieteska, L.; Dawid, A.E.; Kolinski, A. Coarse-grained protein models and their applications. Chem. Rev. 2016, 116, 7898–7936. [Google Scholar] [CrossRef] [Green Version]
- Nakayama, T.; Khorana, H.G. Mapping of the amino acids in membrane-embedded helices that interact with the retinal chromophore in bovine rhodopsin. J. Biol. Chem. 1991, 266, 4269–4275. [Google Scholar] [CrossRef]
- Janz, J.M.; Farrens, D.L. Engineering a functional blue-wavelength-shifted rhodopsin mutant. Biochemistry 2001, 40, 7219–7227. [Google Scholar] [CrossRef]
- Nathans, J. Determinants of visual pigment absorbance: Identification of the retinylidene Schiff’s base counterion in bovine rhodopsin. Biochemistry 1990, 29, 9746–9752. [Google Scholar] [CrossRef]
- Sakmar, T.P.; Franke, R.R.; Khorana, H.G. Glutamic acid-113 serves as the retinylidene Schiff base counterion in bovine rhodopsin. Proc. Natl. Acad. Sci. USA 1989, 86, 8309–8313. [Google Scholar] [CrossRef] [Green Version]
- Inoue, K.; del Carmen Marín, M.; Tomida, S.; Nakamura, R.; Nakajima, Y.; Olivucci, M.; Kandori, H. Red-shifting mutation of light-driven sodium-pump rhodopsin. Nat. Commun. 2019, 10, 1–11. [Google Scholar] [CrossRef] [PubMed] [Green Version]
- Coto, P.B.; Strambi, A.; Ferré, N.; Olivucci, M. The color of rhodopsins at the ab initio multiconfigurational perturbation theory resolution. Proc. Natl. Acad. Sci. USA 2006, 103, 17154–17159. [Google Scholar] [CrossRef] [PubMed] [Green Version]
- Tomasello, G.; Olaso-Gonzalez, G.; Altoe, P.; Stenta, M.; Serrano-Andres, L.; Merchan, M.; Orlandi, G.; Bottoni, A.; Garavelli, M. Electrostatic control of the photoisomerization efficiency and optical properties in visual pigments: On the role of counterion quenching. J. Am. Chem. Soc. 2009, 131, 5172–5186. [Google Scholar] [CrossRef] [PubMed]
- Ferré, N.; Olivucci, M. Probing the rhodopsin cavity with reduced retinal models at the CASPT2//CASSCF/AMBER level of theory. J. Am. Chem. Soc. 2003, 125, 6868–6869. [Google Scholar] [CrossRef] [PubMed]
- Sumita, M.; Ryazantsev, M.N.; Saito, K. Acceleration of the Z to E photoisomerization of penta-2,4-dieniminium by hydrogen out-of-plane motion: Theoretical study on a model system of retinal protonated Schiff base. Phys. Chem. Chem. Phys. 2009, 11, 6406–6414. [Google Scholar] [CrossRef]
- Neese, F. The ORCA program system. Wiley Interdiscip. Rev. Comput. Mol. Sci. 2012, 2, 73–78. [Google Scholar] [CrossRef]
- Okada, T.; Sugihara, M.; Bondar, A.N.; Elstner, M.; Entel, P.; Buss, V. The retinal conformation and its environment in rhodopsin in light of a new 2.2 Å crystal structure. J. Mol. Biol. 2004, 342, 571–583. [Google Scholar] [CrossRef]
- Kovalev, K.; Polovinkin, V.; Gushchin, I.; Alekseev, A.; Shevchenko, V.; Borshchevskiy, V.; Astashkin, R.; Balandin, T.; Bratanov, D.; Vaganova, S.; et al. Structure and mechanisms of sodium-pumping KR2 rhodopsin. Sci. Adv. 2019, 5, eaav2671. [Google Scholar] [CrossRef] [Green Version]
- Humphrey, W.; Dalke, A.; Schulten, K. VMD: Visual molecular dynamics. J. Mol. Graph. 1996, 14, 33–38. [Google Scholar] [CrossRef]
- Webb, B.; Sali, A. Comparative protein structure modeling using MODELLER. Curr. Protoc. Bioinform. 2016, 54, 5–6. [Google Scholar] [CrossRef] [PubMed] [Green Version]
- Morozenko, A.; Stuchebrukhov, A. Dowser++, a new method of hydrating protein structures. Proteins 2016, 84, 1347–1357. [Google Scholar] [CrossRef] [Green Version]
- Olsson, M.H.; Søndergaard, C.R.; Rostkowski, M.; Jensen, J.H. PROPKA3: Consistent treatment of internal and surface residues in empirical pKa predictions. J. Chem. Theory Comput. 2011, 7, 525–537. [Google Scholar] [CrossRef] [PubMed]
- Dolinsky, T.J.; Czodrowski, P.; Li, H.; Nielsen, J.E.; Jensen, J.H.; Klebe, G.; Baker, N.A. PDB2PQR: Expanding and upgrading automated preparation of biomolecular structures for molecular simulations. Nucleic Acids Res. 2007, 35, W522–W525. [Google Scholar] [CrossRef] [PubMed]
- Cornell, W.D.; Cieplak, P.; Bayly, C.I.; Gould, I.R.; Merz, K.M.; Ferguson, D.M.; Spellmeyer, D.C.; Fox, T.; Caldwell, J.W.; Kollman, P.A. A second generation force field for the simulation of proteins, nucleic acids, and organic molecules. J. Am. Chem. Soc. 1996, 118, 2309. [Google Scholar] [CrossRef] [Green Version]
- Frisch, M.J.; Trucks, G.; Schlegel, H.; Scuseria, G.; Robb, M.; Cheeseman, J.; Scalmani, G.; Barone, V.; Mennucci, B.; Petersson, G.; et al. Gaussian 09, Revision D. 01; Gaussian Inc.: Wallingford, CT, USA, 2009. [Google Scholar]
- Welke, K.; Frahmcke, J.S.; Watanabe, H.C.; Hegemann, P.; Elstner, M. Color tuning in binding pocket models of the chlamydomonas-type channelrhodopsins. J. Phys. Chem. B 2011, 115, 15119–15128. [Google Scholar] [CrossRef] [PubMed]


| Mutant | Type | |||
|---|---|---|---|---|
| Rh Y268F | polar/ nonpolar | −5 nm [34] | Y268: −11 to +8 nm 3.8 Å from C F268: 0 nm | −7 nm |
| Rh A295S | nonpolar/ polar | −2 nm [35] | A295: 0 nm S295: −6 to +5 nm 6.0 Å from C | −7 nm |
| Rh D190N | charged/ polar | −3 nm [36] | D190: +2 nm 12.1 Å from C N190: 0 nm | +1 nm |
| Rh R135Q | charged/ polar | 0 nm [37] | R295: 0 nm 21.0 Å from C Q135: 0 nm | −2 nm |
| KR2 L168Y | nonpolar/ polar | 1 nm [38] | L168: 0 nm Y168: 0 nm 10.5 Å from C | 4 nm |
| Rh E122D | charged/ charged | −22 nm [34] | E122: +62 nm 4.8 Å from C D122: +38 nm E122D: −27 nm | − |
| Rh E122D | charged (protonated)/ charged (protonated) | −22 nm [34] | E122: −15 to +15 nm 3.8 Å from C D122: −8 to +8 nm E122D: −23 nm to 23 nm | −24 nm |
| KR2 G156S | nonpolar/ polar | −4 nm [38] | G156: 0 nm S156: −3 to +3 nm 6.5 Å from C | −8 nm |
| KR2 G171S | nonpolar/ polar | −10 nm [38] | G171: 0 nm S171: −6 to +6 nm 4.7 Å from C | −9 nm |
| Rh E122A | charged (protonated)/ neutral | −22 nm [34] | E122: −15 to +15 nm 3.8 Å from C A122: 0 nm | −23 nm |
| Rh W265F | polar/ neutral | −18 nm [34] | W265: −8 to +8 nm 4.9 Å from C F265: 0 nm | −16 nm |
| KR2 S254A | polar neutral | +20 nm [38] | S254: -10 to +8 nm 3.5 Å from C A254: 0 nm | +24 nm |
| KR2 P219T | neutral/ polar | +17 nm [38] | P219: 0 nm T265: −8 to +8 nm 3.9 Å from C | +12 nm |
Publisher’s Note: MDPI stays neutral with regard to jurisdictional claims in published maps and institutional affiliations. |
© 2021 by the authors. Licensee MDPI, Basel, Switzerland. This article is an open access article distributed under the terms and conditions of the Creative Commons Attribution (CC BY) license (http://creativecommons.org/licenses/by/4.0/).
Share and Cite
Shtyrov, A.A.; Nikolaev, D.M.; Mironov, V.N.; Vasin, A.V.; Panov, M.S.; Tveryanovich, Y.S.; Ryazantsev, M.N. Simple Models to Study Spectral Properties of Microbial and Animal Rhodopsins: Evaluation of the Electrostatic Effect of Charged and Polar Residues on the First Absorption Band Maxima. Int. J. Mol. Sci. 2021, 22, 3029. https://0-doi-org.brum.beds.ac.uk/10.3390/ijms22063029
Shtyrov AA, Nikolaev DM, Mironov VN, Vasin AV, Panov MS, Tveryanovich YS, Ryazantsev MN. Simple Models to Study Spectral Properties of Microbial and Animal Rhodopsins: Evaluation of the Electrostatic Effect of Charged and Polar Residues on the First Absorption Band Maxima. International Journal of Molecular Sciences. 2021; 22(6):3029. https://0-doi-org.brum.beds.ac.uk/10.3390/ijms22063029
Chicago/Turabian StyleShtyrov, Andrey A., Dmitrii M. Nikolaev, Vladimir N. Mironov, Andrey V. Vasin, Maxim S. Panov, Yuri S. Tveryanovich, and Mikhail N. Ryazantsev. 2021. "Simple Models to Study Spectral Properties of Microbial and Animal Rhodopsins: Evaluation of the Electrostatic Effect of Charged and Polar Residues on the First Absorption Band Maxima" International Journal of Molecular Sciences 22, no. 6: 3029. https://0-doi-org.brum.beds.ac.uk/10.3390/ijms22063029