
The Role of High-Resolution Analytical Techniques in the Development of Functional Foods

 , , ,
, , ,
Abstract
:1. Introduction
2. Phytochemical Characterization of Bioactive Compounds
2.1. Mass Spectrometry (MS)
2.1.1. GC–MS
2.1.2. LC–MS
2.2. NMR
3. Nutritional Intervention Studies
3.1. Acute Intervention Studies: Bioavailability and Pharmacokinetics
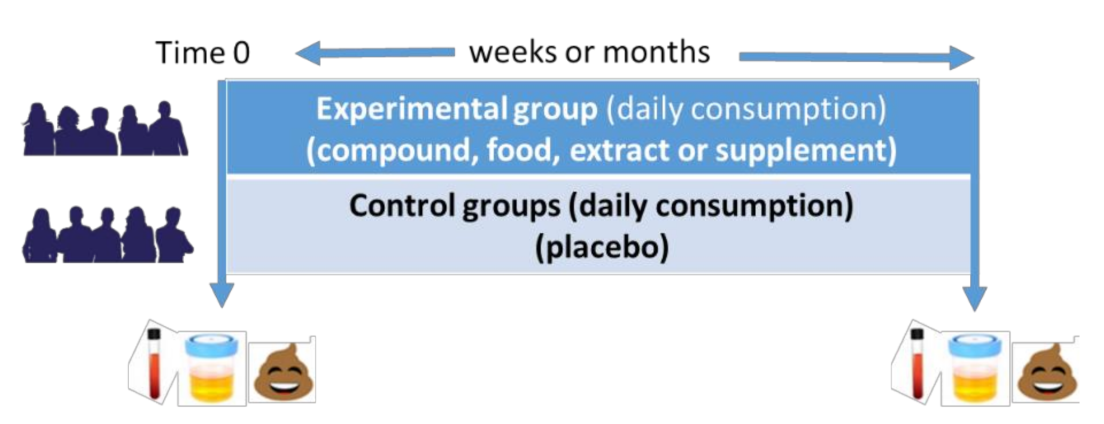
3.2. Longitudinal Intervention Studies
4. Conclusions
Author Contributions
Funding
Institutional Review Board Statement
Informed Consent Statement
Data Availability Statement
Acknowledgments
Conflicts of Interest
References
- Del Rio, D.; Rodriguez-Mateos, A.; Spencer, J.P.E.; Tognolini, M.; Borges, G.; Crozier, A. Dietary (Poly)phenolics in Human Health: Structures, Bioavailability, and Evidence of Protective Effects Against Chronic Diseases. Antioxid. Redox Signal. 2013, 18, 1818–1892. [Google Scholar] [CrossRef] [Green Version]
- Crozier, A.; Jaganath, I.B.; Clifford, M.N. Dietary phenolics: Chemistry, bioavailability and effects on health. Nat. Prod. Rep. 2009, 26, 1001–1043. [Google Scholar] [CrossRef] [PubMed]
- González Cañete, N.; Durán Agüero, S. Soya isoflavones and evidences on cardiovascular protection. Nutr. Hosp. 2014, 29, 1271–1282. [Google Scholar] [PubMed]
- Shahidi, F.; Ambigaipalan, P. Phenolics and polyphenolics in foods, beverages and spices: Antioxidant activity and health effects—A review. J. Funct. Foods 2015, 18, 820–897. [Google Scholar] [CrossRef]
- Granato, D.; Barba, F.J.; Bursać Kovačević, D.; Lorenzo, J.M.; Cruz, A.G.; Putnik, P. Functional Foods: Product Development, Technological Trends, Efficacy Testing, and Safety. Annu. Rev. Food Sci. Technol. 2020, 11, 93–118. [Google Scholar] [CrossRef] [Green Version]
- Sagar, N.A.; Pareek, S.; Sharma, S.; Yahia, E.M.; Lobo, M.G. Fruit and Vegetable Waste: Bioactive Compounds, Their Extraction, and Possible Utilization. Compr. Rev. Food Sci. Food Saf. 2018, 17, 512–531. [Google Scholar] [CrossRef] [PubMed] [Green Version]
- Cádiz-Gurrea, M.D.L.L.; Villegas-Aguilar, M.D.C.; Leyva-Jiménez, F.J.; Pimentel-Moral, S.; Fernández-Ochoa, Á.; Alañón, M.E.; Segura-Carretero, A. Revalorization of bioactive compounds from tropical fruit by-products and industrial applications by means of sustainable approaches. Food Res. Int. 2020, 138, 109786. [Google Scholar] [CrossRef] [PubMed]
- Trullols, E.; Ruisánchez, I.; Rius, F.X. Validation of qualitative analytical methods. TrAC Trends Anal. Chem. 2004, 23, 137–145. [Google Scholar] [CrossRef] [Green Version]
- Fredes, C.; Osorio, M.J.; Parada, J.; Robert, P. Stability and bioaccessibility of anthocyanins from maqui (Aristotelia chilensis [Mol.] Stuntz) juice microparticles. LWT Food Sci. Technol. 2018, 91, 549–556. [Google Scholar] [CrossRef]
- Castangia, I.; Caddeo, C.; Manca, M.L.; Casu, L.; Latorre, A.C.; Díez-Sales, O.; Ruiz-Saurí, A.; Bacchetta, G.; Fadda, A.M.; Manconi, M. Delivery of liquorice extract by liposomes and hyalurosomes to protect the skin against oxidative stress injuries. Carbohydr. Polym. 2015, 134, 657–663. [Google Scholar] [CrossRef]
- Da Fonseca Machado, A.P.; Alves Rezende, C.; Alexandre Rodrigues, R.; Fernández Barbero, G.; De Tarso Vieira e Rosa, P.; Martínez, J. Encapsulation of anthocyanin-rich extract from blackberry residues by spray-drying, freeze-drying and supercritical antisolvent. Powder Technol. 2018, 340, 553–562. [Google Scholar] [CrossRef]
- Mohn, T.; Cutting, B.; Ernst, B.; Hamburger, M. Extraction and analysis of intact glucosinolates—A validated pressurized liquid extraction/liquid chromatography–mass spectrometry protocol for Isatis tinctoria, and qualitative analysis of other cruciferous plants. J. Chromatogr. A 2007, 1166, 142–151. [Google Scholar] [CrossRef] [PubMed]
- Sánchez-salcedo, E.M.; Tassotti, M.; Del, D.; Hernández, F.; José, J.; Mena, P. (Poly) phenolic fingerprint and chemometric analysis of white (Morus alba L.) and black (Morus nigra L.) mulberry leaves by using a non-targeted UHPLC–MS approach. Food Chem. 2016, 212, 250–255. [Google Scholar] [CrossRef]
- Han, W.; Chen, X.; Yu, H.; Chen, L.; Shen, M. Seasonal variations of iminosugars in mulberry leaves detected by hydrophilic interaction chromatography coupled with tandem mass spectrometry. Food Chem. 2018, 251, 110–114. [Google Scholar] [CrossRef] [PubMed]
- Kumar, D. Nuclear Magnetic Resonance (NMR) Spectroscopy For Metabolic Profiling of Medicinal Plants and Their Products. Crit. Rev. Anal. Chem. 2016, 46, 400–412. [Google Scholar] [CrossRef]
- Kachlicki, P.; Piasecka, A.; Stobiecki, M.; Marczak, Ł. Structural characterization of flavonoid glycoconjugates and their derivatives with mass spectrometric techniques. Molecules 2016, 21, 1494. [Google Scholar] [CrossRef] [PubMed] [Green Version]
- Kussmann, M.; Affolter, M.; Nagy, K.; Holst, B.; Fay, L.B. Mass spectrometry in nutrition: Understanding dietary health effects at the molecular level. Mass Spectrom. Rev. 2007, 26, 727–750. [Google Scholar] [CrossRef]
- Farag, M.A. Comparative mass spectrometry & nuclear magnetic resonance metabolomic approaches for nutraceuticals quality control analysis: A brief review. Recent Pat. Biotechnol. 2014, 8, 17–24. [Google Scholar]
- Zhang, A.; Sun, H.; Wang, X. Mass spectrometry-driven drug discovery for development of herbal medicine. Mass Spectrom. Rev. 2018, 37, 307–320. [Google Scholar] [CrossRef]
- Kumar, B.R. Application of HPLC and ESI-MS techniques in the analysis of phenolic acids and flavonoids from green leafy vegetables (GLVs). J. Pharm. Anal. 2017, 7, 349–364. [Google Scholar] [CrossRef]
- Steinmann, D.; Ganzera, M. Recent advances on HPLC/MS in medicinal plant analysis. J. Pharm. Biomed. Anal. 2011, 55, 744–757. [Google Scholar] [CrossRef] [PubMed]
- Rohloff, J. Analysis of phenolic and cyclic compounds in plants using derivatization techniques in combination with GC-MS-based metabolite profiling. Molecules 2015, 20, 3431–3462. [Google Scholar] [CrossRef] [PubMed] [Green Version]
- Ajilogba, C.F.; Babalola, O.O. GC–MS analysis of volatile organic compounds from Bambara groundnut rhizobacteria and their antibacterial properties. World J. Microbiol. Biotechnol. 2019, 35, 1–19. [Google Scholar] [CrossRef] [PubMed] [Green Version]
- Chen, J.H.; Xiang, W.; Cao, K.X.; Lu, X.; Yao, S.C.; Hung, D.; Huang, R.S.; Li, L.B. Characterization of volatile organic compounds emitted from endophytic burkholderia cenocepacia ETR-B22 by SPME-GC-MS and their inhibitory activity against various plant fungal pathogens. Molecules 2020, 25, 3765. [Google Scholar] [CrossRef]
- Ashokkumar, K.; Govindaraj, M.; Vellaikumar, S.; Shobhana, V.G.; Karthikeyan, A.; Akilan, M.; Sathishkumar, J. Comparative Profiling of Volatile Compounds in Popular South Indian Traditional and Modern Rice Varieties by Gas Chromatography–Mass Spectrometry Analysis. Front. Nutr. 2020, 7, 599119. [Google Scholar] [CrossRef]
- Rockwood, A.L.; Kushnir, M.M.; Clarke, N.J.; Crockett, K.; Eigner, U.; Hofstadler, S.A.; Hoof, A.N. 2—Mass Spectrometry; Elsevier Inc.: Amsterdam, The Netherlands, 2018; ISBN 9780128160633. [Google Scholar]
- López-Cobo, A.; Verardo, V.; Diaz-de-Cerio, E.; Segura-Carretero, A.; Fernández-Gutiérrez, A.; Gómez-Caravaca, A.M. Use of HPLC- and GC-QTOF to determine hydrophilic and lipophilic phenols in mango fruit (Mangifera indica L.) and its by-products. Food Res. Int. 2017, 100, 423–434. [Google Scholar] [CrossRef]
- Vinaixa, M.; Schymanski, E.L.; Neumann, S.; Navarro, M.; Salek, R.M.; Yanes, O. Mass spectral databases for LC/MS- and GC/MS-based metabolomics: State of the field and future prospects. TrAC Trends Anal. Chem. 2016, 78, 23–35. [Google Scholar] [CrossRef] [Green Version]
- Lee, J.; Jung, Y.; Shin, J.-H.; Kim, H.; Moon, B.; Ryu, D.; Hwang, G.-S. Secondary Metabolite Profiling of Curcuma Species Grown at Different Locations Using GC/TOF and UPLC/Q-TOF MS. Molecules 2014, 19, 9535–9551. [Google Scholar] [CrossRef] [Green Version]
- Barden, D.; McGregor, L.; Smith, S. Comprehensive Fragrance Profiling of Ginger, Wintergreen, and Rosemary Essential Oils by GC–TOF-MS with Soft Electron Ionization. Spectroscopy 2016, 14, 18–26. [Google Scholar]
- Packia Lekshimi, N.C.J.; Viveka, S.; Viswanathan, M.B.; Shobi, M.T. GC-MS characterization of organic sulfur compounds and others volatile odorous compounds from Allium sativum. Glob. Sci. Publ. 2015, 17, 73–78. [Google Scholar]
- Kizi, S.; Dinc, H.; Diraz, E.; Toncer, O.; Kizil, M.; Karaman, S. Effectsof different harvest periods on essential oil components of Lippia citriodora kunth under semi-arid climatic conditions and biological activities of its essential oil. Acta Sci. Pol. Hortorum Cultus 2018, 17, 39–48. [Google Scholar] [CrossRef]
- Sharma, D.; Rani, R.; Chaturvedi, M.; Yadav, J.P. Antibacterial capacity and identification of bioactive compounds by GC MS of Allium cepa. Int. J. Pharm. Pharm. Sci. 2018, 10, 116. [Google Scholar] [CrossRef] [Green Version]
- Zeng, L.; Liao, Y.; Li, J.; Zhou, Y.; Tang, J.; Dong, F.; Yang, Z. α-Farnesene and ocimene induce metabolite changes by volatile signaling in neighboring tea (Camellia sinensis) plants. Plant Sci. 2017, 264, 29–36. [Google Scholar] [CrossRef]
- Xiang, Z.; Wang, X.; Cai, X.; Zeng, S. Metabolomics Study on Quality Control and Discrimination of Three Curcuma Species based on Gas Chromatograph-Mass Spectrometry. Phytochem. Anal. 2011, 22, 411–418. [Google Scholar] [CrossRef]
- Tomi, K.; Kitao, M.; Konishi, N.; Murakami, H.; Matsumura, Y.; Hayashi, T. Enantioselective GC–MS analysis of volatile components from rosemary (Rosmarinus officinalis L.) essential oils and hydrosols. Biosci. Biotechnol. Biochem. 2016, 80, 840–847. [Google Scholar] [CrossRef] [Green Version]
- Mena, P.; Cirlini, M.; Tassotti, M.; Herrlinger, K.; Dall’Asta, C.; Del Rio, D. Phytochemical Profiling of Flavonoids, Phenolic Acids, Terpenoids, and Volatile Fraction of a Rosemary (Rosmarinus officinalis L.) Extract. Molecules 2016, 21, 1576. [Google Scholar] [CrossRef]
- Abdel-Lateef, E.; Mahmoud, F.; Hammam, O.; El-Ahwany, E.; El-Wakil, E.; Kandil, S.; Abu Taleb, H.; El-Sayed, M.; Hassenein, H. Bioactive chemical constituents of Curcuma longa L. rhizomes extract inhibit the growth of human hepatoma cell line (HepG2). Acta Pharm. 2016, 66, 387–398. [Google Scholar] [CrossRef] [Green Version]
- Martín-García, B.; Verardo, V.; León, L.; De la Rosa, R.; Arráez-Román, D.; Segura-Carretero, A.; Gómez-Caravaca, A.M. GC-QTOF-MS as valuable tool to evaluate the influence of cultivar and sample time on olive leaves triterpenic components. Food Res. Int. 2019, 115, 219–226. [Google Scholar] [CrossRef] [PubMed]
- López-Cobo, A.; Martín-García, B.; Segura-Carretero, A.; Fernández-Gutiérrez, A.; Gómez-Caravaca, A. Comparison of Two Stationary Phases for the Determination of Phytosterols and Tocopherols in Mango and Its By-Products by GC-QTOF-MS. Int. J. Mol. Sci. 2017, 18, 1594. [Google Scholar] [CrossRef] [PubMed]
- Karoui, R.; De Baerdemaeker, J. A review of the analytical methods coupled with chemometric tools for the determination of the quality and identity of dairy products. Food Chem. 2007, 102, 621–640. [Google Scholar] [CrossRef]
- Fairulnizal, M.; Gunasegavan, R.D.N.; Khalid, N.M.; Balasubramaniam, V.; Mustar, S.; Rashed, A.A. Recent techniques in nutrient analysis for food composition database. Molecules 2020, 25, 4567. [Google Scholar]
- Viette, V.; Hochstrasser, D.; Fathi, M. LC-MS (/MS) in Clinical Toxicology Screening Methods. Chim. Int. J. Chem. 2012, 66, 339–342. [Google Scholar] [CrossRef] [PubMed]
- Ganzera, M.; Sturm, S. Recent advances on HPLC/MS in medicinal plant analysis—An update covering 2011–2016. J. Pharm. Biomed. Anal. 2018, 147, 211–233. [Google Scholar] [CrossRef]
- Nováková, L.; Matysová, L.; Solich, P. Advantages of application of UPLC in pharmaceutical analysis. Talanta 2006, 68, 908–918. [Google Scholar] [CrossRef]
- Kimura, T.; Nakagawa, K.; Kubota, H.; Kojima, Y.; Goto, Y.; Yamagishi, K.; Oita, S.; Oikawa, S.; Miyazawa, T. Food-grade mulberry powder enriched with 1-deoxynojirimycin suppresses the elevation of postprandial blood glucose in humans. J. Agric. Food Chem. 2007, 55, 5869–5874. [Google Scholar] [CrossRef]
- Zhang, X.; Quinn, K.; Cruickshank-Quinn, C.; Reisdorph, R.; Reisdorph, N. The application of ion mobility mass spectrometry to metabolomics. Curr. Opin. Chem. Biol. 2018, 42, 60–66. [Google Scholar] [CrossRef]
- Levy, A.J.; Oranzi, N.R.; Ahmadireskety, A.; Kemperman, R.H.J.; Wei, M.S.; Yost, R.A. Recent progress in metabolomics using ion mobility-mass spectrometry. TrAC Trends Anal. Chem. 2019, 116, 274–281. [Google Scholar] [CrossRef]
- Wang, Z.; Kang, D.; Jia, X.; Zhang, H.; Guo, J.; Liu, C.; Meng, Q.; Liu, W. Analysis of alkaloids from Peganum harmala L. sequential extracts by liquid chromatography coupled to ion mobility spectrometry. J. Chromatogr. B Anal. Technol. Biomed. Life Sci. 2018, 1096, 73–79. [Google Scholar] [CrossRef] [PubMed]
- Gao, Y.; Wu, S.; Cong, R.; Xiao, J.; Ma, F. Characterization of lignans in Schisandra chinensis oil with a single analysis process by UPLC-Q/TOF-MS. Chem. Phys. Lipids 2019, 218, 158–167. [Google Scholar] [CrossRef] [PubMed]
- Pimentel-Moral, S.; Borrás-Linares, I.; Lozano-Sánchez, J.; Arráez-Román, D.; Martínez-Férez, A.; Segura-Carretero, A. Supercritical CO2 extraction of bioactive compounds from Hibiscus sabdariffa. J. Supercrit. Fluids 2019, 147, 213–221. [Google Scholar] [CrossRef]
- Bellumori, M.; Innocenti, M.; Binello, A.; Boffa, L.; Mulinacci, N.; Cravotto, G. Selective recovery of rosmarinic and carnosic acids from rosemary leaves under ultrasound- and microwave-assisted extraction procedures. Comptes Rendus Chim. 2016, 19, 699–706. [Google Scholar] [CrossRef]
- Leyva-Jiménez, F.J.; Lozano-Sánchez, J.; Borrás-Linares, I.; Arráez-Román, D.; Segura-Carretero, A. Manufacturing design to improve the attainment of functional ingredients from Aloysia citriodora leaves by advanced microwave technology. J. Ind. Eng. Chem. 2019, 79, 52–61. [Google Scholar] [CrossRef]
- Frond, A.D.; Iuhas, C.I.; Stirbu, I.; Leopold, L.; Socaci, S.; Andreea, S.; Ayvaz, H.; Andreea, S.; Mihai, S.; Diaconeasa, Z.; et al. Phytochemical Characterization of Five Edible Purple-Reddish Vegetables: Anthocyanins, Flavonoids, and Phenolic Acid Derivatives. Molecules 2019, 24, 1536. [Google Scholar] [CrossRef] [Green Version]
- Vallverdú-Queralt, A.; Regueiro, J.; Alvarenga, J.F.R.; Martinez-Huelamo, M.; Leal, L.N.; Lamuela-Raventos, R.M. Characterization of the phenolic and antioxidant profiles of selected culinary herbs and spices: Caraway, turmeric, dill, marjoram and nutmeg. Food Sci. Technol. 2015, 35, 189–195. [Google Scholar] [CrossRef] [Green Version]
- Janjušević, L.; Karaman, M.; Šibul, F.; Tommonaro, G.; Iodice, C.; Jakovljević, D.; Pejin, B. The lignicolous fungus Trametes versicolor (L.) Lloyd (1920): A promising natural source of antiradical and AChE inhibitory agents. J. Enzyme Inhib. Med. Chem. 2017, 32, 355–362. [Google Scholar] [CrossRef] [Green Version]
- Piovesana, A.; Rodrigues, E.; Noreña, C.P.Z. Composition analysis of carotenoids and phenolic compounds and antioxidant activity from hibiscus calyces (Hibiscus sabdariffa L.) by HPLC-DAD-MS/MS. Phytochem. Anal. 2019, 30, 208–217. [Google Scholar] [CrossRef]
- Cádiz-Gurrea, M.L.; Lozano-Sanchez, J.; Contreras-Gámez, M.; Legeai-Mallet, L.; Fernández-Arroyo, S.; Segura-Carretero, A. Isolation, comprehensive characterization and antioxidant activities of Theobroma cacao extract. J. Funct. Foods 2014, 10, 485–498. [Google Scholar] [CrossRef]
- Benedé, S.; Gradillas, A.; Villalba, M.; Batanero, E. Allium porrum Extract Decreases Effector Cell Degranulation and Modulates Airway Epithelial Cell Function. Nutrients 2019, 11, 1303. [Google Scholar] [CrossRef] [PubMed] [Green Version]
- Taamalli, A.; Arráez Román, D.; Gómez Caravaca, A.M.; Zarrouk, M.; Segura Carretero, A. Geographical Characterization of Tunisian Olive Tree Leaves (cv. Chemlali) Using HPLC-ESI-TOF and IT/MS Fingerprinting with Hierarchical Cluster Analysis. J. Anal. Methods Chem. 2018, 2018, 1–10. [Google Scholar] [CrossRef] [PubMed]
- Ribeiro, A.; Caleja, C.; Barros, L.; Santos-Buelga, C.; Barreiro, M.F.; Ferreira, I.C.F.R. Rosemary extracts in functional foods: Extraction, chemical characterization and incorporation of free and microencapsulated forms in cottage cheese. Food Funct. 2016, 7, 2185–2196. [Google Scholar] [CrossRef] [Green Version]
- Orhan, N.; Ekin, H.N.; Şüküroglu, M.K.; Aslan, M. In vitro antidiabetic effect, quantitative studies and UPLC-TOF-MS analysis of black tea samples from Turkish market. J. Res. Pharm. 2019, 23, 484–497. [Google Scholar] [CrossRef] [Green Version]
- Li, R.; Chen, Z.; Tao, Y.; Pan, X.; Jiang, D.; Dong, F.; Xu, J.; Liu, X.; Wu, X.; Zheng, Y. Determination of Valifenalate in Grape, Vegetables, and Soil Using Ultrahigh Performance Liquid Chromatography Tandem Mass Spectrometry and Exploration of Its Degradation Behavior in Grape Field. Food Anal. Methods 2019, 12, 742–751. [Google Scholar] [CrossRef]
- Vallverdú-Queralt, A.; Verbaere, A.; Meudec, E.; Cheynier, V.; Sommerer, N. Straightforward Method To Quantify GSH, GSSG, GRP, and Hydroxycinnamic Acids in Wines by UPLC-MRM-MS. J. Agric. Food Chem. 2015, 63, 142–149. [Google Scholar] [CrossRef]
- Zhang, L.; Tai, Y.; Wang, Y.; Meng, Q.; Yang, Y.; Zhang, S.; Yang, H.; Zhang, Z.; Li, D.; Wan, X. The proposed biosynthesis of procyanidins by the comparative chemical analysis of five Camellia species using LC-MS. Sci. Rep. 2017, 7, 46131. [Google Scholar] [CrossRef] [PubMed] [Green Version]
- Ni, S.; Qian, D.; Duan, J.; Guo, J.; Shang, E.; Shu, Y.; Xue, C. UPLC–QTOF/MS-based screening and identification of the constituents and their metabolites in rat plasma and urine after oral administration of Glechoma longituba extract. J. Chromatogr. B 2010, 878, 2741–2750. [Google Scholar] [CrossRef]
- Phan, A.D.T.; Netzel, G.; Chhim, P.; Netzel, M.E.; Sultanbawa, Y. Phytochemical Characteristics and Antimicrobial Activity of Australian Grown Garlic (Allium Sativum L.) Cultivars. Foods 2019, 8, 358. [Google Scholar] [CrossRef] [Green Version]
- Md Yusof, A.; Abd Gani, S.; Zaidan, U.; Halmi, M.; Zainudin, B. Optimization of an Ultrasound-Assisted Extraction Condition for Flavonoid Compounds from Cocoa Shells (Theobroma cacao) Using Response Surface Methodology. Molecules 2019, 24, 711. [Google Scholar] [CrossRef] [Green Version]
- Pérez-Mendoza, M.B.; Llorens-Escobar, L.; Vanegas-Espinoza, P.E.; Cifuentes, A.; Ibáñez, E.; Villar-Martínez, A.A. Del Chemical characterization of leaves and calli extracts of Rosmarinus officinalis by UHPLC-MS. Electrophoresis 2019, 41, 1776–1783. [Google Scholar] [CrossRef]
- Wang, Y.; Kan, Z.; Wan, X.; McGinley, J.N.; Thompson, H.J. Differences in chemical composition predictive of in vitro biological activity among commercially important cultivars of genus Camellia. Food Chem. 2019, 297, 124950. [Google Scholar] [CrossRef] [PubMed]
- Di Stefano, V.; Pitonzo, R.; Novara, M.E.; Bongiorno, D.; Indelicato, S.; Gentile, C.; Avellone, G.; Bognanni, R.; Scandurra, S.; Melilli, M.G. Antioxidant activity and phenolic composition in pomegranate (Punica granatum L.) genotypes from south Italy by UHPLC-Orbitrap-MS approach. J. Sci. Food Agric. 2019, 99, 1038–1045. [Google Scholar] [CrossRef]
- Gabaston, J.; Leborgne, C.; Waffo-Teguo, P.; Valls, J.; Palos Pinto, A.; Richard, T.; Cluzet, S.; Mérillon, J. Wood and roots of major grapevine cultivars and rootstocks: A comparative analysis of stilbenes by UHPLC-DAD-MS/MS and NMR. Phytochem. Anal. 2019, 30, 320–331. [Google Scholar] [CrossRef]
- Minoja, A.P.; Napoli, C. NMR screening in the quality control of food and nutraceuticals. Food Res. Int. 2014, 63, 126–131. [Google Scholar] [CrossRef]
- Marcone, M.F.; Wang, S.; Albabish, W.; Nie, S.; Somnarain, D.; Hill, A. Diverse food-based applications of nuclear magnetic resonance (NMR) technology. Food Res. Int. 2013, 51, 729–747. [Google Scholar] [CrossRef]
- Laghi, L.; Picone, G.; Capozzi, F. Nuclear magnetic resonance for foodomics beyond food analysis. TrAC Trends Anal. Chem. 2014, 59, 93–102. [Google Scholar] [CrossRef]
- Christophoridou, S.; Dais, P. Detection and quantification of phenolic compounds in olive oil by high resolution 1H nuclear magnetic resonance spectroscopy. Anal. Chim. Acta 2009, 633, 283–292. [Google Scholar] [CrossRef] [PubMed]
- Manjunatha Reddy, G.N.; Mannina, L.; Sobolev, A.P.; Caldarelli, S. Polyphenols Fingerprinting in Olive Oils Through Maximum-Quantum NMR Spectroscopy. Food Anal. Methods 2018, 11, 1012–1020. [Google Scholar] [CrossRef]
- Liang, T.; Wei, F.; Lu, Y.; Kodani, Y.; Nakada, M.; Miyakawa, T.; Tanokura, M. Comprehensive NMR analysis of compositional changes of black garlic during thermal processing. J. Agric. Food Chem. 2015, 63, 683–691. [Google Scholar] [CrossRef]
- Lee, J.E.; Lee, B.J.; Chung, J.O.; Shin, H.J.; Lee, S.J.; Lee, C.H.; Hong, Y.S. 1H NMR-based metabolomic characterization during green tea (Camellia sinensis) fermentation. Food Res. Int. 2011, 44, 597–604. [Google Scholar] [CrossRef]
- Caruso, M.; Galgano, F.; Castiglione Morelli, M.A.; Viggiani, L.; Lencioni, L.; Giussani, B.; Favati, F. Chemical profile of white wines produced from “Greco bianco” grape variety in different Italian areas by nuclear magnetic resonance (NMR) and conventional physicochemical analyses. J. Agric. Food Chem. 2012, 60, 7–15. [Google Scholar] [CrossRef] [PubMed]
- Jallali, I.; Waffo Téguo, P.; Smaoui, A.; Mérillon, J.M.; Abdelly, C.; Ksouri, R. Bio-guided fractionation and characterization of powerful antioxidant compounds from the halophyte Inula crithmoїdes. Arab. J. Chem. 2018. [Google Scholar] [CrossRef]
- Alegbe, E.O.; Teralı, K.; Olofinsan, K.A.; Surgun, S.; Ogbaga, C.C.; Ajiboye, T.O. Antidiabetic activity-guided isolation of gallic and protocatechuic acids from Hibiscus sabdariffa calyxes. J. Food Biochem. 2019, 43, 1–12. [Google Scholar] [CrossRef] [PubMed]
- Degenhardt, A.; Knapp, H.; Winterhalter, P. Separation and purification of anthocyanins by high-speed countercurrent chromatography and screening for antioxidant activity. J. Agric. Food Chem. 2000, 48, 338–343. [Google Scholar] [CrossRef]
- Grajeda-Iglesias, C.; Figueroa-Espinoza, M.C.; Barouh, N.; Baréa, B.; Fernandes, A.; De Freitas, V.; Salas, E. Isolation and Characterization of Anthocyanins from Hibiscus sabdariffa Flowers. J. Nat. Prod. 2016, 79, 1709–1718. [Google Scholar] [CrossRef]
- Moraes, V.R.S.; Thomasi, S.S.; Sprenger, R.F.; Prado, V.M.J.; Cruz, E.M.O.; Cass, Q.B.; Ferreira, A.G.; Blank, A.F. Secondary metabolites from an infusion of Lippia gracilis schauer using the LC-DAD-SPE/NMR hyphenation technique. J. Braz. Chem. Soc. 2017, 28, 1335–1340. [Google Scholar] [CrossRef]
- Li, L.; Zhang, S.; Cui, Y.; Li, Y.; Luo, L.; Zhou, P.; Sun, B. Preparative separation of cacao bean procyanidins by high-speed counter-current chromatography. J. Chromatogr. B Anal. Technol. Biomed. Life Sci. 2016, 1036–1037, 10–19. [Google Scholar] [CrossRef]
- Ma, W.; Waffo-Téguo, P.; Jourdes, M.; Li, H.; Teissedre, P.L. First evidence of epicatechin vanillate in grape seed and red wine. Food Chem. 2018, 259, 304–310. [Google Scholar] [CrossRef] [PubMed]
- Zhang, Y.; Adelakun, T.A.; Qu, L.; Li, X.; Li, J.; Han, L.; Wang, T. New terpenoid glycosides obtained from Rosmarinus officinalis L. aerial parts. Fitoterapia 2014, 99, 78–85. [Google Scholar] [CrossRef]
- Ahmed, A.F.; Al-Yousef, H.M.; Al-Qahtani, J.H.; Al-Said, M.S. A hepatonephro-protective phenolic-rich extract from red onion (Allium cepa L.) peels. Pak. J. Pharm. Sci. 2017, 30, 1971–1979. [Google Scholar] [PubMed]
- Hu, M.; Wu, B.; Liu, Z. Bioavailability of Polyphenols and Flavonoids in the Era of Precision Medicine. Mol. Pharm. 2017, 14, 2861–2863. [Google Scholar] [CrossRef] [Green Version]
- Ulaszewska, M.M.; Weinert, C.H.; Trimigno, A.; Portmann, R.; Andres Lacueva, C.; Badertscher, R.; Brennan, L.; Brunius, C.; Bub, A.; Capozzi, F.; et al. Nutrimetabolomics: An Integrative Action for Metabolomic Analyses in Human Nutritional Studies. Mol. Nutr. Food Res. 2019, 63, 1800384. [Google Scholar] [CrossRef]
- Velderrain-Rodríguez, G.R.; Palafox-Carlos, H.; Wall-Medrano, A.; Ayala-Zavala, J.F.; Chen, C.-Y.O.; Robles-Sánchez, M.; Astiazaran-García, H.; Alvarez-Parrilla, E.; González-Aguilar, G.A. Phenolic compounds: Their journey after intake. Food Funct. 2014, 5, 189–197. [Google Scholar] [CrossRef]
- Dima, C.; Assadpour, E.; Dima, S.; Jafari, S.M. Bioavailability and bioaccessibility of food bioactive compounds; overview and assessment by in vitro methods. Compr. Rev. Food Sci. Food Saf. 2020, 19, 2862–2884. [Google Scholar] [CrossRef]
- Mülek, M.; Högger, P. Highly sensitive analysis of polyphenols and their metabolites in human blood cells using dispersive SPE extraction and LC-MS/MS. Anal. Bioanal. Chem. 2015, 407, 1885–1899. [Google Scholar] [CrossRef]
- Zhang, L.; Han, Y.; Shan, J.; Liang, Y.; Xu, L.; Zhang, S.; Li, J.; Wan, X. Simultaneous determination of seven catechins in rat plasma by ultra-high performance liquid chromatography tandem mass spectrometry and its application to a pharmacokinetics study. Anal. Methods 2015, 7, 9415–9420. [Google Scholar] [CrossRef]
- Tao, Y.; Xu, X.; Yan, J.; Cai, B. A sensitive UPLC–MS/MS method for simultaneous determination of polyphenols in rat plasma: Application to a pharmacokinetic study of dispensing granules and standard decoction of Cinnamomum cassia twigs. Biomed. Chromatogr. 2019, 33, 1–8. [Google Scholar] [CrossRef] [PubMed]
- Chen, T.Y.; Ferruzzi, M.G.; Wu, Q.L.; Simon, J.E.; Talcott, S.T.; Wang, J.; Ho, L.; Todd, G.; Cooper, B.; Pasinetti, G.M.; et al. Influence of diabetes on plasma pharmacokinetics and brain bioavailability of grape polyphenols and their phase II metabolites in the Zucker diabetic fatty rat. Mol. Nutr. Food Res. 2017, 61, 1–13. [Google Scholar] [CrossRef]
- De Ferrars, R.M.; Czank, C.; Zhang, Q.; Botting, N.P.; Kroon, P.A.; Cassidy, A.; Kay, C.D. The pharmacokinetics of anthocyanins and their metabolites in humans. Br. J. Pharmacol. 2014, 171, 3268–3282. [Google Scholar] [CrossRef] [Green Version]
- Chen, W.; Yeo, S.C.M.; Elhennawy, M.G.A.A.; Lin, H.-S. Oxyresveratrol: A bioavailable dietary polyphenol. J. Funct. Foods 2016, 22, 122–131. [Google Scholar] [CrossRef]
- Zeng, X.; Su, W.; Zheng, Y.; He, Y.; He, Y.; Rao, H.; Peng, W.; Yao, H. Pharmacokinetics, Tissue Distribution, Metabolism, and Excretion of Naringin in Aged Rats. Front. Pharmacol. 2019, 10, 1–12. [Google Scholar] [CrossRef] [PubMed]
- Wang, J.; Li, G.; Rui, T.; Kang, A.; Li, G.; Fu, T.; Li, J.; Di, L.; Cai, B. Pharmacokinetics of rosmarinic acid in rats by LC-MS/MS: Absolute bioavailability and dose proportionality. RSC Adv. 2017, 7, 9057–9063. [Google Scholar] [CrossRef] [Green Version]
- López de las Hazas, M.-C.; Rubió, L.; Kotronoulas, A.; De la Torre, R.; Solà, R.; Motilva, M.-J. Dose effect on the uptake and accumulation of hydroxytyrosol and its metabolites in target tissues in rats. Mol. Nutr. Food Res. 2015, 59, 1395–1399. [Google Scholar] [CrossRef] [Green Version]
- Ye, W.; Chen, R.; Sun, W.; Huang, C.; Lin, X.; Dong, Y.; Wen, C.; Wang, X. Determination and pharmacokinetics of engeletin in rat plasma by ultra-high performance liquid chromatography with tandem mass spectrometry. J. Chromatogr. B 2017, 1060, 144–149. [Google Scholar] [CrossRef] [PubMed]
- Zhang, C.; Ma, W.; Zhang, Y.; Wang, Q.; Qin, C.; Du, S.; Huang, L.; Ye, F.; Chen, L.; Zheng, T. Pharmacokinetics, Bioavailability, and Tissue Distribution Study of Angoroside C and Its Metabolite Ferulic Acid in Rat Using UPLC-MS/MS. Front. Pharmacol. 2018, 9, 1186. [Google Scholar] [CrossRef] [Green Version]
- Wang, C.; Li, Q.; Han, G.; Zou, L.; Lv, L.; Zhou, Q.; Li, N. LC-MS / MS for Simultaneous Determination of Four Major Active Catechins of Tea Polyphenols in Rat Plasma and Its Application to Pharmacokinetics. Chinese Herb. Med. 2010, 2, 289–296. [Google Scholar]
- Tresserra-Rimbau, A.; Lamuela-Raventos, R.M.; Moreno, J.J. Polyphenols, food and pharma. Current knowledge and directions for future research. Biochem. Pharmacol. 2018, 156, 186–195. [Google Scholar] [CrossRef] [PubMed]
- Chang, H.-Y.; Hsueh, T.Y.; Tsai, T.-H. Monitoring of polyphenol mangiferin by liquid chromatography tandem mass spectrometry in rat and its comparative pharmacokinetic study of a single compound, a single botanic extract and multiple botanic extract. Sep. Sci. Plus 2018, 1, 603–618. [Google Scholar] [CrossRef]
- Nair, A.; Jacob, S. A simple practice guide for dose conversion between animals and human. J. Basic Clin. Pharm. 2016, 7, 27. [Google Scholar] [CrossRef] [Green Version]
- Bohn, T. Dietary factors affecting polyphenol bioavailability. Nutr. Rev. 2014, 72, 429–452. [Google Scholar] [CrossRef]
- Scalbert, A.; Williamson, G. Dietary Intake and Bioavailability of Polyphenols. Proc. J. Nutr. 2000, 3, 121–125. [Google Scholar] [CrossRef]
- Scalbert, A.; Morand, C.; Manach, C.; Rémésy, C. Absorption and metabolism of polyphenols in the gut and impact on health. Biomed. Pharmacother. 2002, 56, 276–282. [Google Scholar] [CrossRef]
- Achour, M.; Bravo, L.; Sarriá, B.; Ben Fredj, M.; Nouira, M.; Mtiraoui, A.; Saguem, S.; Mateos, R. Bioavailability and nutrikinetics of rosemary tea phenolic compounds in humans. Food Res. Int. 2021, 139, 109815. [Google Scholar] [CrossRef] [PubMed]
- Gómez-Juaristi, M.; Sarria, B.; Martínez-López, S.; Clemente, L.B.; Mateos, R. Flavanol bioavailability in two cocoa products with different phenolic content. A comparative study in humans. Nutrients 2019, 11, 1441. [Google Scholar] [CrossRef] [Green Version]
- Salas-Salvadó, J.; Bulló, M.; Babio, N.; Martínez-González, M.Á.; Ibarrola-Jurado, N.; Basora, J.; Estruch, R.; Covas, M.I.; Corella, D.; Arós, F.; et al. Reduction in the incidence of type 2 diabetes with the Mediterranean diet: Results of the PREDIMED-Reus nutrition intervention randomized trial. Diabetes Care 2011, 34, 14–19. [Google Scholar] [CrossRef] [Green Version]
- Zheng, H.; Clausen, M.R.; Dalsgaard, T.K.; Bertram, H.C. Metabolomics to explore impact of dairy intake. Nutrients 2015, 7, 4875–4896. [Google Scholar] [CrossRef] [Green Version]
- Khymenets, O.; Andres-Lacueva, C.; Urpi-Sarda, M.; Vazquez-Fresno, R.; Mart, M.M.; Reglero, G.; Torres, M.; Llorach, R. Metabolic fingerprint after acute and under sustained consumption of a functional beverage based on grape skin extract in healthy human subjects. Food Funct. 2015, 6, 1288–1298. [Google Scholar] [CrossRef] [Green Version]
- Panahi, Y.; Khalili, N.; Hosseini, M.S.; Abbasinazari, M.; Sahebkar, A. Lipid-modifying effects of adjunctive therapy with curcuminoids-piperine combination in patients with metabolic syndrome: Results of a randomized controlled trial. Complement. Ther. Med. 2014, 22, 851–857. [Google Scholar] [CrossRef] [PubMed]
- Venturini, D.; Simão, A.N.C.; Urbano, M.R.; Dichi, I. Effects of extra virgin olive oil and fish oil on lipid profile and oxidative stress in patients with metabolic syndrome. Nutrition 2015, 31, 834–840. [Google Scholar] [CrossRef] [PubMed]
- Guasch-Ferré, M.; Bhupathiraju, S.N.; Hu, F.B. Use of Metabolomics in Improving Assessment of Dietary Intake. Clin. Chem. 2018, 64, 82–98. [Google Scholar] [CrossRef] [PubMed] [Green Version]
- Zhou, B.; Feng Xiao, J.; Tuli, L.; Ressom, H.W. LC-MS-based metabolomics. Mol. BioSyst. 2012, 8, 470–481. [Google Scholar] [CrossRef] [Green Version]
- Koek, M.M.; Jellema, R.H.; Van der Greef, J.; Tas, A.C.; Hankemeier, T. Quantitative metabolomics based on gas chromatography mass spectrometry: Status and perspectives. Metabolomics 2011, 7, 307–328. [Google Scholar] [CrossRef] [Green Version]
- Emwas, A.-H.; Roy, R.; McKay, R.T.; Tenori, L.; Saccenti, E.; Gowda, G.A.N.; Raftery, D.; Alahmari, F.; Jaremko, L.; Jaremko, M.; et al. NMR Spectroscopy for Metabolomics Research. Metabolites 2019, 9, 123. [Google Scholar] [CrossRef] [PubMed] [Green Version]
- Brennan, L. Metabolomics in nutrition research: Current status and perspectives. Biochem. Soc. Trans. 2013, 41, 670–673. [Google Scholar] [CrossRef]
- Wong, M.; Lodge, J.K. A metabolomic investigation of the effects of vitamin E supplementation in humans. Nutr. Metab. (Lond). 2012, 9, 110. [Google Scholar] [CrossRef] [Green Version]
- Fardet, A.; Llorach, R.; Martin, J.F.; Besson, C.; Lyan, B.; Pujos-Guillot, E.; Scalbert, A. A liquid chromatography-quadrupole time-of-flight (LC-QTOF)-Based metabolomic approach reveals new metabolic effects of catechin in rats fed high-fat diets. J. Proteome Res. 2008, 7, 2388–2398. [Google Scholar] [CrossRef]
- Korsholm, A.S.; Kjær, T.N.; Ornstrup, M.J.; Pedersen, S.B. Comprehensive metabolomic analysis in blood, urine, fat, and muscle in men with metabolic syndrome: A randomized, placebo-controlled clinical trial on the effects of resveratrol after four months’ treatment. Int. J. Mol. Sci. 2017, 18, 554. [Google Scholar] [CrossRef] [PubMed] [Green Version]
- Tranchida, F.; Shintu, L.; Rakotoniaina, Z.; Tchiakpe, L.; Deyris, V.; Hiol, A.; Caldarelli, S. Metabolomic and lipidomic analysis of serum samples following Curcuma longa extract supplementation in high-fructose and saturated fat fed rats. PLoS One 2015, 10, 1–19. [Google Scholar] [CrossRef] [PubMed] [Green Version]
- Godzien, J.; Ciborowski, M.; Angulo, S.; Ruperez, F.J.; Martínez, M.P.; Señorans, F.J.; Cifuentes, A.; Ibañez, E.; Barbas, C. Metabolomic approach with LC-QTOF to study the effect of a nutraceutical treatment on urine of diabetic rats. J. Proteome Res. 2011, 10, 837–844. [Google Scholar] [CrossRef] [PubMed]
- Jacobs, D.M.; Fuhrmann, J.C.; Van Dorsten, F.A.; Rein, D.; Peters, S.; Van Velzen, E.J.J.; Hollebrands, B.; Draijer, R.; Van Duynhoven, J.; Garczarek, U. Impact of short-term intake of red wine and grape polyphenol extract on the human metabolome. J. Agric. Food Chem. 2012, 60, 3078–3085. [Google Scholar] [CrossRef] [PubMed]
- Fernández-Ochoa, Á.; Borrás-Linares, I.; Baños, A.; García-López, J.D.; Guillamón, E.; Nuñez-Lechado, C.; Quirantes-Piné, R.; Segura-Carretero, A. A fingerprinting metabolomic approach reveals deregulation of endogenous metabolites after the intake of a bioactive garlic supplement. J. Funct. Foods 2018, 49, 137–145. [Google Scholar] [CrossRef]
- Lundstedt, T.; Hedenström, M.; Soeria-Atmadja, D.; Hammerling, U.; Gabrielsson, J.; Olsson, J.; Trygg, J. Dynamic modelling of time series data in nutritional metabonomics - A powerful complement to randomized clinical trials in functional food studies. Chemom. Intell. Lab. Syst. 2010, 104, 112–120. [Google Scholar] [CrossRef]
- Grün, C.H.; Van Dorsten, F.A.; Jacobs, D.M.; Le Belleguic, M.; Van Velzen, E.J.J.; Bingham, M.O.; Janssen, H.G.; Van Duynhoven, J.P.M. GC-MS methods for metabolic profiling of microbial fermentation products of dietary polyphenols in human and in vitro intervention studies. J. Chromatogr. B Anal. Technol. Biomed. Life Sci. 2008, 871, 212–219. [Google Scholar] [CrossRef]
- González-Peña, D.; Dudzik, D.; García, A.; De Ancos, B.; Barbas, C.; Sánchez-Moreno, C. Metabolomic fingerprinting in the comprehensive study of liver changes associated with onion supplementation in hypercholesterolemic Wistar rats. Int. J. Mol. Sci. 2017, 18, 267. [Google Scholar] [CrossRef] [Green Version]
- Hong, Y.S.; Hong, K.S.; Park, M.H.; Ahn, Y.T.; Lee, J.H.; Huh, C.S.; Lee, J.; Kim, I.K.; Hwang, G.S.; Kim, J.S. Metabonomic understanding of probiotic effects in humans with irritable bowel syndrome. J. Clin. Gastroenterol. 2011, 45, 415–425. [Google Scholar] [CrossRef]
- Urpi-Sarda, M.; Monagas, M.; Khan, N.; Llorach, R.; Lamuela-Raventós, R.M.; Jáuregui, O.; Estruch, R.; Izquierdo-Pulido, M.; Andrés-Lacueva, C. Targeted metabolic profiling of phenolics in urine and plasma after regular consumption of cocoa by liquid chromatography-tandem mass spectrometry. J. Chromatogr. A 2009, 1216, 7258–7267. [Google Scholar] [CrossRef] [PubMed]
- Katajamaa, M.; Orešič, M. Data processing for mass spectrometry-based metabolomics. J. Chromatogr. A 2007, 1158, 318–328. [Google Scholar] [CrossRef]
- Fernández-Ochoa, Á.; Quirantes-Piné, R.; Borrás-Linares, I.; Cádiz-Gurrea, M.; De la Luz Cádiz-Gurrea, M.; Alarcón Riquelme, M.E.; Brunius, C.; Segura-Carretero, A. A Case Report of Switching from Specific Vendor-Based to R-Based Pipelines for Untargeted LC-MS Metabolomics. Metabolites 2020, 10, 28. [Google Scholar] [CrossRef] [Green Version]
- Pinto, R.C. Chemometrics Methods and Strategies in Metabolomics. In Metabolomics: From Fundamentals to Clinical Applications. Advances in Experimental Medicine and Biology; Springer: Berlin, Germany, 2017; Volume 965, pp. 163–190. [Google Scholar]
- Worley, B.; Powers, R. Multivariate Analysis in Metabolomics. Curr. Metabolomics 2013, 1, 92–107. [Google Scholar]
- Gil de la Fuente, A.; Grace Armitage, E.; Otero, A.; Barbas, C.; Godzien, J. Differentiating signals to make biological sense—A guide through databases for MS-based non-targeted metabolomics. Electrophoresis 2017, 38, 2242–2256. [Google Scholar] [CrossRef] [Green Version]
- Chaleckis, R.; Meister, I.; Zhang, P.; Wheelock, C.E. Challenges, progress and promises of metabolite annotation for LC–MS-based metabolomics. Curr. Opin. Biotechnol. 2019, 55, 44–50. [Google Scholar] [CrossRef] [PubMed]
- Wang, Y.; Tang, H.; Nicholson, J.K.; Hylands, P.J.; Sampson, J.; Holmes, E. A metabonomic strategy for the detection of the metabolic effects of chamomile (Matricaria recutita L.) ingestion. J. Agric. Food Chem. 2005, 53, 191–196. [Google Scholar] [CrossRef] [PubMed]
- Vieira-Potter, V.J.; Cross, T.W.L.; Swanson, K.S.; Sarma, S.J.; Lei, Z.; Sumner, L.W.; Rosenfeld, C.S. Soy-Induced Fecal Metabolome Changes in Ovariectomized and Intact Female Rats: Relationship with Cardiometabolic Health. Sci. Rep. 2018, 8, 1–12. [Google Scholar] [CrossRef] [PubMed]


| MS Detector | GC Column | Gradient (°C) | Compounds Detected | Matrix | Ref. |
|---|---|---|---|---|---|
| TOF | DB-5 MS (30 m) | 60 to 300 (multistep increase) | Terpenes | Curcuma species | [29] |
| BPX5 (30 m) | 40 to 270 (4 °C/min) | Essential oils | Rosmarinus officinalis | [30] | |
| Q | RTS volatile (30 m) | 70 to 280 (5 °C/min) | Organic sulfur compounds | Allium sativum | [31] |
| HP-88 (100m) | 70 to 230 (10 °C/min) | Essential oils | Lippia citriodora | [32] | |
| RESTEK Rtx®-5 (30 m) | 70 to 320 (7 °C/min) | Essential oils and derivatives | Allium cepa | [33] | |
| SUPELCOWAX 10 (30 m) | 60 to 240 (4 °C/min) 40 to 240 (multistep increase) | Essential oils | Camellia sinensis | [34] | |
| HP-5MS (30 m) | 50 to 280 (multistep increase) | Essential oils | Curcuma species | [35] | |
| DB-1MS (60 m) | 50 to 180 (2 °C/min) | Essential oils and hydrosols | Rosmarinus officinalis | [36] | |
| SUPELCOWAX 10 (30 m) | 50 to 200 (5 °C/min) | Essential oils | Rosmarinus officinalis | [37] | |
| QQQ | HP-5MS (30 m) | 80 to 300 (multistep increase) | Essential oils | Curcuma longa | [38] |
| Q-TOF | HP-5MS (30 m) | 250 to 310 (multistep increase) | Triterpenoids | Olea europaea | [39] |
| HP-5MS (30 m) | 250 to 310 (10 °C/min) | Phytosterols and Tocopherols | Mangifera species | [40] | |
| RTX-200MS (30 m) | 250 to 310 (10 °C/min) |
| LC Platform | MS Detector | Column | Ionization Mode | Compounds Detected | Matrix | Ref. |
|---|---|---|---|---|---|---|
| HPLC | TOF | Zorbax Eclipse Plus C18 | Negative | Organic acids, phenolic acids and flavonoids | Hibiscus sabdariffa | [51] |
| RP18 | Negative | Flavonoids, terpenoids | Rosemary officinalis | [52] | ||
| Zorbax Eclipse Plus C18 | Negative | Iridoid glycosides, flavonoids and phenylethanoids | Lippia ciriodora | [53] | ||
| Quadrupole | Eclipse XDB C18 | Positive | Anthocyanins | Allium cepa | [54] | |
| Phenomenex Luna C18 | Negative | Phenolic acids and flavonoids | Curcuma longa | [55] | ||
| Triple Quad | Zorbax Eclipse XDB-C18 | Negative | Phenolic compounds | Trametes versicolor | [56] | |
| Q-TOF | YMC C30 Synergi Hydro-RPC18 | Positive and negative | Carotenoids, organic acids, phenolic acids and flavonoids | Hibiscus sabdariffa | [57] | |
| Zorbax Eclipse Plus C18 | Negative | Flavonoids | Theobroma cacao | [58] | ||
| Orbitrap | Zorbax Eclipse XDB-C18 | Positive and negative | Flavonoids | Allium ampeloprasum | [59] | |
| Zorbax Eclipse Plus C18 | Negative | Secoiridoids, flavonoids and related compounds | Olea europaea | [60] | ||
| Qtrap | Waters Spherisorb S3 ODS-2 C18 | Negative | Phenolic acids and flavonoids | Rosemary officinalis | [61] | |
| UHPLC | TOF | Acquity UHPLC BEH C18 | Positive and negative | phenolic acids flavonoids and gallotanins | Camellia sinensis | [62] |
| Quadrupole | Acquity UHPLC BEH C18 | Positive | Valifenalate | Vitis vinifera | [63] | |
| Acquity HSS T3 | Positive and negative | Hydroxycinnamic acids | Vitis vinifera | [64] | ||
| Acquity UPLC shield RP-18 | Negative | Epigallocatechin | Camellia sinensis | [65] | ||
| Q-TOF | Waters ACQUITY UPLC BEH C18 | Negative | Phenolic acids, flavonoids | Glechoma longituba | [66] | |
| Waters HSS-T3 column Waters C18 BEH Waters BEH-Amide | Positive and negative | Phenolic acids, anthocyanins and organosulfur compounds | Allium sativum | [67] | ||
| ACQUITY UPLC HSS T3 | Negative | Procyanidin | Theobroma cacao | [68] | ||
| Hypersil Gold | Negative | Terpenes, flavonoids, phenolic acids | Rosemary officinalis | [69] | ||
| Waters Acquity UPLC C8 | Positive and negative | Epigallocatechin gallates | Camellia sinensis | [70] | ||
| Orbitrap | Phenomenex Luna C18 | Positive and negative | Phenolic acids, flavonoids, tannins and anthocyanin-derived pigments | Punica granatum | [71] | |
| Zorbax SB-C18 | Negative | Stilbenes | Vitis Vinifera | [72] |
| Bioactive Compound, Extract or Supplement | Analytical Technique | Biological Samples | Population | Dose/Intervention | Results | Ref |
|---|---|---|---|---|---|---|
| Catechin | LC(RP)-QTOF–MS | Plasma, urine, heart, liver and aorta | 24 male Wistar rats divided in different groups | Diet supplemented or not with 0.2% (+)-catechin. | 76 variables affected by catechin supplementation | [125] |
| Resveratrol | UPLC(RP)-Orbitrap–MS/MS GC-EI-Q–MS | Blood, urine, adipose tissue, skeletal muscle tissue | 66 men subjects with metabolic syndrome |
| Reduced sulphated androgen precursors, long-chain PUFAs (n-3 and n-6) increased in adipose tissue, | [126] |
| Vitamin E | LC(RP)–MS(QTOF) | Plasma samples | 10 male adults | 400 mg/d of RRR-α-tocopheryl acetate (4 weeks) | Influence in phospholipid metabolism and lysoPC generation | [124] |
| Cocoa (Theobroma cacao L.) | LC(RP)-QQQ–MS/MS | 24 h urine and fasting plasma samples | 19 men and 23 women presenting high risk of cardiovascular heart disease |
| Increase in the urinary excretion of colonic microbial-derived phenolic metabolites, and biomarkers of the intake. | [135] |
| Chamomile extract | 1H NMR | Urine samples | 14 healthy volunteers | 5 g of powder in 200 mL of boiling water (5 times/day). Duration: 2 weeks | Depletion of creatinine and the elevation of hippurate, glycine | [142] |
| Curcuma longa extract (1% of curcuminoids) | 1H NMR, GC-ITQ–MS (Fatty acids) | Serum samples | 30 rats (animal model) |
| Metabolic differences in MUFA, n-3 PUFA, glycoproteins, glutamine and methanol (fatty acid metabolism) | [127] |
| Rosemary extract | LC(RP)-QTOF–MS | Urine samples | 30 streptozotocin-induced diabetic rats | R.officinalis (150 mg) plus folic acid (15 mg) | Several amino acids and their metabolites point to changes due to the effect of the gut microbiota | [128] |
| Soy | GC-Q–MS | Fecal samples | 35 female rats | SOY diet (590 mg/kg od soy isoflavones) or placebo. Duration: 29 weeks | SOY-fed animals had greater fecal concentrations of the beneficial bacterial metabolite, S-equol | [143] |
| Soy beef and grapefruit juice | 1H NMR | Serum samples | 25 healthy male volunteers | 140 g of soy bean beefs and 500 mL of grapefruit juice per day for four consecutive days | Decrease of lactate, cholesterols and triglycerides | [131] |
| Probiotic fermented milk | 1H NMR | Serum and fecal samples | 74 patients with irritable bowel syndrome | Probiotic fermented milk (150 mL) or placebo 3/times daily for 8 weeks | Dysregulation in energy homeostasis (serum glucose) and liver function (serum tyrosine) | [134] |
| Supplement based on polyphenols from wine and red grape | GC-TOF–MS | Blood, 24 h urine, and fecal samples | 26 adult human volunteers | Cellulose capsules with a polyphenol-rich mix of red wine and red grape juice extracts (800 mg of polyphenols) or placebo. Duration: 4 weeks | Increase of phenolic acids and evaluation of the gut microbial impact | [132] |
| Functional food based on grape skin polyphenols | LC(RP)-QTOF–MS | 24 h urine samples | 31 volunteers | 187 mL of the functional beverage, containing a grape skin extract Control beverage as a placebo Duration: 15 days | Presence offirst-stage microbial metabolites of flavanols Several epicatechin and phenolic acid metabolites as markers of the intake | [116] |
| Red wine and grape juice extracts (WGM) | GC-Q–MS LC(RP)-QQQ–MS | Urine and plasma samples | 35 healthy males | WGM in gelatin capusles (870 mg of dry weight red wine extract and 540 mg of dry weight grape juice extract) or placebo. Duration: 5 days | Alteration of microbial protein fermentation and amino acid metabolism (tyrosine, tryptophan). | [129] |
| Garlic (allium sativum) supplement Aliocare® | LC(RP)-ESI-QTOF–MS | Plasma samples | 30 healthy volunteers (15 men and 15 women) | One gelatine capsule contained per day (70 mg of garlic supplement). Duration: 1 month | Increase in lysophosphatidylcholines, lysophosphatidylethanolamines and acylcarnitines. Decrease of four fructosamines | [130] |
Publisher’s Note: MDPI stays neutral with regard to jurisdictional claims in published maps and institutional affiliations. |
© 2021 by the authors. Licensee MDPI, Basel, Switzerland. This article is an open access article distributed under the terms and conditions of the Creative Commons Attribution (CC BY) license (http://creativecommons.org/licenses/by/4.0/).
Share and Cite
Fernández-Ochoa, Á.; Leyva-Jiménez, F.J.; De la Luz Cádiz-Gurrea, M.; Pimentel-Moral, S.; Segura-Carretero, A. The Role of High-Resolution Analytical Techniques in the Development of Functional Foods. Int. J. Mol. Sci. 2021, 22, 3220. https://0-doi-org.brum.beds.ac.uk/10.3390/ijms22063220
Fernández-Ochoa Á, Leyva-Jiménez FJ, De la Luz Cádiz-Gurrea M, Pimentel-Moral S, Segura-Carretero A. The Role of High-Resolution Analytical Techniques in the Development of Functional Foods. International Journal of Molecular Sciences. 2021; 22(6):3220. https://0-doi-org.brum.beds.ac.uk/10.3390/ijms22063220
Chicago/Turabian StyleFernández-Ochoa, Álvaro, Francisco Javier Leyva-Jiménez, María De la Luz Cádiz-Gurrea, Sandra Pimentel-Moral, and Antonio Segura-Carretero. 2021. "The Role of High-Resolution Analytical Techniques in the Development of Functional Foods" International Journal of Molecular Sciences 22, no. 6: 3220. https://0-doi-org.brum.beds.ac.uk/10.3390/ijms22063220