
High Mobility Group Box 1 Promotes Lung Cancer Cell Migration and Motility via Regulation of Dynamin-Related Protein 1

 , ,
, ,  , , , and
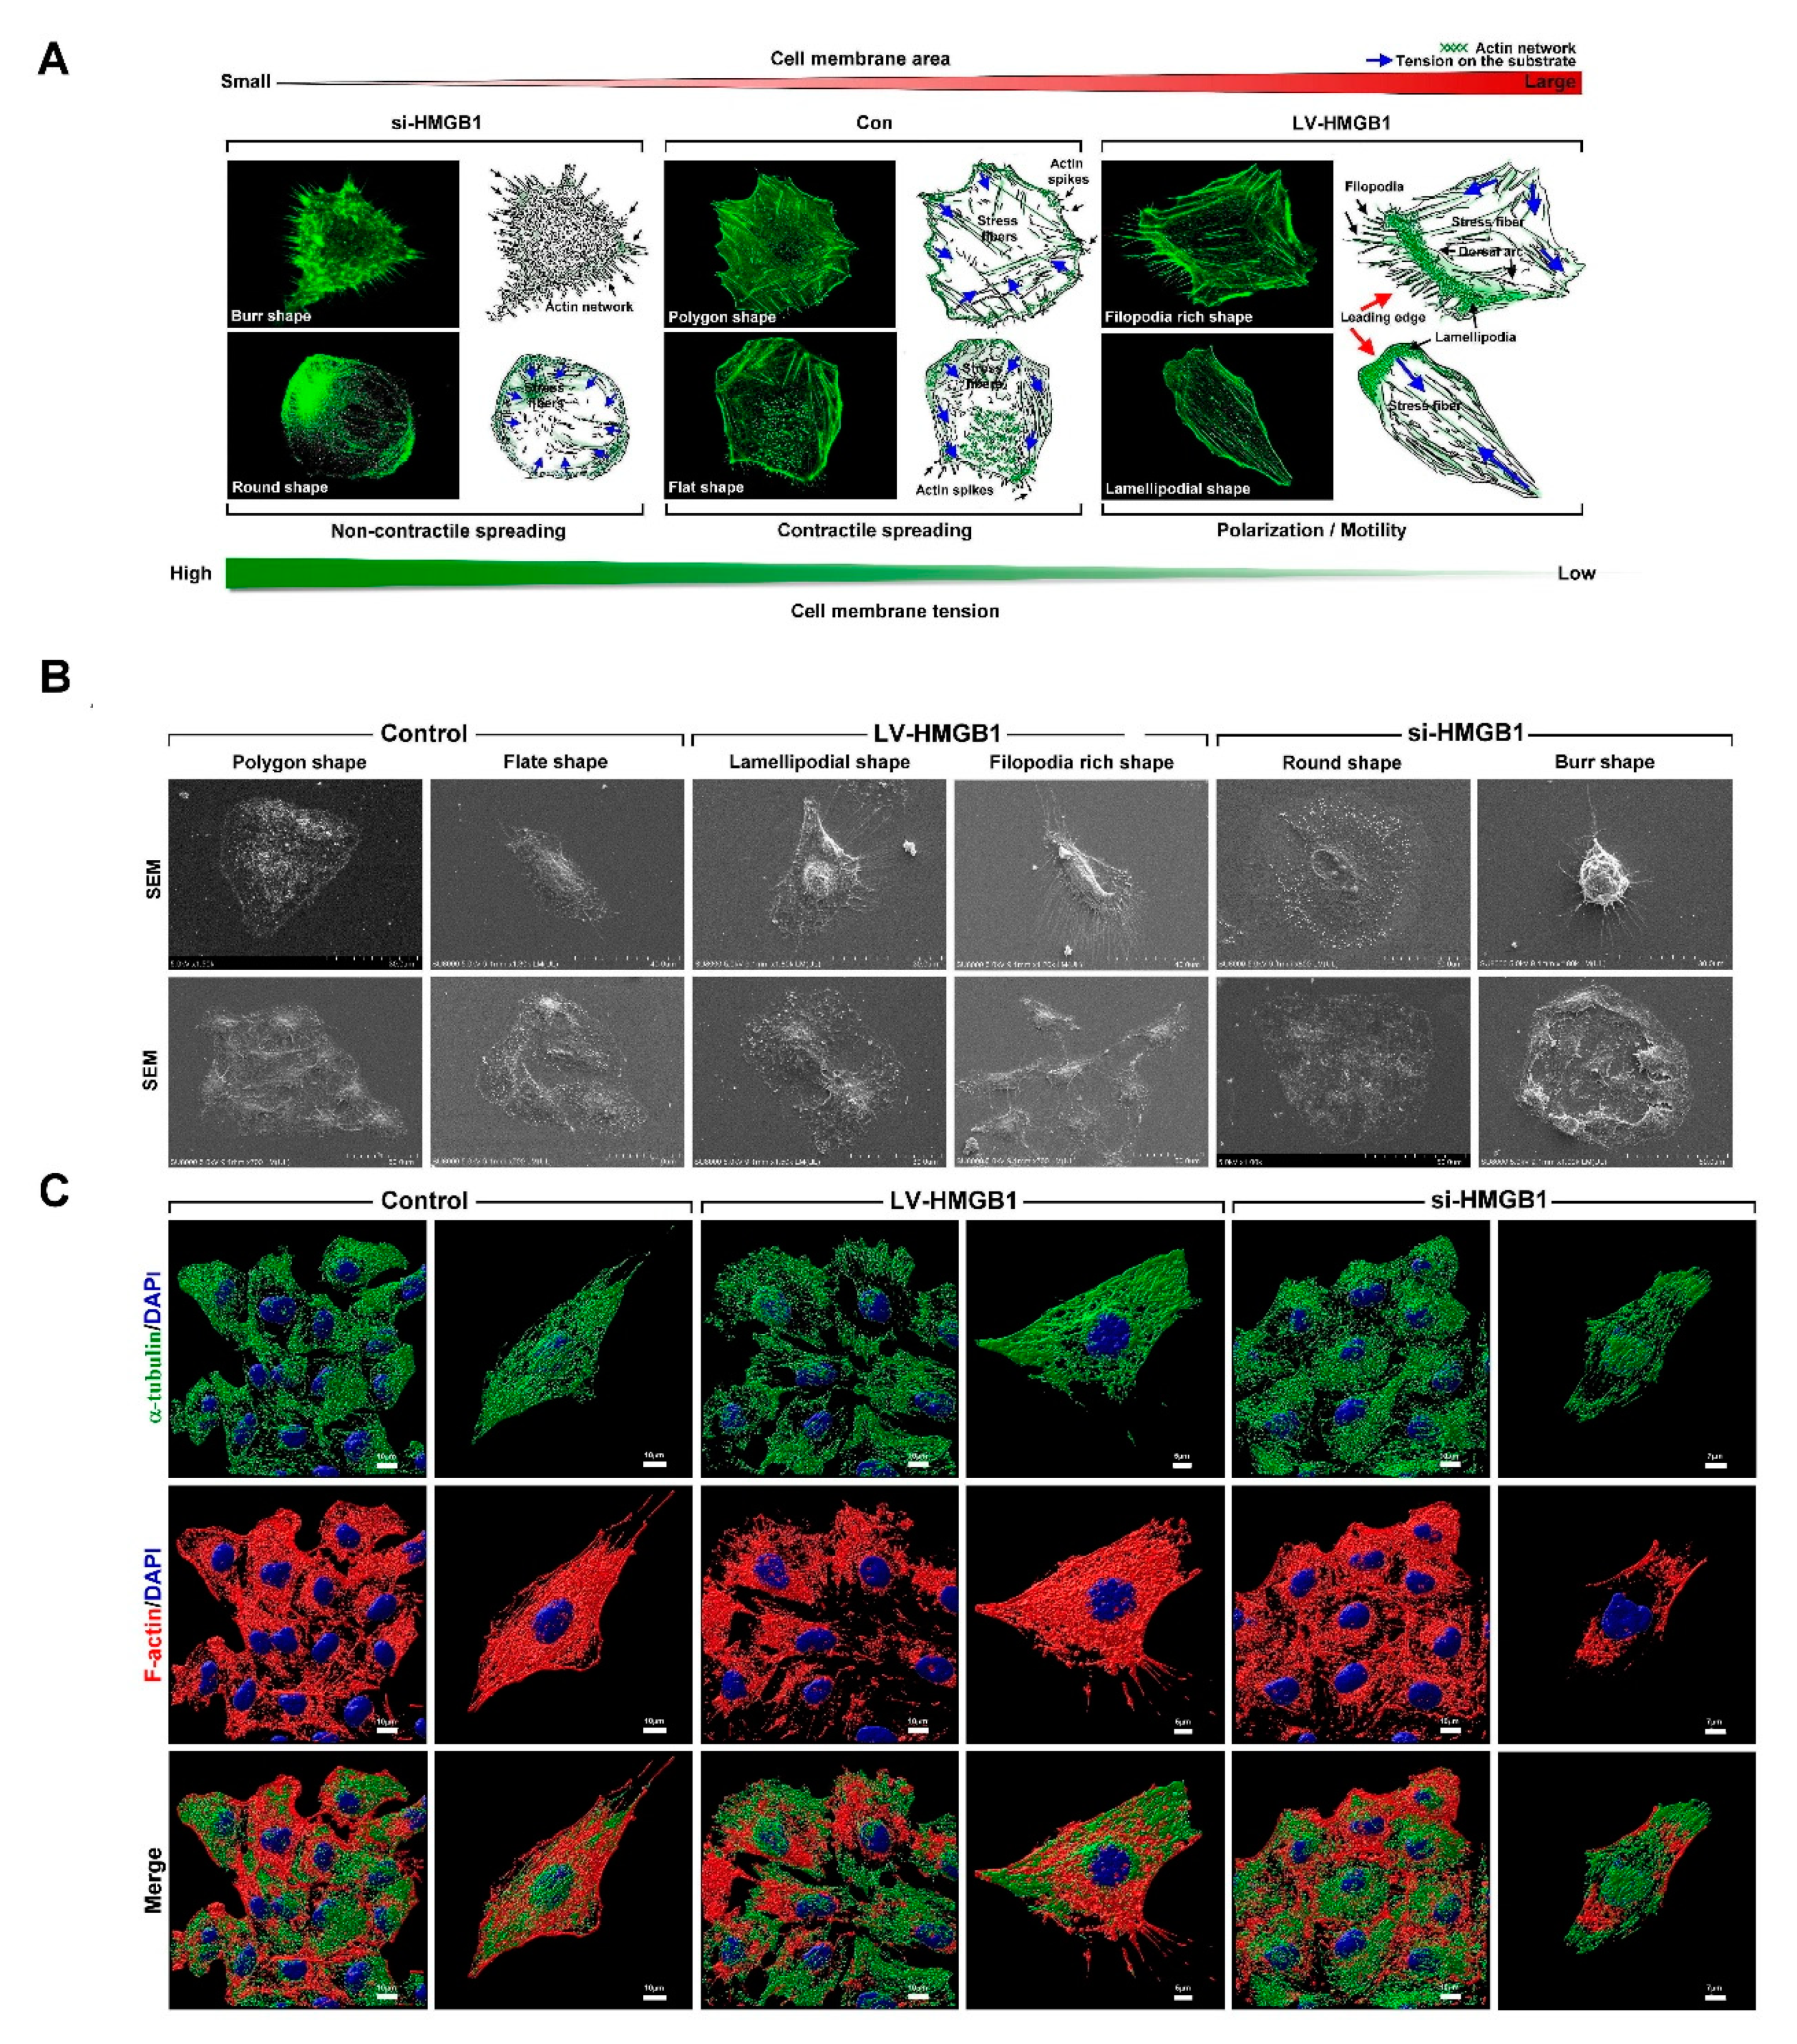
Abstract
:1. Introduction
2. Results
2.1. HMGB1 Regulates Membrane Tension, Dynamics, Polarization, and Cytoskeletal Rearrangements in Lung Cancer Cells
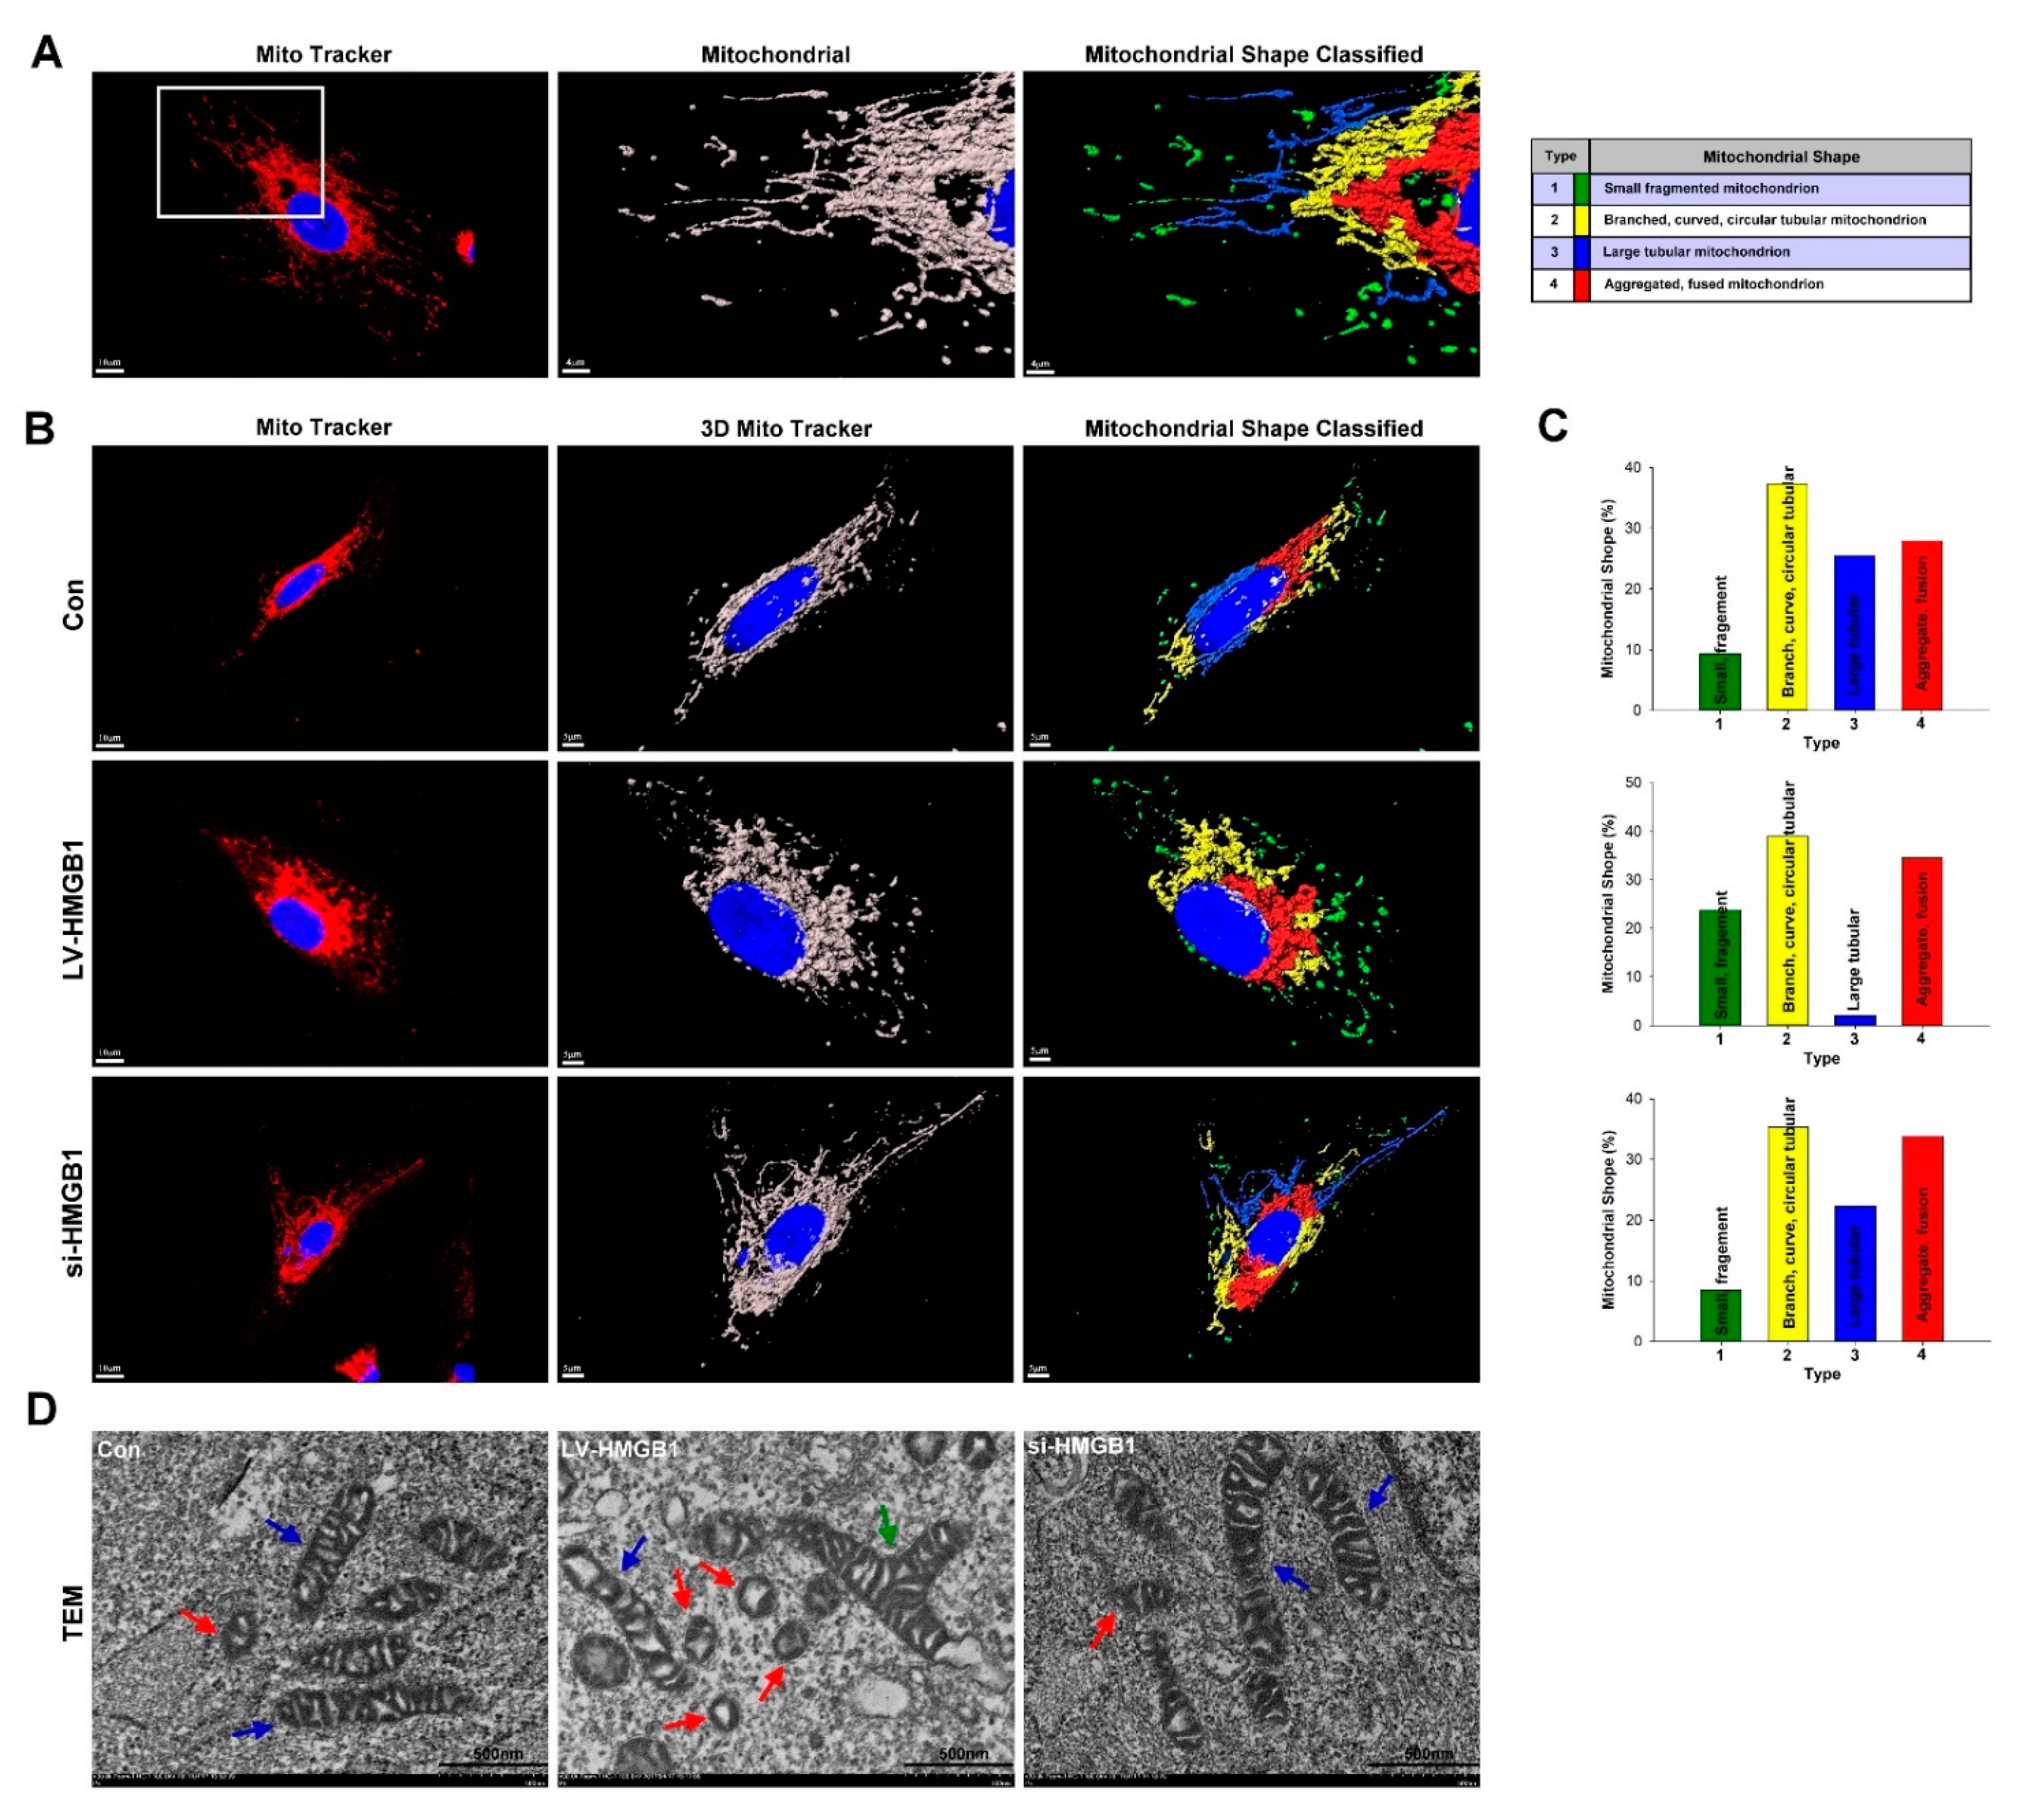
2.2. HMGB1 Regulates Mitochondrial Dynamics and Increases Mitochondrial Fission in Lung Cancer Cells
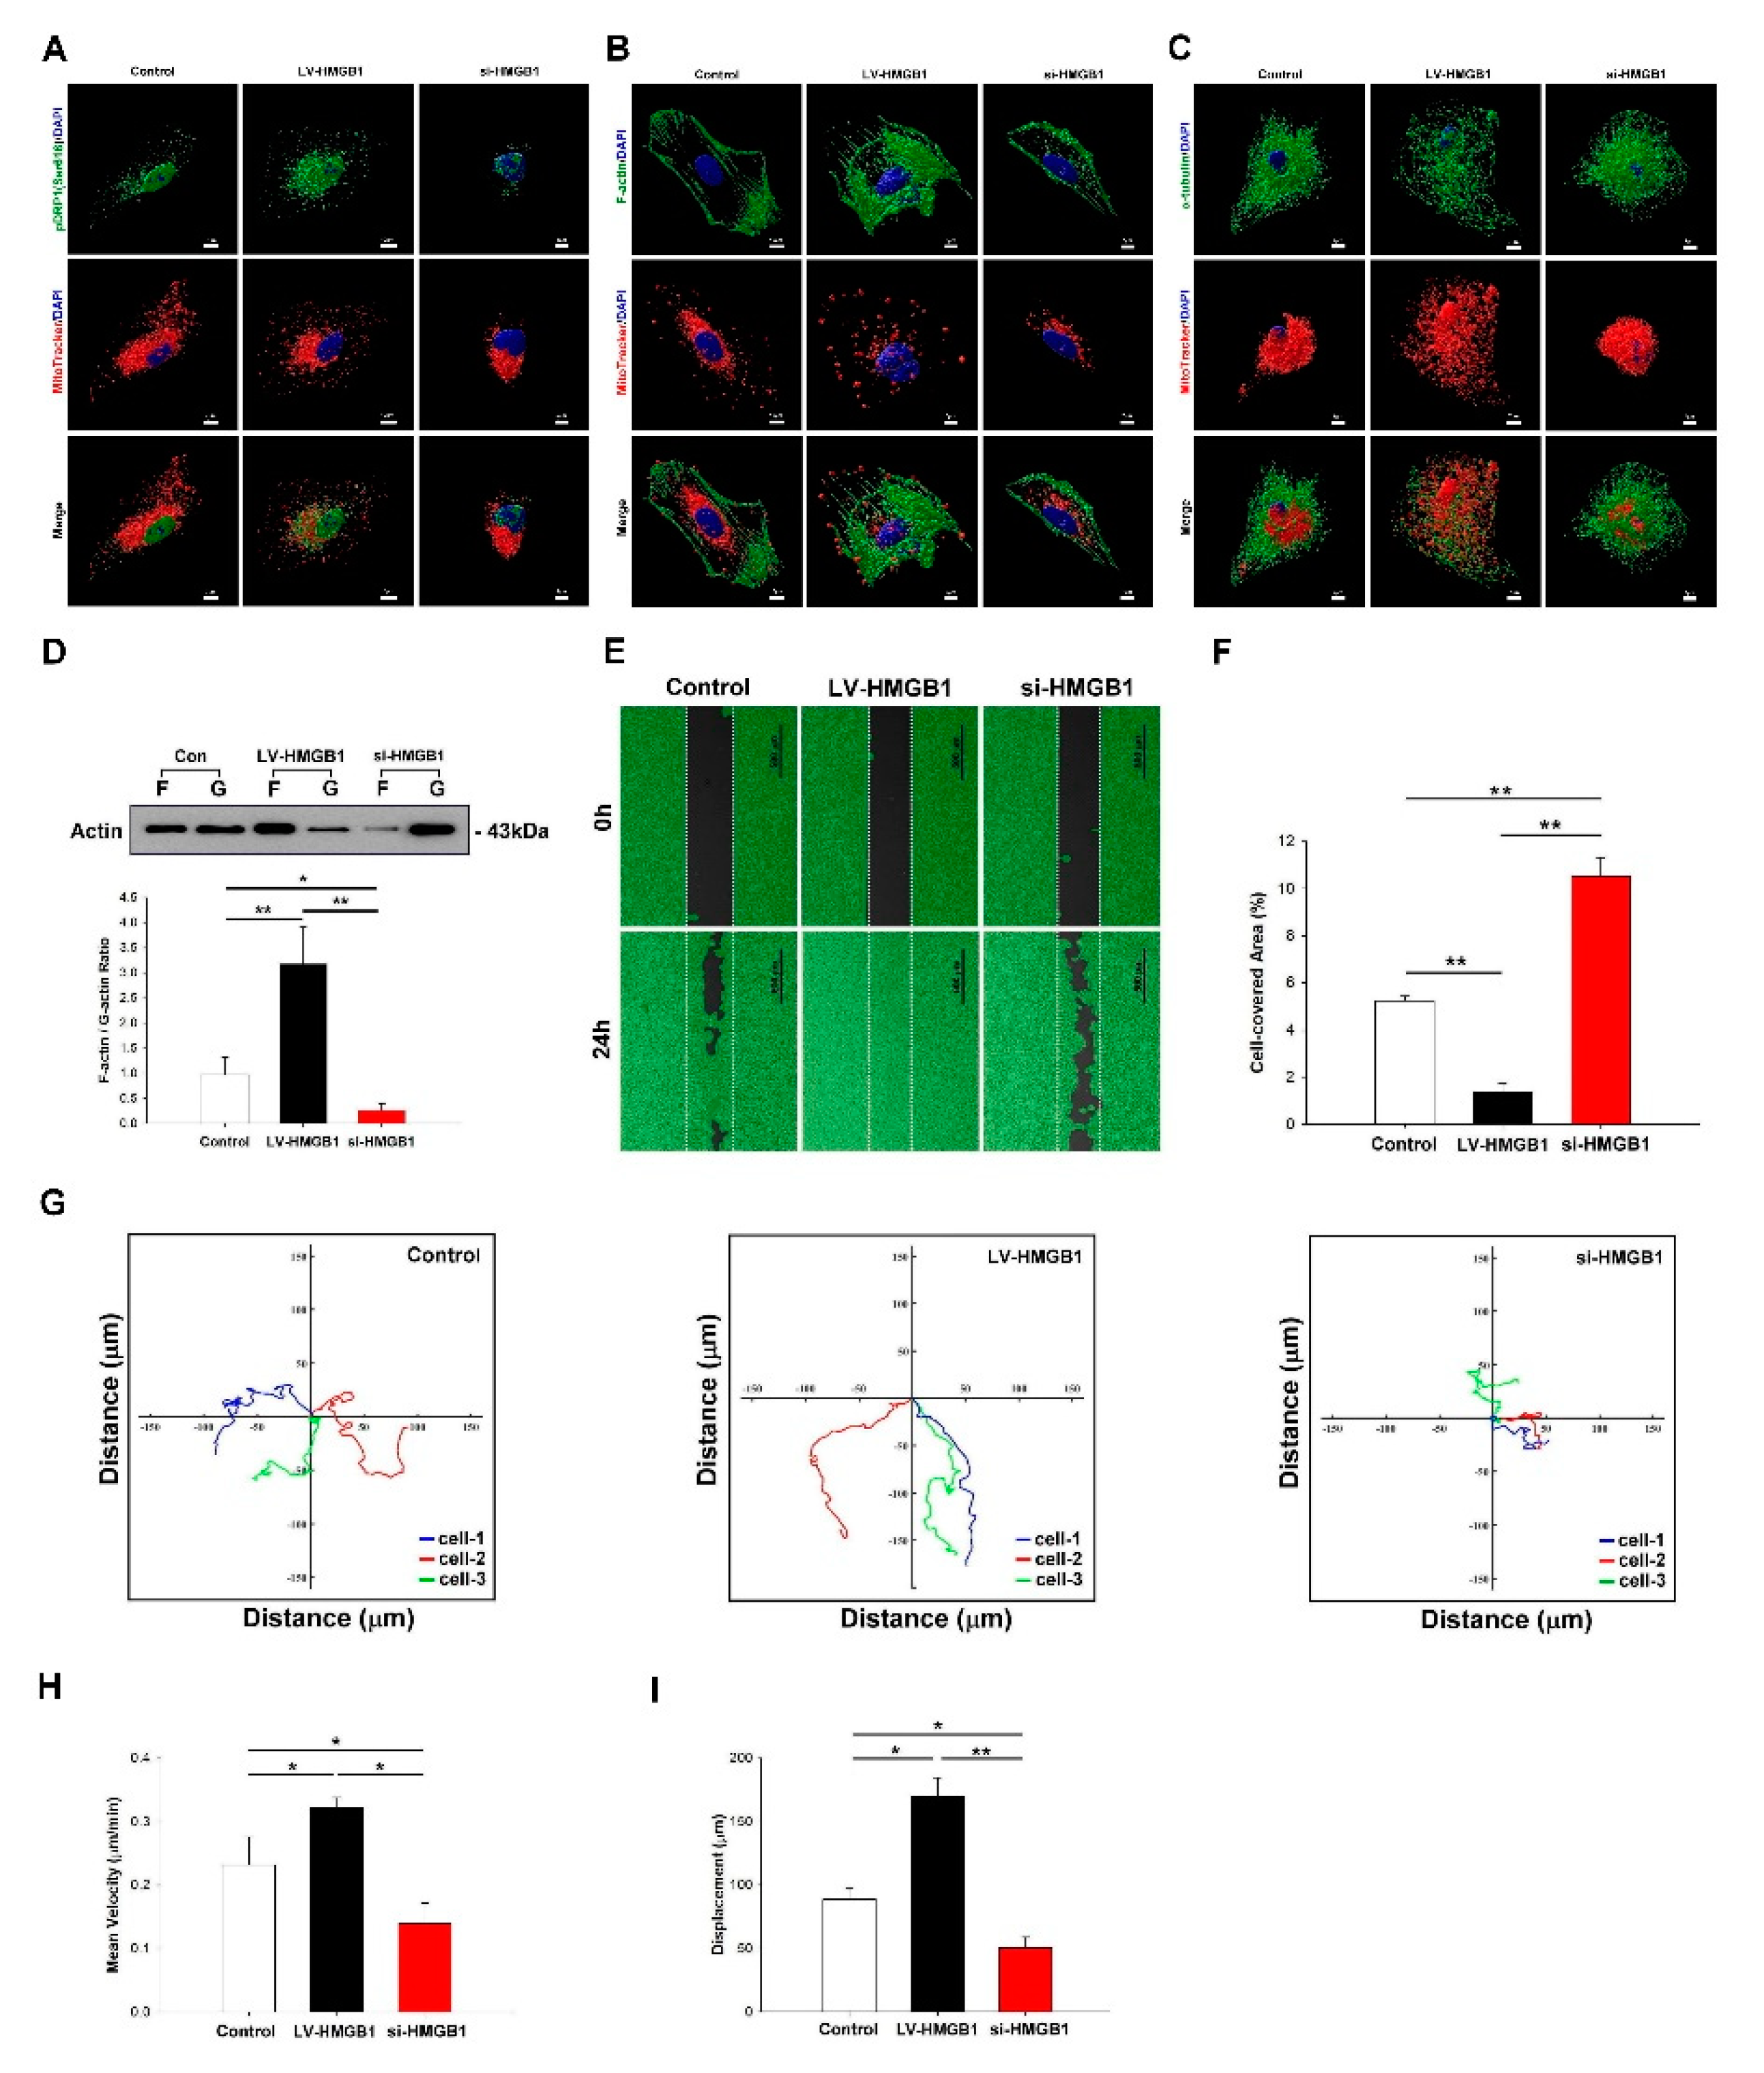
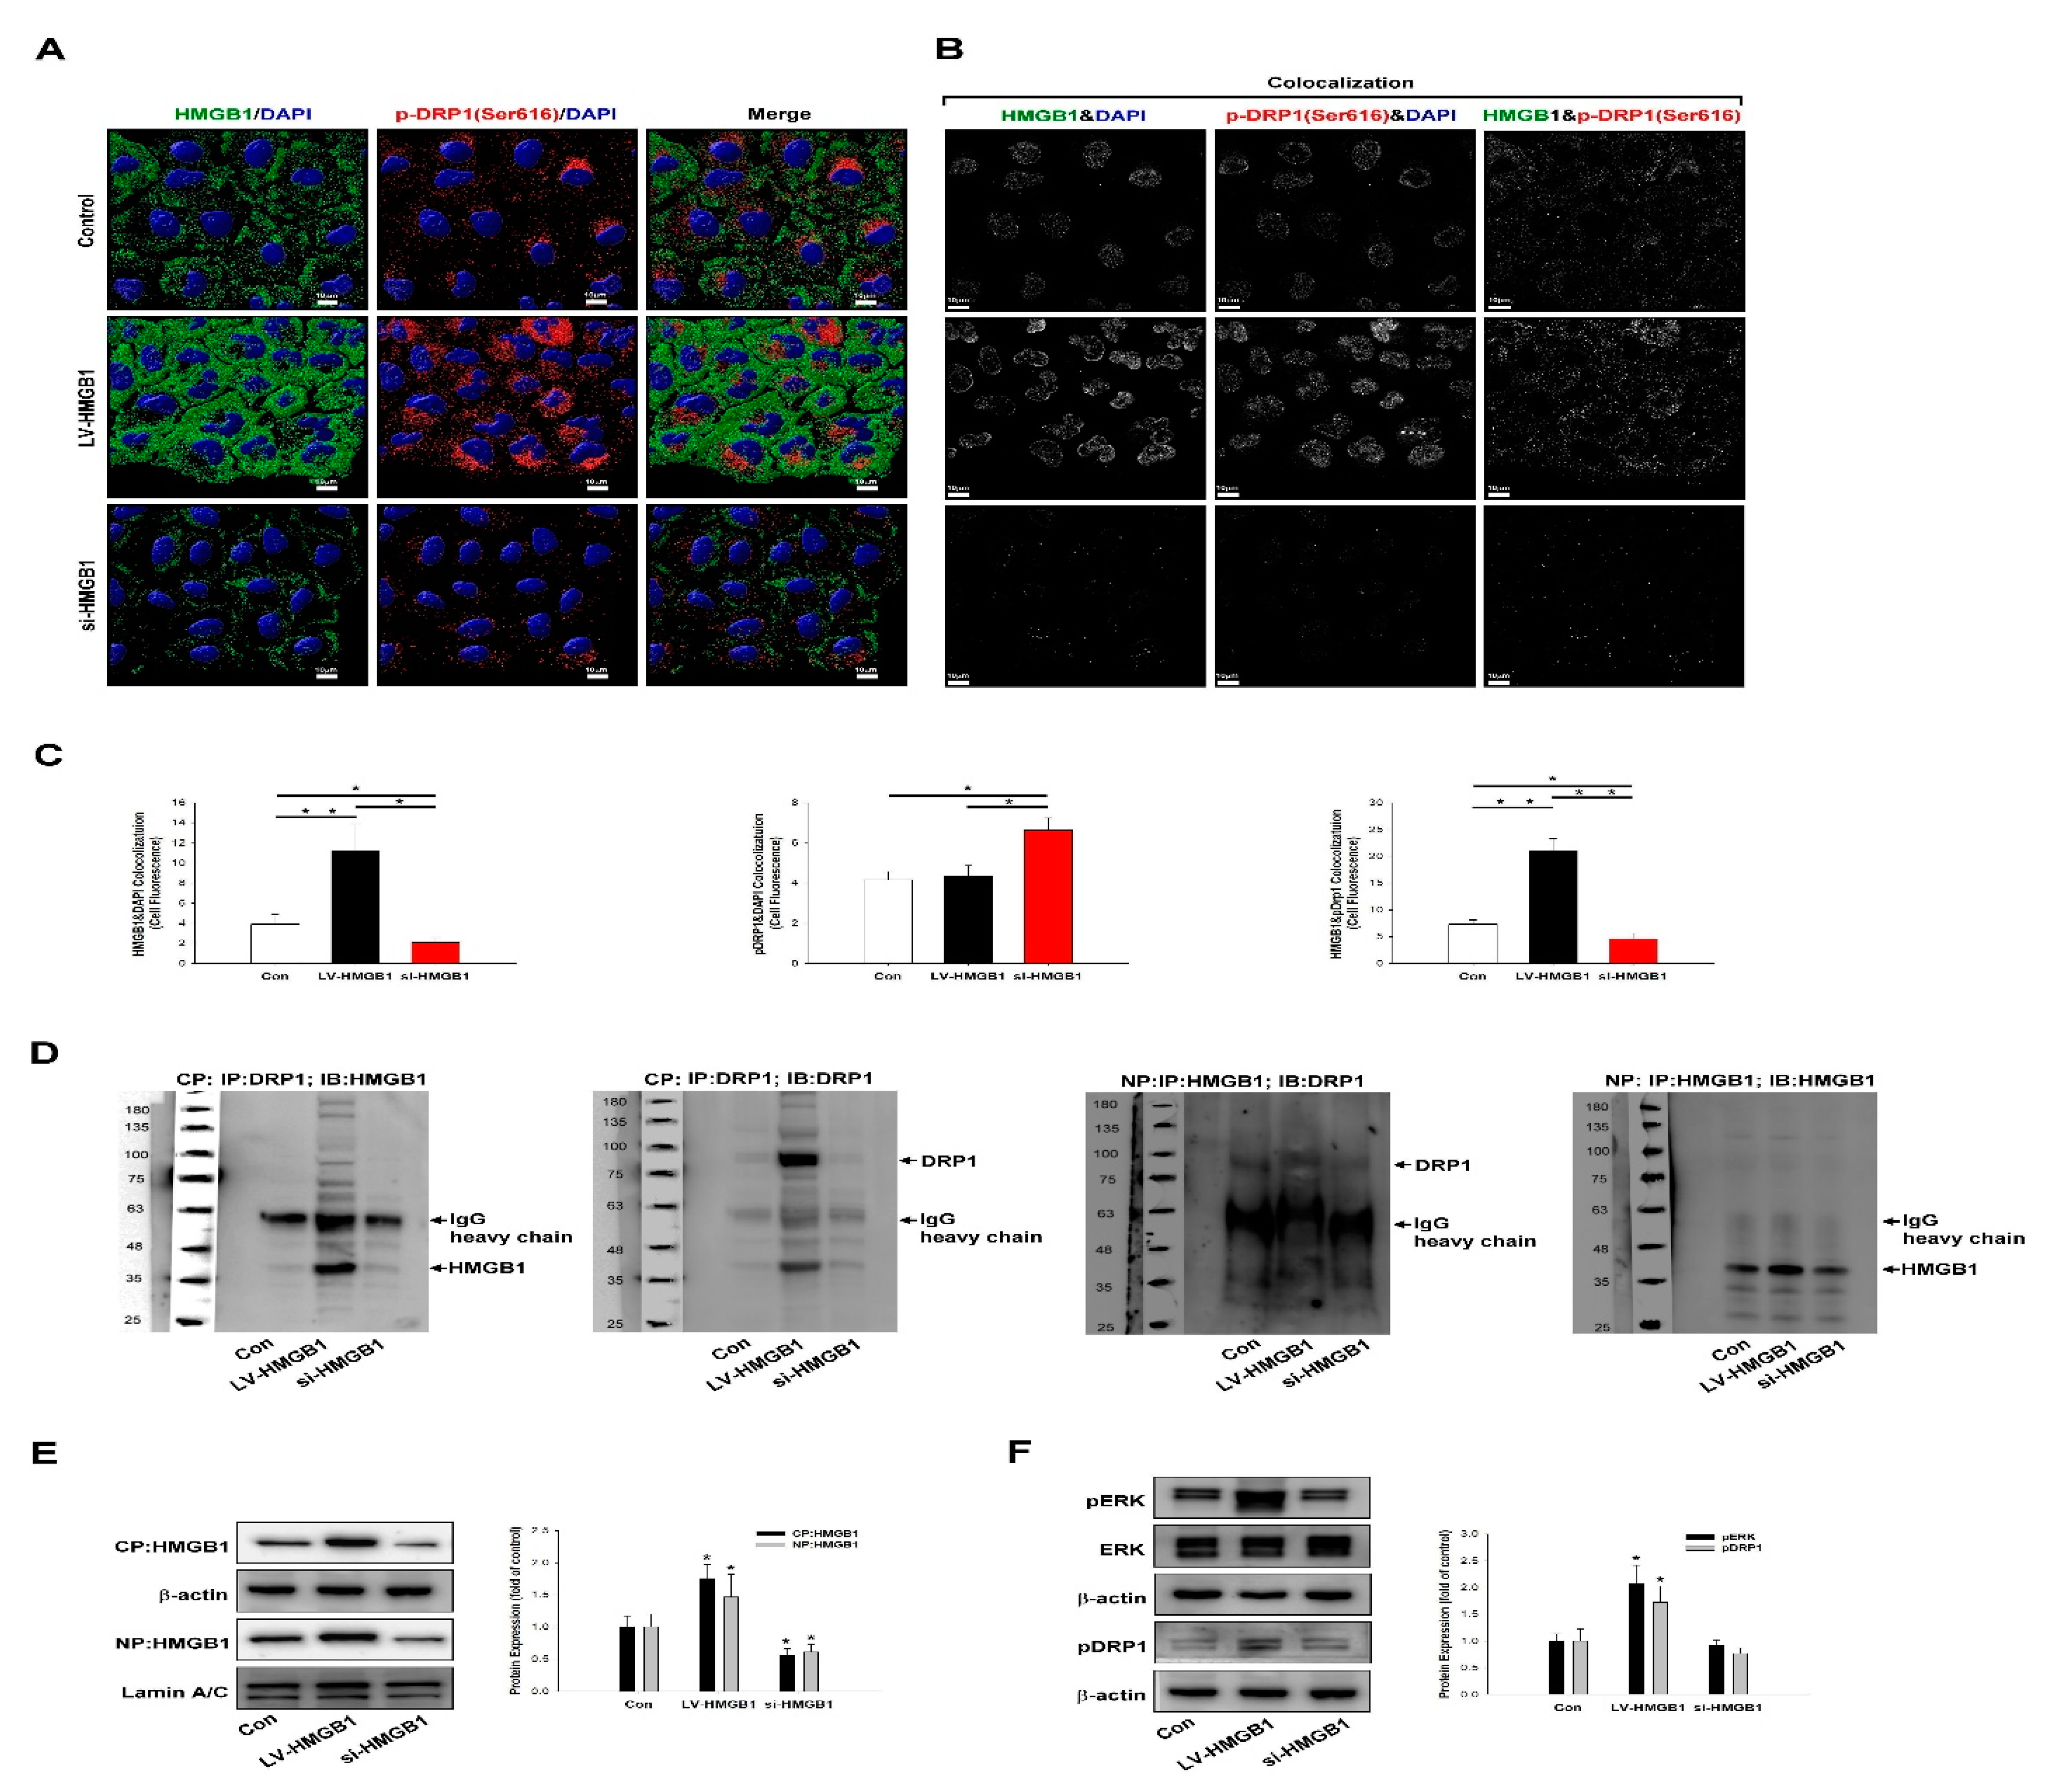
2.3. HMGB1 Regulates DRP-1 Phosphorylation, Mitochondrial Dynamics, and Increases Mitochondrial Trafficking to the Leading Edge of Lung Cancer Cells
2.4. HMGB1 Regulates Membrane Tension, Dynamics, Polarization, and Cytoskeletal Rearrangements in Lung Cancer Cells
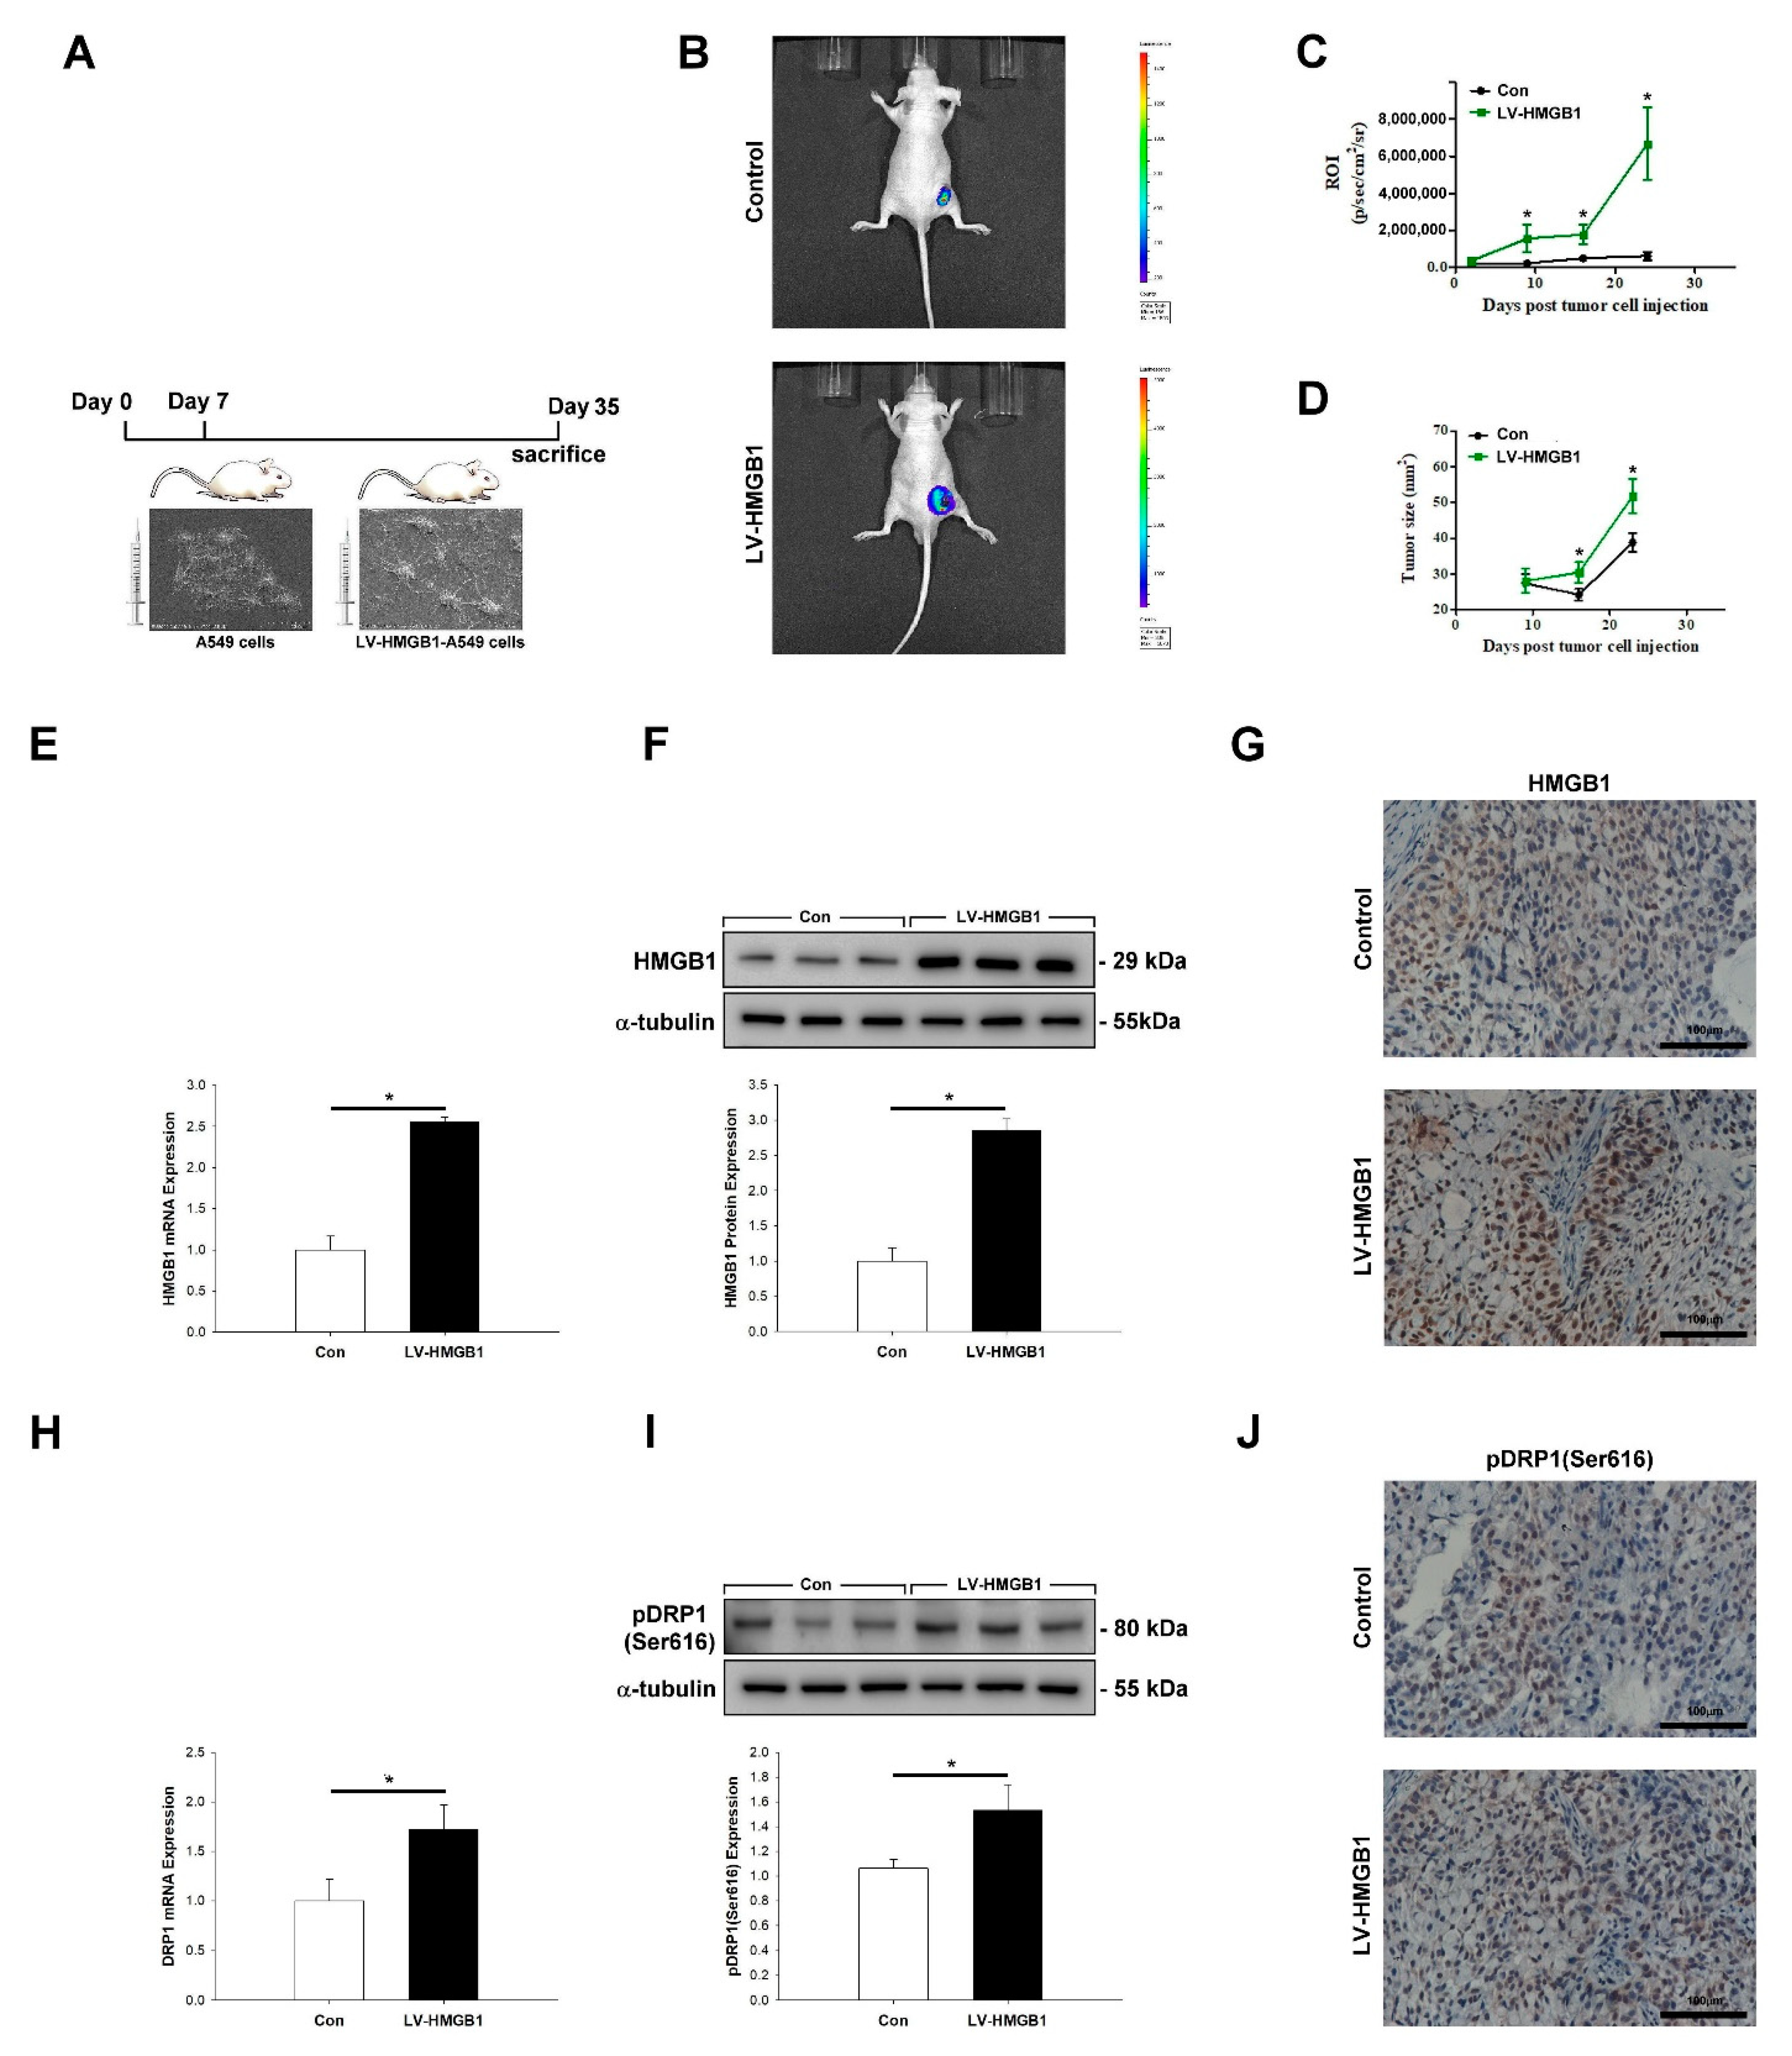
2.5. HMGB1 Promotes Tumor Growth and pDRP1 (Ser616) Expression In Vivo
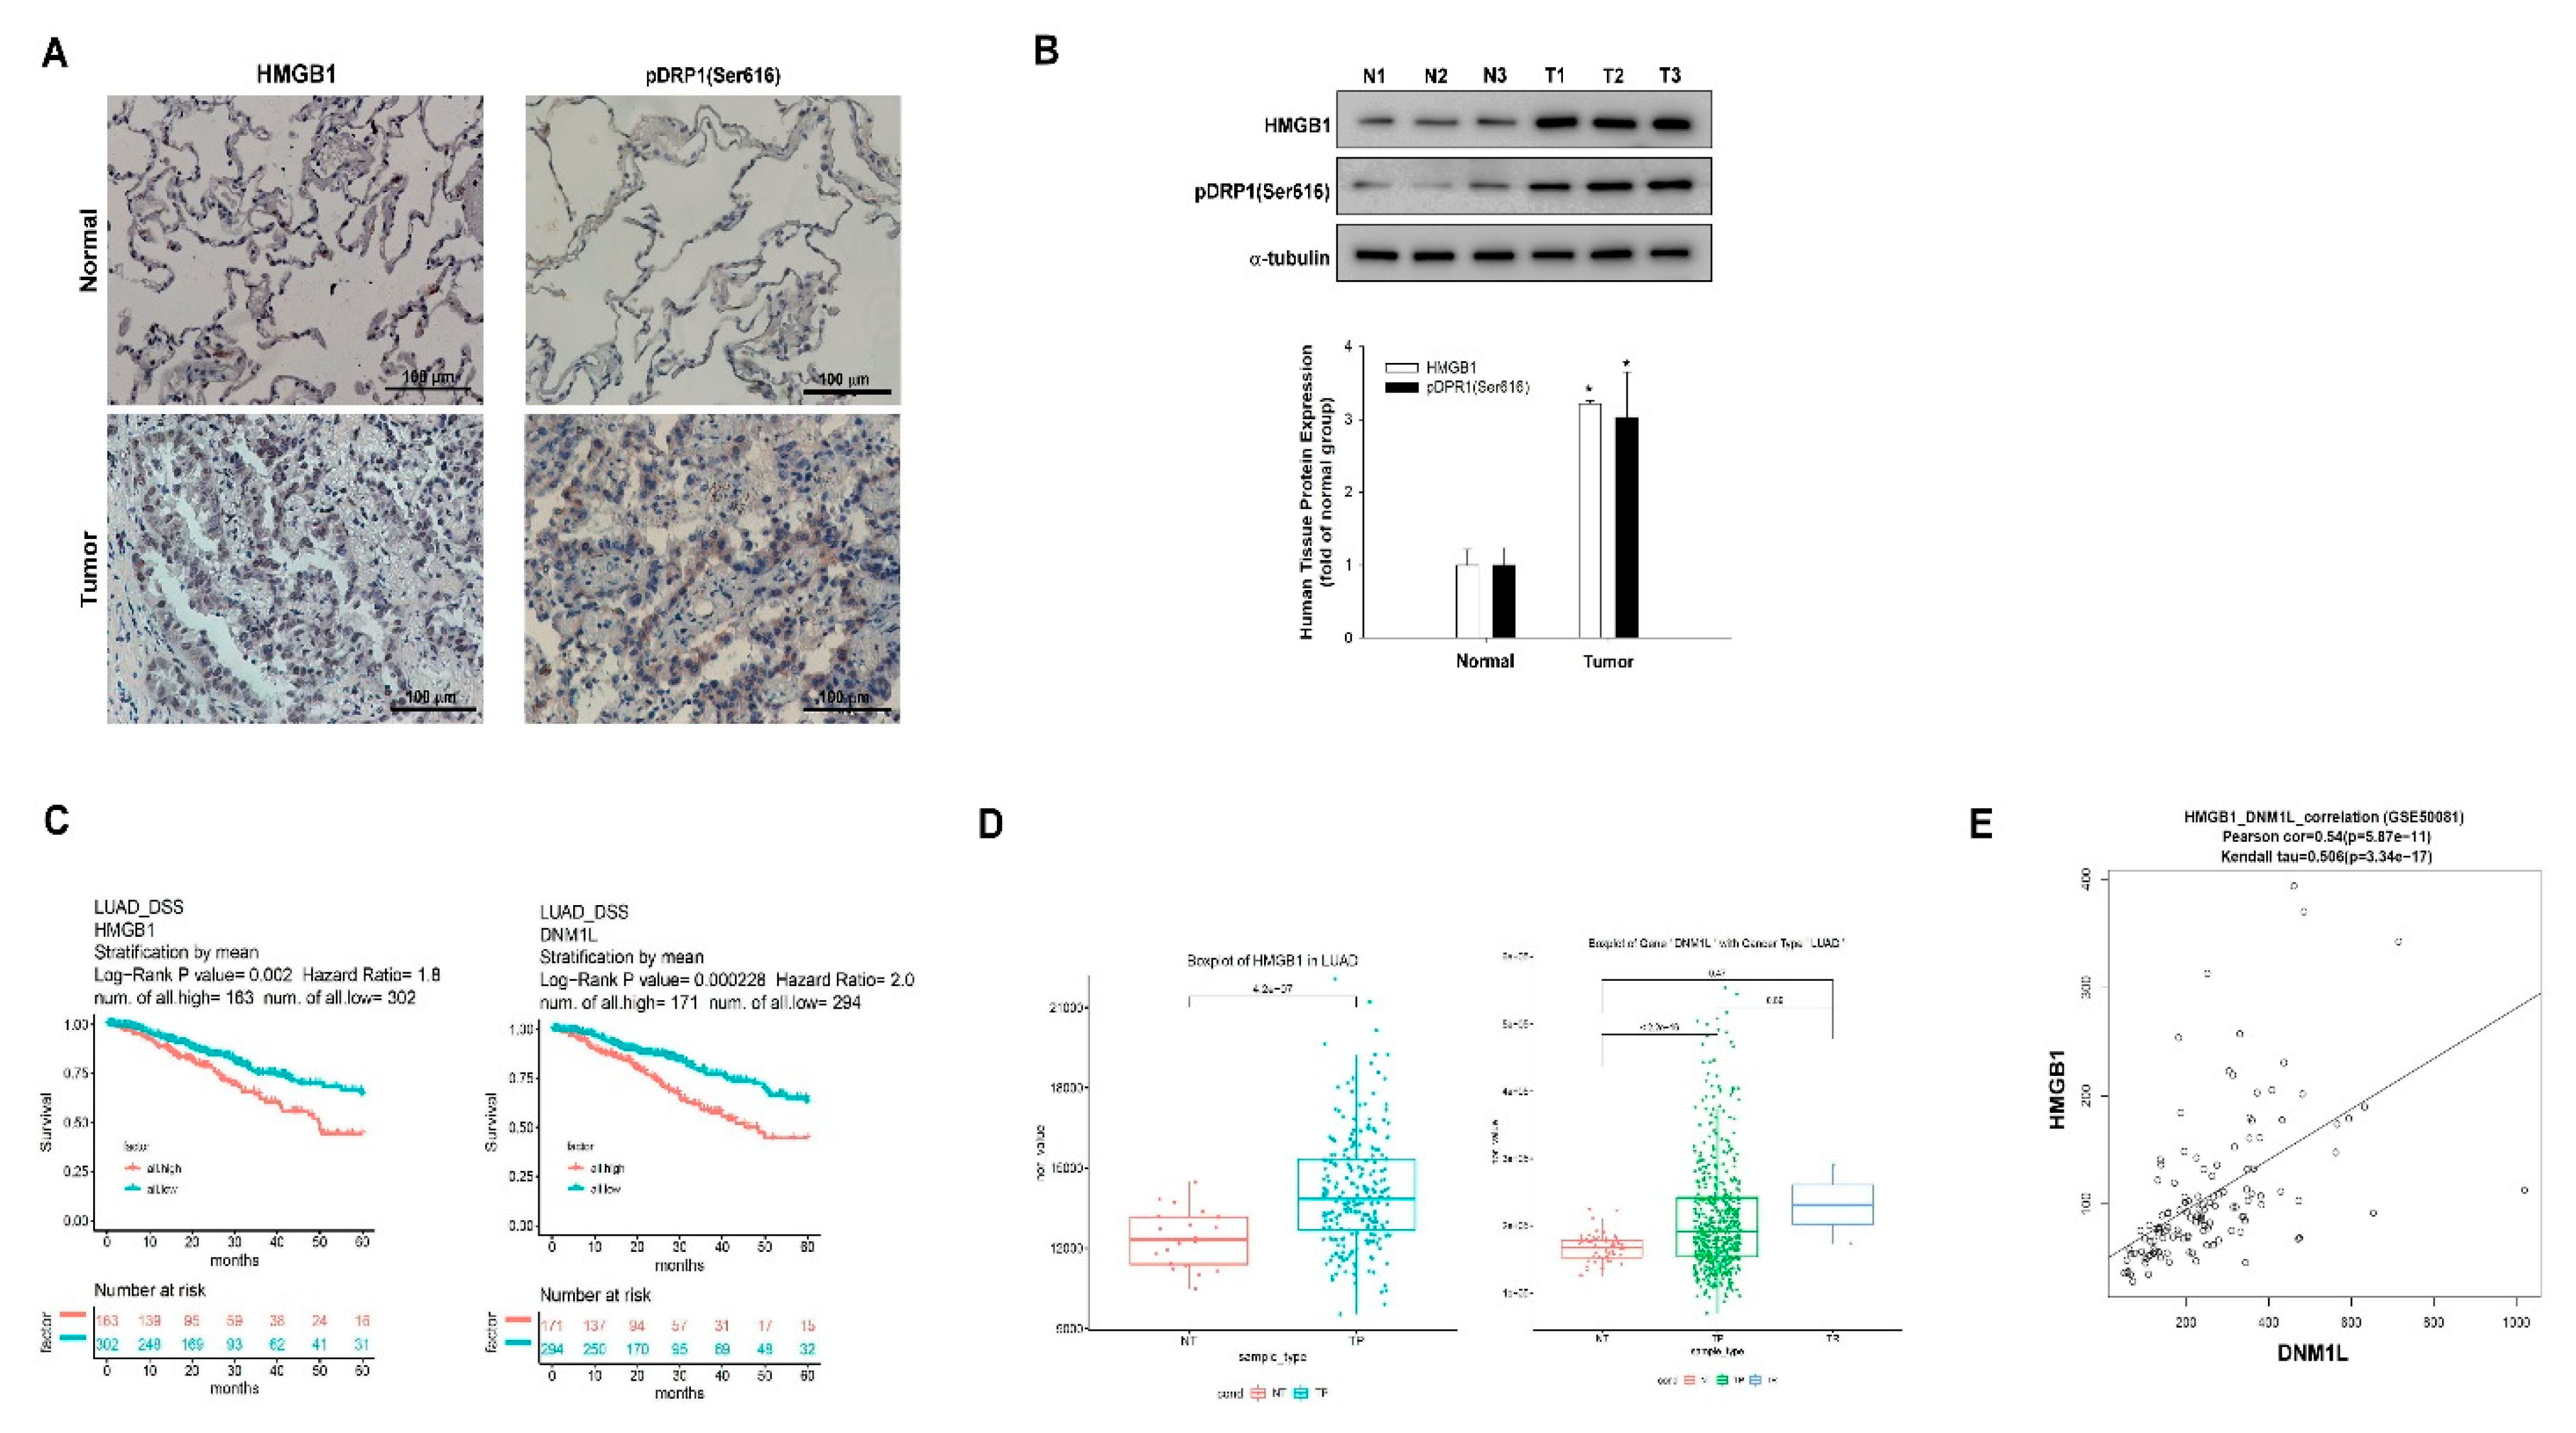
2.6. Elevated Expression of HMGB1 and DNM1L Genes Predicts Poor Outcome in NSCLC
3. Discussion
4. Materials and Methods
4.1. Cell Culture
4.2. Cell Migration and Motility Assays
4.3. qPCR
4.4. WB Assay
4.5. Construction of a Human HMGB1 Lentiviral Vector and Cell Transduction
4.6. HMGB1 Silencing
4.7. FE-TEM
4.8. FE-SEM
4.9. Measurement of F-Actin/G-Actin Ratio
4.10. Tumorigenic Potential of HMGB1-Overexpressing A549 Lung Cancer Cells
4.11. Tumor Sample Collection and DriverDBv3 Database Analysis
4.12. IHC Analysis
4.13. ICC Analysis
4.14. Co-Immunoprecipitation Assay
4.15. Statistical Analyses
5. Conclusions
Author Contributions
Funding
Institutional Review Board Statement
Informed Consent Statement
Data Availability Statement
Acknowledgments
Conflicts of Interest
References
- Siegel, R.L.; Miller, K.D.; Jemal, A. Cancer statistics, 2020. CA Cancer J. Clin. 2020, 70, 7–30. [Google Scholar] [CrossRef]
- Jemal, A.; Fedewa, S.A. Lung Cancer Screening with Low-Dose Computed Tomography in the United States-2010 to 2015. JAMA Oncol. 2017, 3, 1278–1281. [Google Scholar] [CrossRef]
- Wu, L.; Yang, L. The function and mechanism of HMGB1 in lung cancer and its potential therapeutic implications. Oncol. Lett. 2018, 15, 6799–6805. [Google Scholar] [CrossRef] [PubMed]
- Tripathi, A.; Shrinet, K.; Kumar, A. HMGB1 protein as a novel target for cancer. Toxicol. Rep. 2019, 6, 253–261. [Google Scholar] [CrossRef] [PubMed]
- Lv, W.; Chen, N.; Lin, Y.; Ma, H.; Ruan, Y.; Li, Z.; Li, X.; Pan, X.; Tian, X. Macrophage migration inhibitory factor promotes breast cancer metastasis via activation of HMGB1/TLR4/NF kappa B axis. Cancer Lett. 2016, 375, 245–255. [Google Scholar] [CrossRef] [PubMed]
- Xu, J.; Jiang, Y.; Wang, J.; Shi, X.; Liu, Q.; Liu, Z.; Li, Y.; Scott, M.J.; Xiao, G.; Li, S.; et al. Macrophage endocytosis of high-mobility group box 1 triggers pyroptosis. Cell Death Differ. 2014, 21, 1229–1239. [Google Scholar] [CrossRef] [PubMed] [Green Version]
- Sheller-Miller, S.; Urrabaz-Garza, R.; Saade, G.; Menon, R. Damage-Associated molecular pattern markers HMGB1 and cell-Free fetal telomere fragments in oxidative-Stressed amnion epithelial cell-Derived exosomes. J. Reprod. Immunol. 2017, 123, 3–11. [Google Scholar] [CrossRef] [PubMed]
- Ivanov, S.; Dragoi, A.M.; Wang, X.; Dallacosta, C.; Louten, J.; Musco, G.; Sitia, G.; Yap, G.S.; Wan, Y.; Biron, C.A.; et al. A novel role for HMGB1 in TLR9-mediated inflammatory responses to CpG-DNA. Blood 2007, 110, 1970–1981. [Google Scholar] [CrossRef] [PubMed]
- Wu, X.J.; Chen, Y.Y.; Gong, C.C.; Pei, D.S. The role of high-mobility group protein box 1 in lung cancer. J. Cell. Biochem. 2018, 119, 6354–6365. [Google Scholar] [CrossRef]
- Jube, S.; Rivera, Z.S.; Bianchi, M.E.; Powers, A.; Wang, E.; Pagano, I.; Pass, H.I.; Gaudino, G.; Carbone, M.; Yang, H. Cancer cell secretion of the DAMP protein HMGB1 supports progression in malignant mesothelioma. Cancer Res. 2012, 72, 3290–3301. [Google Scholar] [CrossRef] [Green Version]
- He, S.J.; Cheng, J.; Feng, X.; Yu, Y.; Tian, L.; Huang, Q. The dual role and therapeutic potential of high-mobility group box 1 in cancer. Oncotarget 2017, 8, 64534–64550. [Google Scholar] [CrossRef] [PubMed] [Green Version]
- Liu, P.L.; Tsai, J.R.; Hwang, J.J.; Chou, S.H.; Cheng, Y.J.; Lin, F.Y.; Chen, Y.L.; Hung, C.Y.; Chen, W.C.; Chen, Y.H.; et al. High-mobility group box 1-mediated matrix metalloproteinase-9 expression in non-small cell lung cancer contributes to tumor cell invasiveness. Am. J. Respir. Cell Mol. Biol. 2010, 43, 530–538. [Google Scholar] [CrossRef] [PubMed]
- Chhabra, E.S.; Higgs, H.N. The many faces of actin: Matching assembly factors with cellular structures. Nat. Cell Biol. 2007, 9, 1110–1121. [Google Scholar] [CrossRef]
- Small, J.V. Dicing with dogma: De-branching the lamellipodium. Trends Cell Biol. 2010, 20, 628–633. [Google Scholar] [CrossRef] [PubMed] [Green Version]
- Faix, J.; Rottner, K. The making of filopodia. Curr. Opin. Cell Biol. 2006, 18, 18–25. [Google Scholar] [CrossRef]
- Gupton, S.L.; Gertler, F.B. Filopodia: The fingers that do the walking. Sci. STKE 2007, 2007, re5. [Google Scholar] [CrossRef] [PubMed] [Green Version]
- Xue, X.; Chen, X.; Fan, W.; Wang, G.; Zhang, L.; Chen, Z.; Liu, P.; Liu, M.; Zhao, J. High-mobility group box 1 facilitates migration of neural stem cells via receptor for advanced glycation end products signaling pathway. Sci. Rep. 2018, 8, 4513. [Google Scholar] [CrossRef] [Green Version]
- Arjonen, A.; Kaukonen, R.; Ivaska, J. Filopodia and adhesion in cancer cell motility. Cell Adh. Migr. 2011, 5, 421–430. [Google Scholar] [CrossRef] [Green Version]
- Altieri, D.C. Mitochondria on the move: Emerging paradigms of organelle trafficking in tumour plasticity and metastasis. Br. J. Cancer 2017, 117, 301–305. [Google Scholar] [CrossRef] [PubMed]
- Caino, M.C.; Altieri, D.C. Molecular Pathways: Mitochondrial Reprogramming in Tumor Progression and Therapy. Clin. Cancer Res. 2016, 22, 540–545. [Google Scholar] [CrossRef] [Green Version]
- Huang, C.Y.; Chiang, S.F.; Chen, W.T.; Ke, T.W.; Chen, T.W.; You, Y.S.; Lin, C.Y.; Chao, K.S.C.; Huang, C.Y. HMGB1 promotes ERK-mediated mitochondrial Drp1 phosphorylation for chemoresistance through RAGE in colorectal cancer. Cell Death Dis. 2018, 9, 1004. [Google Scholar] [CrossRef] [PubMed] [Green Version]
- Jiang, W.; Chen, M.; Xiao, C.; Yang, W.; Qin, Q.; Tan, Q.; Liang, Z.; Liao, X.; Mao, A.; Wei, C. Triptolide Suppresses Growth of Breast Cancer by Targeting HMGB1 in Vitro and in Vivo. Biol. Pharm. Bull. 2019, 42, 892–899. [Google Scholar] [CrossRef] [PubMed] [Green Version]
- Ellerman, J.E.; Brown, C.K.; de Vera, M.; Zeh, H.J.; Billiar, T.; Rubartelli, A.; Lotze, M.T. Masquerader: High mobility group box-1 and cancer. Clin. Cancer Res. 2007, 13, 2836–2848. [Google Scholar] [CrossRef] [Green Version]
- Etienne-Manneville, S. Microtubules in cell migration. Annu. Rev. Cell Dev. Biol. 2013, 29, 471–499. [Google Scholar] [CrossRef] [PubMed]
- Westermann, B. Mitochondrial fusion and fission in cell life and death. Nat. Rev. Mol. Cell Biol. 2010, 11, 872–884. [Google Scholar] [CrossRef] [PubMed]
- Zhao, J.; Zhang, J.; Yu, M.; Xie, Y.; Huang, Y.; Wolff, D.W.; Abel, P.W.; Tu, Y. Mitochondrial dynamics regulates migration and invasion of breast cancer cells. Oncogene 2013, 32, 4814–4824. [Google Scholar] [CrossRef]
- Senft, D.; Ronai, Z.A. Regulators of mitochondrial dynamics in cancer. Curr. Opin. Cell Biol. 2016, 39, 43–52. [Google Scholar] [CrossRef] [Green Version]
- Denisenko, T.V.; Gorbunova, A.S.; Zhivotovsky, B. Mitochondrial Involvement in Migration, Invasion and Metastasis. Front. Cell Dev. Biol. 2019, 7, 355. [Google Scholar] [CrossRef]
- Kashatus, J.; Nascimento, A.; Myers, L.; Sher, A.; Byrne, F.; Hoehn, K.; Counter, C.; Kashatus, D. Erk2 phosphorylation of Drp1 promotes mitochondrial fission and MAPK-driven tumor growth. Mol. Cell. 2015, 57, 537–551. [Google Scholar] [CrossRef] [Green Version]
- Liu, S.H.; Shen, P.C.; Chen, C.Y.; Hsu, A.N.; Cho, Y.C.; Lai, Y.L.; Chen, F.H.; Li, C.Y.; Wang, S.C.; Chen, M.; et al. DriverDBv3: A multi-omics database for cancer driver gene research. Nucleic Acids Res. 2020, 48, D863–D870. [Google Scholar] [CrossRef] [Green Version]
- Heikenwalder, M.; Lorentzen, A. The role of polarisation of circulating tumour cells in cancer metastasis. Cell. Mol. Life Sci. 2019, 76, 3765–3781. [Google Scholar] [CrossRef] [PubMed] [Green Version]
- Orlova, V.V.; Choi, E.Y.; Xie, C.; Chavakis, E.; Bierhaus, A.; Ihanus, E.; Ballantyne, C.M.; Gahmberg, C.G.; Bianchi, M.E.; Nawroth, P.P.; et al. A novel pathway of HMGB1-mediated inflammatory cell recruitment that requires Mac-1-integrin. EMBO J. 2007, 26, 1129–1139. [Google Scholar] [CrossRef] [Green Version]
- Chen, C.; Wang, S.; Chen, J.; Liu, X.; Zhang, M.; Wang, X.; Xu, W.; Zhang, Y.; Li, H.; Pan, X.; et al. Escin suppresses HMGB1-induced overexpression of aquaporin-1 and increased permeability in endothelial cells. FEBS Open Bio 2019, 9, 891–900. [Google Scholar] [CrossRef] [PubMed] [Green Version]
- Cambien, B.; Pomeranz, M.; Millet, M.A.; Rossi, B.; Schmid-Alliana, A. Signal transduction involved in MCP-1-mediated monocytic transendothelial migration. Blood 2001, 97, 359–366. [Google Scholar] [CrossRef] [PubMed] [Green Version]
- Picone, R.; Ren, X.; Ivanovitch, K.D.; Clarke, J.D.; McKendry, R.A.; Baum, B. A polarised population of dynamic microtubules mediates homeostatic length control in animal cells. PLoS Biol. 2010, 8, e1000542. [Google Scholar] [CrossRef] [Green Version]
- Mattila, P.K.; Lappalainen, P. Filopodia: Molecular architecture and cellular functions. Nat. Rev. Mol. Cell Biol. 2008, 9, 446–454. [Google Scholar] [CrossRef] [PubMed]
- Nambiar, R.; McConnell, R.E.; Tyska, M.J. Myosin motor function: The ins and outs of actin-based membrane protrusions. Cell. Mol. Life Sci. 2010, 67, 1239–1254. [Google Scholar] [CrossRef] [Green Version]
- Zhang, H.; Berg, J.S.; Li, Z.; Wang, Y.; Lång, P.; Sousa, A.D.; Bhaskar, A.; Cheney, R.E.; Strömblad, S. Myosin-X provides a motor-based link between integrins and the cytoskeleton. Nat. Cell Biol. 2004, 6, 523–531. [Google Scholar] [CrossRef]
- Akhshi, T.K.; Wernike, D.; Piekny, A. Microtubules and actin crosstalk in cell migration and division. Cytoskeleton 2014, 71, 1–23. [Google Scholar] [CrossRef]
- Sheng, Z.H.; Cai, Q. Mitochondrial transport in neurons: Impact on synaptic homeostasis and neurodegeneration. Nat. Rev. Neurosci. 2012, 13, 77–93. [Google Scholar] [CrossRef] [Green Version]
- Chiang, Y.Y.; Chen, S.L.; Hsiao, Y.T.; Huang, C.H.; Lin, T.Y.; Chiang, I.P.; Hsu, W.H.; Chow, K.C. Nuclear expression of dynamin-related protein 1 in lung adenocarcinomas. Mod. Pathol. 2009, 22, 1139–1150. [Google Scholar] [CrossRef] [PubMed] [Green Version]
- Lima, A.R.; Santos, L.; Correia, M.; Soares, P.; Sobrinho-Simoes, M.; Melo, M.; Maximo, V. Dynamin-Related Protein 1 at the Crossroads of Cancer. Genes 2018, 9, 115. [Google Scholar] [CrossRef] [PubMed] [Green Version]
- Huang, W.T.; Chong, I.W.; Chen, H.L.; Li, C.Y.; Hsieh, C.C.; Kuo, H.F.; Chang, C.Y.; Chen, Y.H.; Liu, Y.P.; Lu, C.Y.; et al. Pigment epithelium-derived factor inhibits lung cancer migration and invasion by upregulating exosomal thrombospondin 1. Cancer Lett. 2019, 442, 287–298. [Google Scholar] [CrossRef] [PubMed]
- Hsieh, C.C.; Li, C.Y.; Hsu, C.H.; Chen, H.L.; Chen, Y.H.; Liu, Y.P.; Liu, Y.R.; Kuo, H.F.; Liu, P.L. Mitochondrial protection by simvastatin against angiotensin II-mediated heart failure. Br. J. Pharmacol. 2019, 176, 3791–3804. [Google Scholar] [CrossRef] [PubMed] [Green Version]
- Schneider, B.J. Non-small cell lung cancer staging: Proposed revisions to the TNM system. Cancer Imaging 2008, 8, 181–185. [Google Scholar] [CrossRef] [Green Version]
- Tsai, J.R.; Liu, P.L.; Chen, Y.H.; Chou, S.H.; Cheng, Y.J.; Hwang, J.J.; Chong, I.W. Curcumin Inhibits Non-Small Cell Lung Cancer Cells Metastasis through the Adiponectin/NF-κb/MMPs Signaling Pathway. PLoS ONE 2015, 10, e0144462. [Google Scholar] [CrossRef] [Green Version]


Publisher’s Note: MDPI stays neutral with regard to jurisdictional claims in published maps and institutional affiliations. |
© 2021 by the authors. Licensee MDPI, Basel, Switzerland. This article is an open access article distributed under the terms and conditions of the Creative Commons Attribution (CC BY) license (https://creativecommons.org/licenses/by/4.0/).
Share and Cite
Liu, W.-L.; Li, C.-Y.; Cheng, W.-C.; Chang, C.-Y.; Chen, Y.-H.; Lu, C.-Y.; Wang, S.-C.; Liu, Y.-R.; Cheng, M.-H.; Chong, I.-W.; et al. High Mobility Group Box 1 Promotes Lung Cancer Cell Migration and Motility via Regulation of Dynamin-Related Protein 1. Int. J. Mol. Sci. 2021, 22, 3628. https://0-doi-org.brum.beds.ac.uk/10.3390/ijms22073628
Liu W-L, Li C-Y, Cheng W-C, Chang C-Y, Chen Y-H, Lu C-Y, Wang S-C, Liu Y-R, Cheng M-H, Chong I-W, et al. High Mobility Group Box 1 Promotes Lung Cancer Cell Migration and Motility via Regulation of Dynamin-Related Protein 1. International Journal of Molecular Sciences. 2021; 22(7):3628. https://0-doi-org.brum.beds.ac.uk/10.3390/ijms22073628
Chicago/Turabian StyleLiu, Wei-Lun, Chia-Yang Li, Wei-Chung Cheng, Chia-Yuan Chang, Yung-Hsiang Chen, Chi-Yu Lu, Shu-Chi Wang, Yu-Ru Liu, Meng-Hsuan Cheng, Inn-Wen Chong, and et al. 2021. "High Mobility Group Box 1 Promotes Lung Cancer Cell Migration and Motility via Regulation of Dynamin-Related Protein 1" International Journal of Molecular Sciences 22, no. 7: 3628. https://0-doi-org.brum.beds.ac.uk/10.3390/ijms22073628