
Cerebral Apolipoprotein D Exits the Brain and Accumulates in Peripheral Tissues

 , , , , and
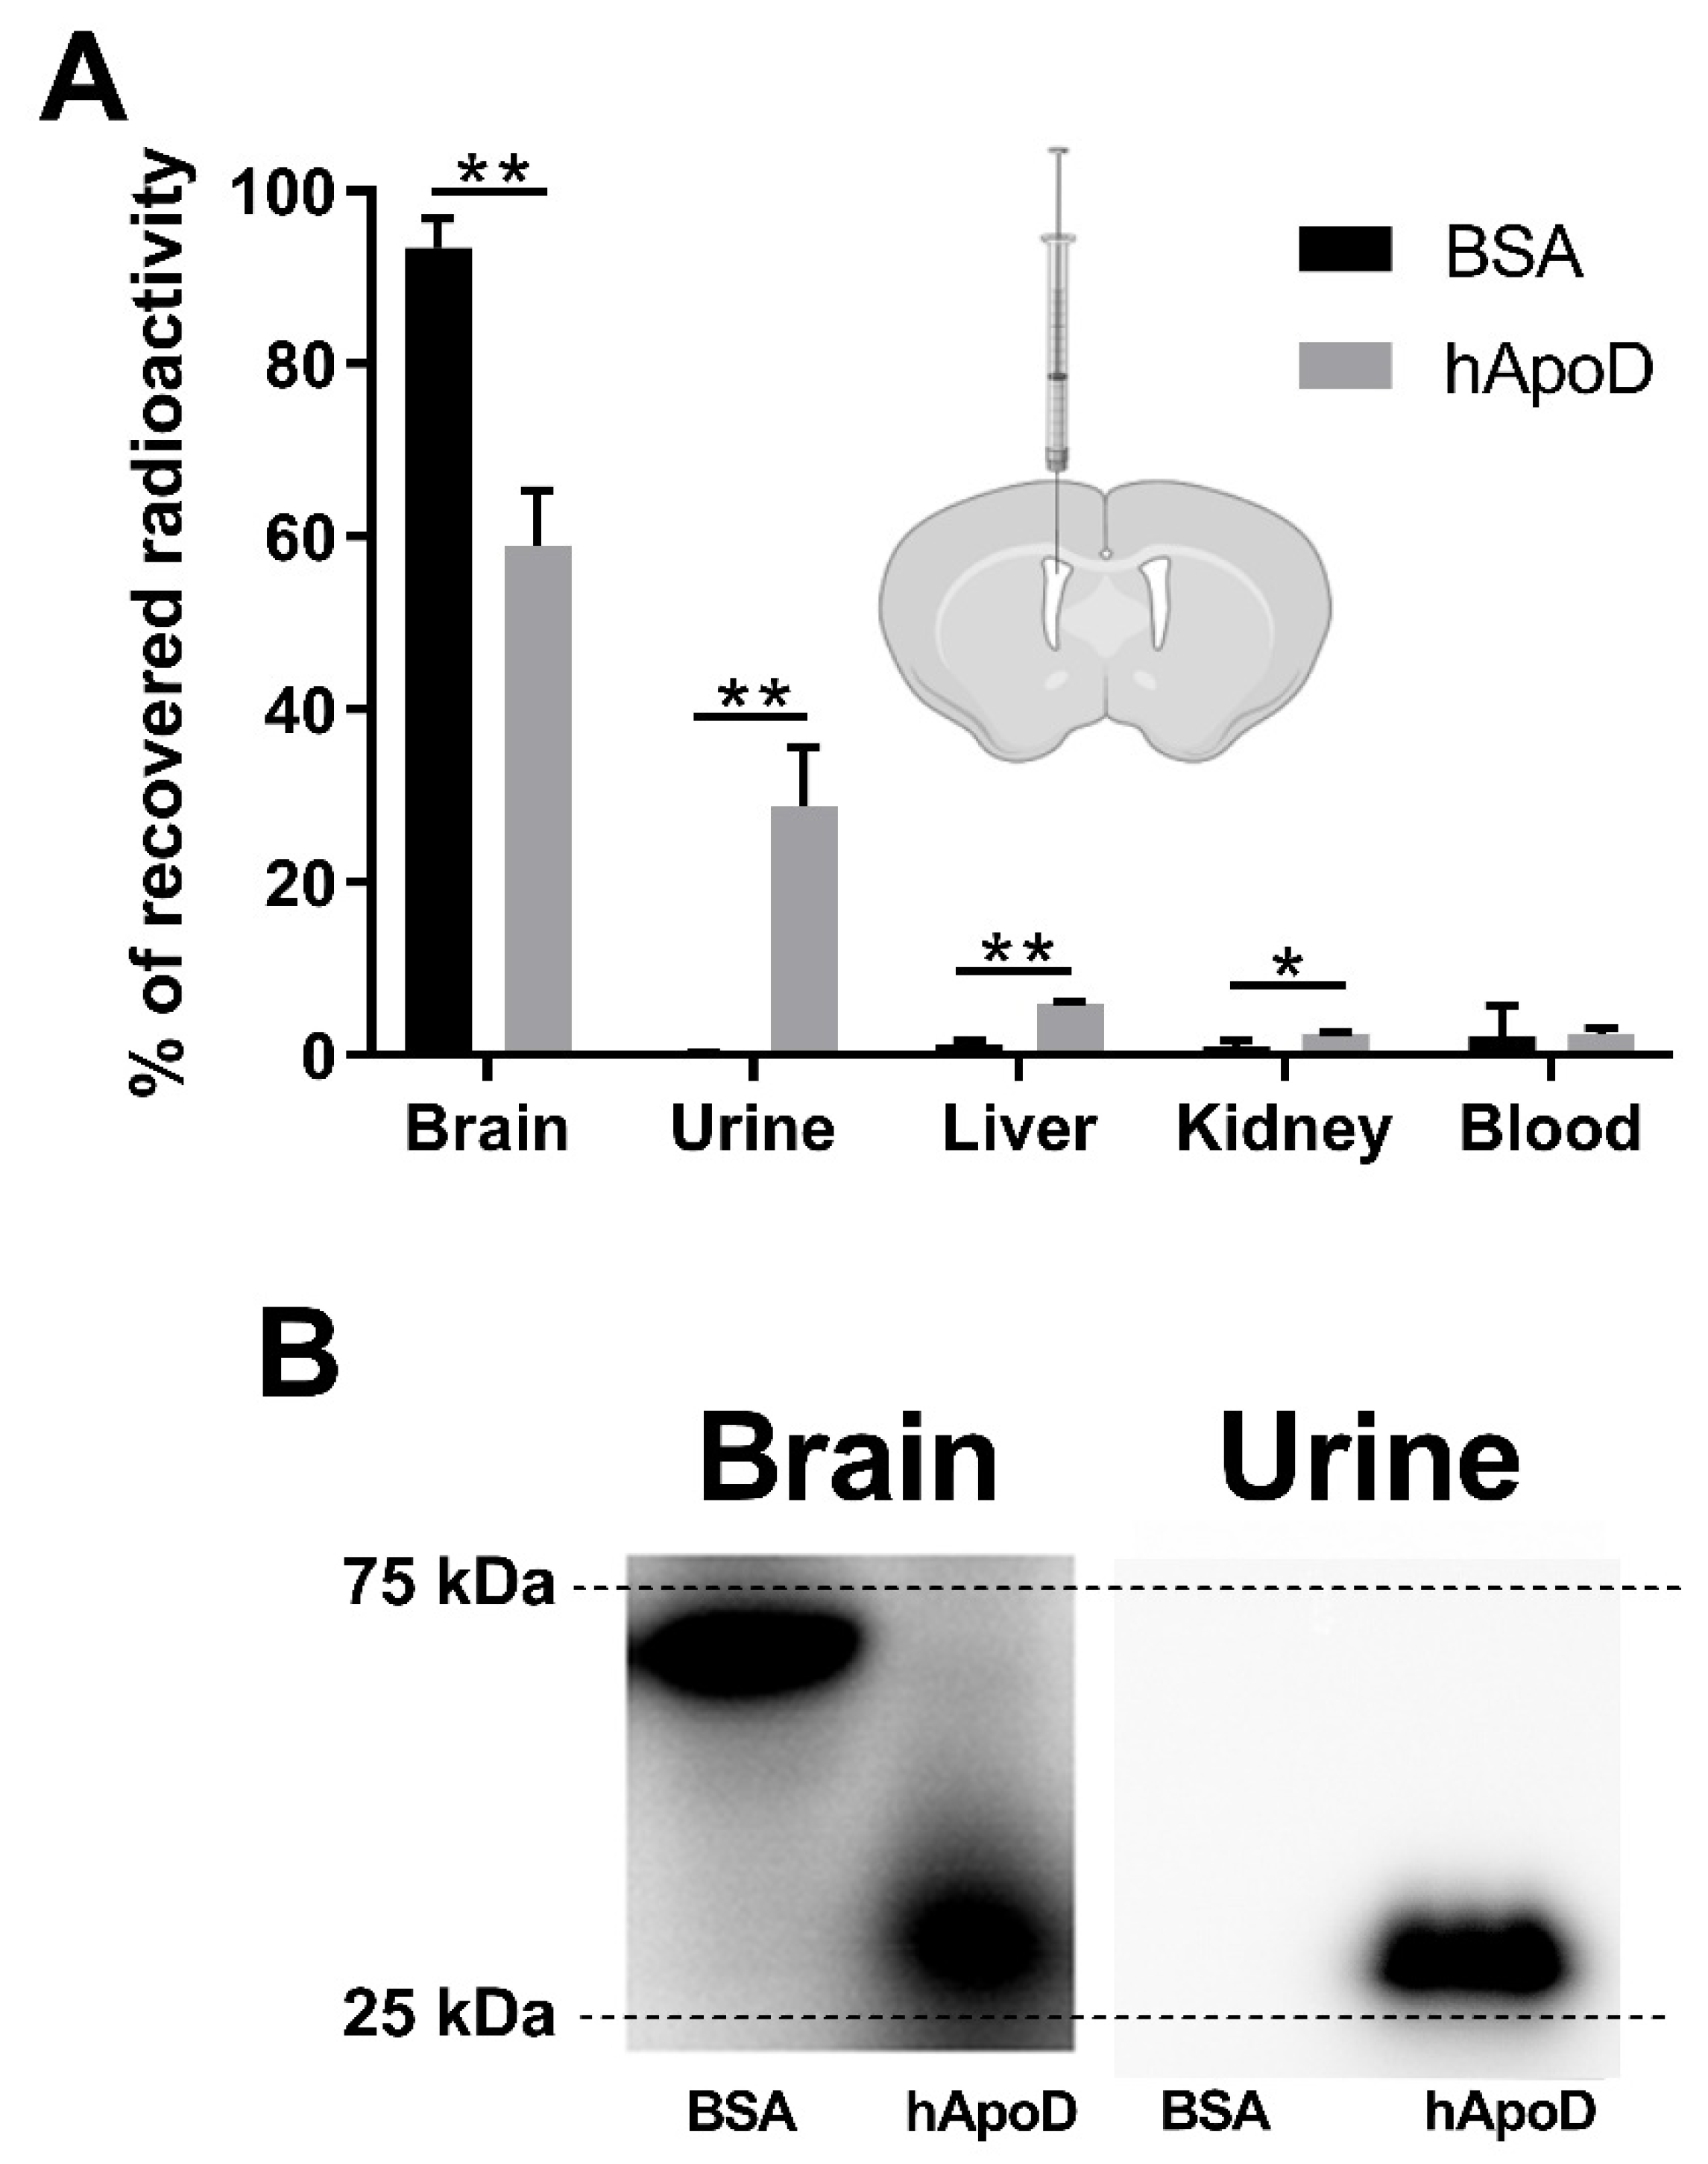
Abstract
:1. Introduction
2. Results
2.1. hApoD Exits the Central Nervous System and Reaches Peripheral Tissues
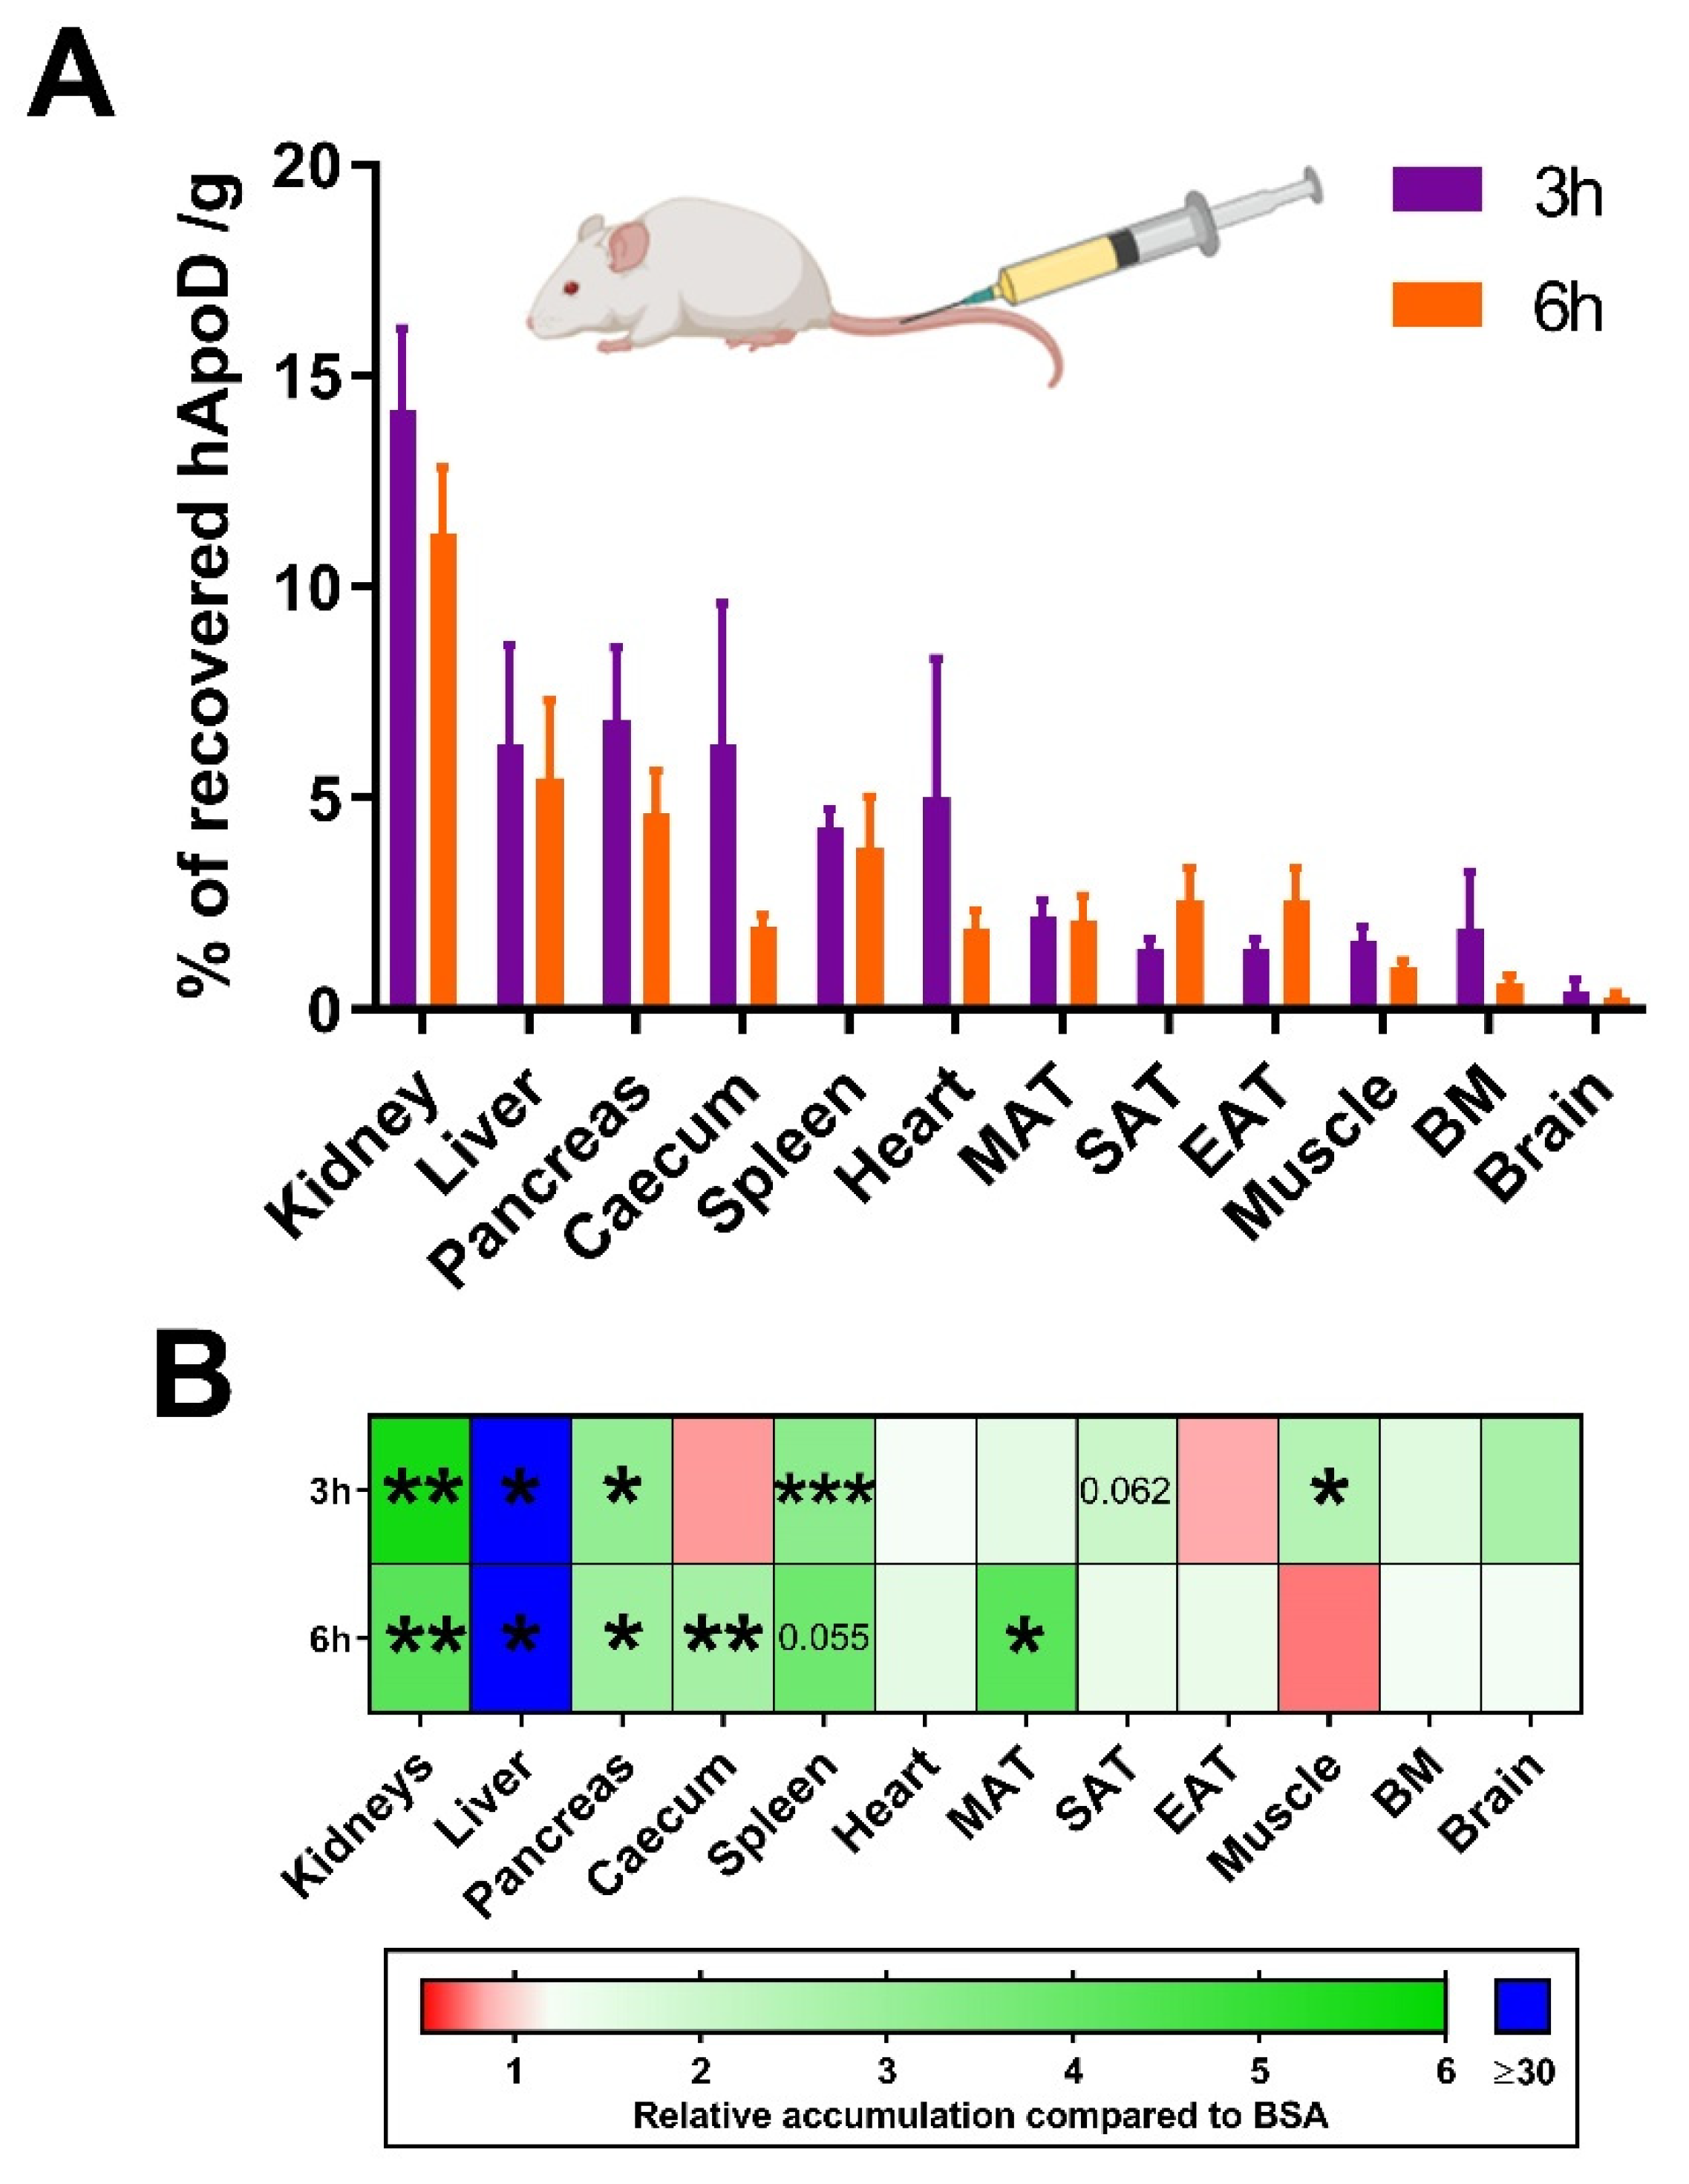
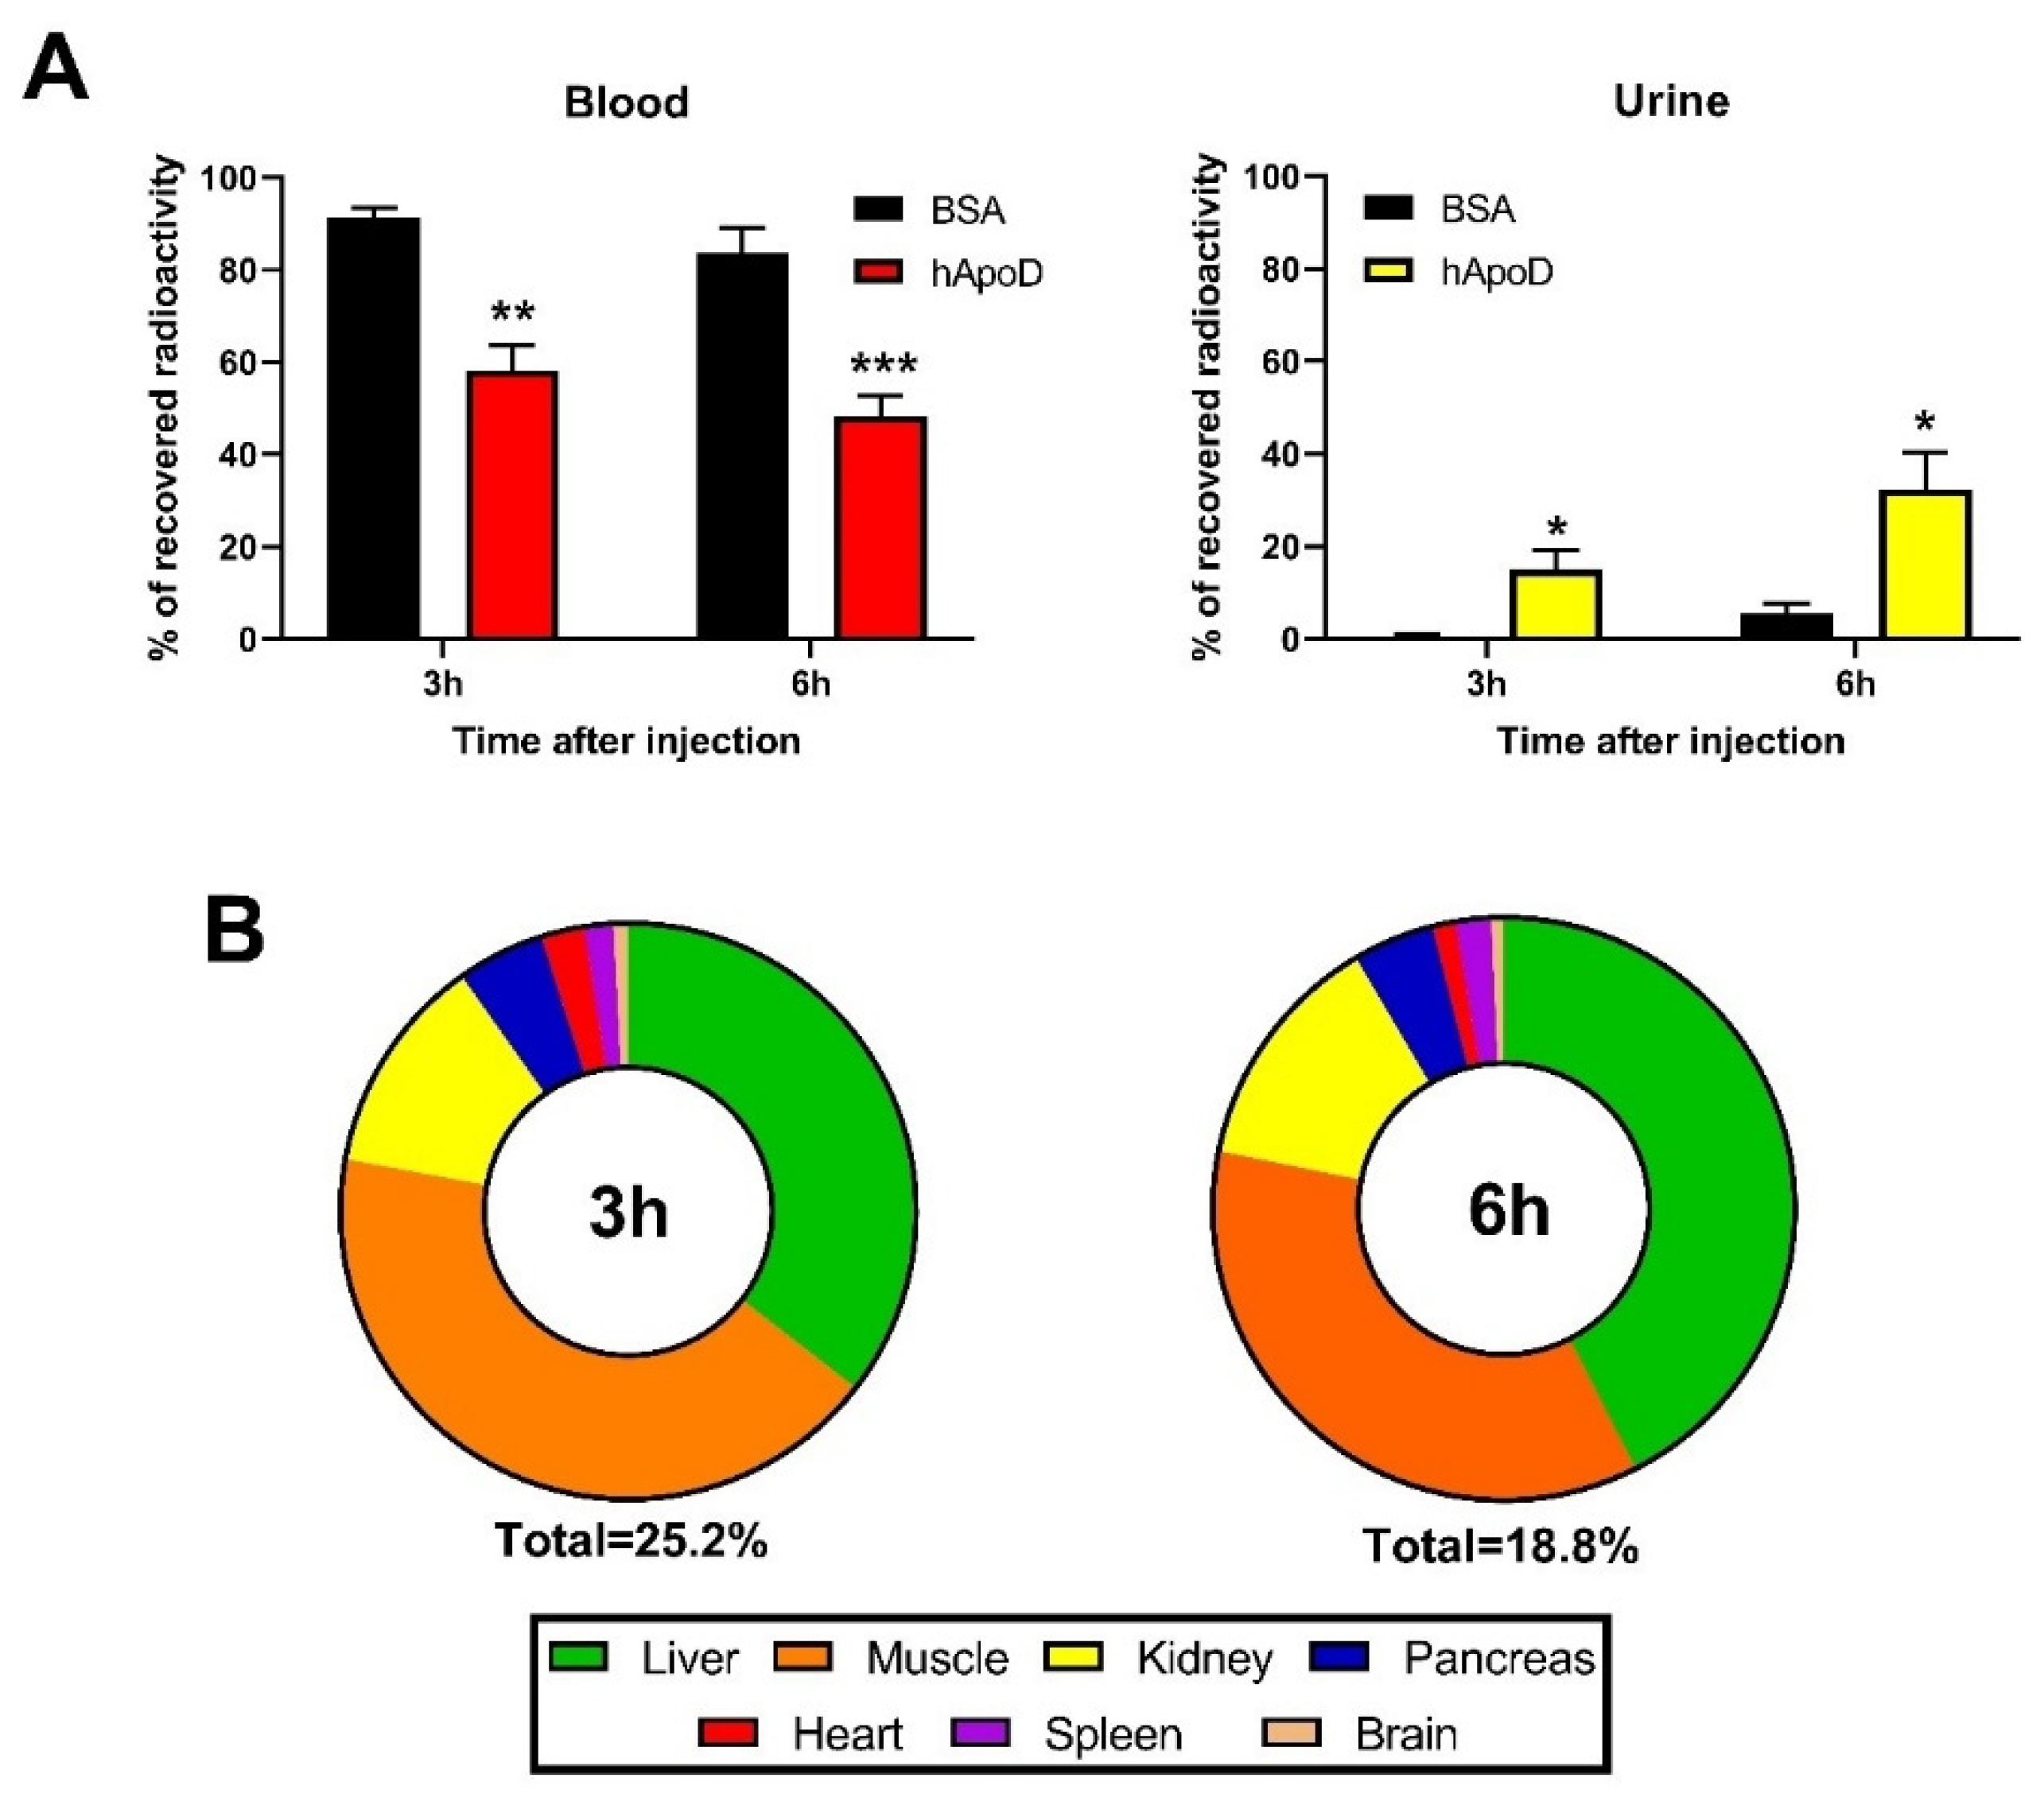
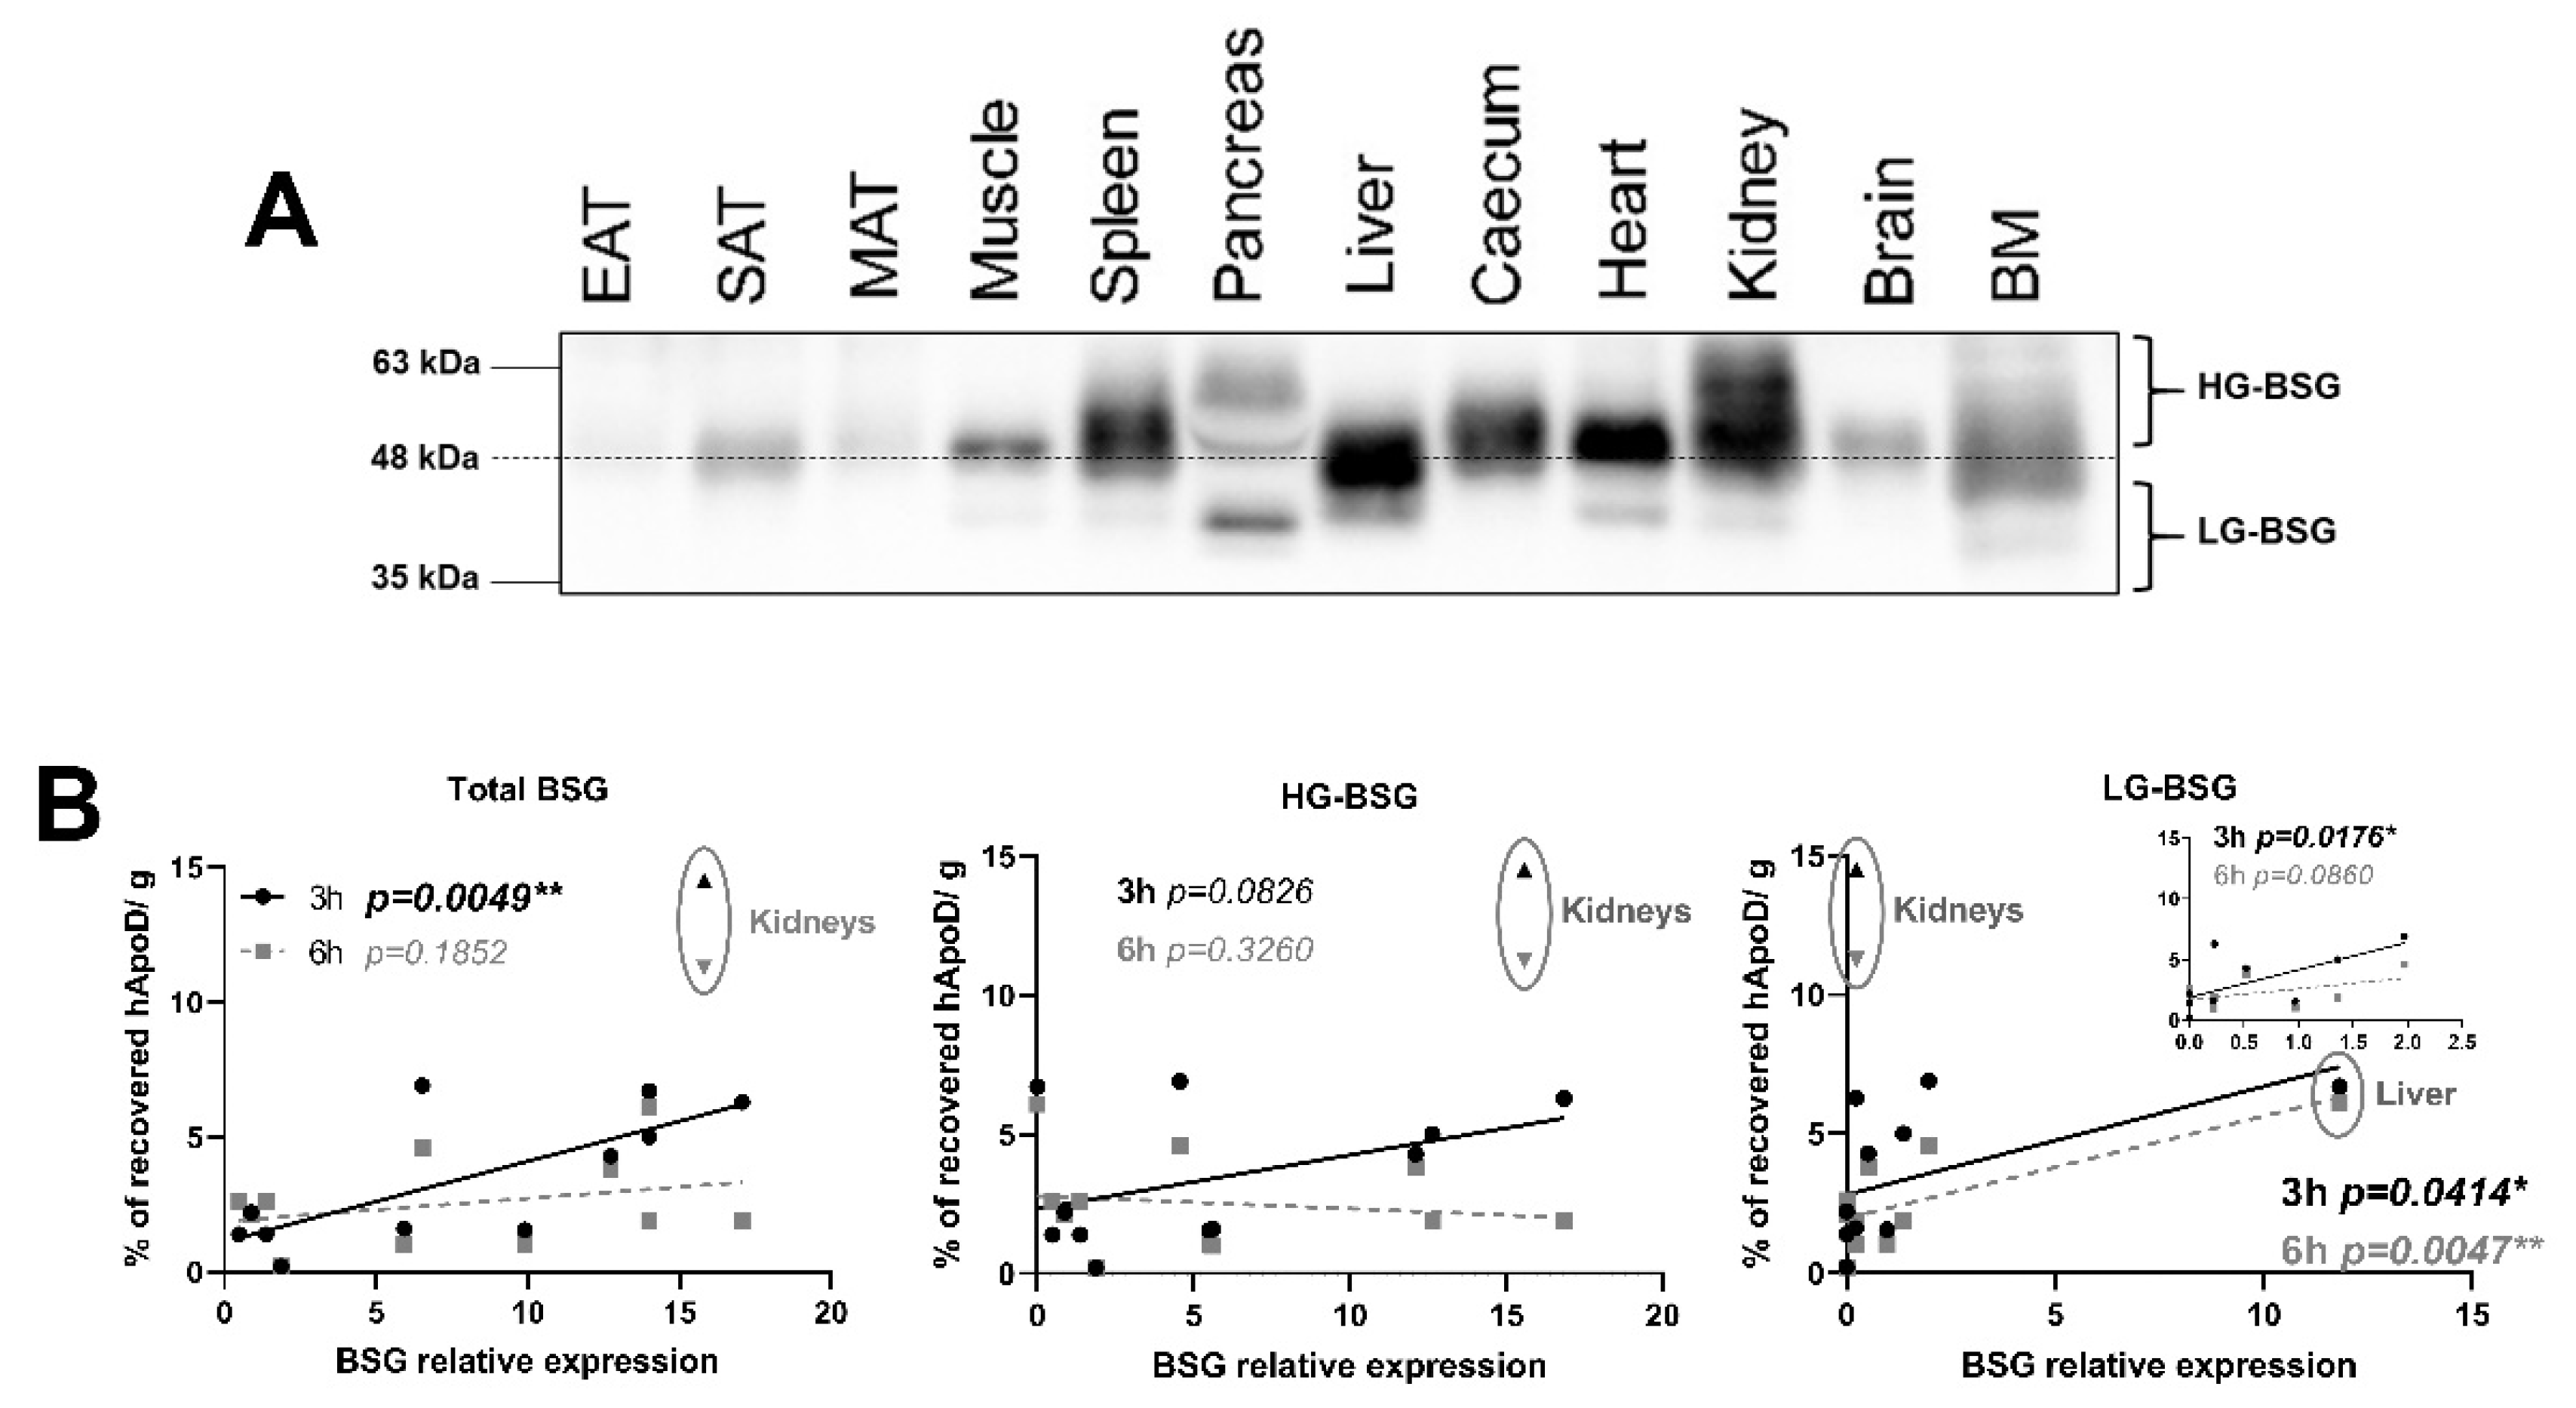
2.2. hApoD Accumulates in Specific Tissues
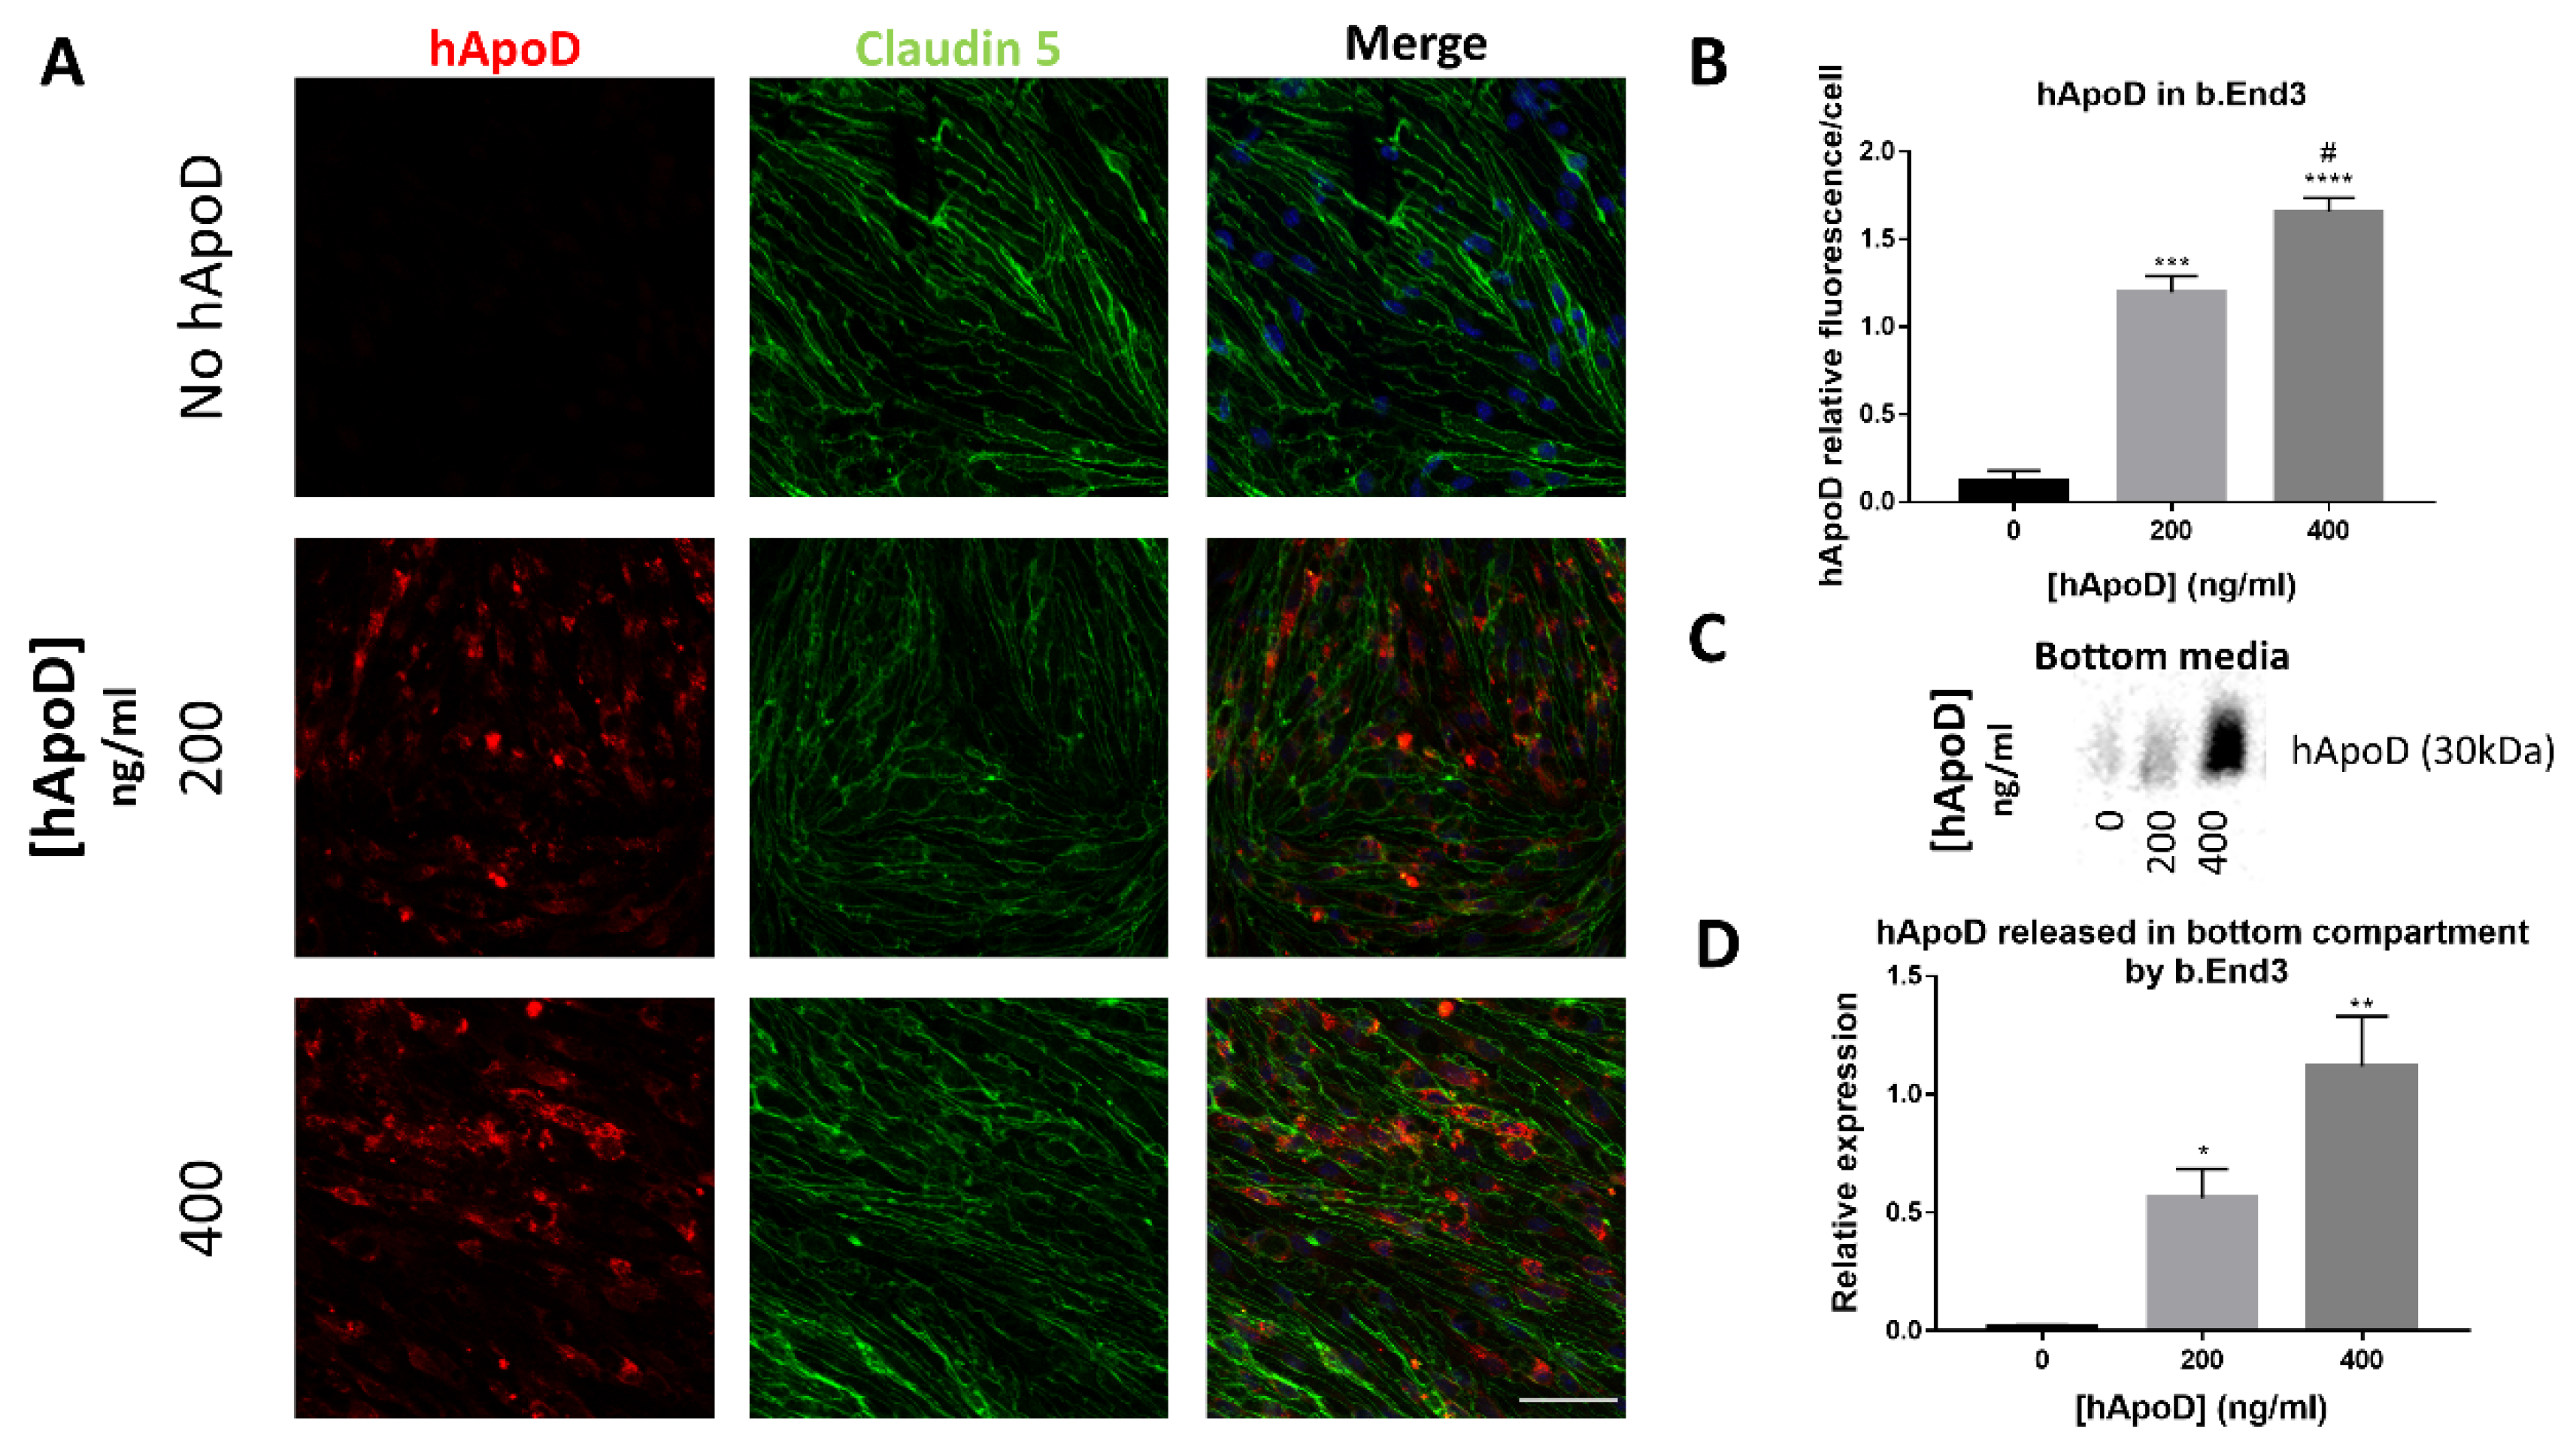
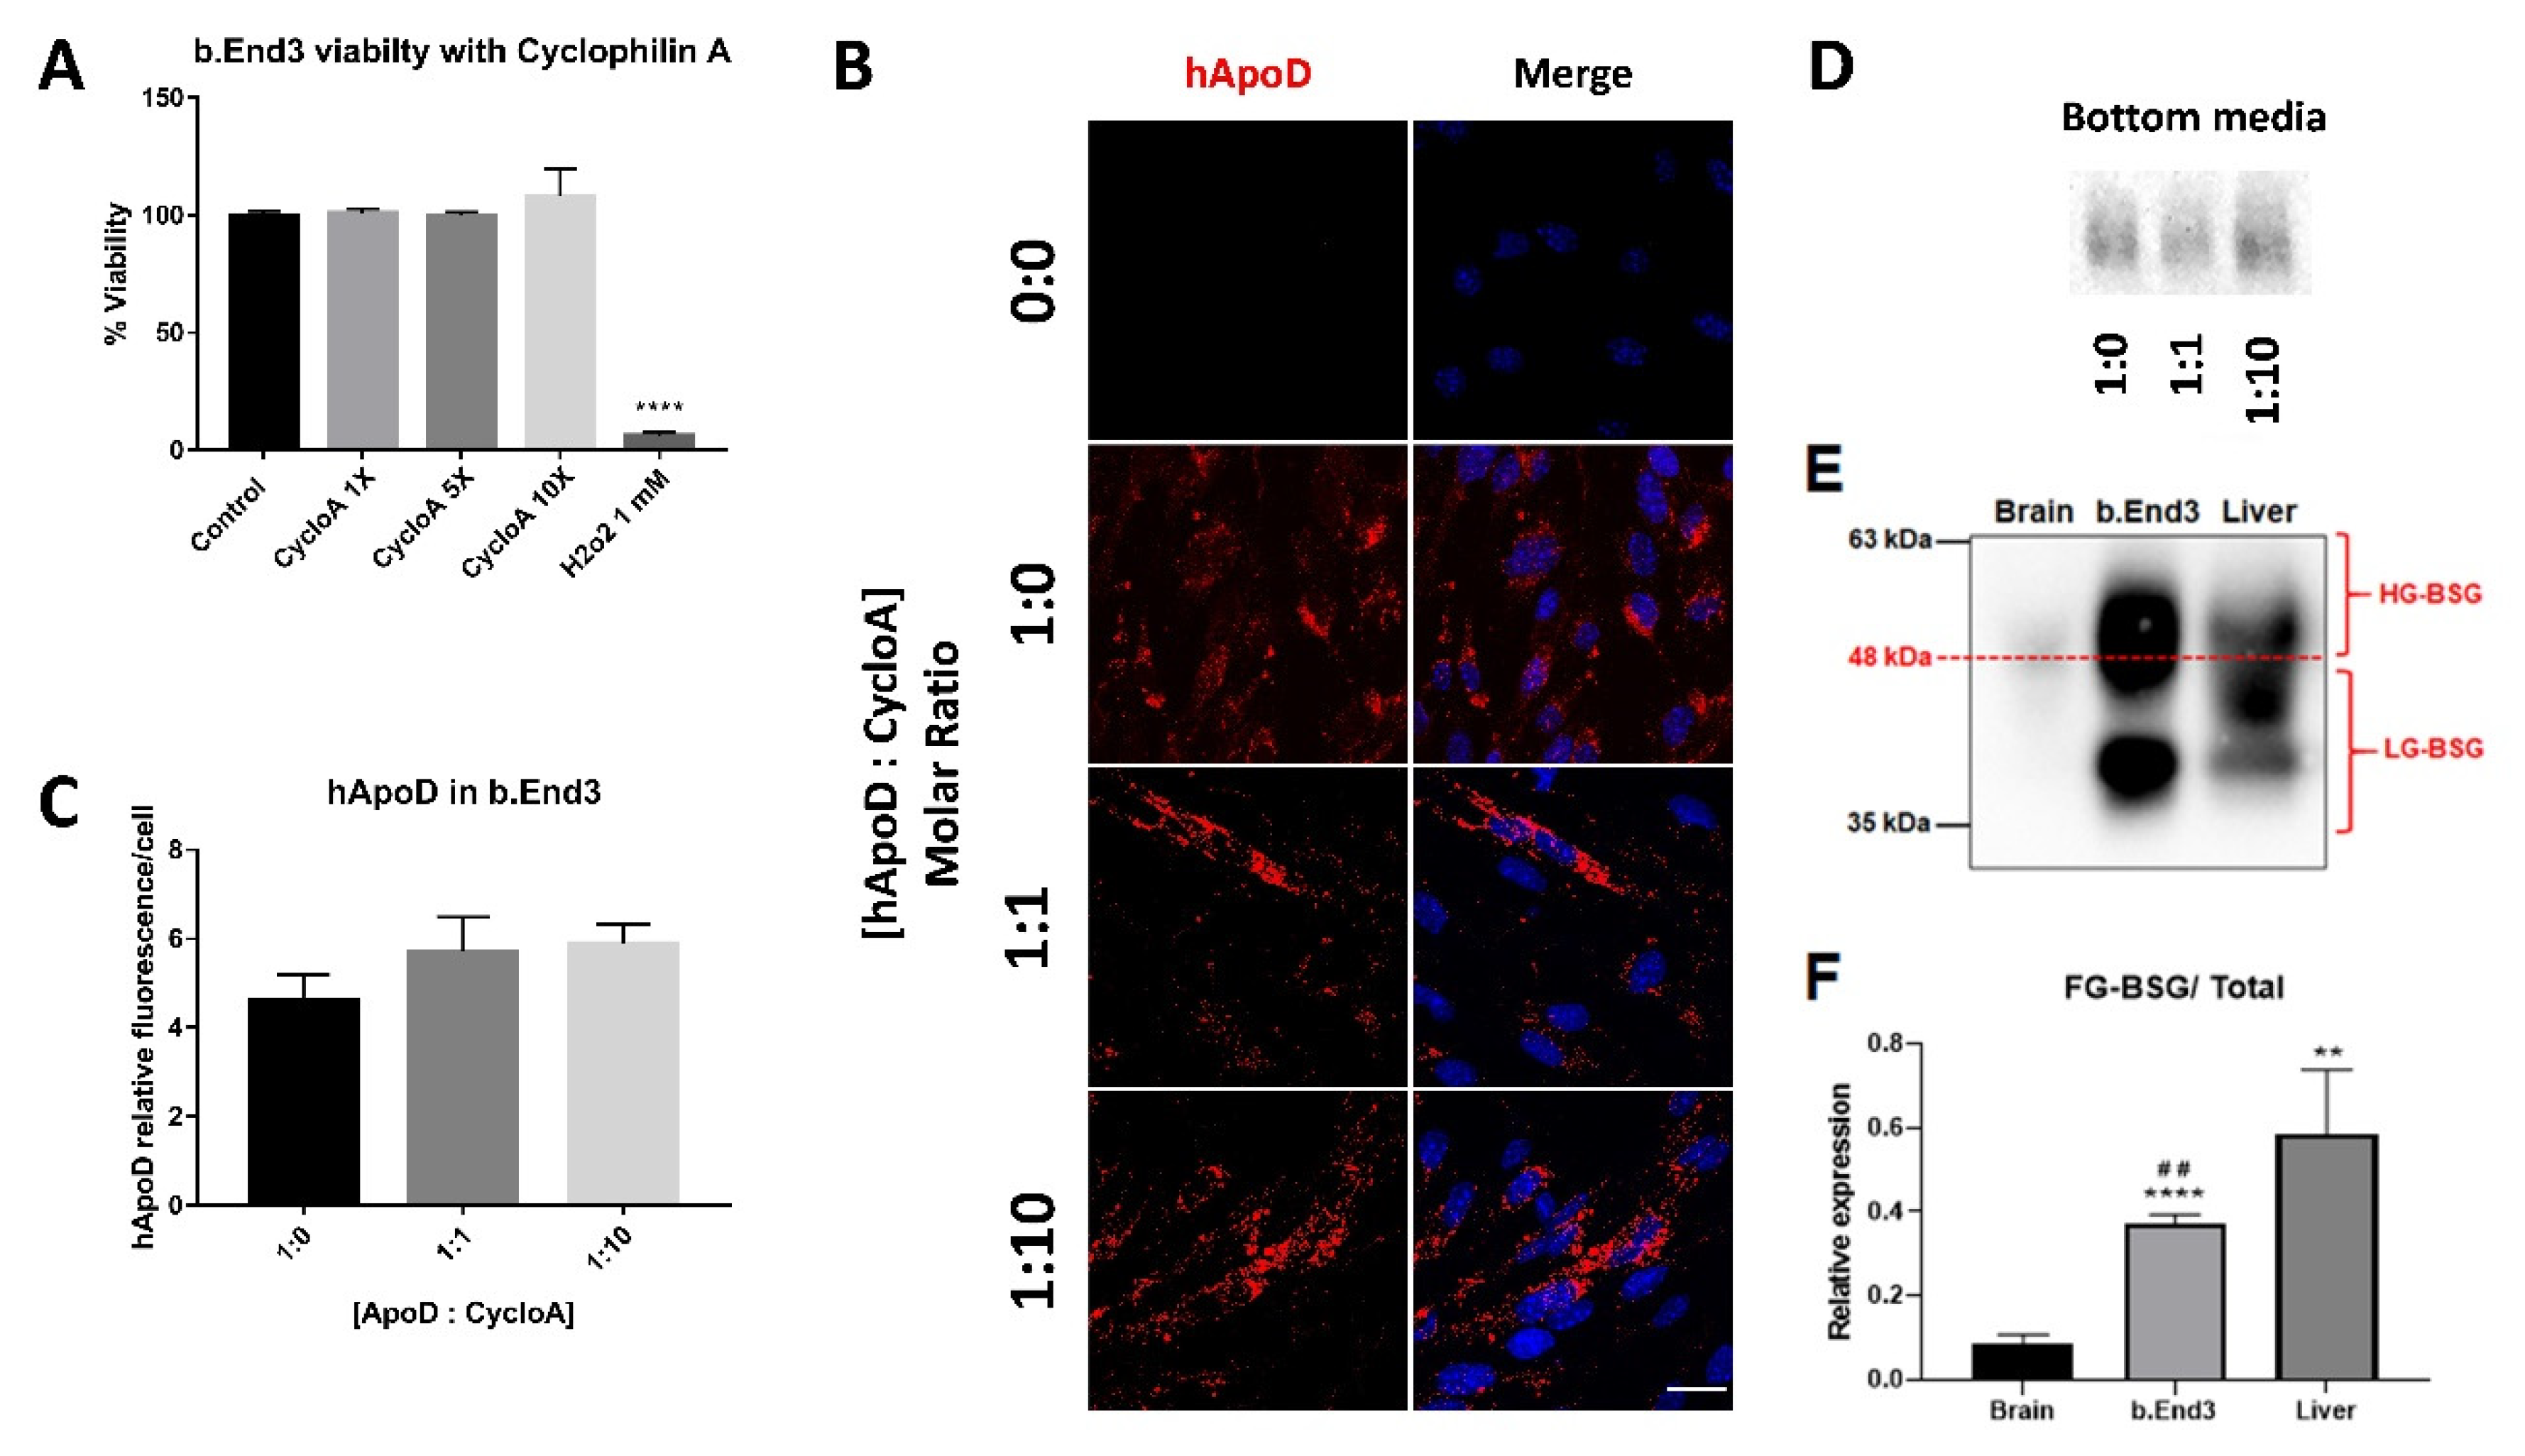
2.3. hApoD Transcytoses through bEnd.3 Brain Endothelial Barrier Cells
2.4. Cyclophilin A Competition Does Not Reduce hApoD Internalization in Brain Endothelial Barrier Cells
2.5. Relationship between BSG Glycosylation and hApoD Accumulation
3. Discussion
4. Materials and Methods
4.1. Animals
4.2. Protein Radiolabelling
4.3. Intracerebroventricular and Intravascular Injections
4.4. Tissue and Fluid Sample Preparation
4.5. Cell Culture
4.6. Immunofluorescence
4.7. Immunoblotting
4.8. Statistics
Supplementary Materials
Author Contributions
Funding
Institutional Review Board Statement
Informed Consent Statement
Data Availability Statement
Acknowledgments
Conflicts of Interest
References
- Rassart, E.; Desmarais, F.; Najyb, O.; Bergeron, K.F. Mounier Apolipoprotein D. Gene 2020, 756, 144874. [Google Scholar] [CrossRef]
- Li, H.; Ruberu, K.; Karl, T.; Garner, B. Cerebral Apolipoprotein-D Is Hypoglycosylated Compared to Peripheral Tissues and Is Variably Expressed in Mouse and Human Brain Regions. PLoS ONE 2016, 11, e0148238. [Google Scholar] [CrossRef] [Green Version]
- Kielkopf, C.S.; Low, J.K.K.; Mok, Y.F.; Bhatia, S.; Palasovski, T.; Oakley, A.J.; Whitten, A.E.; Garner, B.; Brown, S.H.J. Identification of a novel tetrameric structure for human apolipoprotein-D. J. Struct. Biol. 2018, 203, 205–218. [Google Scholar] [CrossRef]
- Balbin, M.; Freije, J.M.; Fueyo, A.; Sanchez, L.M.; Lopez-Otin, C. Apolipoprotein D is the major protein component in cyst fluid from women with human breast gross cystic disease. Biochem. J. 1990, 271, 803–807. [Google Scholar] [CrossRef] [Green Version]
- Rassart, E.; Bedirian, A.; Do Carmo, S.; Guinard, O.; Sirois, J.; Terrisse, L.; Milne, R. Apolipoprotein D. Biochim. Biophys. Acta 2000, 1482, 185–198. [Google Scholar] [CrossRef]
- Morais Cabral, J.H.; Atkins, G.L.; Sánchez, L.M.; López-Boado, Y.S.; López-Otin, C.; Sawyer, L. Arachidonic acid binds to apolipoprotein D: Implications for the protein’s function. FEBS Lett. 1995, 366, 53–56. [Google Scholar] [CrossRef] [Green Version]
- Thomas, A.E.; George, R.C.; Sutcliffe, J.G. Apolipoprotein D modulates arachidonic acid signaling in cultured cells: Implications for psychiatric disorders. Prostaglandins Leukot. Essent. Fat. Acids 2003, 69, 421–427. [Google Scholar] [CrossRef] [PubMed]
- Desmarais, F.; Bergeron, K.F.; Rassart, E.; Mounier, C. Apolipoprotein D overexpression alters hepatic prostaglandin and omega fatty acid metabolism during the development of a non-inflammatory hepatic steatosis. Biochim. Biophys. Acta Mol. Cell Biol. Lipids 2019, 1864, 522–531. [Google Scholar] [CrossRef]
- Ganfornina, M.D.; Do Carmo, S.; Lora, J.M.; Torres-Schumann, S.; Vogel, M.; Allhorn, M.; Gonzalez, C.; Bastiani, M.J.; Rassart, E.; Sanchez, D. Apolipoprotein D is involved in the mechanisms regulating protection from oxidative stress. Aging Cell 2008, 7, 506–515. [Google Scholar] [CrossRef] [Green Version]
- Bhatia, S.; Knoch, B.; Wong, J.; Kim, W.S.; Else, P.L.; Oakley, A.J.; Garner, B. Selective reduction of hydroperoxyeicosatetraenoic acids to their hydroxy derivatives by apolipoprotein D: Implications for lipid antioxidant activity and Alzheimer’s disease. Biochem. J. 2012, 442, 713–721. [Google Scholar] [CrossRef] [Green Version]
- Dassati, S.; Waldner, A.; Schweigreiter, R. Apolipoprotein D takes center stage in the stress response of the aging and degenerative brain. Neurobiol. Aging 2014, 35, 1632–1642. [Google Scholar] [CrossRef] [Green Version]
- Bhatia, S.; Jenner, A.M.; Li, H.; Ruberu, K.; Spiro, A.S.; Shepherd, C.E.; Kril, J.J.; Kain, N.; Don, A.; Garner, B. Increased apolipoprotein D dimer formation in Alzheimer’s disease hippocampus is associated with lipid conjugated diene levels. J. Alzheimers Dis. 2013, 35, 475–486. [Google Scholar] [CrossRef] [Green Version]
- Do Carmo, S.; Jacomy, H.; Talbot, P.J.; Rassart, E. Neuroprotective effect of apolipoprotein D against human coronavirus OC43-induced encephalitis in mice. J. Neurosci. 2008, 28, 10330–10338. [Google Scholar] [CrossRef] [Green Version]
- Najyb, O.; Brissette, L.; Rassart, E. Apolipoprotein D Internalization Is a Basigin-dependent Mechanism. J. Biol. Chem. 2015, 290, 16077–16087. [Google Scholar] [CrossRef] [Green Version]
- Najyb, O.; Do Carmo, S.; Alikashani, A.; Rassart, E. Apolipoprotein D Overexpression Protects Against Kainate-Induced Neurotoxicity in Mice. Mol. Neurobiol. 2017, 54, 3948–3963. [Google Scholar] [CrossRef]
- Drayna, D.; Fielding, C.; McLean, J.; Baer, B.; Castro, G.; Chen, E.; Comstock, L.; Henzel, W.; Kohr, W.; Rhee, L.; et al. Cloning and expression of human apolipoprotein D cDNA. J. Biol. Chem. 1986, 261, 16535–16539. [Google Scholar] [CrossRef]
- Garcia-Mateo, N.; Ganfornina, M.D.; Montero, O.; Gijon, M.A.; Murphy, R.C.; Sanchez, D. Schwann cell-derived Apolipoprotein D controls the dynamics of post-injury myelin recognition and degradation. Front. Cell. Neurosci. 2014, 8, 374. [Google Scholar]
- Séguin, D.; Desforges, M.; Rassart, E. Molecular characterization and differential mRNA tissue distribution of mouse apolipoprotein D. Mol. Brain Res. 1995, 30, 242–250. [Google Scholar] [CrossRef]
- Do Carmo, S.; Fournier, D.; Mounier, C.; Rassart, E. Human apolipoprotein D overexpression in transgenic mice induces insulin resistance and alters lipid metabolism. Am. J. Physiol. Endocrinol. Metab. 2009, 296, E802–E811. [Google Scholar] [CrossRef] [PubMed] [Green Version]
- Cofer, S.; Ross, S.R. The murine gene encoding apolipoprotein D exhibits a unique expression pattern as compared to other species. Gene 1996, 171, 261–263. [Google Scholar] [CrossRef]
- Boyles, J.K.; Notterpek, L.M.; Wardell, M.R.; Rall, S.C., Jr. Identification, characterization, and tissue distribution of apolipoprotein D in the rat. J. Lipid Res. 1990, 31, 2243–2256. [Google Scholar] [CrossRef]
- Labrie, M.; Lalonde, S.; Najyb, O.; Thiery, M.; Daneault, C.; Des Rosiers, C.; Rassart, E.; Mounier, C. Apolipoprotein D Transgenic Mice Develop Hepatic Steatosis through Activation of PPARgamma and Fatty Acid Uptake. PLoS ONE 2015, 10, e0130230. [Google Scholar] [CrossRef] [Green Version]
- Camato, R.; Marcel, Y.L.; Milne, R.W.; Lussier-Cacan, S.; Weech, P.K. Protein polymorphism of a human plasma apolipoprotein D antigenic epitope. J. Lipid Res. 1989, 30, 865–875. [Google Scholar] [CrossRef]
- Cheow, E.S.; Cheng, W.C.; Lee, C.N.; de Kleijn, D.; Sorokin, V.; Sze, S.K. Plasma-derived Extracellular Vesicles Contain Predictive Biomarkers and Potential Therapeutic Targets for Myocardial Ischemic (MI) Injury. Mol. Cell. Proteom. 2016, 15, 2628–2640. [Google Scholar] [CrossRef] [Green Version]
- Jiang, R.; Rong, C.; Ke, R.; Meng, S.; Yan, X.; Ke, H.; Wu, S. Differential proteomic analysis of serum exosomes reveals alterations in progression of Parkinson disease. Medicine 2019, 98, e17478. [Google Scholar] [CrossRef] [PubMed]
- Pascua-Maestro, R.; Gonzalez, E.; Lillo, C.; Ganfornina, M.D.; Falcon-Perez, J.M.; Sanchez, D. Extracellular Vesicles Secreted by Astroglial Cells Transport Apolipoprotein D to Neurons and Mediate Neuronal Survival Upon Oxidative Stress. Front. Cell. Neurosci. 2018, 12, 526. [Google Scholar] [CrossRef]
- Patel, S.C.; Asotra, K.; Patel, Y.C.; McConathy, W.C.; Patel, R.C.; Suresh, S. Astrocytes synthesize and secrete the lipophilic ligand carrier apolipoprotein D. Neuroreport 1995, 6, 653–657. [Google Scholar] [CrossRef] [PubMed]
- Koch, S.; Donarski, N.; Goetze, K.; Kreckel, M.; Stuerenburg, H.J.; Buhmann, C.; Beisiegel, U. Characterization of four lipoprotein classes in human cerebrospinal fluid. J. Lipid Res. 2001, 42, 1143–1151. [Google Scholar] [CrossRef]
- Mahley, R.W. Central Nervous System Lipoproteins. ApoE and Regulation of CHolesterol Metabolism. Arterioscler. Thromb. Vasc. Biol. 2016, 36, 1305–1315. [Google Scholar] [CrossRef] [Green Version]
- Sun, H.; Wang, D.; Liu, D.; Guo, Z.; Shao, C.; Sun, W.; Zeng, Y. Differential urinary proteins to diagnose coronary heart disease based on iTRAQ quantitative proteomics. Anal. Bioanal. Chem. 2019, 411, 2273–2282. [Google Scholar] [CrossRef]
- Tang, W.; Chang, S.B.; Hemler, M.E. Links between CD147 function, glycosylation, and caveolin-1. Mol. Biol. Cell 2004, 15, 4043–4050. [Google Scholar] [CrossRef]
- Uhlen, M.; Fagerberg, L.; Hallstrom, B.M.; Lindskog, C.; Oksvold, P.; Mardinoglu, A.; Sivertsson, A.; Kampf, C.; Sjostedt, E.; Asplund, A.; et al. Proteomics. Tissue-based map of the human proteome. Science 2015, 347, 1260419. [Google Scholar] [CrossRef]
- Zuchero, Y.J.; Chen, X.; Bien-Ly, N.; Bumbaca, D.; Tong, R.K.; Gao, X.; Zhang, S.; Hoyte, K.; Luk, W.; Huntley, M.A.; et al. Discovery of Novel Blood-Brain Barrier Targets to Enhance Brain Uptake of Therapeutic Antibodies. Neuron 2016, 89, 70–82. [Google Scholar] [CrossRef] [Green Version]
- Pardridge, W.M. CSF, blood-brain barrier, and brain drug delivery. Expert Opin. Drug Deliv. 2016, 13, 963–975. [Google Scholar] [CrossRef]
- Wagner, S.; Zensi, A.; Wien, S.L.; Tschickardt, S.E.; Maier, W.; Vogel, T.; Worek, F.; Pietrzik, C.U.; Kreuter, J.; von Briesen, H. Uptake mechanism of ApoE-modified nanoparticles on brain capillary endothelial cells as a blood-brain barrier model. PLoS ONE 2012, 7, e32568. [Google Scholar] [CrossRef] [PubMed]
- Rahman, N.A.; Rasil, A.; Meyding-Lamade, U.; Craemer, E.M.; Diah, S.; Tuah, A.A.; Muharram, S.H. Immortalized endothelial cell lines for in vitro blood-brain barrier models: A systematic review. Brain Res. 2016, 1642, 532–545. [Google Scholar] [CrossRef] [PubMed]
- Eigenmann, D.E.; Xue, G.; Kim, K.S.; Moses, A.V.; Hamburger, M.; Oufir, M. Comparative study of four immortalized human brain capillary endothelial cell lines, hCMEC/D3, hBMEC, TY10, and BB19, and optimization of culture conditions, for an in vitro blood-brain barrier model for drug permeability studies. Fluids Barriers CNS 2013, 10, 33. [Google Scholar] [CrossRef] [PubMed] [Green Version]
- Yang, S.; Mei, S.; Jin, H.; Zhu, B.; Tian, Y.; Huo, J.; Cui, X.; Guo, A.; Zhao, Z. Identification of two immortalized cell lines, ECV304 and bEnd3, for in vitro permeability studies of blood-brain barrier. PLoS ONE 2017, 12, e0187017. [Google Scholar] [CrossRef]
- Rabanel, J.M.; Piec, P.A.; Landri, S.; Patten, S.A.; Ramassamy, C. Transport of PEGylated-PLA nanoparticles across a blood brain barrier model, entry into neuronal cells and in vivo brain bioavailability. J. Control. Release 2020, 328, 679–695. [Google Scholar] [CrossRef] [PubMed]
- Watanabe, T.; Dohgu, S.; Takata, F.; Nishioku, T.; Nakashima, A.; Futagami, K.; Yamauchi, A.; Kataoka, Y. Paracellular barrier and tight junction protein expression in the immortalized brain endothelial cell lines bEND.3, bEND.5 and mouse brain endothelial cell 4. Biol. Pharm. Bull. 2013, 36, 492–495. [Google Scholar] [CrossRef] [PubMed] [Green Version]
- Helms, H.C.; Abbott, N.J.; Burek, M.; Cecchelli, R.; Couraud, P.O.; Deli, M.A.; Forster, C.; Galla, H.J.; Romero, I.A.; Shusta, E.V.; et al. In vitro models of the blood-brain barrier: An overview of commonly used brain endothelial cell culture models and guidelines for their use. J. Cereb. Blood Flow Metab. 2016, 36, 862–890. [Google Scholar] [CrossRef]
- Brown, C.R.; Morris, A.P.; O’Neil, R.G. Tight junction protein expression and barrier properties of immortalized mouse brain microvessel endothelial cells. Brain Res. 2007, 1130, 17–30. [Google Scholar] [CrossRef] [PubMed] [Green Version]
- Tumani, H.; Huss, A.; Bachhuber, F. The cerebrospinal fluid and barriers—anatomic and physiologic considerations. Handb. Clin. Neurol. 2017, 146, 21–32. [Google Scholar] [PubMed]
- Jessen, N.A.; Munk, A.S.; Lundgaard, I.; Nedergaard, M. The Glymphatic System: A Beginner’s Guide. Neurochem. Res. 2015, 40, 2583–2599. [Google Scholar] [CrossRef] [PubMed] [Green Version]
- Blanco-Vaca, F.; Pownall, H.J. Disulfide linked dimers of apolipoprotein D in urine. Electrophoresis 1993, 14, 1086–1087. [Google Scholar] [CrossRef] [PubMed]
- Ruggiero, A.; Villa, C.H.; Bander, E.; Rey, D.A.; Bergkvist, M.; Batt, C.A.; Manova-Todorova, K.; Deen, W.M.; Scheinberg, D.A.; McDevitt, M.R. Paradoxical glomerular filtration of carbon nanotubes. Proc. Natl. Acad. Sci. USA 2010, 107, 12369–12374. [Google Scholar] [CrossRef] [Green Version]
- Rodewald, R.; Karnovsky, M.J. Porous substructure of the glomerular slit diaphragm in the rat and mouse. J. Cell Biol. 1974, 60, 423–433. [Google Scholar] [CrossRef] [Green Version]
- Tojo, A.; Kinugasa, S. Mechanisms of glomerular albumin filtration and tubular reabsorption. Int. J. Nephrol. 2012, 2012, 481520. [Google Scholar] [CrossRef] [PubMed] [Green Version]
- Eichinger, A. Structural insight into the dual ligand specificity and mode of high density lipoprotein association of apolipoprotein D. J. Biol. Chem. 2007, 282, 31068–31075. [Google Scholar] [CrossRef] [Green Version]
- Bhatia, S.; Kim, W.S.; Shepherd, C.E.; Halliday, G.M. Apolipoprotein D Upregulation in Alzheimer’s Disease but Not Frontotemporal Dementia. J. Mol. Neurosci. 2019, 67, 125–132. [Google Scholar] [CrossRef] [PubMed] [Green Version]
- Terrisse, L.; Poirier, J.; Bertrand, P.; Merched, A.; Visvikis, S.; Siest, G.; Milne, R.; Rassart, E. Increased levels of apolipoprotein D in cerebrospinal fluid and hippocampus of Alzheimer’s patients. J. Neurochem. 1998, 71, 1643–1650. [Google Scholar] [CrossRef] [PubMed]
- Kalman, J.; McConathy, W.; Araoz, C.; Kasa, P.; Lacko, A.G. Apolipoprotein D in the aging brain and in Alzheimer’s dementia. Neurol. Res. 2000, 22, 330–336. [Google Scholar] [CrossRef] [PubMed]
- Desai, P.P.; Ikonomovic, M.D.; Abrahamson, E.E.; Hamilton, R.L.; Isanski, B.A.; Hope, C.E.; Klunk, W.E.; DeKosky, S.T.; Kamboh, M.I. Apolipoprotein D is a component of compact but not diffuse amyloid-beta plaques in Alzheimer’s disease temporal cortex. Neurobiol. Dis. 2005, 20, 574–582. [Google Scholar] [CrossRef]
- Thomas, E.A.; Dean, B.; Pavey, G.; Sutcliffe, J.G. Increased CNS levels of apolipoprotein D in schizophrenic and bipolar subjects: Implications for the pathophysiology of psychiatric disorders. Proc. Natl. Acad. Sci. USA 2001, 98, 4066–4071. [Google Scholar] [CrossRef] [Green Version]
- Ong, Y.W.; Hu, C.Y.; Patel, S.C. Apolipoprotein D in the Niemann-Pick type C disease mouse brain: An ultrastructural immunocytochemical analysis. J. Neurocytol. 2002, 31, 121–129. [Google Scholar] [CrossRef]
- Bazinet, P.R.; Laye, S. Polyunsaturated fatty acids and their metabolites in brain function and disease. Nat. Rev. Neurosci. 2014, 15, 771–785. [Google Scholar] [CrossRef] [PubMed]
- Perrotte, M.; Le Page, A.; Fournet, M.; Le Sayec, M.; Rassart, E.; Fulop, T.; Ramassamy, C. Blood-based redox-signature and their association to the cognitive scores in MCI and Alzheimer’s disease patients. Free Radic. Biol. Med. 2019, 130, 499–511. [Google Scholar] [CrossRef]
- Smith, P.C.; Frank, H.A.; Kasdon, E.J.; Dearborn, E.C.; Skillman, J.J. Albumin uptake by skin, skeletal muscle and lung in living and dying patients. Ann. Surg. 1978, 187, 31–37. [Google Scholar] [CrossRef]
- Hashem, L.; Swedrowska, M.; Vllasaliu, D. Intestinal uptake and transport of albumin nanoparticles: Potential for oral delivery. Nanomedicine 2018, 13, 1255–1265. [Google Scholar] [CrossRef] [Green Version]
- Chen, Y.W.; Gregory, C.M.; Scarborough, M.T.; Shi, R.; Walter, G.A.; Vandenborne, K. Transcriptional pathways associated with skeletal muscle disuse atrophy in humans. Physiol. Genom. 2007, 31, 510–520. [Google Scholar] [CrossRef]
- Do Carmo, S.; Seguin, D.; Milne, R.; Rassart, E. Modulation of apolipoprotein D and apolipoprotein E mRNA expression by growth arrest and identification of key elements in the promoter. J. Biol. Chem. 2002, 277, 5514–5523. [Google Scholar] [CrossRef] [Green Version]
- Nowell, S.A.; Leakey, J.E.; Warren, J.F.; Lang, N.P.; Frame, L.T. Identification of enzymes responsible for the metabolism of heme in human platelets. J. Biol. Chem. 1998, 273, 33342–33346. [Google Scholar] [CrossRef] [PubMed] [Green Version]
- Peitsch, M.; Boguski, M. Is apolipoprotein D a mammalian bilin-binding protein? New Biol. 1990, 2, 197–206. [Google Scholar]
- Desmarais, F.; Bergeron, K.F.; Lacaille, M.; Lemieux, I.; Bergeron, J.; Biron, S.; Rassart, E.; Joanisse, D.R.; Mauriege, P.; Mounier, C. High ApoD protein level in the round ligament fat depot of severely obese women is associated with an improved inflammatory profile. Endocrine 2018, 61, 248–257. [Google Scholar] [CrossRef] [PubMed]
- Charron, J.B.; Ouellet, F.; Houde, M.; Sarhan, F. The plant Apolipoprotein D ortholog protects Arabidopsis against oxidative stress. BMC Plant Biol. 2008, 8, 86. [Google Scholar] [CrossRef] [PubMed] [Green Version]
- Muffat, J.; Walker, D.W.; Benzer, S. Human ApoD, an apolipoprotein up-regulated in neurodegenerative diseases, extends lifespan and increases stress resistance in Drosophila. Proc. Natl. Acad. Sci. USA 2008, 105, 7088–7093. [Google Scholar] [CrossRef] [Green Version]
- Bajo-Graneras, R.; Ganfornina, M.D.; Martin-Tejedor, E.; Sanchez, D. Apolipoprotein D mediates autocrine protection of astrocytes and controls their reactivity level, contributing to the functional maintenance of paraquat-challenged dopaminergic systems. Glia 2011, 59, 1551–1566. [Google Scholar] [CrossRef] [Green Version]
- Jin, D.; El-Tanani, M.; Campbell, F. Identification of apolipoprotein D as a novel inhibitor of osteopontin-induced neoplastic transformation. Int. J. Oncol. 2006, 29, 1591–1599. [Google Scholar] [CrossRef] [PubMed]
- Takeshita, Y.; Ransohoff, R.M. Inflammatory cell trafficking across the blood-brain barrier: Chemokine regulation and in vitro models. Immunol. Rev. 2012, 248, 228–239. [Google Scholar] [CrossRef] [Green Version]
- Arey, B. The Role of Glycosylation in Receptor Signaling. In Glycosylation; Petrescu, S., Ed.; IntechOpen: London, UK, 2012; pp. 273–286. [Google Scholar]
- Kosacka, J.; Gericke, M.; Nowicki, M.; Kacza, J.; Borlak, J.; Spanel-Borowski, K. Apolipoproteins D and E3 exert neurotrophic and synaptogenic effects in dorsal root ganglion cell cultures. Neuroscience 2009, 162, 282–291. [Google Scholar] [CrossRef]
- Bell, R.D.; Sagare, A.P.; Friedman, A.E.; Bedi, G.S.; Holtzman, D.M.; Deane, R.; Zlokovic, B.V. Transport pathways for clearance of human Alzheimer’s amyloid beta-peptide and apolipoproteins E and J. in the mouse central nervous system. J. Cereb. Blood Flow Metab. 2007, 27, 909–918. [Google Scholar] [CrossRef] [Green Version]
- Deane, R.; Sagare, A.; Hamm, K.; Parisi, M.; Lane, S.; Finn, M.B.; Holtzman, D.M.; Zlokovic, B.V. Apoe isoform-specific disruption of amyloid beta peptide clearance from mouse brain. J. Clin. Investig. 2008, 118, 4002–4013. [Google Scholar] [CrossRef] [PubMed] [Green Version]
- Alvarez-Erviti, L.; Seow, Y.; Yin, H.; Betts, C.; Lakhal, S.; Wood, M.J. Delivery of siRNA to the mouse brain by systemic injection of targeted exosomes. Nat. Biotechnol. 2011, 29, 341–345. [Google Scholar] [CrossRef]
- Vavere, L.A.; Welch, M.J. Preparation, biodistribution, and small animal PET of 45Ti-transferrin. J. Nucl. Med. 2005, 46, 683–690. [Google Scholar]
- Banks, A.W.; Farr, S.A.; Morley, J.E. Permeability of the blood-brain barrier to albumin and insulin in the young and aged SAMP8 mouse. J. Gerontol. A Biol. Sci. Med. Sci. 2000, 55, B601–B606. [Google Scholar] [CrossRef] [PubMed] [Green Version]
- Fishman, J.B.; Rubin, J.B.; Handrahan, J.V.; Connor, J.R.; Fine, R.E. Receptor-mediated transcytosis of transferrin across the blood-brain barrier. J. Neurosci. Res. 1987, 18, 299–304. [Google Scholar] [CrossRef]
- McFarlane, A. Efficient trace-labelling of proteins with iodine. Nature 1958, 182, 53. [Google Scholar] [CrossRef] [PubMed]
- Bradford, M.M. A rapid and sensitive method for the quantitation of microgram quantities of protein utilizing the principle of protein-dye binding. Anal. Biochem. 1976, 72, 248–254. [Google Scholar] [CrossRef]
- Xiang, J.; Wang, Z.H.; Ahn, E.H.; Liu, X.; Yu, S.P.; Manfredsson, F.P.; Sandoval, I.M.; Ju, G.; Wu, S.; Ye, K. Delta-secretase-cleaved Tau antagonizes TrkB neurotrophic signalings, mediating Alzheimer’s disease pathologies. Proc. Natl. Acad. Sci. USA 2019, 116, 9094–9102. [Google Scholar] [CrossRef] [PubMed] [Green Version]
- Sasaki-Hamada, S.; Ikeda, M.; Oka, J.I. Glucagon-like peptide-2 rescues memory impairments and neuropathological changes in a mouse model of dementia induced by the intracerebroventricular administration of streptozotocin. Sci. Rep. 2019, 9, 13723. [Google Scholar] [CrossRef]
- Chen, Y.; Liang, Z.; Tian, Z.; Blanchard, J.; Dai, C.L.; Chalbot, S.; Iqbal, K.; Liu, F.; Gong, C.X. Intracerebroventricular streptozotocin exacerbates Alzheimer-like changes of 3xTg-AD mice. Mol. Neurobiol. 2014, 49, 547–562. [Google Scholar] [CrossRef] [PubMed] [Green Version]
- Harkness, J.; Wagner, J. Biology and husbandry. In The Biology and Medicine of Rabbits and Rodents; Harkness, J., Wagner, J., Eds.; Lea & Febiger: Philadelphia, PA, USA, 1989; p. 372. [Google Scholar]
- Griffin, E.G.; Goldspink, G. The increase in skeletal muscle mass in male and female mice. Anat. Rec. 1973, 177, 465–469. [Google Scholar] [CrossRef] [PubMed]
- Yang, B.; Verbavatz, J.M.; Song, Y.; Vetrivel, L.; Manley, G.; Kao, W.M.; Ma, T.; Verkman, A.S. Skeletal muscle function and water permeability in aquaporin-4 deficient mice. Am. J. Physiol. Cell Physiol. 2000, 278, C1108–C1115. [Google Scholar] [CrossRef] [PubMed]
- Li, G.; Simon, M.J.; Cancel, L.M.; Shi, Z.D.; Ji, X.; Tarbell, J.M.; Morrison, B., 3rd; Fu, B.M. Permeability of endothelial and astrocyte cocultures: In vitro blood-brain barrier models for drug delivery studies. Ann. Biomed. Eng. 2010, 38, 2499–2511. [Google Scholar] [CrossRef] [Green Version]
- Terrisse, L.; Marcoux, K.; Do Carmo, S.; Brissette, L.; Milne, R.; Rassart, E. Structure-function relationships of human apolipoprotein D an immunochemical analysis. Life Sci. 2001, 70, 629–638. [Google Scholar] [CrossRef]


Publisher’s Note: MDPI stays neutral with regard to jurisdictional claims in published maps and institutional affiliations. |
© 2021 by the authors. Licensee MDPI, Basel, Switzerland. This article is an open access article distributed under the terms and conditions of the Creative Commons Attribution (CC BY) license (https://creativecommons.org/licenses/by/4.0/).
Share and Cite
Desmarais, F.; Hervé, V.; Bergeron, K.F.; Ravaut, G.; Perrotte, M.; Fyfe-Desmarais, G.; Rassart, E.; Ramassamy, C.; Mounier, C. Cerebral Apolipoprotein D Exits the Brain and Accumulates in Peripheral Tissues. Int. J. Mol. Sci. 2021, 22, 4118. https://0-doi-org.brum.beds.ac.uk/10.3390/ijms22084118
Desmarais F, Hervé V, Bergeron KF, Ravaut G, Perrotte M, Fyfe-Desmarais G, Rassart E, Ramassamy C, Mounier C. Cerebral Apolipoprotein D Exits the Brain and Accumulates in Peripheral Tissues. International Journal of Molecular Sciences. 2021; 22(8):4118. https://0-doi-org.brum.beds.ac.uk/10.3390/ijms22084118
Chicago/Turabian StyleDesmarais, Frederik, Vincent Hervé, Karl F. Bergeron, Gaétan Ravaut, Morgane Perrotte, Guillaume Fyfe-Desmarais, Eric Rassart, Charles Ramassamy, and Catherine Mounier. 2021. "Cerebral Apolipoprotein D Exits the Brain and Accumulates in Peripheral Tissues" International Journal of Molecular Sciences 22, no. 8: 4118. https://0-doi-org.brum.beds.ac.uk/10.3390/ijms22084118