Article

Catalase (CAT) Gene Family in Rapeseed (Brassica napus L.): Genome-Wide Analysis, Identification, and Expression Pattern in Response to Multiple Hormones and Abiotic Stress Conditions

1
Key Lab of Biology and Genetic Improvement of Oil Crops, Oil Crops Research Institute, Chinese Academy of Agricultural Sciences (CAAS), Wuhan 430062, China
2
Crops Research Laboratory, Xiaogan Academy of Agricultural Sciences, Xiaogan 432000, China
3
College of Agriculture, Engineering Research Center of Ecology and Agricultural Use of Wetland of Ministry of Education, Yangtze University, Jingzhou 434025, China
*
Authors to whom correspondence should be addressed.
These authors contributed equally to this work.
Int. J. Mol. Sci. 2021, 22(8), 4281; https://0-doi-org.brum.beds.ac.uk/10.3390/ijms22084281
Submission received: 2 April 2021 / Revised: 15 April 2021 / Accepted: 19 April 2021 / Published: 20 April 2021
(This article belongs to the Special Issue Genomic Studies of Plant-Environment Interactions)

Abstract

:
Catalase (CAT) is an antioxidant enzyme expressed by the CAT gene family and exists in almost all aerobic organisms. Environmental stresses induce the generation of reactive oxygen species (ROS) that eventually hinder plant growth and development. The CAT enzyme translates the hydrogen peroxide (H2O2) to water (H2O) and reduce the ROS levels to shelter the cells’ death. So far, the CAT gene family has not been reported in rapeseed (Brassica napus L.). Therefore, a genome-wide comprehensive analysis was conducted to classify the CAT genes in the rapeseed genome. The current study identified 14 BnCAT genes in the rapeseed genome. Based on phylogenetic and synteny analysis, the BnCATs belong to four groups (Groups I–IV). A gene structure and conserved motif analysis showed that Group I, Group II, and Group IV possess almost the same intron/exon pattern, and an equal number of motifs, while Group III contains diverse structures and contain 15 motifs. By analyzing the cis-elements in the promoters, we identified five hormone-correlated responsive elements and four stress-related responsive elements. Further, six putative bna-miRNAs were also identified, targeting three genes (BnCAT4, BnCAT6, and BnCAT8). Gene ontology (GO) enrichment analysis showed that the BnCAT genes were largely related to cellular organelles, ROS response, stimulus response, stress response, and antioxidant enzymes. Almost 10 BnCAT genes showed higher expression levels in different tissues, i.e., root, leaf, stem, and silique. The expression analysis showed that BnCAT1–BnCAT3 and BnCAT11–BnCAT13 were significantly upregulated by cold, salinity, abscisic acid (ABA), and gibberellic acid (GA) treatment, but not by drought and methyl jasmonate (MeJA). Notably, most of the genes were upregulated by waterlogging stress, except BnCAT6, BnCAT9, and BnCAT10. Our results opened new windows for future investigations and provided insights into the CAT family genes in rapeseed.

1. Introduction

Numerous environmental factors, including abiotic and biotic stresses, significantly limit plants’ growth and development [1]. Under stress environments, the plant modifies its homeostatic apparatus by producing a surplus level of reactive oxygen species (ROS). ROS, which consist of a superoxide anion, hydrogen peroxide, hydroxyl radical, and singlet oxygen, are produced as a lethal derivative of regular oxygen metabolism and serve as a signaling component in plant molecular biology [2,3]. Over the past decade, many investigations have discovered that ROS homeostasis is important for upholding normal cellular roles [2,3]. Therefore, upholding a considerable amount of ROS is crucial for appropriate cellular ROS signaling, and this amount can be attained by maintaining the balance among ROS generation and scavenging [2,3].
The major ROS-metabolizing enzymes include superoxide dismutase, catalase, peroxidase, glutathione peroxidase, ascorbate peroxidase, glutathione reductase, glutathione S-transferase, etc., among which the catalase (CAT; EC 1.11.1.6) enzyme is crucial for ROS depollution throughout stress, and it does not need cellular reductants as they mainly catalyze a dismutase retort [4]. The tetrameric haem-comprising CAT enzyme quickly decays H2O2, producing water (H2O) and oxygen (O2), and exists in almost all aerobic organisms [4]. The activity of CAT has been detected in peroxisomes, mitochondria, cytosol, and chloroplast [2,4]. Notably, CAT owns the extreme turnover proportion, and 26 million H2O2 molecules can be changed by one CAT molecule within one minute [5,6]. In animals, CAT enzymes are programmed by an exclusive CAT gene. In contrast, in plants, these enzymes are programmed by a gene family and have been systematically investigated in a number of plant species. For instance, one CAT family member (CAT1) has been reported in castor bean (Ricinus communis L.) [7], tomato (Lycopersicon esculentum) [8], and sweet potato (Ipomoea batatas L.) [9]; two CAT members (CAT1 and CAT2) in barley (Hordeum vulgare L.) [10]; three CAT members (CAT1–CAT3) in tobacco (Nicotiana plumbaginifolia) [11], maize (Zea mays L.) [12], pumpkin (Cucurbita Linn.) [13], A. thaliana [14], and rice (Oryza sativa L.) [15]; and four (CAT1–CAT4) in cucumber (Cucumis sativus L.) [16] and rice [17]. So far, the highest number (7) of CAT genes has been documented in cotton (Gossypium hirsutum L. and G. barbadense L.) [18].
Several investigations have recommended that CAT genes’ expression is modulated temporally and spatially and reacts to numerous environmental pressures [9,19,20,21,22,23]. In A. thaliana, CAT1 is a vital gene that responds to numerous abiotic stresses by scavenging H2O2. Moreover, CAT2 and CAT3 are involved in eliminating H2O2 subsidized to ROS homeostasis in light or dark conditions [4]. According to Du et al. [14], CAT2 could be triggered in response to drought and cold stresses, while CAT3 was primarily triggered by abscisic acid (ABA) and oxidative treatments at the senescence phase. In A. thaliana, it has been validated that CAT2 is the main isoform in the leaf, which is systematically connected with photorespiration [24]. Additionally, Contento and Bassham [25] reported that A. thaliana cat2 mutants show areas of chlorosis and necrotic scratches. In Ipomoea batatas, the transcript level of CAT1 was persuaded via ethephon and stimulated by condensed glutathione (GSH), nicotinamide adenine dinucleotide phosphate (NADPH) oxidase inhibitor diphenylene iodonium (DPI), calcium ion (Ca2+) chelator egtazic acid, and cycloheximide [9]. Moreover, transgenic N. tabacum plants carrying the CAT2 gene from maize showed improved tolerance to pathogen contagion and oxidative stress [26].
Likewise, the expression levels of the CAT genes vary in different tissues. For instance, in hot pepper (Capsicum annuum L.), the transcript levels of CAT1CAT3 in diverse organs (i.e., leaf and stem) are linked to circadian rhythms and different stresses [27]. In tobacco, CAT1 and CAT2 are spotted in non-senescent leaves; the transcript pattern of CAT2 is expressively decreased in senescent leaves. In contrast, CAT3 is spotted in both types of plants [28]. In Scots pine (Pinus sylvestris L.), CAT is elaborated in embryogenesis and cell death procedures [29]. In cucumber, CAT1–CAT3 express in different organs (root, stem, leaves, flowers, and fruits), and could be significantly induced by salinity, cold, drought, and ABA treatments [16].
Moreover, previous investigations advised that miRNA-mediated modulation of ROS-associated genes is imperative for plant growth and development [30,31], as well as for stress resistance [32,33,34,35]. In Chinese cottonwood (Populus simonii), the interaction network between DNA methylation and miRNA (Ptc-miR396s and Ptc-miR156s)-target genes, and their products, affect the metabolic aspects of the antioxidant-encoding genes such as SOD and CAT under temperature stress. Results show that DNA methylation possibly modulates the transcript levels of the miRNA genes, therefore distressing the transcript of their target genes [36]. Likewise, Wang et al. [18] prophesied the miRNA-facilitated modulation of cotton CAT genes and detected some presumed target positions (catalase domain) of cotton miRNAs (novel_mir_2537/0819, miRCS46a, miRCS46a/gb-miR7486, and ghr-miR6138, etc.) under Verticillium dahlia infection. These findings specified that miRNAs might play vital roles in response to environmental cues via modulating the CAT genes.
Until now, CAT genes have been documented in several plant species and investigated under different stress conditions. Particularly, the CAT gene family has not been reported in rapeseed. Rapeseed (Brassica napus L.) is considered the second major oilseed crop after soybean (Glycine max L.). It has a composite genome because of its evolutionary past. Rapeseed yield restrictions have been changed owing to the augmented experience of multiple abiotic stresses [37,38,39]. Therefore, a genome-wide comprehensive investigation has been carried out to identify the CAT gene family in rapeseed for the first time. Further, their phylogenetic relationships, synteny analysis, gene structures, conserved motifs, cis-elements, miRNA regulator prediction, and functional annotation have been characterized. Furthermore, the expression pattern in different tissues and under various hormone and abiotic stresses has been widely evaluated to get insight into the rapeseed CAT genes.

2. Results

2.1. Identification of CAT Genes Family in Rapeseed

In the present study, a total of 14 CAT genes were recognized in the complete genome of rapeseed via BLASTP using 3 AtCAT protein sequences as queries (Table 1). These genes were named BnCAT1–BnCAT14, among which seven genes (BnCAT1–BnCAT7) were positioned in the A subgenome, and five genes (BnCAT8–BnCAT12) were positioned in the C subgenome (Table 1). BnCAT13 and BnCAT14 are distributed in two scaffold regions (Bnascaffold0025 and Bnascaffold0025) and have not yet been incorporated into the physical map of chromosomes (Table 1). Detailed information of the 14 BnCAT genes is presented in Table 1. Briefly, gene length ranged from 1990 bp (BnCAT6) to 9770 bp (BnCAT10) with four to five exons in each sequence. Notably, BnCAT5 comprises six exons, and three genes (BnCAT3, BnCAT9, and BnCAT10) consisted of 12 and 15 exons, respectively. The coding DNA sequences (CDS) ranged from 1434 bp (BnCAT13) to 3123 bp (BnCAT10), while the protein length varied from 477 (BnCAT13) to 1040 (BnCAT10) amino acids. The prophesied molecular weights of the 14 BnCAT proteins ranged from 55.19 kDa (BnCAT13) to 565.40 kDa (BnCAT6), and the isoelectric points extended from 6.5 (BnCAT1) to 8.42 (BnCAT5). The subcellular localization outcomes predicted that nine BnCAT proteins were positioned on the peroxisome, while the remaining proteins were located on cytoskeleton (BnCAT1), cytoplasm (BnCAT4), mitochondrion (BnCAT9), and chloroplast (BnCAT5 and BnCAT10) (Table 1). Meanwhile, 4 and 7 CAT genes were also identified from the Brassica oleracea (BoCAT1-BoCAT4) and Brassica rapa (BraCAT1-BraCAT7) genomes, respectively (Table S2).

2.2. Phylogenetic Relationships of CAT Genes

To explore the evolutionary relationships between the BnCAT, BoCAT, BraCAT, and AtCAT genes, an unrooted phylogenetic tree was constructed, which was clustered into four groups (Groups I–IV) (Figure 1). Our results showed that Group I comprised of 7 CAT members (4 BnCATs, 2 BraCATs, and 1 BoCAT); Group II comprised of 4 CAT members (3 BnCATs and 1 BoCAT); Group III comprised of 7 CAT members (2 BnCATs, 2 BraCATs, 1 BoCAT, and 2 AtCATs); and Group IV comprised of 10 CAT members (5 BnCATs, 3 BraCATs, 1 BoCAT, and 1 AtCAT). Notably, the BnCAT genes were distributed in four groups, and Group IV was found to contain more BnCATs than the other three groups (Figure 1). Furthermore, it was found that the BnCATs have a closer phylogenetic relationship with the BoCATs and BraCATs in each group.

2.3. Synteny Analysis of CAT Genes

Tandem and segmental duplication promote new gene family members’ development and plant genome progression. The segmental and tandem duplication actions in the BnCAT gene family were examined to clarify the rapeseed BnCAT gene duplication actions. The chromosomal dispersals of 12 BnCAT genes were evaluated. According to Figure 2, 9 out of the 19 chromosomes possessed BnCAT genes. Briefly, chromosomes A07, A08, and C07 have two BnCAT genes, whereas chromosomes A01, A03, A06, C03, C05, and C08 possessed only one BnCAT gene (Figure 2). Notably, the remaining chromosomes did not contain any BnCAT gene. Regardless of the chromosomes, A01, A07, and C03 have one and two genes, and no tandem repeat paralogous genes were found in these regions. In addition, six paralogous genes were recognized on the A03, A06, A08, C05, C07, and C08 chromosomes (Figure 2). One tandem duplication on chromosome A07, one proximal duplication on chromosome A08, and 6 duplication gene pairs were detected (Figure 2). These outcomes showed that the duplication actions played a crucial role in expanding the BnCAT family genes.
Collinearity analysis discovered robust orthologs of the CAT genes among B. napus and the other three inherited plant species (Figure 3; Table S3). Briefly, in the A subgenome, 4 B. napus genes displayed syntenic associations with 3 AtCATs and 1 BraCAT. On the other hand, in the C subgenome, 3 B. napus genes showed syntenic associations with 2 AtCATs and 1 BoCAT (Figure 3). Notably, several homologous of A. thaliana, B. rapa, and B. oleracea sustained a syntenic association with BnCATs, suggesting that whole-genome duplication played a key role in BnCATs gene family evolution along with segmental repetition (Table S3).
To comprehend the evolutionary constrictions on the BnCAT gene family, the Ka, Ks, and Ka/Ks ratio was assessed for rapeseed. Our findings presented that all the duplicated BnCAT gene pairs had a Ka/Ks ratio of <1 (Table S3), demonstrating that the rapeseed CAT family genes might have faced selective pressure, a discriminating burden, throughout its evolution.

2.4. Analysis of BnCAT Gene Structures and Conserved Motifs

The exon–intron configurations of the BnCAT genes were observed to boost our understanding of the rapeseed CAT family genes’ development. We found that introns of the BnCATs ranged from 6 to 14 (Figure 4A). Groups III and IV contained 6 to 7 introns, Group I includes 7 to 8 introns, whereas Group I had the highest number of introns (11 and 14). Similarly, Groups I, III, and IV contain 4 to 6 exons, while Group I had the highest number of exons (12 and 15). Some of the exons are overlapped with the catalase-domain regions (Table 1; Figure 4A). Briefly, Groups I, III, and IV showed similar intron/exon association patterns, and only Group I had a diverse intron/exon association pattern. These findings specified that members inside a group had remarkably identical gene structures, consistent with their phylogenetic associations.
Moreover, we investigated the full-length protein sequences of 14 BnCATs and 3 AtCATs via MEME software to recognize their conserved motifs. The conserved motif of the CAT genes ranged from 8 to 15. Overall, 8 conserved motifs were identified, and the motif distributions were also similar within the groups (Groups I–IV) (Figure 4B; Table S4). For instance, Groups I, III, and IV contain 8 conserved motifs, except BnCAT13. Moreover, all members of Group II contained 15 conserved motifs (Figure 4B). In conclusion, the group classifications’ consistency was powerfully maintained by analyzing the conserved motifs’ composition, gene structures, and phylogenetic relationships, signifying that the CAT proteins have extremely preserved amino acid remains, and members inside a group may have parallel roles.

2.5. Cis-Elements in Promoters of BnCAT Genes

To recognize the gene functions and regulatory patterns, the cis-elements in the promoters of the BnCAT genes were investigated by searching a 2000 base-pair (bp) region from the transcriptional activation site of each gene against the PlantCARE database. As shown in Figure 5, several cis-regulatory elements were predicted in the BnCAT promoter. The detailed information of the identified elements is presented in Table S5. Overall, five different hormone-correlated responsive elements related to abscisic acid (ABA), auxin, methyl jasmonate (MeJA), gibberellin (GA), and salicylic acid (SA) were identified, suggesting that these genes may respond to phytohormones (Figure 5; Table S5). Most of the hormone-correlated responsive elements are very specific to some genes, as shown in Figure 5. Among them, the ABA-, MeJA-, and GA-responsive elements are widely distributed and commonly present in several genes, highlighting their vital roles in phytohormone responses (Figure 5).
Additionally, four different stress-related responsive elements (drought, low-temperature, anaerobic, and light) were also predicted, indicating that these genes may respond to stress stimulates (Figure 5; Table S5). Moreover, a number of light-responsive elements were observed, suggesting the significant role of BnCATs in response to light stress. Besides, one defense and stress-responsive element were identified in BnCAT1, BnCAT2, BnCAT5, BnCAT8, and BnCAT9 genes (Figure 5; Table S5), demonstrating that these five genes might participate against defense and stress. These hormone and stress-associated elements in the BnCAT promoters suggest that transcript profiling of BnCATs may vary with hormones and abiotic stresses.

2.6. Genome-Wide Analysis of miRNA Targeting BnCAT Genes

Over the past few years, a significant number of investigations have revealed that miRNA-mediated regulation is linked with the stress response in plants. Therefore, to boost our understanding of the miRNAs associated with the regulation of BnCAT genes, we identified 6 putative miRNAs targeting 3 BnCAT genes, as shown in the network diagram (Figure 6). The detailed information of the miRNA targeted sites is presented in Table S6. We found that five members of the bna-miR166 family targeted two genes (BnCAT6 and BnCAT8), and one member of the bna-miR393 family targeted one gene (BnCAT4) (Figure 6; Table S6). Particularly, BnCAT6 and BnCAT8 were predicted to be targeted by five miRNAs (bna-miR166a, bna-miR166b, bna-miR166c, bna-miR166d, and bna-miR166e).

2.7. Functional Annotation Analysis of BnCAT Genes

To further recognize the BnCAT genes’ functions, we performed GO annotation and enrichment analysis based on biological process (BP), molecular function (MF), and cellular component (CC) classes; these terms help us understand the function of genes at a molecular level. The annotation results of BP, MF, and CC exhibited several significantly enriched terms (Table S7). Some of the most enriched terms are highlighted in the subsequent section.
The GO-CC enrichment analysis confirmed that 14 terms are highly enriched, such as peroxisome (GO:0005777), cytoplasmic part (GO:0044444), cellular_component (GO:0005575), organelle (GO:0043226), cytoplasm (GO:0005737), mitochondrion (GO:0005739), and cell (GO:0005623), etc. (Table S7). Some of these terms are consistent with the subcellular localization prediction of the CAT proteins. The GO-MF enrichment results detected 13 highly enriched terms, including catalase activity (GO:0004096), organic cyclic compound binding (GO:0097159), oxidoreductase activity, acting on peroxide as acceptor (GO:0016684), catalytic activity (GO:0003824), antioxidant activity (GO:0016209), and peroxidase activity (GO:0004601), etc. (Table S7). These terms also confirm the function of BnCAT genes in ROS scavenging and antioxidant defense systems. Likewise, the GO-BP results predicted a vast number (33) of significantly enriched terms. The most common and useful terms are a cellular response to stimulus (GO:0051716), ROS metabolic process (GO:0072593), response to stress (GO:0006950), response to ROS (GO:0000302), response to hydrogen peroxide (GO:0042542), and cellular detoxification (GO:1990748), etc. (Table S7). Overall, GO enrichment analysis confirms the functional role of BnCAT genes in several cellular, molecular, and biological processes related to ROS, antioxidant enzymes, and response to stresses.

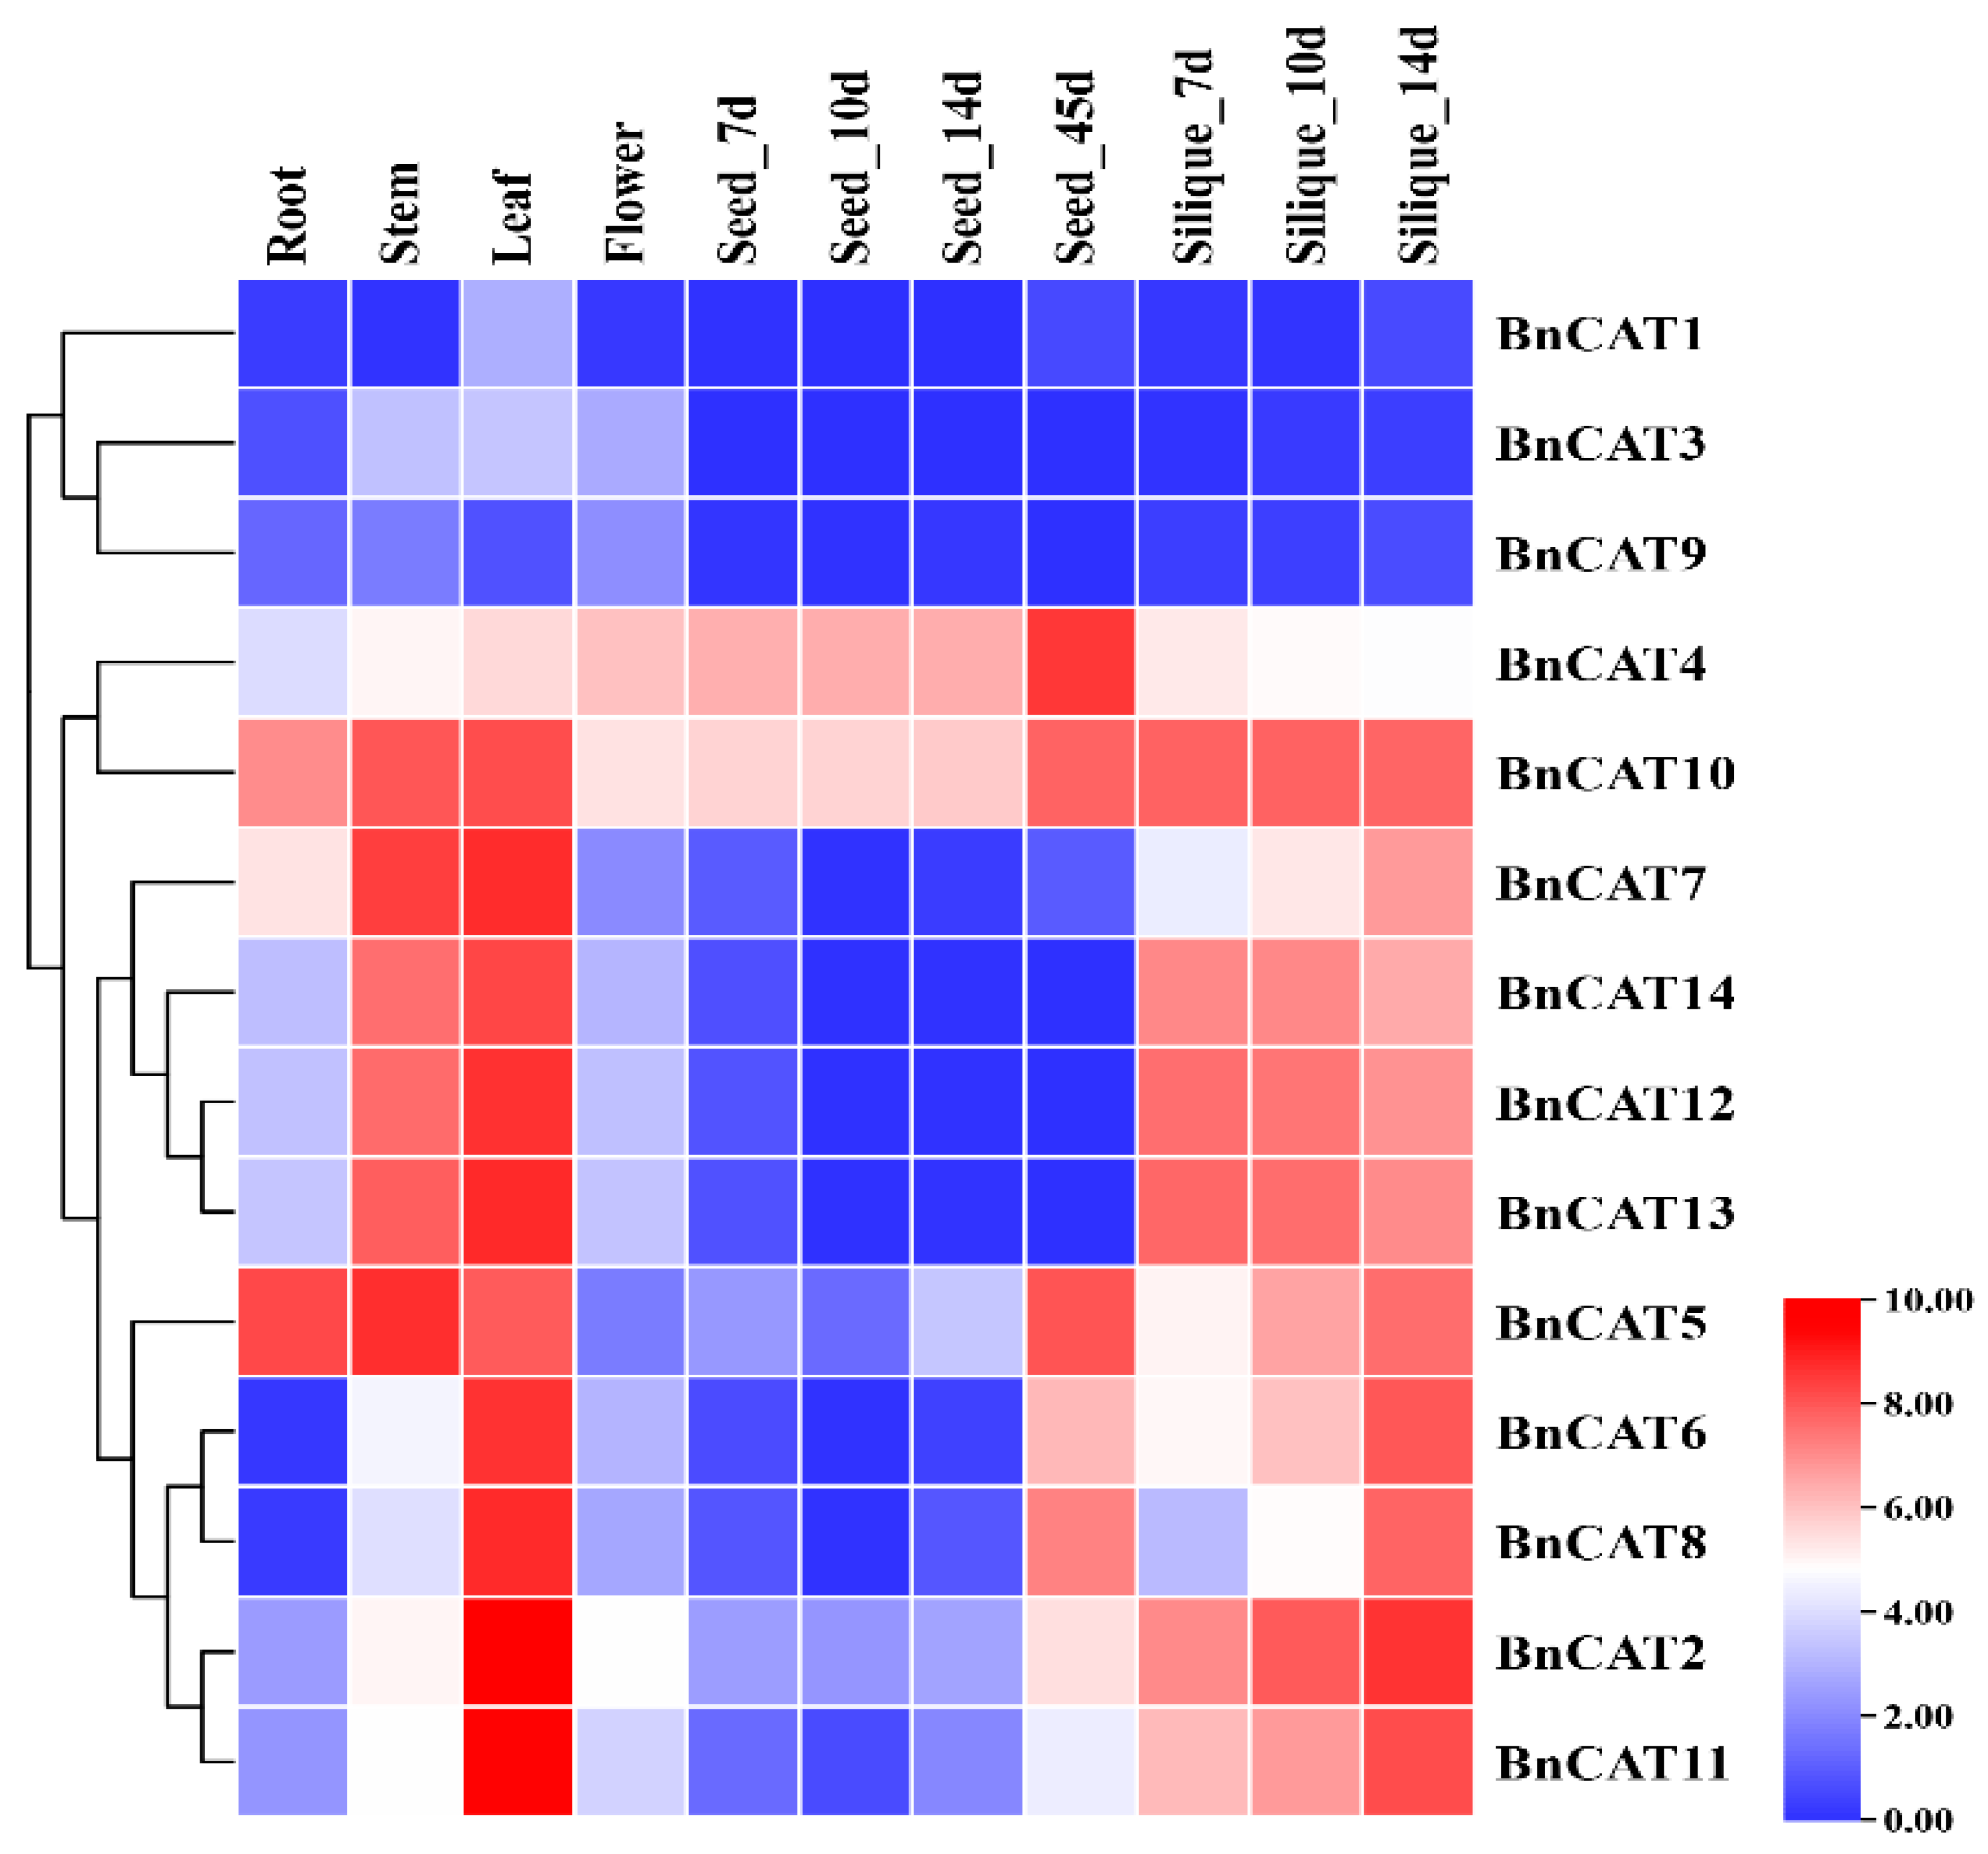
2.8. Expression Profiling of BnCAT Genes in Various Tissues

To illustrate the transcript levels of the BnCAT genes, we examined 11 tissues and organs of rapeseed at various growth phases based on RNA-seq data from rapeseed (ZS11 variety) (BioProject ID PRJCA001495). The expression profiles of the BnCAT genes varied in the various tissues and organs. For instance, the expression patterns of most BnCAT genes in stem, leaf, and silique-5d, silique-7d, silique-10d, and silique-14d were higher than those of other tissues (Figure 7). The expression levels of BnCAT1 (TPM = 0.00–6.44), BnCAT3 (TPM = 0.00–9.91), and BnCAT9 (TPM = 0.01–3.45) were much lower, respectively; in contrast, BnCAT4 (TPM = 14.98–374.72) and BnCAT10 (TPM = 40.89–287.88) were highly expressed in most of the tissues, respectively, suggesting that these candidate genes may play diverse roles in regulating rapeseed growth processes (Figure 7).

2.9. Expression Profiles of BnCAT Genes under Phytohormones and Abiotic Stress Conditions

Under abiotic and phytohormone stress conditions, rapeseed growth and development were affected by physiological, biochemical, and molecular levels. Therefore, qRT-PCR was applied to investigate 14 BnCAT genes’ expression levels at different time points after drought, salinity, cold, waterlogging, ABA, GA, MeJA, and IAA treatments (Figure 8). Under hormone stress conditions, most of the genes showed relatively low expression levels, except for some genes. For instance, BnCAT12 in response to ABA (2.73 and 3.40 fold), GA (3.67 and 3.48 fold), and IAA (8.85 and 6.08 fold), as well as BnCAT13 in response to ABA (2.72 and 3.58 fold), GA (3.24 and 3.04 fold), and IAA (9.47 and 5.61 fold) at 6 and 8 h were significantly upregulated, respectively. Further, BnCAT10 (1.99–2.08 fold) display substantially higher expression at 6 and 8 h under ABA treatment, respectively (Figure 8A). Under GA treatment, BnCAT1 (2.48–3.17 fold) at 4 and 6 h, and BnCAT2 (2.71 fold) at 4 h were expressively upregulated, respectively (Figure 8A). Only BnCAT4 (27.49–34.37 fold) was upregulated after 6 and 8 h of the MeJA treatment, respectively (Figure 8A). However, BnCAT5–BnCAT10 and BnCAT14 genes did not display any significant difference throughout the hormone treatments (Figure 8A).
Meanwhile, a relatively high number of BnCAT genes were upregulated by abiotic stresses compared to hormone treatments concerning their control conditions (Figure 8B). Specifically, BnCAT1–BnCAT3 (1.33–1.41 fold) and BnCAT11–BnCAT13 (1.36–1.97 fold) were upregulated by cold stress at the early or late response, respectively (Figure 8B). Under salinity stress conditions, BnCAT1–BnCAT3 (1.75–2.03 fold), BnCAT11 (1.46–1.84 fold), and BnCAT12 (1.25–2.21 fold) were upregulated at different time points of the treatment, respectively. Likewise, only BnCAT1 (31.95 fold) was induced by drought stress at 2 h, and the other genes were not affected by the drought stress, respectively (Figure 8B). Interestingly, almost all of the genes were significantly upregulated at all time points under waterlogging stress, except BnCAT8–BnCAT10 (0.14–0.87 fold), respectively, which showed relatively low expressions (Figure 8B). Briefly, some genes, such as BnCAT1, BnCAT2, BnCAT3,BnCAT11, BnCAT12, and BnCAT13, showed a similar expression pattern during ABA (0.93–1.33, 0.60–1.15, 0.56–1.47, 0.91–1.34, 0.69–3.40, and 0.75–3.58 fold), GA (1.47–3.17, 1.13–2.70, 0.99–2.14, 0.73–1.45, 1.63–3.67, and 1.55–3.24 fold), IAA (0.98–2.58, 1.30–2.12, 0.85–2.15, 2.76–5.02, 3.72–8.85, and 3.97–9.47 fold), cold (0.97–1.34, 1.12–1.41, 1.09–1.33, 1.16–1.71, 1.44–1.98, and 1.11–1.89 fold), and salinity (1.11–2.30, 1.30–1.75, 1.22–2.11, 1.47–1.84, 0.98–2.21, and 0.77–1.70 fold) treatments, respectively (Figure 8). The above outcomes suggest that these genes may be crucial for enlightening resistance to multiple stresses, especially waterlogging stress.

3. Discussion

3.1. Characterization of CAT Gene Family in Rapeseed

Rapeseed is an allotetraploid type that practiced extensive genome doubling and integration procedures [40]. In the current study, we recognized 14 BnCAT genes via genome-wide analysis that surpasses the 4 BoCATs and 7 BraCATs (Table 1; Table S2). Generally, the CAT gene family of plants usually consists of a small number of genes. Each CAT member in A. thaliana was naturally homologous to 2–3 genes in the rapeseed genome. These results are supported by the previous discovery that 1 A. thaliana gene paralleled to 2 or >2 homologous genes in rapeseed [41]. According to the phylogenetic investigation, 14 BnCATs were classified into four groups. CAT genes from A. thaliana were classified into the Group III and Group IV together with some BnCATs genes, BoCATs, and BraCATs (Figure 1), signifying comparable evolutionary lines among B. napus, B. oleracea, B. rapa, and A. thaliana. These alliances in the phylogenetic tree was further confirmed by the gene structure analysis (Figure 4). The locations and numbers of introns of the CAT genes were found to be extremely conserved between 13 angiosperm plants (monocots and dicots). This result suggests that one ancestral duplicate of the CAT gene, comprising seven introns, have gone over numerous rounds of intron loss and gain throughout evolution [42]. Moreover, the motif patterns were also comparable within the group classification (Figure 4B). Notably, Group II contains diverse motif patterns, suggesting that BnCATs possess exceptionally conserved protein structures (Figure 4B). These results are in agreement with previous findings of cotton, where genes within the same group contain diverse gene structures and motifs patterns [18].

3.2. The Critical Role of CAT Genes in ROS Metabolism, Hormone, and Abiotic Stress Responses

Catalase, a robust enzyme that facilitates the ROS-scavenging procedure, serves as a crucial player in plant growth, development, and abiotic stress response [2,3]. To date, it has been extensively studied in several plant species against various stresses, such as A. thaliana [43,44,45,46,47], rice [48,49,50], wheat [51,52,53], sugarcane [21,54,55], cucumber [16,56,57], cotton [18,58,59], and sweet potato [20,60,61].
Under drought and salinity stress, the AtCAT1 transcript level was triggered by a MAPK kinase (AtMEK1), which was associated with ROS generation (mainly H2O2) [62]. The transcription factor WRKY75 suppressed the expression level of AtCAT2 to improve the ROS accretion, leading to leaf senescence in A. thaliana [63]. In another study, the transcript level of AtCAT2 was repressed to activate endogenous ROS generation under lead toxicity [64]. Further, Due et al. [14] discovered that AtCAT1 played a significant role in eliminating abiotic stress-persuaded H2O2, whereas AtCAT2 and AtCAT3 ensured H2O2 scavenging under light and dark conditions, respectively. Additionally, AtCAT3 was phosphorylated through a calcium-associated protein kinase to intercede H2O2 homeostasis inside the peroxisomes of guard cells under drought conditions, and the over-expression of AtCAT3 improved the drought resistance in A. thaliana [43].
In rice, three CAT genes (OsCatA, OsCatB, and OsCatC) were triggered under different stress conditions; further, these genes were also involved in ROS homeostasis, root evolution stimulation, and photorespiration [15]. The over-expression of OsCatA and OsCatC improved the drought tolerance in transgenic rice [15]. In another study, Vighi et al. [65] reported that OsCatA and OsCatB were strongly induced by high salinity and cold stress in a tolerant genotype compared with that in a sensitive genotype. In cucumber, the expression level of CsCAT1 was triggered by ABA treatment, whereas CsCAT2 was repressed under drought stress and CsCAT3 upregulated after salinity, drought, and ABA treatment [16]. In sugarcane, the expression pattern of ScCAT1 was induced in response to oxidative, salinity, heavy metal, and drought stresses [55]. In sweet potato, the transcript level of IbCAT2 was stimulated under drought and salinity conditions, and the over-expression of this gene increases the tolerance to both stresses in Saccharomyces cerevisiae and E. coli [20].
In this study, BnCAT1, BnCAT2, BnCAT3, BnCAT12, and BnCAT13 were mainly induced by ABA, GA, IAA, cold, and salinity. Interestingly, almost all identified genes were strongly influenced by waterlogging treatment, except BnCAT8–BnCAT10, which showed relatively low expressions throughout the stress; this indicates that these genes play a major role in waterlogging stress tolerance in rapeseed. Overall, these findings suggest that CAT genes play a significant part in activating ROS metabolism and respond to numerous abiotic cues (Figure 8). These results were also confirmed by the GO enrichment analysis, where most of the GO terms were found to be associated with ROS metabolism and abiotic stresses (Table S4). In future work, stress-related CAT genes can be used for functional validation in rapeseed to get further insight into their actual stress tolerance mechanisms.

3.3. Expression Pattern of CAT Genes in Various Tissues

The expression patterns of the CAT genes in different tissues have been described for numerous plant species. For example, in rice, OsCATA displayed a relatively higher expression level at all the developmental phases; OsCATC presented a nearly comparable expression pattern as OsCATA, apart from the flowering phase. OsCATD sustained a low constitutive expression level during the complete growth life cycle of rice [17]. In cotton, GhCAT1–GhCAT4 significantly showed higher expression in almost all the growth and developmental stages (root, stem, leaf, petal, calycle, torus, stamen, pistil, and fiber development), suggesting that the CAT gene family is possibly associated with the growth and development of various tissues in cotton [18]. In cucumber, CsCAT1 and CsCAT2 showed higher transcript levels in leaves and considerable expression in fruit and roots, whereas CsCAT2 showed a stronger transcript pattern in fruits, flowers, stem, and leaves [16]. In the current study, the results showed that many genes showed higher transcript levels in the root, stem, leaf, and silique (Figure 7). Only BnCAT4 (TPM = 82.23–374.72) and BnCAT10 (TPM = 49.85–219.51) exhibited higher expression throughout the seed expansion stages. The expression levels of 3 genes (BnCAT1 (TPM = 0.00–6.44), BnCAT3 (TPM = 0.00–9.91), and BnCAT9 (TPM = 0.01–3.45) in all the tissues were almost undetectable in rapeseed, indicating that these genes might do not play any role in rapeseed growth and development (Figure 7).

3.4. miRNA: Key Players in the Regulation of Stress Responses

MicroRNAs (miRNAs), a group of single-stranded, non-coding micro RNAs, have been revealed to be involved in post-transcriptional gene regulation [30,66]. During the past few years, numerous miRNAs have been identified via genome-wide analysis in rapeseed that responds to different environmental stresses [67,68,69,70,71,72,73].
The current study recognized five members of the bna-miR166 family and one member of the bna-miR393 family targeting three CAT genes (BnCAT4, BnCAT6, and BnCAT8) (Figure 6). miR166 has been reported to be significantly upregulated in response to UV-B radiation in maize [74]; in cassava under cold and drought stresses conditions [75]; and in Chinese cabbage under heat stress conditions [75]. Likewise, miR393 has also been reported to be strongly linked with stress responses, such as drought and salinity in French bean (Phaseolus vulgaris) [76], cold stress in tea plant (Camellia sinensis) [77], and nitrogen deficiency in maize [78]. Some of these miRNAs have also been reported in rapeseed, playing a significant role in rapeseed genetic improvement [67,68,69,70,71,72,73]. These studies suggest that these bna-miRNAs might play decisive roles against numerous stresses by modifying the transcript level of the CAT genes in rapeseed.

4. Materials and Methods

4.1. Identification of CAT Family Genes

In this work, two approaches were used to identify the CAT genes in rapeseed. Firstly, the rapeseed genome (ZS11 genotype) sequence was downloaded from the BnPIR database (http://cbi.hzau.edu.cn/bnapus/index.php, accessed on 10 February 2021), and a local rapeseed dataset was used by software blast-2.7.1+ (ftp://ftp.ncbi.nlm.nih.gov/blast/executables/blast+/2.7.1/, accessed on 10 February 2021). The amino acid sequences of 3 A. thaliana CAT family genes (AtCAT1/At1g20630, AtCAT2/At4g35090, and AtCAT3/At1g20620) were obtained from the TAIR Arabidopsis genome database (http://www.arabidopsis.org/, accessed on 10 February 2021). These sequences were used as a reference to identify the CAT genes in the local rapeseed database.
Secondly, the HMMER 3.1 (http://www.hmmer.org/, accessed on 10 February 2021) and BLASTP with the threshold e-value set to 1e−5 were performed using the Hidden Markov Model (HMM V 3.0) profiles of the catalase (PF00199) and the catalase-related immune-responsive domain (PF06628) were downloaded from the Pfam protein database (http://pfam.xfam.org/, accessed on 10 February 2021) and used as the inquiry. The default limitation of HMMER 3.1 was set to 0.01. We combined all hits based on HMMER and BLASTP results and omitted redundant hits with a similar scaffold or chromosome location due to the rapeseed genome’s complexity. The remaining CAT sequences were scrutinized for a catalase-related immune-responsive domain (PF06628) by the Pfam server to confirm that all the identified genes belonged to the CAT gene family. Finally, 14 BnCAT genes were identified in the rapeseed genome. The genomic and protein sequences of all the identified BnCAT genes were obtained from the BnPIR rapeseed database. Moreover, to disclose the CAT genes’ evolutionary association in different plant species, the protein sequences of the Brassica rapa and Brassica oleracea CATs were downloaded from the JGI Phytozome 12.0 (https://phytozome.jgi.doe.gov/pz/portal.html, accessed on 10 February 2021) database via the same method as described above.

4.2. Characterization of CAT Family Genes

The physical and chemical properties, such as the number of amino acids in a sequence, molecular weight (MW), and isoelectric points (pI), were measured using the PROTPARAM tool on the ExPASy website (http://web.expasy.org/protparam/, accessed on 10 February 2021). The subcellular localization of BnCAT proteins was predicted using the WoLF PSORT server (https://wolfpsort.hgc.jp/, accessed on 10 February 2021). The structure of the BnCAT genes was predicted and constructed via TBtools software (V 1.068; https://github.com/CJ-Chen/TBtools, accessed on 10 February 2021). Potentially conserved motifs were identified using MEME (V 4.11.4) by analyzing the sequences of 13 BnCAT proteins.

4.3. Phylogenetic Tree and Synteny Analysis of BnCAT Family Proteins

To observe the evolutionary past of the rapeseed CAT gene family, we used Brassica napus, Brassica oleracea, Brassica rapa, and A. thaliana protein sequences to create a phylogenetic tree. The protein sequences were multiple-aligned using MEGA X (V 6.06) software. The tree was constructed based on the neighbor-joining (NJ) method with 1000 bootstrap replicates. For better visualization, the tree was observed and modified via the online website Evolview v3 (https://www.evolgenius.info/evolview, accessed on 10 February 2021). Synteny relationships of CAT genes from Brassica napus, Brassica oleracea, Brassica rapa, and Arabidopsis thaliana were developed from JCVI (https://github.com/tanghaibao/jcvi, accessed on 10 February 2021). To investigate the evolutionary constrictions of each CAT gene pairs, the synonymous (Ks), non-synonymous (Ka) substitution, and Ka/Ks ratios were calculated using KaKs_Calculator 2.0 (https://sourceforge.net/projects/kakscalculator2/, accessed on 10 February 2021).

4.4. Cis-Elements Analysis in the BnCAT Gene Promoters

To classify the putative cis-elements, the 2000 base pairs (bp) upstream of the start codons were downloaded from the rapeseed genome database (BnPIR) for promoter analysis. Then, each promotor’s cis-elements were prophesied using the PlantCARE webtool (http://bioinformatics.psb.ugent.be/webtools/plantcare/html/, accessed on 10 February 2021) and were presented using TBtools (V 1.068).

4.5. Prediction of Putative miRNA Targeting BnCAT Genes and Functional Annotation Analysis

The gene sequences of the BnCATs were acquiesced as the candidate genes to identify possible miRNAs via observing against the existing rapeseed reference of miRNA sequences via the psRNATarget database (http://plantgrn.noble.org/psRNATarget/, accessed on 10 February 2021) with default parameters. Cytoscape (V3.8.2, https://cytoscape.org/download.html, accessed on 10 February 2021) software was used to create the interaction network between the prophesied miRNAs and the equivalent target BnCAT genes.
To predict the functional annotation of BnCAT genes, we performed the gene ontology (GO) annotation analysis by submitting all BnCAT gene sequences to the eggNOG database (http://eggnog-mapper.embl.de/, accessed on 10 February 2021). Then, the GO annotation data was handled in TBtools for GO enrichment analysis.

4.6. Expression Analysis of BnCAT Genes in Different Tissues

The temporal and spatial expression patterns of the candidate BnCAT gene family were evaluated using the RNA-seq data (BioProject ID: PRJCA001495). We examined the total RNA-seq data of the root, stem, leaf, flower, seed, and siliques at the germination stages of the rapeseed variety “ZS11”. Raw reads were quality controlled and filtered by software fastp (https://github.com/OpenGene/fastp, accessed on 10 February 2021), and then mapped to the reference genome with software HISAT2 (https://github.com/infphilo/hisat2, accessed on 10 February 2021). Sequence alignment map (SAM) files were converted to binary alignment map (BAM) and sorted with software Samtools (http://www.htslib.org/, accessed on 10 February 2021). Cuffquant and Cuffnorm were used to generate normalized counts in transcripts per million (TPM) values. Based on TPM values, the expression heat map was created using GraphPad Prism 9.0.0 software (https://www.graphpad.com/, accessed on 10 February 2021).

4.7. Plant Material and Stress Conditions

In this study, the rapeseed genotype “ZS11”, a typical cultivated variety, was used for stress treatments. The seeds of ZS11 genotype was furnished by OCRI, CAAS, China. Before stress treatments, some seeds were randomly selected from the same batch of seeds to determine the germination rate. The seeds with a 100% germination rate were considered vigorous seeds. The vigorous seeds were carefully chosen and sterilized with 10% hypochlorous acid solution for 5 min. The seeds were grown on water-saturated filter paper in a chamber (25 °C day/night and 16h/8h light/dark cycle) until the radicle’s extent reached about 5 mm. For stress treatment, germinated seeds were exposed to 150 mM NaCl solution for salinity stress, 15% PEG6000 solution for drought stress, and 4 °C for cold stress on water-saturated filter paper. To analyze the effect of different phytohormones, the germinated seeds were cultivated in Murashige and Skoog (MS) medium provided with 100 μM abscisic acid (ABA), 100 μM gibberellic acid (GA), 100 μM methyl jasmonate (MeJA), and 100 μM indole-acetic acid/auxin (IAA). The samples were collected at 0 (CK), 2, 4, 6, and 8 h after the treatments. Three biological replications were carried out for all the treatments. All the samples were instantly frozen in liquid nitrogen and were stored at −80 °C for the next analysis.

4.8. RNA Extraction and qRT-PCR Analysis

Total RNA was extracted using TransZol Up Plus RNA Kit (TransGen Biotech, Beijing, China) according to the manufacturer’s instructions and was then quantified with a Nanodrop ND-1000 spectrophotometer (Thermo Fisher Scientific, Worcester, MA, USA). RNA was purified using TransScript One-Step gDNA Removal. The first-strand of complementary DNA (cDNA) was synthesized using a cDNA Synthesis SuperMix kit (TransGen Biotech, China), and the cDNA solution was then diluted (20x) with distilled deionized water. The quantitative real-time polymerase chain reaction (qRT-PCR) was carried out with an ABI StepOne real-time fluorescence quantitative PCR instrument (Applied Biosystems, Foster City, CA, USA) using SYBR® Green Supermix (Bio-Rad). The BnACTIN was used as an internal control. The qRT-PCR reaction was performed as follows: 94 °C for 10 min, followed by 40 cycles of 94 °C for 15 s, 60 °C for 30 s, and 72 °C for 10 s. Each qRT-PCR reaction was carried out with three biological triplicates, and the data were examined using the2−ΔΔCT method as described by Wang et al. [79]. All the primers used in this experiment are listed in Table S1. The heat map was created using GraphPad Prism 9.0.0 software.

5. Conclusions

This study conducted a genome-wide comprehensive study of the CAT gene family in rapeseed and identified 14 BnCAT genes, which were clustered into four groups (Group I–Group IV). To get further insights, gene structure, conserved motifs, cis-elements, GO annotation, and miRNA prediction analysis have also been performed. Additionally, several genes’ expression levels were highly expressed in the root, leaf, stem, silique, and late stages of seed development. Likewise, several genes were mainly upregulated in response to the ABA, GA, IAA, cold, drought, and waterlogging treatments. Some of the genes are expressed at specific tissues and stress conditions. Briefly, the wide-ranging information collected in the current study can be exploited for future functional analysis of the BnCAT genes regarding rapeseed growth, development, response to hormones, and abiotic stresses.

Supplementary Materials

The following are available online at https://0-www-mdpi-com.brum.beds.ac.uk/article/10.3390/ijms22084281/s1, Table S1: The information of primer used in this study for gene expression analysis in qRT-PCR, Table S2: The CAT family genes in Arabidopsis thaliana, Brassica oleracea, and Brassica rapa, Table S3: The information of gene duplication type, Ka, Ks, and Ka/Ks ratio values of B. napus and other three plant species, Table S4: The information of identified 8 motifs in BnCAT proteins, Table S5: Information of hormone- and stress-related cis-elements detected in the promoters regions of BnCATs, Table S6: The information of miRNA targeted BnCAT genes, Table S7: The GO enrichment analysis of 14 BnCAT genes.

Author Contributions

Conceptualization, A.R. and W.S.; methodology, A.R. and W.S.; software, A.R. and W.S.; formal analysis, A.R., W.S., A.G., M.A.H., S.S.M., and W.N.; writing—original draft preparation, A.R., W.S., A.G., M.A.H., S.S.M., and W.N.; writing—review and editing, A.R., W.S., Y.L., and X.Z. (Xiling Zou); supervision, X.Z. (Xuekun Zhang), L.Y., and X.Z. (Xiling Zou); funding acquisition, Y.L. and X.Z (Xiling Zou). All authors have read and agreed to the published version of the manuscript.

Funding

This work was supported by the Science and Technology Innovation Project of the Chinese Academy of Agricultural Sciences.

Institutional Review Board Statement

Not applicable.

Informed Consent Statement

Not applicable.

Data Availability Statement

The datasets used and/or analyzed during the current study are available from the corresponding author on reasonable request. However, most of the data is shown in Supplementary files.

Acknowledgments

The authors are grateful to all lab members for their useful suggestions, support, and encouragement.

Conflicts of Interest

The authors declare no conflict of interest.

References

  1. Raza, A.; Razzaq, A.; Mehmood, S.S.; Zou, X.; Zhang, X.; Lv, Y.; Xu, J. Impact of climate change on crops adaptation and strategies to tackle its outcome: A review. Plants 2019, 8, 34. [Google Scholar] [CrossRef] [Green Version]
  2. Hasanuzzaman, M.; Bhuyan, M.; Zulfiqar, F.; Raza, A.; Mohsin, S.M.; Mahmud, J.A.; Fujita, M.; Fotopoulos, V. Reactive Oxygen Species and Antioxidant Defense in Plants under Abiotic Stress: Revisiting the Crucial Role of a Universal Defense Regulator. Antioxidants 2020, 9, 681. [Google Scholar] [CrossRef] [PubMed]
  3. Mittler, R. ROS are good. Trends Plant. Sci. 2017, 22, 11–19. [Google Scholar] [CrossRef] [Green Version]
  4. Mhamdi, A.; Queval, G.; Chaouch, S.; Vanderauwera, S.; Van Breusegem, F.; Noctor, G. Catalase function in plants: A focus on Arabidopsis mutants as stress-mimic models. J. Exp. Bot. 2010, 61, 4197–4220. [Google Scholar] [CrossRef] [Green Version]
  5. Anjum, N.A.; Sharma, P.; Gill, S.S.; Hasanuzzaman, M.; Khan, E.A.; Kachhap, K.; Mohamed, A.A.; Thangavel, P.; Devi, G.D.; Vasudhevan, P. Catalase and ascorbate peroxidase—Representative H2O2-detoxifying heme enzymes in plants. Environ. Sci. Pollut. Res. 2016, 23, 19002–19029. [Google Scholar] [CrossRef] [PubMed]
  6. Kaushal, J.; Mehandia, S.; Singh, G.; Raina, A.; Arya, S.K. Catalase enzyme: Application in bioremediation and food industry. Biocatal. Agric. Biotechnol. 2018, 16, 192–199. [Google Scholar] [CrossRef]
  7. GONZÁLEZ, E. The C-terminal domain of plant catalases Implications for a glyoxysomal targeting sequence. Eur. J. Biochem. 1991, 199, 211–215. [Google Scholar] [CrossRef] [PubMed]
  8. Drory, A.; Woodson, W.R. Molecular cloning and nucleotide sequence of a cDNA encoding catalase from tomato. Plant Physiol. 1992, 100, 1605. [Google Scholar] [CrossRef] [Green Version]
  9. Chen, H.-J.; Wu, S.-D.; Huang, G.-J.; Shen, C.-Y.; Afiyanti, M.; Li, W.-J.; Lin, Y.-H. Expression of a cloned sweet potato catalase SPCAT1 alleviates ethephon-mediated leaf senescence and H2O2 elevation. J. Plant Physiol. 2012, 169, 86–97. [Google Scholar] [CrossRef] [PubMed]
  10. Skadsen, R.W.; Schulze-Lefert, P.; Herbst, J.M. Molecular cloning, characterization and expression analysis of two catalase isozyme genes in barley. Plant Mol. Biol. 1995, 29, 1005–1014. [Google Scholar] [CrossRef]
  11. Willekens, H.; Villarroel, R.; Van Montagu, M.; Inzé, D.; Van Camp, W. Molecular identification of catalases from Nicotiana plumbaginifolia (L.). FEBS Lett. 1994, 352, 79–83. [Google Scholar] [CrossRef] [Green Version]
  12. Guan, L.; Scandalios, J.G. Developmentally related responses of maize catalase genes to salicylic acid. Proc. Nat. Acad. Sci. USA 1995, 92, 5930–5934. [Google Scholar] [CrossRef] [PubMed] [Green Version]
  13. Esaka, M.; Yamada, N.; Kitabayashi, M.; Setoguchi, Y.; Tsugeki, R.; Kondo, M.; Nishimura, M. cDNA cloning and differential gene expression of three catalases in pumpkin. Plant Mol. Biol. 1997, 33, 141–155. [Google Scholar] [CrossRef] [PubMed]
  14. Du, Y.Y.; Wang, P.C.; Chen, J.; Song, C.P. Comprehensive functional analysis of the catalase gene family in Arabidopsis thaliana. J. Integr. Plant Biol. 2008, 50, 1318–1326. [Google Scholar] [CrossRef] [PubMed]
  15. Joo, J.; Lee, Y.H.; Song, S.I. Rice CatA, CatB, and CatC are involved in environmental stress response, root growth, and photorespiration, respectively. J. Plant Biol. 2014, 57, 375–382. [Google Scholar] [CrossRef]
  16. Hu, L.; Yang, Y.; Jiang, L.; Liu, S. The catalase gene family in cucumber: Genome-wide identification and organization. Genet. Mol. Biol. 2016, 39, 408–415. [Google Scholar] [CrossRef] [PubMed] [Green Version]
  17. Alam, N.B.; Ghosh, A. Comprehensive analysis and transcript profiling of Arabidopsis thaliana and Oryza sativa catalase gene family suggests their specific roles in development and stress responses. Plant Physiol. Biochem. 2018, 123, 54–64. [Google Scholar] [CrossRef]
  18. Wang, W.; Cheng, Y.; Chen, D.; Liu, D.; Hu, M.; Dong, J.; Zhang, X.; Song, L.; Shen, F. The catalase gene family in cotton: Genome-wide characterization and bioinformatics analysis. Cells 2019, 8, 86. [Google Scholar] [CrossRef] [Green Version]
  19. Inaba, J.-I.; Kim, B.M.; Shimura, H.; Masuta, C. Virus-induced necrosis is a consequence of direct protein-protein interaction between a viral RNA-silencing suppressor and a host catalase. Plant Physiol. 2011, 156, 2026–2036. [Google Scholar] [CrossRef] [Green Version]
  20. Yong, B.; Wang, X.; Xu, P.; Zheng, H.; Fei, X.; Hong, Z.; Ma, Q.; Miao, Y.; Yuan, X.; Jiang, Y.; et al. Isolation and abiotic stress resistance analyses of a catalase gene from Ipomoea batatas (L.) Lam. BioMed Res. Inter. 2017, 2017. [Google Scholar] [CrossRef] [PubMed] [Green Version]
  21. Su, Y.; Guo, J.; Ling, H.; Chen, S.; Wang, S.; Xu, L.; Allan, A.C.; Que, Y. Isolation of a novel peroxisomal catalase gene from sugarcane, which is responsive to biotic and abiotic stresses. PLoS ONE 2014, 9, e84426. [Google Scholar] [CrossRef]
  22. Balestrasse, K.B.; Yannarelli, G.G.; Noriega, G.O.; Batlle, A.; Tomaro, M.L. Heme oxygenase and catalase gene expression in nodules and roots of soybean plants subjected to cadmium stress. Biometals 2008, 21, 433–441. [Google Scholar] [CrossRef]
  23. Lin, K.-H.; Huang, H.-C.; Lin, C.-Y. Cloning, expression and physiological analysis of broccoli catalase gene and Chinese cabbage ascorbate peroxidase gene under heat stress. Plant Cell Rep. 2010, 29, 575–593. [Google Scholar] [CrossRef] [PubMed]
  24. Queval, G.; Issakidis-Bourguet, E.; Hoeberichts, F.A.; Vandorpe, M.; Gakière, B.; Vanacker, H.; Miginiac-Maslow, M.; Van Breusegem, F.; Noctor, G. Conditional oxidative stress responses in the Arabidopsis photorespiratory mutant cat2 demonstrate that redox state is a key modulator of daylength-dependent gene expression, and define photoperiod as a crucial factor in the regulation of H2O2-induced cell death. Plant J. 2007, 52, 640–657. [Google Scholar]
  25. Contento, A.L.; Bassham, D.C. Increase in catalase-3 activity as a response to use of alternative catabolic substrates during sucrose starvation. Plant Physiol. Biochem. 2010, 48, 232–238. [Google Scholar] [CrossRef] [PubMed]
  26. Polidoros, A.; Mylona, P.; Scandalios, J. Transgenic tobacco plants expressing the maize Cat2 gene have altered catalase levels that affect plant-pathogen interactions and resistance to oxidative stress. Trans. Res. 2001, 10, 555–569. [Google Scholar] [CrossRef] [PubMed]
  27. Lee, S.H.; An, C.S. Differential expression of three catalase genes in hot pepper (Capsicum annuum L.). Mol. Cells 2005, 20, 247–255. [Google Scholar]
  28. Niewiadomska, E.; Polzien, L.; Desel, C.; Rozpadek, P.; Miszalski, Z.; Krupinska, K. Spatial patterns of senescence and development-dependent distribution of reactive oxygen species in tobacco (Nicotiana tabacum) leaves. J. Plant Physiol. 2009, 166, 1057–1068. [Google Scholar] [CrossRef] [PubMed]
  29. Vuosku, J.; Sutela, S.; Kestilä, J.; Jokela, A.; Sarjala, T.; Häggman, H. Expression of catalase and retinoblastoma-related protein genes associates with cell death processes in Scots pine zygotic embryogenesis. BMC Plant Biol. 2015, 15, 88. [Google Scholar] [CrossRef] [Green Version]
  30. Cui, C.; Wang, J.-J.; Zhao, J.-H.; Fang, Y.-Y.; He, X.-F.; Guo, H.-S.; Duan, C.-G. A Brassica miRNA Regulates Plant Growth and Immunity through Distinct Modes of Action. Mol. Plant 2020, 13, 231–245. [Google Scholar] [CrossRef]
  31. Khandal, H.; Parween, S.; Roy, R.; Meena, M.K.; Chattopadhyay, D. MicroRNA profiling provides insights into post-transcriptional regulation of gene expression in chickpea root apex under salinity and water deficiency. Sci. Rep. 2017, 7, 1–14. [Google Scholar] [CrossRef] [Green Version]
  32. Ding, Y.; Ding, L.; Xia, Y.; Wang, F.; Zhu, C. Emerging roles of microRNAs in plant heavy metal tolerance and homeostasis. J. Agric. Food Chem. 2020, 68, 1958–1965. [Google Scholar] [CrossRef] [PubMed]
  33. Ravichandran, S.; Ragupathy, R.; Edwards, T.; Domaratzki, M.; Cloutier, S. MicroRNA-guided regulation of heat stress response in wheat. BMC Genom. 2019, 20, 488. [Google Scholar] [CrossRef] [Green Version]
  34. Park, S.-Y.; Grabau, E. Bypassing miRNA-mediated gene regulation under drought stress: Alternative splicing affects CSD1 gene expression. Plant Mol. Biol. 2017, 95, 243–252. [Google Scholar] [CrossRef]
  35. SHI, G.-q.; FU, J.-y.; RONG, L.-j.; ZHANG, P.-y.; GUO, C.-j.; Kai, X. TaMIR1119, a miRNA family member of wheat (Triticum aestivum), is essential in the regulation of plant drought tolerance. J. Integr. Agric. 2018, 17, 2369–2378. [Google Scholar] [CrossRef] [Green Version]
  36. Ci, D.; Song, Y.; Tian, M.; Zhang, D. Methylation of miRNA genes in the response to temperature stress in Populus simonii. Front. Plant Sci. 2015, 6, 921. [Google Scholar] [CrossRef] [Green Version]
  37. Raza, A. Eco-physiological and Biochemical Responses of Rapeseed (Brassica napus L.) to Abiotic Stresses: Consequences and Mitigation Strategies. J. Plant Growth Regul. 2020. [Google Scholar] [CrossRef]
  38. Raza, A.; Hafeez, M.B.; Zahra, N.; Shaukat, K.; Umbreen, S.; Tabassum, J.; Charagh, S.; Khan, R.S.A.; Hasanuzzaman, M. The Plant Family Brassicaceae: Introduction, Biology, and Importance. In The Plant Family Brassicaceae; Hasanuzzaman, M., Ed.; Springer: Singapore, 2020; pp. 1–43. [Google Scholar]
  39. He, H.; Lei, Y.; Yi, Z.; Raza, A.; Zeng, L.; Yan, L.; Xiaoyu, D.; Yong, C.; Xiling, Z. Study on the mechanism of exogenous serotonin improving cold tolerance of rapeseed (Brassica napus L.) seedlings. Plant Growth Regul. 2021. [Google Scholar] [CrossRef]
  40. Song, J.-M.; Guan, Z.; Hu, J.; Guo, C.; Yang, Z.; Wang, S.; Liu, D.; Wang, B.; Lu, S.; Zhou, R.; et al. Eight high-quality genomes reveal pan-genome architecture and ecotype differentiation of Brassica napus. Nat. Plants 2020, 6, 34–45. [Google Scholar] [CrossRef] [PubMed]
  41. Cavell, A.C.; Lydiate, D.; Parkin, I.; Dean, C.; Trick, M. Collinearity between a 30-centimorgan segment of Arabidopsis thaliana chromosome 4 and duplicated regions within the Brassica napus genome. Genome 1998, 41, 62–69. [Google Scholar] [CrossRef] [PubMed] [Green Version]
  42. Frugoli, J.A.; McPeek, M.A.; Thomas, T.L.; McClung, C.R. Intron loss and gain during evolution of the catalase gene family in angiosperms. Genetics 1998, 149, 355–365. [Google Scholar] [CrossRef] [PubMed]
  43. Zou, J.-J.; Li, X.-D.; Ratnasekera, D.; Wang, C.; Liu, W.-X.; Song, L.-F.; Zhang, W.-Z.; Wu, W.-H. Arabidopsis CALCIUM-DEPENDENT PROTEIN KINASE8 and CATALASE3 function in abscisic acid-mediated signaling and H2O2 homeostasis in stomatal guard cells under drought stress. Plant Cell 2015, 27, 1445–1460. [Google Scholar] [CrossRef] [Green Version]
  44. Hackenberg, T.; Juul, T.; Auzina, A.; Gwiżdż, S.; Małolepszy, A.; Van Der Kelen, K.; Dam, S.; Bressendorff, S.; Lorentzen, A.; Roepstorff, P. Catalase and NO CATALASE ACTIVITY1 promote autophagy-dependent cell death in Arabidopsis. Plant Cell 2013, 25, 4616–4626. [Google Scholar] [CrossRef] [Green Version]
  45. Corpas, F.J.; Barroso, J.B.; González-Gordo, S.; Muñoz-Vargas, M.A.; Palma, J.M. Hydrogen sulfide: A novel component in Arabidopsis peroxisomes which triggers catalase inhibition. J. Integr. Plant Biol. 2019, 61, 871–883. [Google Scholar] [CrossRef] [Green Version]
  46. Li, J.; Liu, J.; Wang, G.; Cha, J.-Y.; Li, G.; Chen, S.; Li, Z.; Guo, J.; Zhang, C.; Yang, Y. A chaperone function of NO CATALASE ACTIVITY1 is required to maintain catalase activity and for multiple stress responses in Arabidopsis. Plant Cell 2015, 27, 908–925. [Google Scholar] [CrossRef] [Green Version]
  47. Chiang, C.-M.; Chen, S.-P.; Chen, L.-F.O.; Chiang, M.-C.; Chien, H.-L.; Lin, K.-H. Expression of the broccoli catalase gene (BoCAT) enhances heat tolerance in transgenic Arabidopsis. J. Plant Biochem. Biotechnol. 2014, 23, 266–277. [Google Scholar] [CrossRef]
  48. Zhou, Y.-B.; Liu, C.; Tang, D.-Y.; Yan, L.; Wang, D.; Yang, Y.-Z.; Gui, J.-S.; Zhao, X.-Y.; Li, L.-G.; Tang, X.-D.; et al. The receptor-like cytoplasmic kinase STRK1 phosphorylates and activates CatC, thereby regulating H2O2 homeostasis and improving salt tolerance in rice. Plant Cell 2018, 30, 1100–1118. [Google Scholar] [CrossRef] [PubMed] [Green Version]
  49. Liu, J.; Cui, L.; Xie, Z.; Zhang, Z.; Liu, E.; Peng, X. Two NCA1 isoforms interact with catalase in a mutually exclusive manner to redundantly regulate its activity in rice. BMC Plant Biol. 2019, 19, 105. [Google Scholar] [CrossRef]
  50. Shahpiri, A.; Deljoonia, R. Enhancement of catalase and superoxide dismutase activities in transgenic Escherichia coli expressing rice metallothionein isoforms. J. BioSci. Biotechnol. 2018, 7, 5–10. [Google Scholar]
  51. Matsumura, T.; Tabayashi, N.; Kamagata, Y.; Souma, C.; Saruyama, H. Wheat catalase expressed in transgenic rice can improve tolerance against low temperature stress. Physiol. Plant 2002, 116, 317–327. [Google Scholar] [CrossRef]
  52. Hameed, A.; Naseer, S.; Iqbal, T.; Syed, H.; Haq, M.A. Effects of NaCl salinity on seedling growth, senescence, catalase and protease activities in two wheat genotypes differing in salt tolerance. Pak. J. Bot. 2008, 40, 1043–1051. [Google Scholar]
  53. Srivalli, B.; Khanna-Chopra, R. Induction of new isoforms of superoxide dismutase and catalase enzymes in the flag leaf of wheat during monocarpic senescence. Biochem. Biophys. Res. Commun. 2001, 288, 1037–1042. [Google Scholar] [CrossRef]
  54. dos Santos, C.M.; de Almeida Silva, M.; Lima, G.P.P.; Bortolheiro, F.P.d.A.P.; Brunelli, M.C.; de Holanda, L.A.; Oliver, R. Physiological changes associated with antioxidant enzymes in response to sugarcane tolerance to water deficit and rehydration. Sugar Tech. 2015, 17, 291–304. [Google Scholar] [CrossRef]
  55. Liu, Y.; Hu, X.; Yao, Y.; Xu, L.; Xing, S. Isolation and expression analysis of catalase genes in Erianthus arundinaceus and sugarcane. Sugar Tech. 2016, 18, 468–477. [Google Scholar] [CrossRef]
  56. Zhou, Y.; Liu, S.; Yang, Z.; Yang, Y.; Jiang, L.; Hu, L. CsCAT3, a catalase gene from Cucumis sativus, confers resistance to a variety of stresses to Escherichia coli. Biotechnol. Biotechnol. Equip. 2017, 31, 886–896. [Google Scholar] [CrossRef] [Green Version]
  57. Murota, K.; Shimura, H.; Takeshita, M.; Masuta, C. Interaction between Cucumber mosaic virus 2b protein and plant catalase induces a specific necrosis in association with proteasome activity. Plant Cell Rep. 2017, 36, 37–47. [Google Scholar] [CrossRef] [PubMed] [Green Version]
  58. Wang, Q.; Li, C.X.; Fan, X.; Wang, P.; Cui, L. Immobilization of catalase on cotton fabric oxidized by sodium periodate. Biocatal. Biotrans. 2008, 26, 437–443. [Google Scholar] [CrossRef]
  59. Luo, X.; Wu, J.; Li, Y.; Nan, Z.; Guo, X.; Wang, Y.; Zhang, A.; Wang, Z.; Xia, G.; Tian, Y. Synergistic effects of GhSOD1 and GhCAT1 overexpression in cotton chloroplasts on enhancing tolerance to methyl viologen and salt stresses. PLoS ONE 2013, 8, e54002. [Google Scholar] [CrossRef] [PubMed]
  60. Duman, Y.A.; Kaya, E. Three-phase partitioning as a rapid and easy method for the purification and recovery of catalase from sweet potato tubers (Solanum tuberosum). Appl. Biochem. Biotechnol. 2013, 170, 1119–1126. [Google Scholar] [CrossRef]
  61. Afiyanti, M.; Chen, H.-J. Catalase activity is modulated by calcium and calmodulin in detached mature leaves of sweet potato. J. Plant Physiol. 2014, 171, 35–47. [Google Scholar] [CrossRef]
  62. Xing, Y.; Jia, W.; Zhang, J. AtMEK1 mediates stress-induced gene expression of CAT1 catalase by triggering H2O2 production in Arabidopsis. J. Exp. Bot. 2007, 58, 2969–2981. [Google Scholar] [CrossRef]
  63. Guo, P.; Li, Z.; Huang, P.; Li, B.; Fang, S.; Chu, J.; Guo, H. A tripartite amplification loop involving the transcription factor WRKY75, salicylic acid, and reactive oxygen species accelerates leaf senescence. Plant Cell 2017, 29, 2854–2870. [Google Scholar] [CrossRef]
  64. Corpas, F.J.; Barroso, J.B. Lead-induced stress, which triggers the production of nitric oxide (NO) and superoxide anion (O2·-) in Arabidopsis peroxisomes, affects catalase activity. Nitric Oxide 2017, 68, 103–110. [Google Scholar] [CrossRef]
  65. Vighi, I.; Benitez, L.; do Amaral, M.; Auler, P.; Moraes, G.; Rodrigues, G.; Da Maia, L.; Pinto, L.; Braga, E. Changes in gene expression and catalase activity in Oryza sativa L. under abiotic stress. Genet. Mol. Res. 2016, 15, gmr15048977. [Google Scholar] [CrossRef] [PubMed]
  66. Wang, W.; Liu, D.; Zhang, X.; Chen, D.; Cheng, Y.; Shen, F. Plant microRNAs in cross-kingdom regulation of gene expression. Int. J. Mol. Sci. 2018, 19, 2007. [Google Scholar] [CrossRef] [PubMed] [Green Version]
  67. Huang, S.Q.; Xiang, A.L.; Che, L.L.; Chen, S.; Li, H.; Song, J.B.; Yang, Z.M. A set of miRNAs from Brassica napus in response to sulphate deficiency and cadmium stress. Plant Biotechnol. J. 2010, 8, 887–899. [Google Scholar] [CrossRef]
  68. Zhou, Z.S.; Song, J.B.; Yang, Z.M. Genome-wide identification of Brassica napus microRNAs and their targets in response to cadmium. J. Exp. Bot. 2012, 63, 4597–4613. [Google Scholar] [CrossRef] [PubMed] [Green Version]
  69. Chen, L.; Chen, L.; Zhang, X.; Liu, T.; Niu, S.; Wen, J.; Yi, B.; Ma, C.; Tu, J.; Fu, T. Identification of miRNAs that regulate silique development in Brassica napus. Plant Sci. 2018, 269, 106–117. [Google Scholar] [CrossRef]
  70. Buhtz, A.; Springer, F.; Chappell, L.; Baulcombe, D.C.; Kehr, J. Identification and characterization of small RNAs from the phloem of Brassica napus. Plant J. 2008, 53, 739–749. [Google Scholar] [CrossRef] [PubMed]
  71. Fu, Y.; Mason, A.S.; Zhang, Y.; Lin, B.; Xiao, M.; Fu, D.; Yu, H. MicroRNA-mRNA expression profiles and their potential role in cadmium stress response in Brassica napus. BMC Plant Biol. 2019, 19, 1–20. [Google Scholar] [CrossRef] [PubMed]
  72. Körbes, A.P.; Machado, R.D.; Guzman, F.; Almerao, M.P.; de Oliveira, L.F.V.; Loss-Morais, G.; Turchetto-Zolet, A.C.; Cagliari, A.; dos Santos Maraschin, F.; Margis-Pinheiro, M. Identifying conserved and novel microRNAs in developing seeds of Brassica napus using deep sequencing. PLoS ONE 2012, 7, e50663. [Google Scholar] [CrossRef] [PubMed]
  73. Shen, E.; Zou, J.; Hubertus Behrens, F.; Chen, L.; Ye, C.; Dai, S.; Li, R.; Ni, M.; Jiang, X.; Qiu, J. Identification, evolution, and expression partitioning of miRNAs in allopolyploid Brassica napus. J. Exp. Bot. 2015, 66, 7241–7253. [Google Scholar] [CrossRef] [PubMed] [Green Version]
  74. Casati, P. Analysis of UV-B regulated miRNAs and their targets in maize leaves. Plant Signal. Behav. 2013, 8, e26758. [Google Scholar] [CrossRef] [PubMed] [Green Version]
  75. Li, S.; Yu, X.; Lei, N.; Cheng, Z.; Zhao, P.; He, Y.; Wang, W.; Peng, M. Genome-wide identification and functional prediction of cold and/or drought-responsive lncRNAs in cassava. Sci. Rep. 2017, 7, 45981. [Google Scholar] [CrossRef] [PubMed]
  76. Nageshbabu, R.; Jyothi, M.; Sharadamma, N. Expression of miRNAs regulates growth and development of French bean (Phaseolus vulgaris) under salt and drought stress conditions. ISCA J. Biol. Sci. 2013, 2, 52–56. [Google Scholar]
  77. Zhang, Y.; Zhu, X.; Chen, X.; Song, C.; Zou, Z.; Wang, Y.; Wang, M.; Fang, W.; Li, X. Identification and characterization of cold-responsive microRNAs in tea plant (Camellia sinensis) and their targets using high-throughput sequencing and degradome analysis. BMC Plant Biol. 2014, 14, 271. [Google Scholar] [CrossRef] [Green Version]
  78. Yang, Z.; Wang, Z.; Yang, C.; Yang, Z.; Li, H.; Wu, Y. Physiological responses and small RNAs changes in maize under nitrogen deficiency and resupply. Genes Genom. 2019, 41, 1183–1194. [Google Scholar] [CrossRef]
  79. Wang, Z.; Chen, Y.; Fang, H.; Shi, H.; Chen, K.; Zhang, Z.; Tan, X. Selection of reference genes for quantitative reverse-transcription polymerase chain reaction normalization in Brassica napus under various stress conditions. Mol. Genet. Genom. 2014, 289, 1023–1035. [Google Scholar] [CrossRef] [PubMed]
Figure 1. A neighbor-joining phylogenetic tree analysis of CAT proteins in Brassica napus, Brassica oleracea, Brassica rapa, and Arabidopsis thaliana. Overall, 14 BnCATs from Brassica napus (red triangle), 4 BoCATs from Brassica oleracea (blue star), 7 BraCATs from Brassica rapa (green box), and 3 AtCATs from Arabidopsis thaliana (yellow circles) were clustered into four groups (Groups I–IV), represented by different colors.
Ijms 22 04281 g001
Figure 2. Circular illustrations of the chromosomal dispersal and inter-chromosomal associations of BnCAT genes. Grey lines in the background show all the syntenic blocks in the rapeseed genome, and the red lines show syntenic CAT gene pairs.
Ijms 22 04281 g002
Figure 3. Synteny analysis of CAT genes in B. napus, B. rapa, B. oleracea, and A. thaliana chromosomes. Grey lines in the background show the collinear blocks within rapeseed and other plant genomes, while the red and green lines highlight the syntenic CAT gene pairs. Genes positioned on the B. napus A genome are syntenic with B. rapa and A. thaliana, while genes positioned on the B. napus C genome are syntenic with B. oleracea and A. thaliana.
Ijms 22 04281 g003
Figure 4. The gene structure and motif analysis of the CAT family genes from B. napus and A. thaliana. According to the phylogenetic relationships, the CAT genes from both genomes were clustered into four groups (Groups I–IV). (A) The gene structure of the BnCATs and AtCATs. Light green color shows the UTR regions, yellow color shows the CDS or exons, black horizontal line shows the introns, pink color shows the catalase core domain (catalase, PF00199), and dark green color shows the catalase-related immune-responsive domain (catalase-rel, PF06628). (B) Conserved domain structures identified in the BnCATs and AtCATs. Different color boxes show different motifs.
Ijms 22 04281 g004
Figure 5. Cis-elements in the promoters of the BnCAT genes that are associated with different hormone- and stress-responsive elements. Different color boxes show different identified cis-elements.
Ijms 22 04281 g005
Figure 6. A network illustration of the regulatory associations among the presumed miRNAs and selective BnCAT genes.
Ijms 22 04281 g006
Figure 7. Expression patterns of BnCAT genes in various tissues at different growth phases of rapeseed. The 7d, 10d, 14d, and 45d labels showed the time-points when the samples were harvested. In the expression bar, the red color shows high, and the blue color shows low expression levels.
Ijms 22 04281 g007
Figure 8. Expression patterns of the BnCAT genes under various hormones and abiotic stress. (A) Expression profiling during hormone treatments, including abscisic acid (ABA), gibberellic acid (GA), indole-acetic acid/auxin (IAA), and methyl jasmonate (MeJA). (B) Expression profiling under abiotic stresses, including cold, salinity (NaCl), drought (PEG-6000), and waterlogging (WL). The 0 h (CK), 2 h, 4 h, 6 h, and 8 h labels displayed the time points (hours) when the samples were harvested for expression analysis after the stress treatment. The bars show the comparative gene expression patterns examined via the 2ΔΔCT method. The red color shows high, and the blue color shows low expression levels.
Ijms 22 04281 g008
Table 1. Information of the 14 BnCAT genes identified in rapeseed.
Gene IDGene NameGenomic Position (bp)Gene Length (bp)CDS Length (bp)ExonProtein Length (Amino Acids)Molecular Weight (kDa)Isoelectric Point (pI)Sub-Cellular Localization
BnaA01T0032600ZSBnCAT1A01:1801796-1803991 +21951488449557.306.5Cytoskeleton
BnaA03T0547900ZSBnCAT2A03:31026573-31028922 −23491479549256.846.63Peroxisome
BnaA06T0144600ZSBnCAT3A06:8685726-8691515 +5789292512974112.306.78Peroxisome
BnaA07T0132000ZSBnCAT4A07:17121532-17124087 −25551479549256.906.83Cytoplasm
BnaA07T0132100ZSBnCAT5A07:17124704-17130749 −60451671655664.838.42Chloroplast
BnaA08T0131200ZSBnCAT6A08:18424311-18426301 +199014704489565.406.9Peroxisome
BnaA08T0247000ZSBnCAT7A08:25020319-25023539 −32201479549256.807.69Peroxisome
BnaC03T0740800ZSBnCAT8C03:71851456-71853466 +20101470448956.526.77Peroxisome
BnaC05T0176000ZSBnCAT9C05:11786858-11795441 +8583294912982113.096.94Mitochondrion
BnaC07T0194100ZSBnCAT10C07:32771906-32781676 −97703123151040120.717.34Chloroplast
BnaC07T0524400ZSBnCAT11C07:59429784-59432167 −23831479449256.786.63Peroxisome
BnaC08T0260800ZSBnCAT12C08:34921906-34925039 +31331479549256.807.69Peroxisome
Bnascaffold0025T0038400ZSBnCAT130025:3787780-3790910 −31301434547755.197.72Peroxisome
Bnascaffold0026T0027200ZSBnCAT140026:2854478-2857610 +31321479549256.807.69Peroxisome
In the genomic position, the positive (+) and negative (−) signs indicate the existence of a gene on the positive and negative strand of that specific marker, respectively.
Publisher’s Note: MDPI stays neutral with regard to jurisdictional claims in published maps and institutional affiliations.

