1. Introduction
Lung cancer imposes a major disease burden in the world as it remains the most commonly diagnosed cancer and the biggest cause of cancer-related deaths. Globally, lung cancer accounts for 17% and 9% of all cancers in men and women, respectively, and represents 19% of all cancer-related deaths. Although novel approaches for treating lung cancer are available, the 5-year survival rate is still low, ranging from 5 to 15% [
1]. This is related to the advanced disease stage at diagnosis [
2]. The major problem in lung cancer therapy is clinical resistance, in which hypoxia is one of the key components. Sustained hypoxia has been identified as an adverse indicator of patients’ prognosis independent of clinical stage at the moment of diagnosis [
3].
Hypoxia (diminished oxygen availability) is the most common microenvironment feature of tumors and contributes significantly to their development. Hypoxia occurs in 90% of solid tumors due to limitations in diffusion and inefficient vasculature [
3]. In the course of adaptation to hypoxia, tumors evolve more aggressive and therapy resistant phenotypes [
4]. Oxygen deprivation induces many changes in gene expression, mainly through stabilization of the hypoxia-inducible subunits (HIFs) that regulate the cellular response to hypoxia. It is known that HIF-1 regulates thousands of genes [
5]. However, there is a discrepancy in the predictive value of HIF-1 and its downstream genes expression, so there is a need for the development of gene expression signatures for assessing tumor hypoxia.
We previously showed that FAM13A was significantly up-regulated in lung cancer cell lines (A549, CORL-105) and non-small cell lung cancer fragments cultured ex vivo, after exposure to chronic hypoxia [
6].
FAM13A (family with sequence similarity 13, member A, MIM 147582) gene encodes two main protein isoforms (1 and 2). Only isoform 1 contains the Rho-GAP domain that is important for the regulation of cell proliferation and survival [
7]. It is known that Rho GTPases family proteins play an important role in the process of cell migration and several signaling complexes [
8]. Perturbed Rho GTPase signaling is associated with several lung diseases, including lung cancer [
9]. Previously,
FAM13A gene variants were indicated as risk factors of lung cancer [
10], chronic lung diseases including chronic obstructive pulmonary disease (COPD) [
11,
12] and cystic fibrosis (CF) [
13]. Nevertheless, the biological function of FAM13A has not been fully elucidated and the mechanism of protein activity is poorly understood.
The aim of the present study is therefore to investigate the biological role of hypoxia-induced FAM13A in non-small cell lung cancer (NSCLC) progression. We examined the effect of FAM13A knockdown on cell proliferation, cell cycle, migration, invasion and apoptosis in NSCLC cells cultured under hypoxic conditions in order to clarify the function of FAM13A.
3. Discussion
The function of FAM13A in non-small cell lung cancer (NSCLC) progression under hypoxic condition is unknown. In the present study, we focused on the role of FAM13A in cellular processes such as proliferation, cell cycle, migration, invasion and apoptosis in NSCLC cells under hypoxia. All these features are relevant for tumor progression and manifestation of metastases. To this end we used A549 and CORL-105 cells with stable FAM13A knockdown.
In our previous report, induction of FAM13A in lung cancer cells was confirmed in both in vitro and ex vivo models in short-term cultures after 72 h of hypoxia [
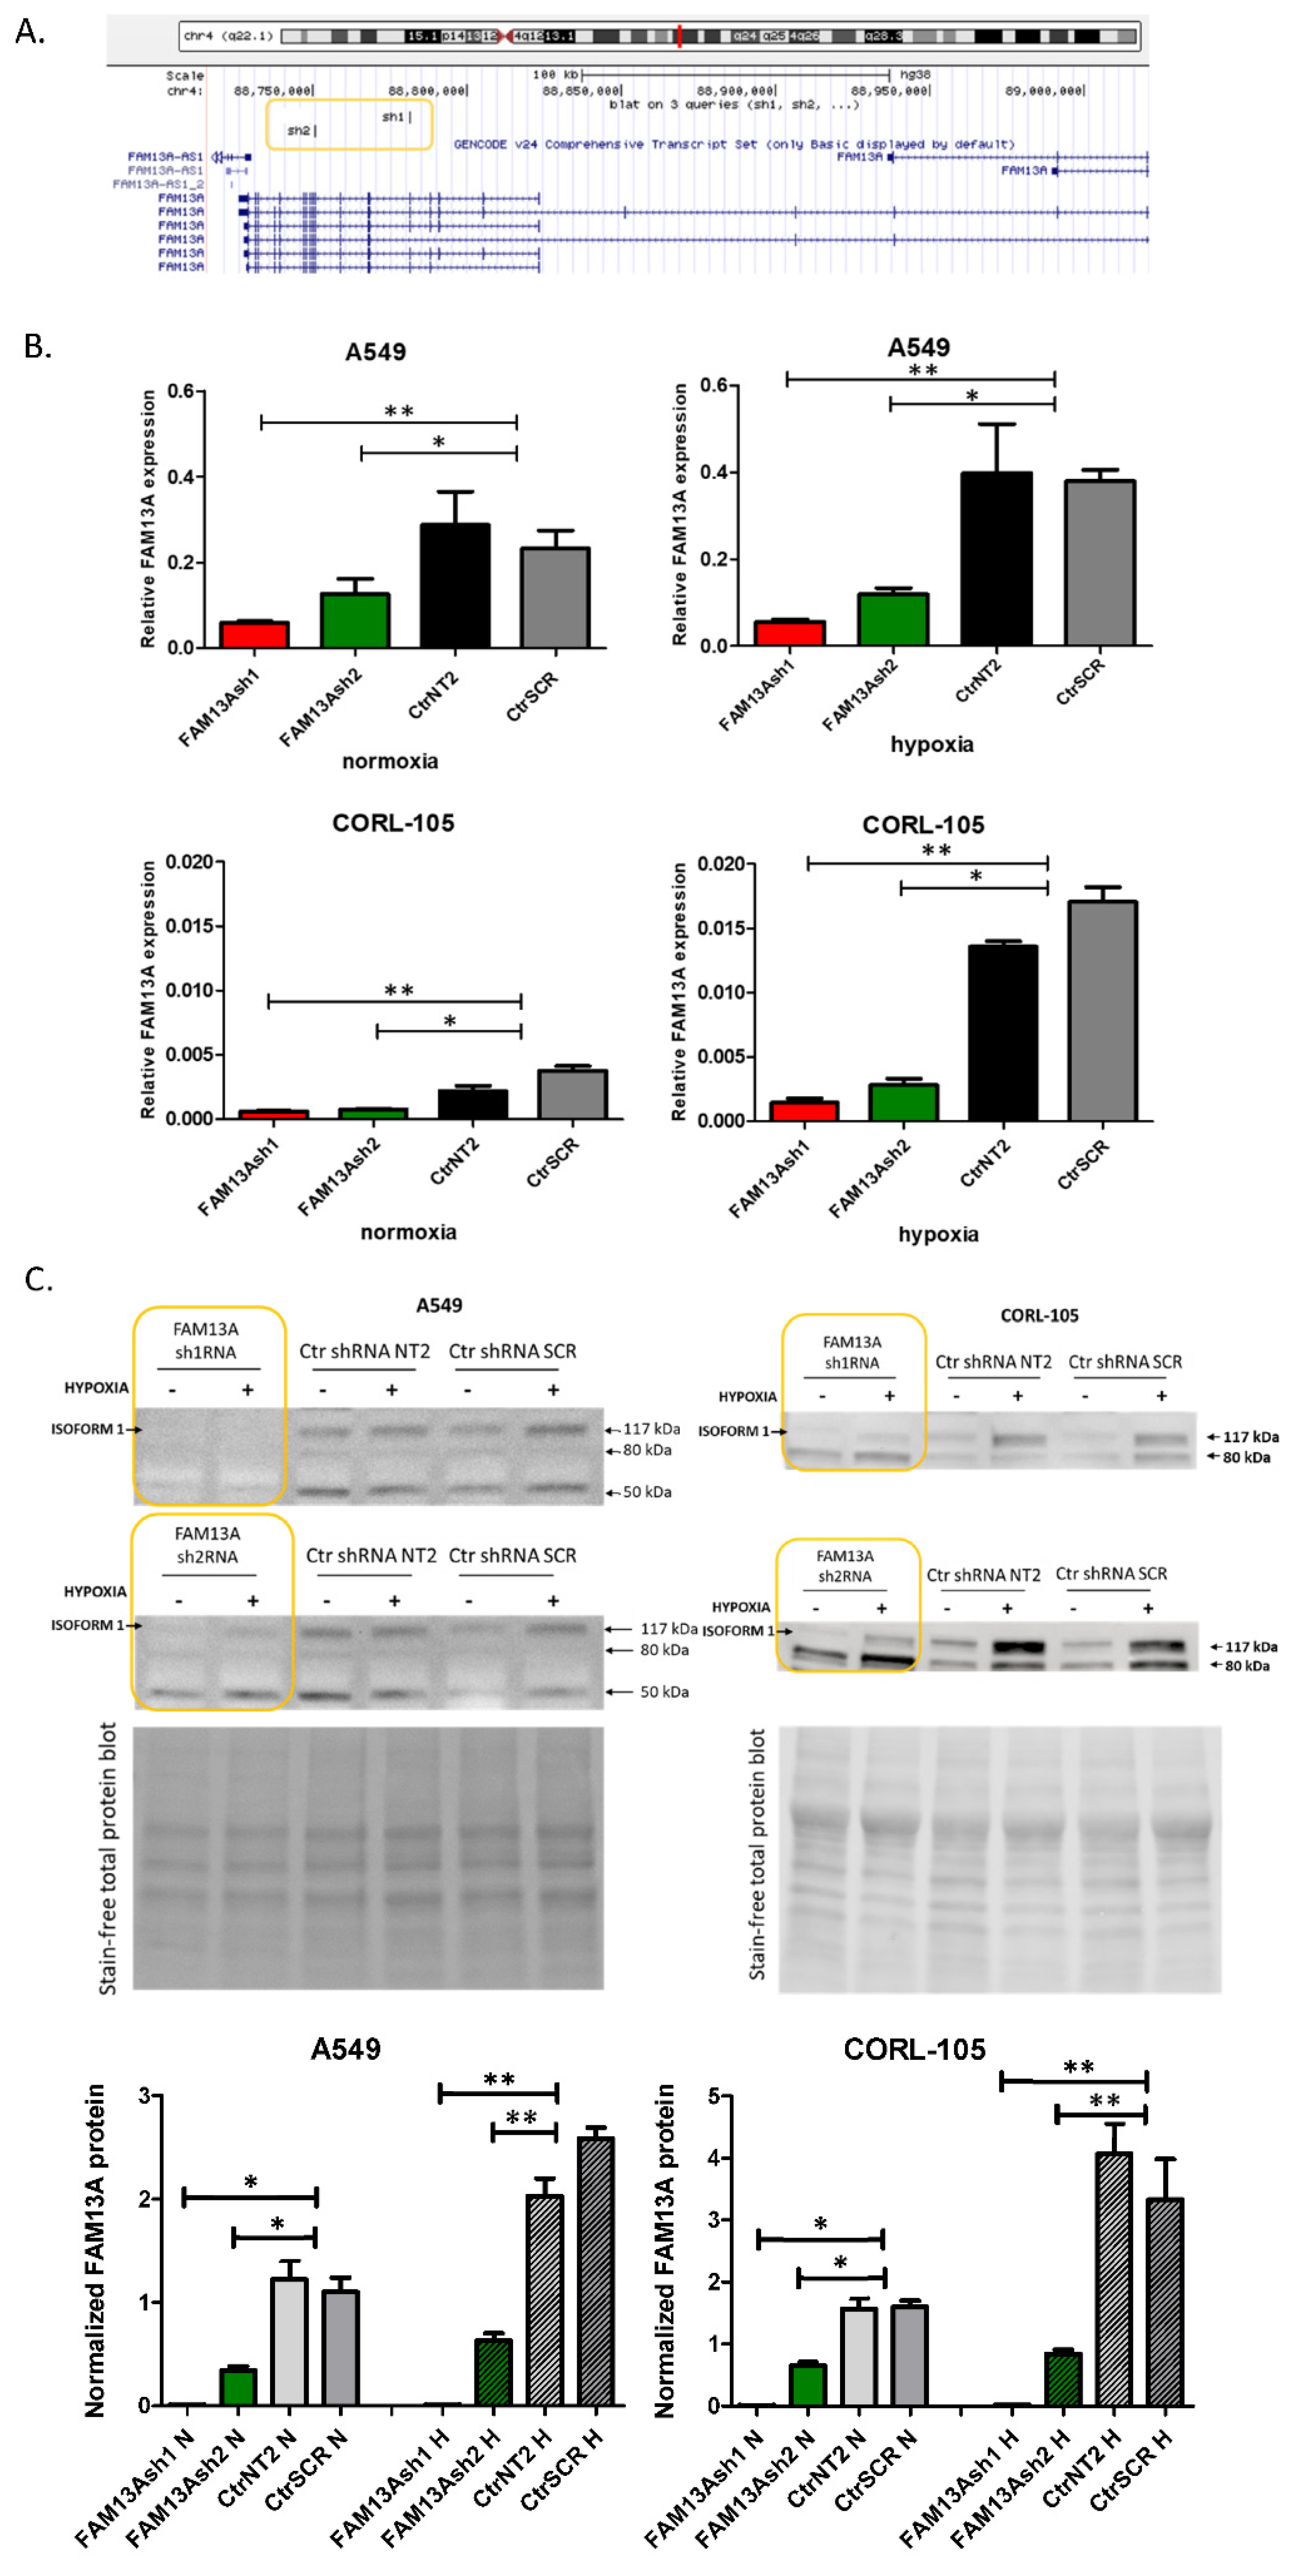
6]. In the current study, significant increase in FAM13A expression was confirmed after exposure to chronic hypoxia in both cell lines (
Figure 1). So far, few data are available on the FAM13A hypoxia-dependent regulation and its contribution to lung cancer progression. Studies on gene expression signature of the hypoxia response derived from several tissues (not comprising the lung) have shown a consistent increase of FAM13A expression [
15].
In the literature there is only one study focused on the expression and function of FAM13A in NSCLC cells [
14]. Among patients with lung adenocarcinoma and squamous cell carcinoma, increased FAM13A levels were found in tumoral area of the lung. Furthermore, FAM13A mRNA level together with HIF1α subunit were increased in antitumor CD4 + CD25 T effector cells in the hypoxic lung region of NSCLC patients. It was hypothesized that FAM13A together with HIF1α might be associated with antitumor effector T cells in the control area surrounding the growing tumor, in which oxygen deprivation occurred [
14].
Recently, Godet et al. identified gene expression patterns in breast cancer cells that experienced intratumoral hypoxia in vivo compared to cells exposed to deoxygenation in vitro, with the use of unique hypoxia fate-mapping system. Set of 19 genes, including FAM13A, was induced by hypoxia in primary tumor and remained overexpressed at metastatic site in the lung, suggesting occurrence of a ‘hypoxic memory’. It was suggested that hypoxia inducible genes can be used as biomarkers to identify cells at metastatic sites that have been exposed to intratumoral hypoxia [
16]. We can assume that
FAM13A gene is a crucial member of hypoxia-response gene set in NSCLC, however our understanding of its contribution in lung cancer progression is still limited.
To examine the impact of
FAM13A gene silencing on lung cancer cells proliferation under hypoxia, we performed series of tests, including VPD assay, MTS test and also BrdU assay. The results of VPD assay show a significant reduction in cell proliferation after FAM13A knockdown in A549 cells cultured in normal oxygen tension, as well as hypoxia, while the effect of FAM13A downregulation on CORL-105 cells was observed only after 96 h exposition to hypoxia. It is worth mentioning that hypoxia decreased cell proliferation in both cell lines, regardless of FAM13A knockdown. We also observed that oxygen deprivation had a stronger impact on CORL-105 cells growth (data not shown), compared to A549 cells. In MTS assay, negative effect of FAM13A shRNA on A549 and CORL-105 cell proliferation was observed already after 24 h and 48 h, especially under hypoxia conditions. The observed differences between VPD450 and MTS assays is probably due to their underlying methodology. In the current study, MTS method appeared to be more sensitive for cell proliferation assessment. Moreover, it was confirmed that VPD450 tracking of cancer cell division could be difficult [
17]. Cancer cells are less homogeneous in size and protein content and consequently show broader peaks in histograms, which makes the quantitative population analyses more difficult [
17]. We also observed this phenomenon during experiments. The third method used for proliferation assessment in the current study (BrdU assay) confirmed that FAM13A inhibition induced S phase cell cycle arrest in lung cancer tumor cells under hypoxia conditions. To summarize, very little is known about the role of
FAM13A gene on tumor cellular proliferation. Only in one study, decrease in A549 cell number and proliferation was observed after FAM13AsiRNA treatment [
14]. In line with this, our results confirmed that FAM13A drives NSCLC cell proliferation, especially under hypoxia.
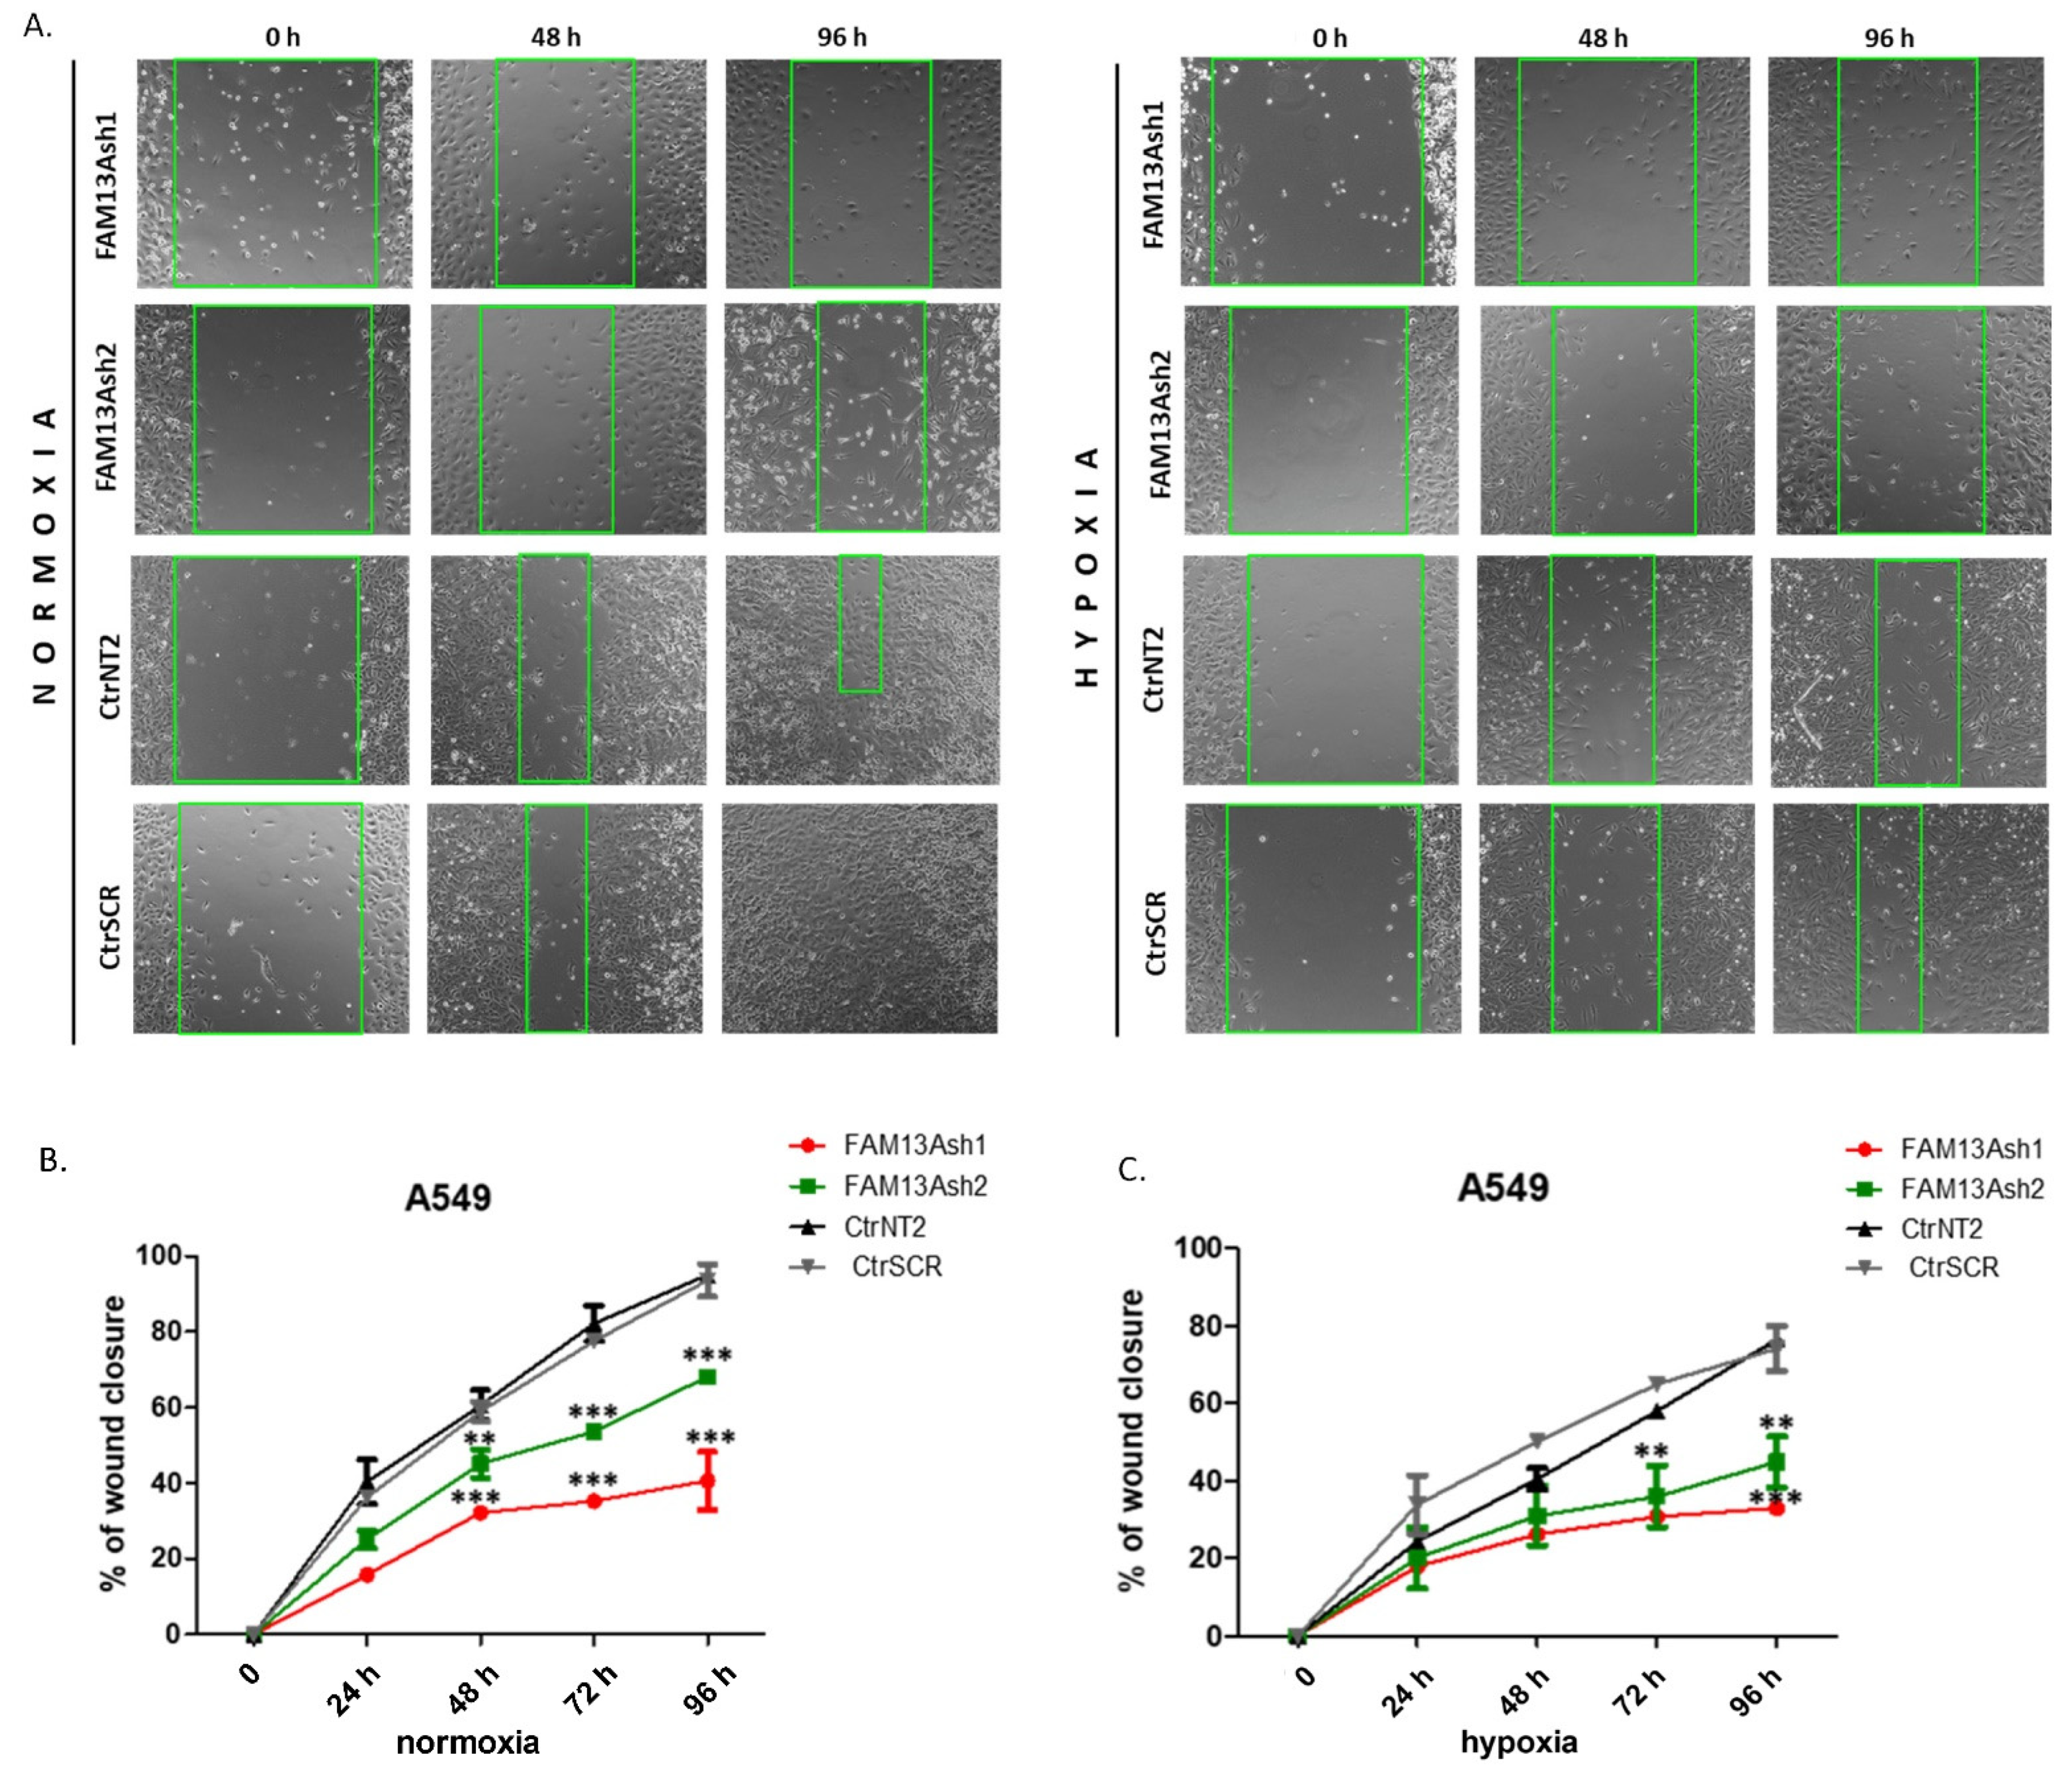
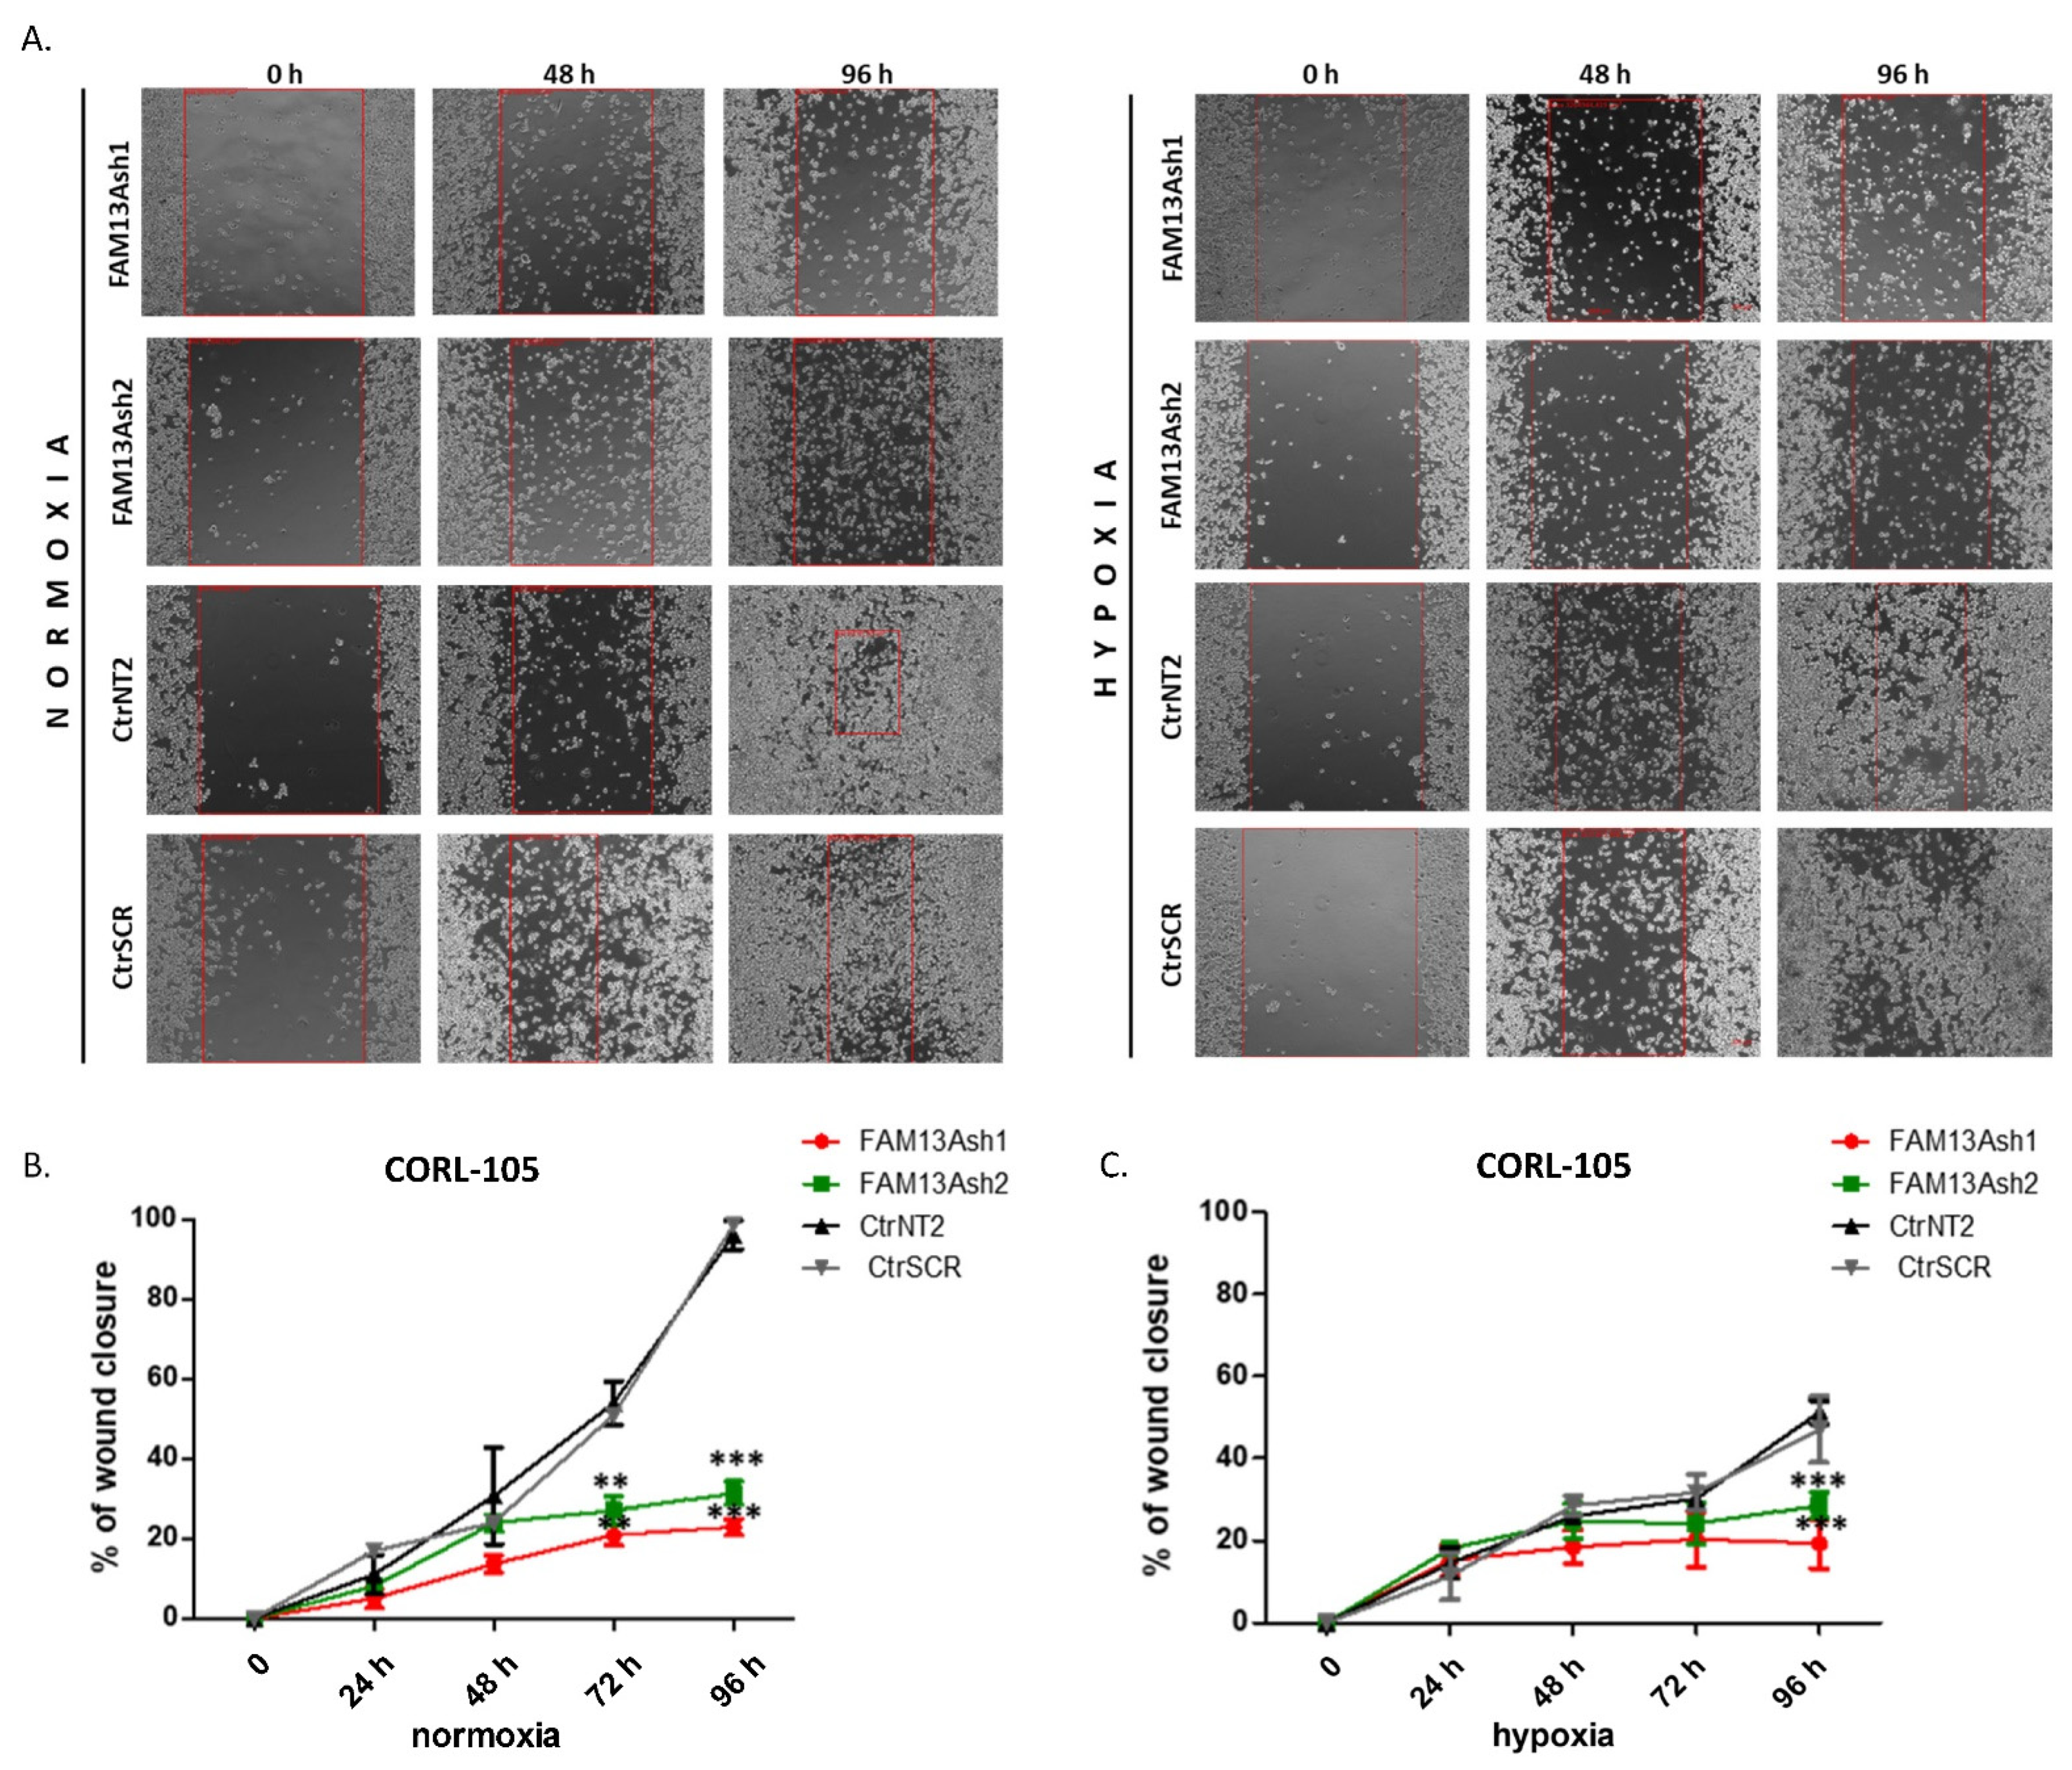
To analyze the role of FAM13A in cancer cell metastasis, we performed wound healing and invasion assays. The wound healing results showed that FAM13A silencing had a strong negative impact on A549 and CORL-105 cell migration (
Figure 3 and
Figure 4). We observed that while A549 cells responded faster to hypoxia (48 h), CORL-105 cells were overall more sensitive to hypoxia, which was reflected in more severe inhibition of migratory capacities after 72 and 96 h. In the current study we observed that hypoxia reduced cell migration, and FAM13A silencing resulted in further inhibition of cell migration both in normoxia and hypoxia.
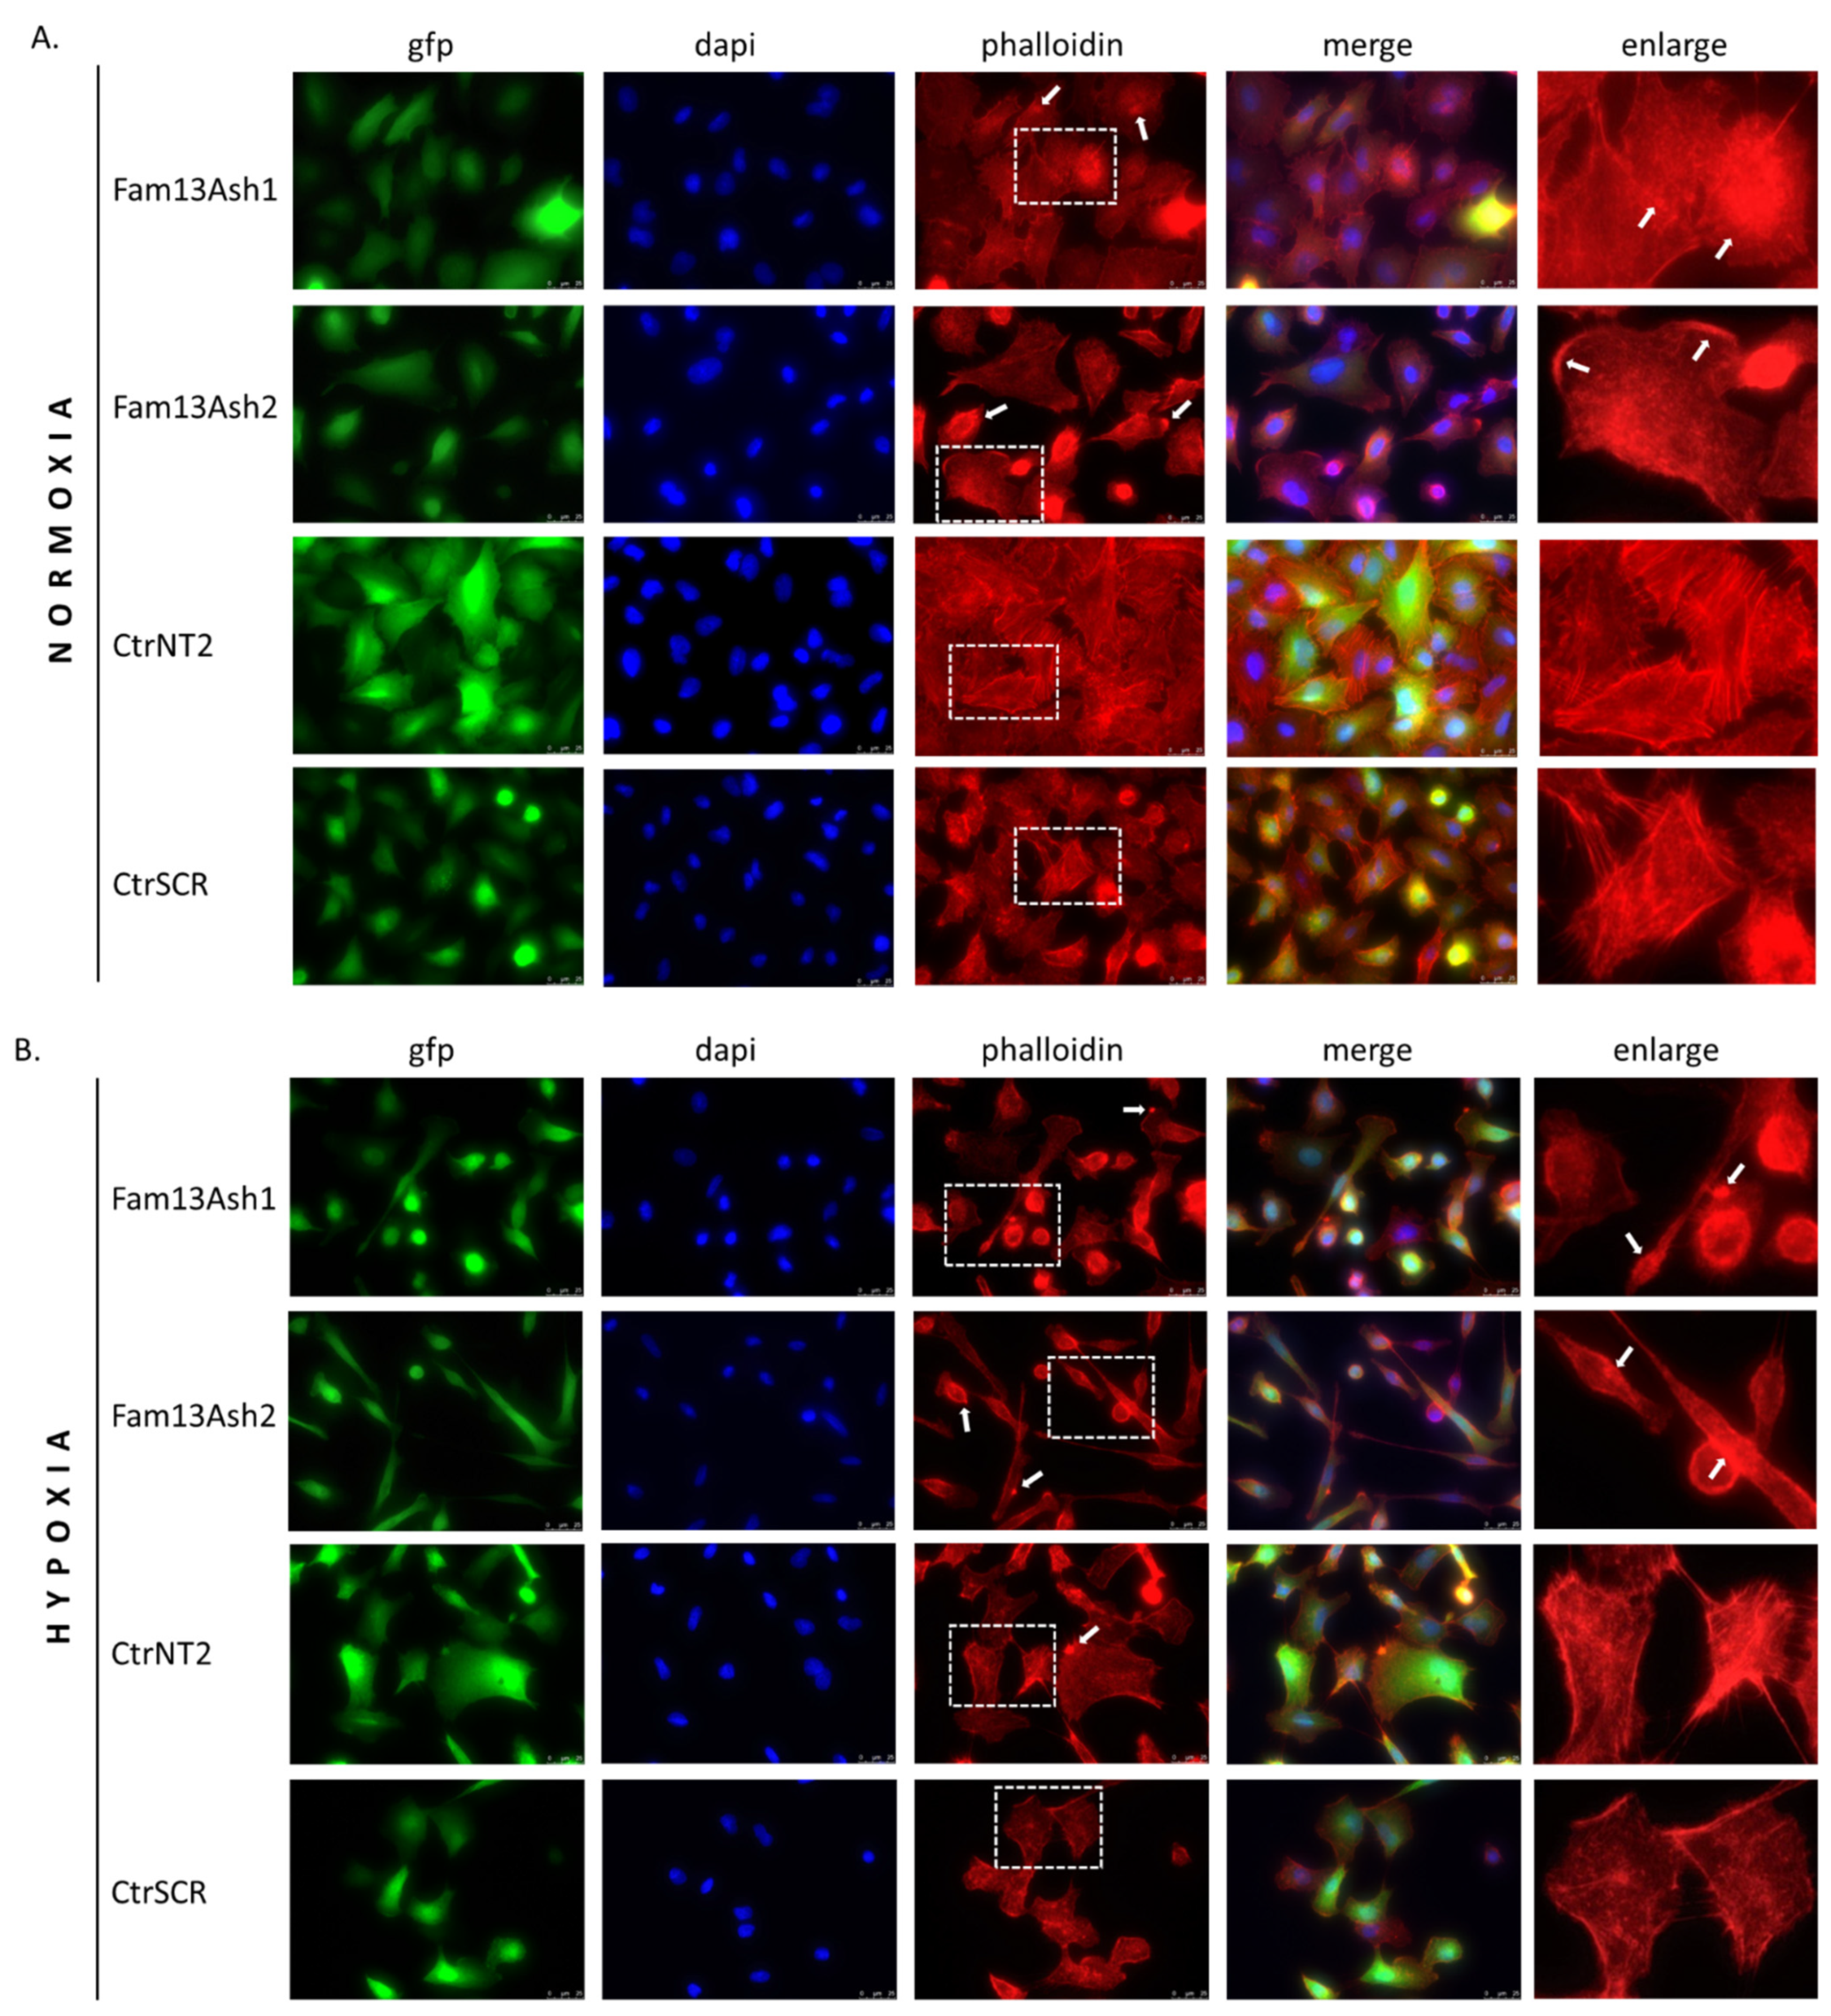
As the cell migration depends on the actin cytoskeleton we assessed the influence of FAM13A inhibition on the cytoskeleton phenotype. The phalloidin stanning revealed that FAM13A depleted cells beside different cell shapes were characterized by various actin cytoskeleton disturbances. The reorganization of F-actin filaments and presence of F-actin aggregates were observed in normoxia and enhanced in hypoxia. The structural dysregulation of the actin cytoskeleton correlate with movement of tumor cells. Based on current results we assumed that FAM13A is involved in inhibition of cell migration via altering the actin cytoskeleton.
HIFs are induced rapidly upon exposure to 1% O
2 and the delayed effect of hypoxia on migration may reflect the time required to inhibit a downstream signaling pathway in which FAM13A may be involved. However, the results of current study are opposite to reported by Eisenhut et al. in which transient knockdown of
FAM13A in A549 cells caused induction of cell migration, probably due to Rho proteins activation [
14]. On the other hand, the proliferation of FAM13A siRNA treatment cells was decreased, which was confirmed in this study. Some discrepancies may be due to the experimental setups. In our study we generated stable FAM13A knockdown in lung cancer cells, which allowed us to conduct experiments during longer time period. Moreover, during the migration assay, the wound was generated using inserts with a defined gap, which increases the accuracy and reproducibility of the experiments [
18]. We also used cell starvation procedure before starting the experiments. Results obtained for A549 cells were confirmed by monitoring on JuLIFL system for live cells imaging.
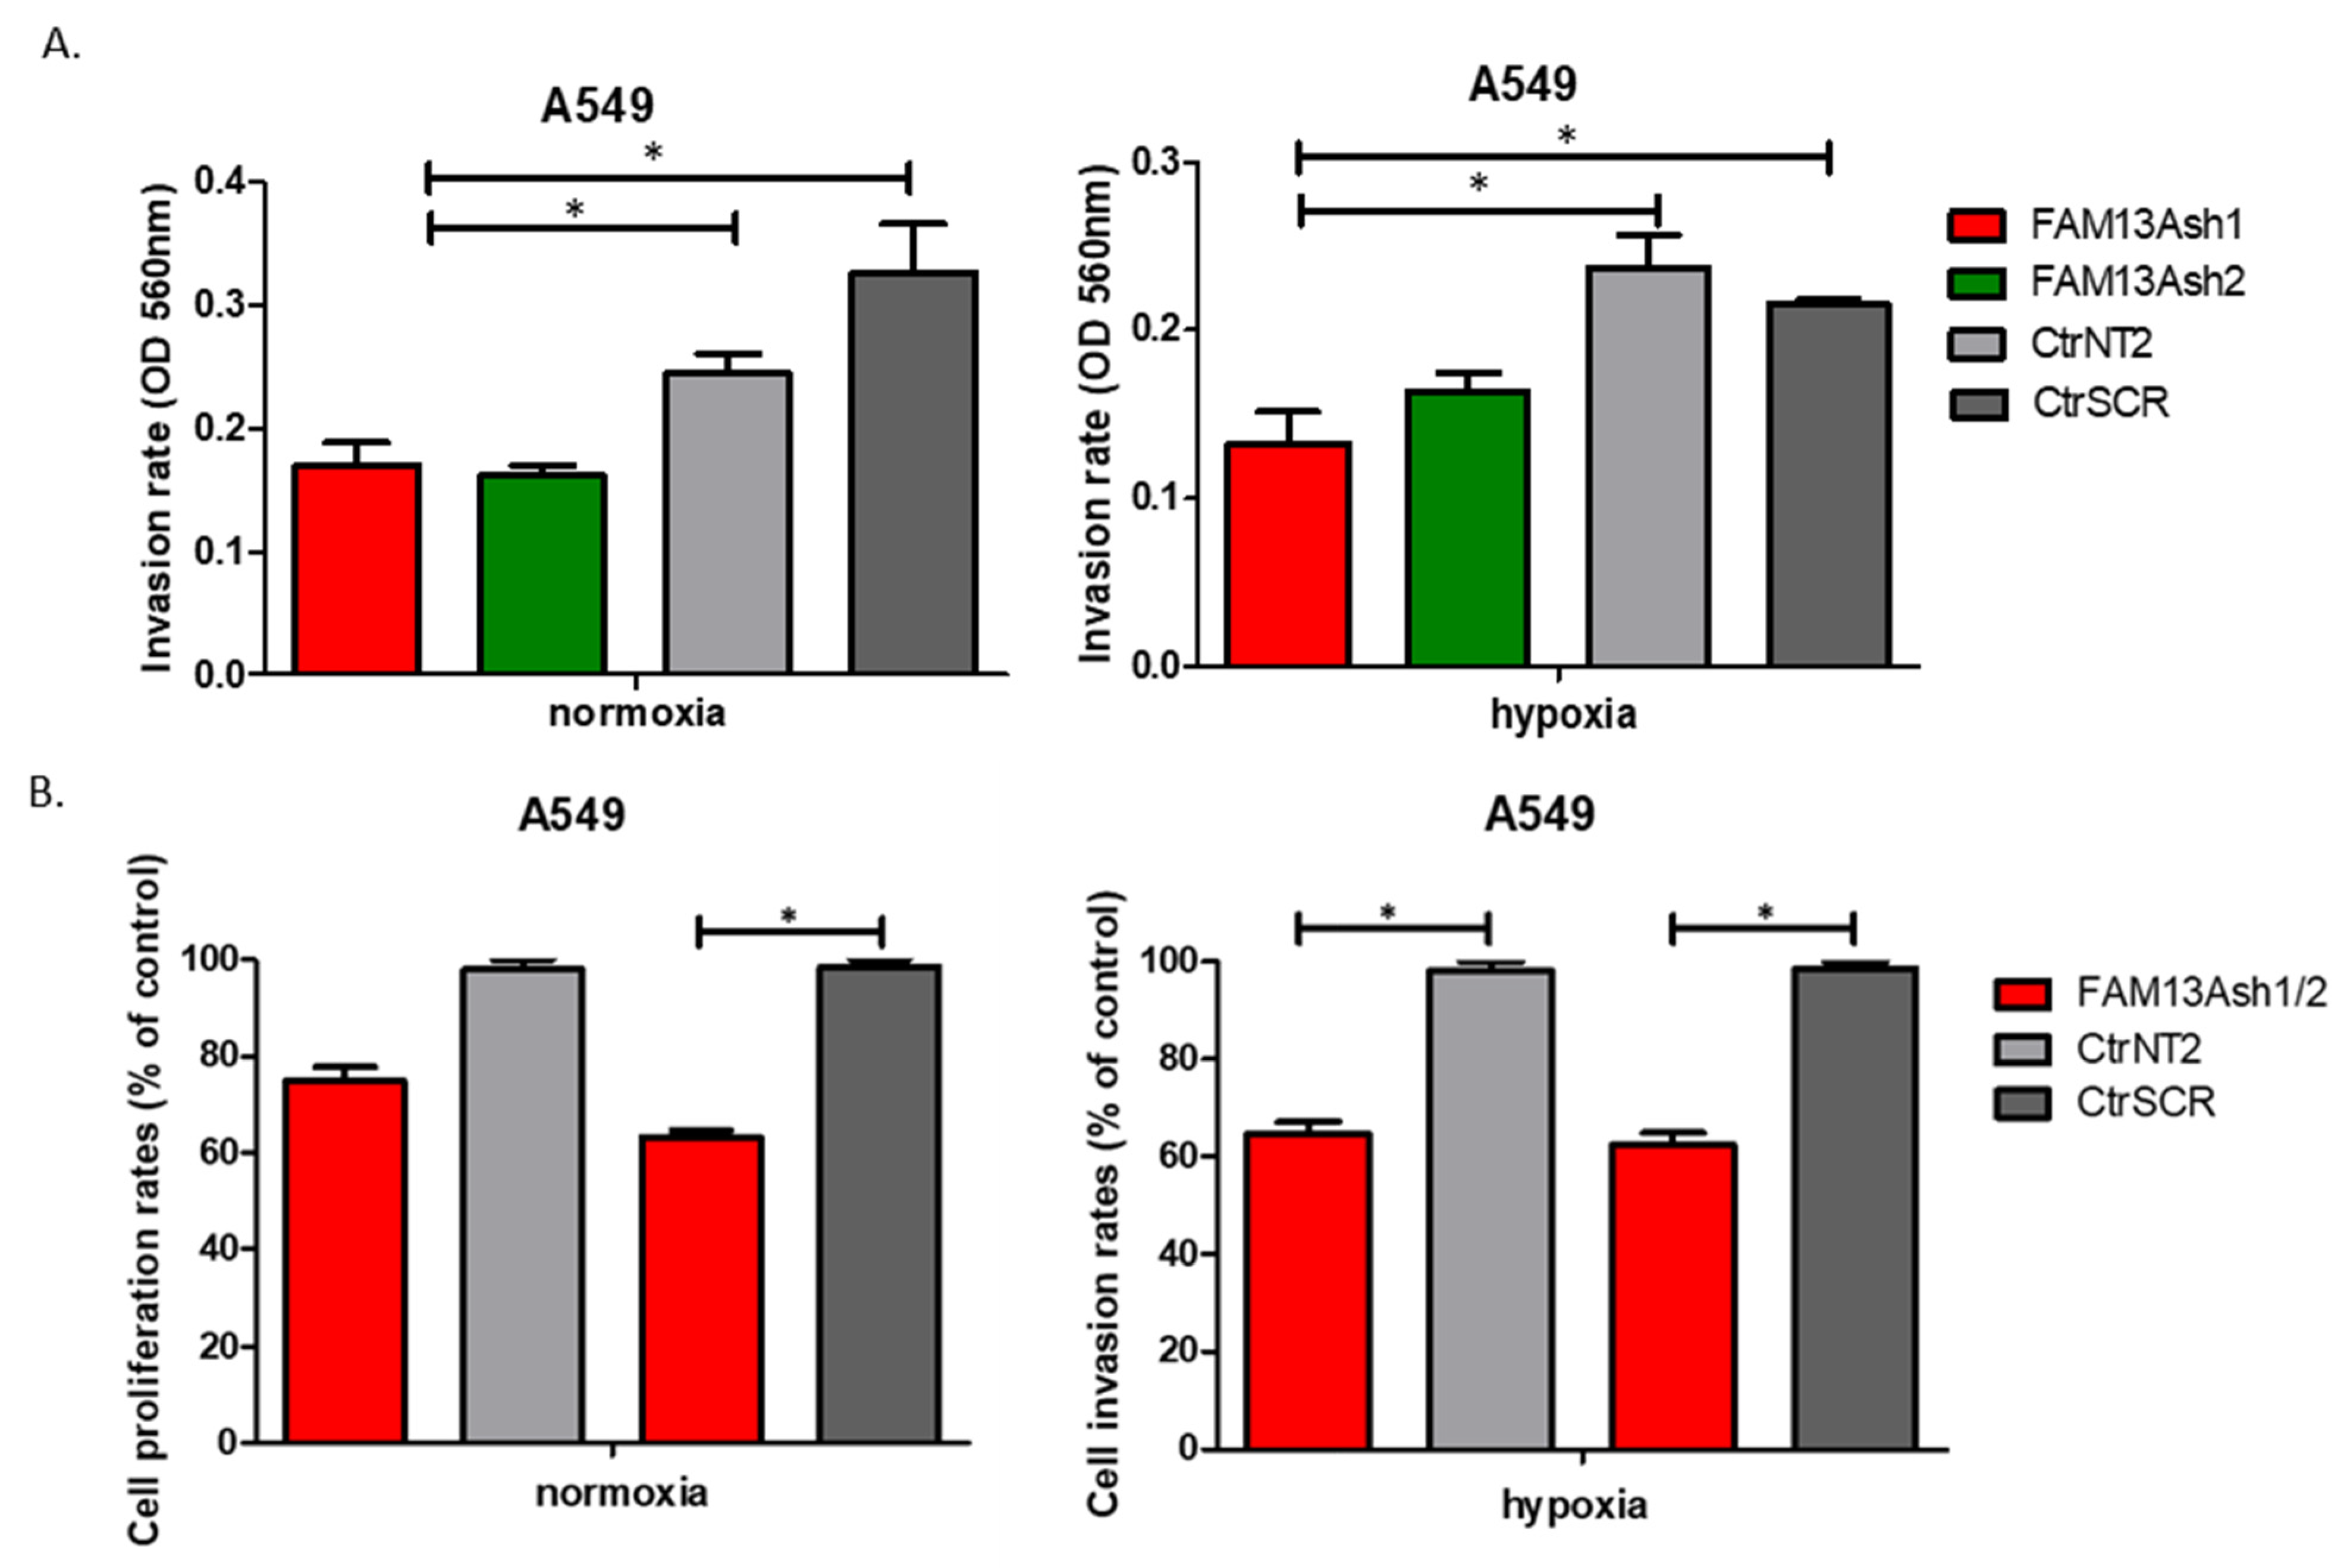
In addition, we showed that FAM13A knockdown inhibits the invasive activities of NSCLC cells. Significant decrease in cell invasion rate was observed for FAM13A shRNA A549 cells vs. controls, under both oxygen concentrations (
Figure 5). The inhibition of invasive properties of A549 FAM13A depleted cells was enhanced under hypoxia as compared with normoxia. The migration and invasion of FAM13A A549 depleted cells depleted may be linked to the epithelial-mesenchymal transition (EMT). It was shown that hypoxia may induce a partial EMT phenotype in NSCLC cell lines [
19]. Moreover, recent data indicated that FAM13A may regulate the Wnt signaling activity associated with EMT in A549 cells [
20]. Based on the current results we assume that the hypoxia-induced FAM13A overexpression may diminish the occurrence of EMT in lung cancer cells, but further studies are needed to verify this hypothesis.
The difference in effect of FAM13A knockdown on cellular processes between A549 and CORL-105 cells may be related to the cells of origin. A549 cell line was derived from primary lung carcinoma, whereas CORL-105 originated from metastasized lung adenocarcinoma (pleural effusion). We chose two different NSCLC cell lines to examine the effect of FAM13A suppression on cells from primary and metastatic site. It is possible that hypoxia promotes metastasis by modulating changes inherent only to cells in primary tumor. It was shown that cells exposed to hypoxia in a primary tumor have four-fold greater probability of becoming viable circulating tumor cell. Moreover, post-hypoxic cells have ability to form lung metastases, suggesting that they have an enhanced metastasis-initiating capability [
14]. If FAM13A overexpression plays an adaptative role to hypoxia in cancer cells, silencing of this gene should have more severe effect on features of primary tumor cells. Our results confirmed this hypothesis, because FAM13A silencing caused milder inhibition of the growth and proliferation in cells derived from metastatic site. Moreover, FAM13A silencing had no influence on the invasive properties of CORL-105 cells.
In the current study, we focused on downregulation of functional isoform 1 of FAM13A protein (117 kDa), which contains Rho GTPase activating protein (GAP) domain. It was reported that the reduced expression of FAM13A resulted in increased RhoA activation in A549 cells and primary human bronchial epithelial cells from cystic fibrosis patients [
13]. RhoA protein function during cell migration and invasion was confirmed although this contribution depended on the environment and cell type [
21]. In our study, we demonstrated that FAM13A knockdown inhibits the invasive activities and migration of NSCLC cells, which may be connected with the Rho GTPase pathways and also with hypoxia induced pathways. The effect of FAM13A inhibition on cell migration/invasion can be related to great plasticity of cancer cells in their movement mechanisms [
22] and to the activation of other signaling pathways involved in cell migration, e.g., Rac GTPase-mediated signaling [
23]. However, the detailed mechanism of this process needs to be verified.
Numerous studies demonstrated that the Rho/Rho-kinase signaling pathway may be involved in the apoptosis of lung cancer cells [
24]. Thus, we decided to investigate if silencing of FAM13A gene expression affects the apoptosis in NSCLC cells. We found that FAM13A knockdown did not induce apoptosis in A549 or CORL-105 cells. Previously, it was shown that TGFβ induced apoptosis in A549 cells and it was associated with downregulation of two main FAM13A isoforms [
14]. Further studies are necessary to better understand the role of FAM13A in programmed tumor cell death.
In summary, we confirmed that FAM13A silencing has a negative effect on proliferation, migration via altering the actin cytoskeleton, and invasion activity in NSCLC cells in normal and hypoxic conditions. Our study showed that oxygen deprivation further enhanced phenotypic changes in FAM13A depleted cells. We demonstrated that FAM13A depleted post-hypoxic cells have a decreased metastatic potential, which indicates FAM13A as a potential therapeutic target in lung cancer.
4. Materials and Methods
4.1. Materials
A549 (human non-small cell lung carcinoma) cell line was purchased from ATCC®, CORL-105 (Caucasian lung adenocarcinoma) cell line was purchased from ECACC® (The European Collection of Cell Cultures), supplied by Sigma-Aldrich (St. Louis, MO, USA), and lentivirus producer cell line (HEK-293T) was purchased from DSMZ. Cells were cultured in DMEM (Sigma Aldrich) (A549 and HEK293T) or RPMI 1640 (Lonza, Basel, Switzerland) (CORL-105) supplemented with 10% fetal bovine serum (FBS, Sigma-Aldrich), 1% penicillin/streptomycin, 4 mM L-glutamine in a humidified atmosphere with 5% CO2 at 37 °C. Cell lines were cultured according to ATCC/ECACC/DSMZ protocols. Cells were maintained in a humidified atmosphere with 5% CO2 and 95% air (normoxia) at 37 °C. For hypoxic conditions, cells were incubated in a hypoxic incubator (BINDER, CB53) with a humidified atmosphere of 5% CO2 and 1% O2 balanced with N2 (hypoxia). Exponentially growing cells were used throughout the study. All cell cultures were regularly checked for mycoplasma contamination by PCR and proved negative.
4.2. Plasmids and Constructs
Short hairpin RNAs (shRNAs) were designed using the UCSC Broad Institute GPP Web Portal (
Figure 1A) [
25]. Two independent shRNAs against FAM13A transcripts targeting different regions were chosen. shRNAs were designed against a coding sequence and targeted the majority of FAM13A isoforms containing the RhoGAP functional domain, essential for the protein function. shRNA template oligonucleotides were synthesized (Genomed, Poland)—FAM13A sh1 sense: 5′-GATCCGCAAGCCTAAACGTCAGAAATTTCAAGAGAATTTCTGACGTTTAGGCTTGCTTTTTG-3′; FAM13A sh1 antisense: 5′-AATTCAAAAAGCAAGCCTAAACGTCAGAAATTCTCTTGAAATTTCTGACGTTTAGGCTTGCG-3′; FAM13A sh2 sense: 5′-GATCCGGACAAATGACCTTGCCAAATTTCAAGAGAATTTGGCAAGGTCATTTGTCCTTTTTG-3′; FAM13A sh2 antisense: 5′-AATTCAAAAAGGACAAATGACCTTGCCAAATTCTCTTGAAATTTGGCAAGGTCATTTGTCCG-3′—annealed and cloned into a pGreenPuro lentiviral vector (System Biosciences, Palo Alto, CA, USA) backbone cut with EcoRI and BamHI (Thermo Scientific, Waltham, MA, USA). Annealed oligonucleotides were ligated into vector using T4 ligase. Two non-targeting control shRNA constructs were used: NT2—NT2 sense: 5′-GATCCGCAACAAGATGAAGAGCACCAACTCTTCAAGAGAGTTGTTCTACTTCTCGTGGTTGAGTTTTTG-3′; NT2 antisense: 5′-GCGTTGTTCTACTTCTCGTGGTTGAGAAGTTCTCTCAACAAGATGAAGAGCACCAACTCAAAAACTTAA-3′—and scrambled (SCR, obtained from System Biosciences). Control NT2 and SCR vectors were a kind gift from prof. Anke van den Berg and Dr. Joost Kluiver [
26]. All constructs were verified by Sanger sequencing. Detailed cloning information can be provided upon request.
4.3. Lentiviral shRNA Transduction
3rd generation 4-plasmid system for lentiviral particles production was used. Lentiviral vectors encoding FAM13Ash1, FAM13Ash2, CtrNT2 or CtrSCR were co-transfected with packaging vectors pMSCV-VSV-G, pRSV.REV and pMDL-gPRRE into HEK-293T cells using Calcium Phosphate Transfection Kit (Invitrogen, Carlsbad, CA, USA). Lentiviruses were generated according to the manufacturer’s protocol. Briefly, supernatants containing lentiviruses generated from HEK-293T cells were collected and filtered (0.45 µM syringe filter) 48 h and 72 h post-transfection and stored at −80 °C. A549 and CORL-105 were seeded in a 6-well plate at a density of 2.5 × 10⁵ and 5 × 10⁵ cells/well, respectively. After 24 h virus supernatant was added to cells together with polybrene (4 ug/mL). Medium was replaced after 24 h. The transduction efficiency was determined by flow cytometry (FlowSight, Amnis, Seattle, WA, USA) and fluorescence microscopy (Axio Vert A1, Zeiss, Oberkochen, Germany) based on percentage of GFP positive cells. The infection efficiency was over 90% in A549 cell line. For CORL-105 cells selection with 1.5 µg/mL puromycin was performed 48 h after transduction and the percentage of GFP-positive cells after 96 h of culture was over 90%. The names of generated cell lines were as follows: for FAM13A knockdown cells FAM13Ash1, FAM13Ash2 (cells transduced with FAM13A sh1RNA and sh2RNA vector); for control cells CtrNT2, CtrSCR (cells transduced with control NT2 and SCR vector).
4.4. Quantitative Analysis of mRNA Expression
A549 and CORL-105 cells were collected 7 days after transduction and washed with cold phosphate-buffered saline (PBS) twice. Then, 600 µL of cell lysis buffer RLT with β-mercaptoethanol (β-ME) was added to cell pellet. Total RNA was extracted using the RNeasy Mini Kit (Qiagen, Los Angeles, CA, USA) according to the manufacturer’s protocol and then 500 ng of RNA was reverse transcribed into cDNA using the QuantiTect Reverse Transcription Kit (Qiagen, USA). Quantitative real-time PCR analysis was performed using TaqMan probes directed at FAM13A (Thermo Fisher, Hs00208453_m1) and GUSB (Thermo Fisher, Hs00939627_m1) as a reference gene. The reactions were performed with an aliquot of cDNA equivalent of 5 ng total RNA and HOT FIREPol Probe qPCR Mix Plus (no ROX) according to the manufacturer’s instructions (Solis Biodyne, Tartu, Estonia) and under conditions specified in the TaqMan Gene Quantification assay protocol. Thermal cycling was performed using a CFX96 Touch™ Real-Time PCR Detection System (Bio-Rad, Hercules, CA, USA). The fold change value was calculated using 2
−ΔΔCt, described by K. Livak et al. [
27]. Each biological sample consisted of three technical replicates and three biological repeats were combined.
4.5. Western Blot
Cell lysis and protein extracts from A549 and CORL-105 cells were prepared using RIPA lysis buffer (R0278, Sigma) with addition of Protease Inhibitor Cocktail (PIC002.1, Bioshop, Canada). Protein concentration was determined using the Bicinchoninic Acid Kit, BCA (BCA1-1KT, Sigma). 30 µg of protein were mixed with Laemmli Sample Buffer (Sigma), resolved on the Mini-PROTEAN Stain-free gel (BioRad) with Mini-PROTEAN® Tetra electrophoresis system (BioRad) and transferred to PVDF membranes using the Trans-Blot® Turbo™ system. Membranes were blocked with 5% milk and incubated with anti-FAM13A antibody (ab122440, Abcam, 1:500, Cambridge, UK) overnight at 4 °C. After incubation with horseradish peroxidase-conjugated anti-rabbit secondary antibody (ab97051, Abcam, 1:50,000), the signal was detected by chemiluminescence with Clarity Western ECL Substrate using ChemiDoc™ Imaging Systems (BioRad). Normalization of FAM13A protein abundance was made in reference to total protein staining. Gel and blot images were analyzed by Image Lab™ Software (BioRad).
4.6. Cell Proliferation Assessment by MTS Test
Cell proliferation rate was determined by CellTiter™ AQueous assay (MTS, Promega, Madison, WI, USA). Cells were seeded at the following densities: A549: 5 × 10
3 and 1 × 10
4 cells/well and CORL-105: 1 × 10
4 and 2 × 10
4 cells/well, in 100 µL of standard medium in 96-well plates and cultured for two days in normal and hypoxic atmosphere. 20 µL of CellTiter 96
® AQueous One Solution Reagent ([3-(4,5-dimethylthiazol-2-yl)-5-(3-carboxymethoxyphenyl)-2-(4-sulfophenyl)-2H-tetrazolium, inner salt) was added to each well. After 4 h of incubation, the absorbance was read at 490 nm with a microplate reader (Bio Tek, ELx808, Winooski, VT, USA). Four technical replicates were prepared for each sample in three separate experiments. Cell proliferation rates were calculated by: (mean OD treated well [−blank])/(mean OD control well [−blank]) × 100, as described by Prabst et al. [
28].
4.7. Violet Proliferation Dye
Violet Proliferation Dye 450 (VPD450, BD Horizon™, Piscataway, NJ, USA) was used for cell proliferation assessment. The violet laser excitable dye VPD450 emits maximally at 450 nm with minimal fluorescent spillover into the FITC channel, which is eligible for use with green fluorescent protein (GFP)-tagged cells. The optimal condition of VPD450 labeling were established for A549 (5 × 10
6 cells/mL) and CORL-105 (1 × 10
6 cells/mL). Cells were washed twice in 1 × PBS to remove any residual serum proteins and resuspended into a single cell suspension at a concentration of 1–10 × 10
6/mL in 1 × PBS. Subsequently, 1 µL of 1 mM VPD450 stock solution (in DMSO) was added for each 1 mL of cell suspension for a final VPD450 concentration of 1 µM. After incubation in a 37 °C water bath for 20 min, cells were washed with 9 mL of 1 × PBS and centrifuged. The cell pellet was washed with 10 mL of complete medium with 10% FBS and centrifuged again. Cells were resuspended in complete medium (DMEM or RPMI1640, with 10% FBS) and cultured for 4–5 days in hypoxia and normal oxygen tension. Analysis by flow cytometry (Flow Sight
®, Amnis) was taken every 24 h, in total 6 time points. Experiments were conducted in triplicates. Flow cytometry data were analyzed by IDEAS
® software (Image Data Exploration and Analysis Software, Amnis). Proliferation index (PI) was calculated with the formula: PI = Log[FInd/MFIall]/Log [
2], with MFIall = median fluorescence intensity of all viable cells and FInd = peak fluorescence intensity of the viable non-divided cells, as described by Biburger [
29]. The measurement of cell growth kinetics was done after proliferation index calculation (PI), where the VPD450 fluorescence intensity on the first day was used to set the “zero” population.
4.8. Cell Cycle Analysis
Additionally, for A549 cells a 5-bromo-2 deoxyuridine (BrdU) incorporation assay was conducted to monitor DNA replication using a APC-BrdU Flow Kit (BD Bioscience, San Jose, CA, USA) with 7AAD staining according to the manufacturer’s instructions. Cell data were collected with CytoFLEX S flow cytometer (Beckman Coulter).
4.9. Wound-Healing Assay (WH)
The wound-healing assay mimics tumor cell migration in vivo. The migration rates of the FAM13Ash A549 and CORL-105 versus control cells were evaluated using the wound healing assay under normoxic and hypoxic conditions. FAM13Ash A549/CORL-105 and control cells were incubated for 24 h in low serum concentration (serum starvation, 1% of FBS) to suppress cell proliferation. We used CytoSelect™ Wound Healing Assay Kit (Cell Biolabs, San Diego, CA, USA), which includes inserts that generate a defined gap of 0.9 mm for measuring the migratory rates. All experiments were performed according to the vendor protocol. The WH Inserts™ were placed in 24-well plate in the same direction. Cell suspension containing 0.25–0.5 × 10
6 cells/mL in low serum media was added to the open end at the top of the insert. The cells were incubated overnight to form the monolayer. After 24 h inserts were removed from wells, cells were washed with media to remove dead cells and debris. Finally, fresh low serum medium was added to wells. Cells were incubated in normoxia and hypoxia for 96 h. The wound healing closure was visualized under a light microscope. Phase contrast images were taken in 24 h intervals. The migration rate was calculated as the percentage of area reduction or wound closure, as described by Rotzer et al. [
30]. Each sample consisted of three technical and three biological repeats.
Additionally, A549 cells were monitored using the JuLI FL system (NanoEnTek, Korea) for live cells imaging, in normal oxygen tension. A549 cells were seeded in a 12-well plate at a density of 1–1.5 × 10⁵ cells/well and after 24 h of growth cells reached ~90% confluency as a monolayer. Then, the cells were cultured in DMEM with 1% FBS (low-serum culture media) for 24 h. After scratching, cells were cultured for additional 48 h in fresh low-serum culture media to allow wound healing. During culturing, images were taken at 6 h intervals and used to prepare the migration rate curves as well as the time-laps video. The video was prepared using the wound healing monitoring mode that is based on the analysis of cells confluency. The experiment was repeated three times.
4.10. Immunofluorescence
The A549 cells were grown on glass coverslips under hypoxia/normoxia for 72 h. The cells were washed and then fixed with 4% paraformaldehyde for 15 min. Fixed cells were permeabilized by treatment with 0.5% TritonX-100 for 15 min and blocked by incubation with 5% BSA in PBS for 1 h. The cells were then incubated with Alexa Fluor® 568 phalloidin for 1 h, according to the manufacturer protocol. The cells were mounted in ProLong™ Gold Antifade Mountant with DAPI. The cells were observed under a fluorescence microscope, 63× magnification (Leica DMi8).
4.11. Cell Invasion Assay
The invasion assay was conducted using modified Boyden chamber by CytoSelect™ Cell Invasion Assay Kit (Cell Biolabs, USA). This assay uses polycarbonate membrane inserts (8 µm pore size). The upper surface of the insert membrane is coated with a basement membrane matrix solution. All experiments were done in accordance to the vendor protocol. The basement membrane layer of inserts was rehydrated by adding 300 µL of warm, serum-free media and incubation at room temperature for 1 h. Cell suspensions containing 0.4 × 10⁶ A549 cells/mL and 1.0 × 10⁶ CORL-105 cells/mL were prepared in serum free media (DMEM, RPMI1640, respectively, both containing 0.5% BSA). Overnight starvation was performed in both cell lines prior to running the assay. Then, 300 µL of cell suspension was added into the upper well and 500 µL of complete culture medium containing 10% of FBS was added into the lower well of the insert. After incubation for 48 h at 37 °C in 5% CO2, normal or hypoxic atmosphere, the medium was aspirated from the inside of the insert. In the upper chamber, non-invasive cells were removed with a cotton swab. Invasive cells, at the bottom of the insert, were placed in 200 µL of Extraction Solution and incubated for 10 min on an orbital shaker. Subsequently, 100 µL from each sample was transferred to a 96-well microtiter plate and the OD 560 nm was measured in a colorimetric plate reader (Bio Tek, ELx808). All experiments were conducted in three biological and two technical repeats.
4.12. Detection of Cell Apoptosis Using Flow Cytometry
APC Annexin V Apoptosis Detection Kit with 7-AAD (BD Biosciences, San Jose, CA, USA) was used for the identification of apoptotic and necrotic cells. All experiments were taken according to manufacturer’s protocol. A549 and CORL-105 cells were collected, washed twice with cold PBS and then resuspend in 1× Binding Buffer at a concentration of 1 × 10⁶ cells/mL. Subsequently, 1 × 10⁵ cells were stained with addition of 5 µL of APC Annexin V and 5 µL of 7-AAD. After incubation (15 min. at 25 °C, in the dark), 400 µL of 1× Binding Buffer was added to each tube and analyzed by flow cytometry within an hour (Flow Sight®, Amnis). In parallel, a set of control samples were used as follows:
unstained cells (wild type and after transduction with lentivectors with GFP marker),
apoptosis control: cells stained with APC Annexin V (cells that undergo apoptosis after addition of camptothecin, final concentration 6 µM, to 1 × 10⁶ A549 and CORL-105 wild type cells and incubation for 24 h at 37 °C),
necrosis control: cells stained with 7-AAD (A549, CORL-105 wild type cells incubated at 96 °C for 10 min.)
Experiments were prepared in triplicates. Analysis of flow cytometry results was performed using IDEAS® (Image Data Exploration and Analysis Software, Amnis).
4.13. Statistical Analysis
All experiments were performed in triplicate if not mentioned otherwise. The results of multiple observations are presented as the mean ± SEM or as a representative result of more than three different separate experiments, unless otherwise stated. Data were analyzed with GraphPad Prism (GraphPad Prism 5 Software, San Diego, CA, USA), using the statistical test stated in the figure legends and values were considered significant at
p < 0.05. Continuous data were compared using t-tests for two independent groups and one-way ANOVA for 3 or more groups. For evaluation of continuous outcomes over time, two-way ANOVA followed by Bonferroni’s post hoc test was used to analyze the time-course curve for the analyzed process (wound healing assay, proliferation index assessment by VPD450, MTS) [
31].


 ,
, 


