
AS-Quant: Detection and Visualization of Alternative Splicing Events with RNA-seq Data

 and
and
Abstract
:1. Introduction
2. Results
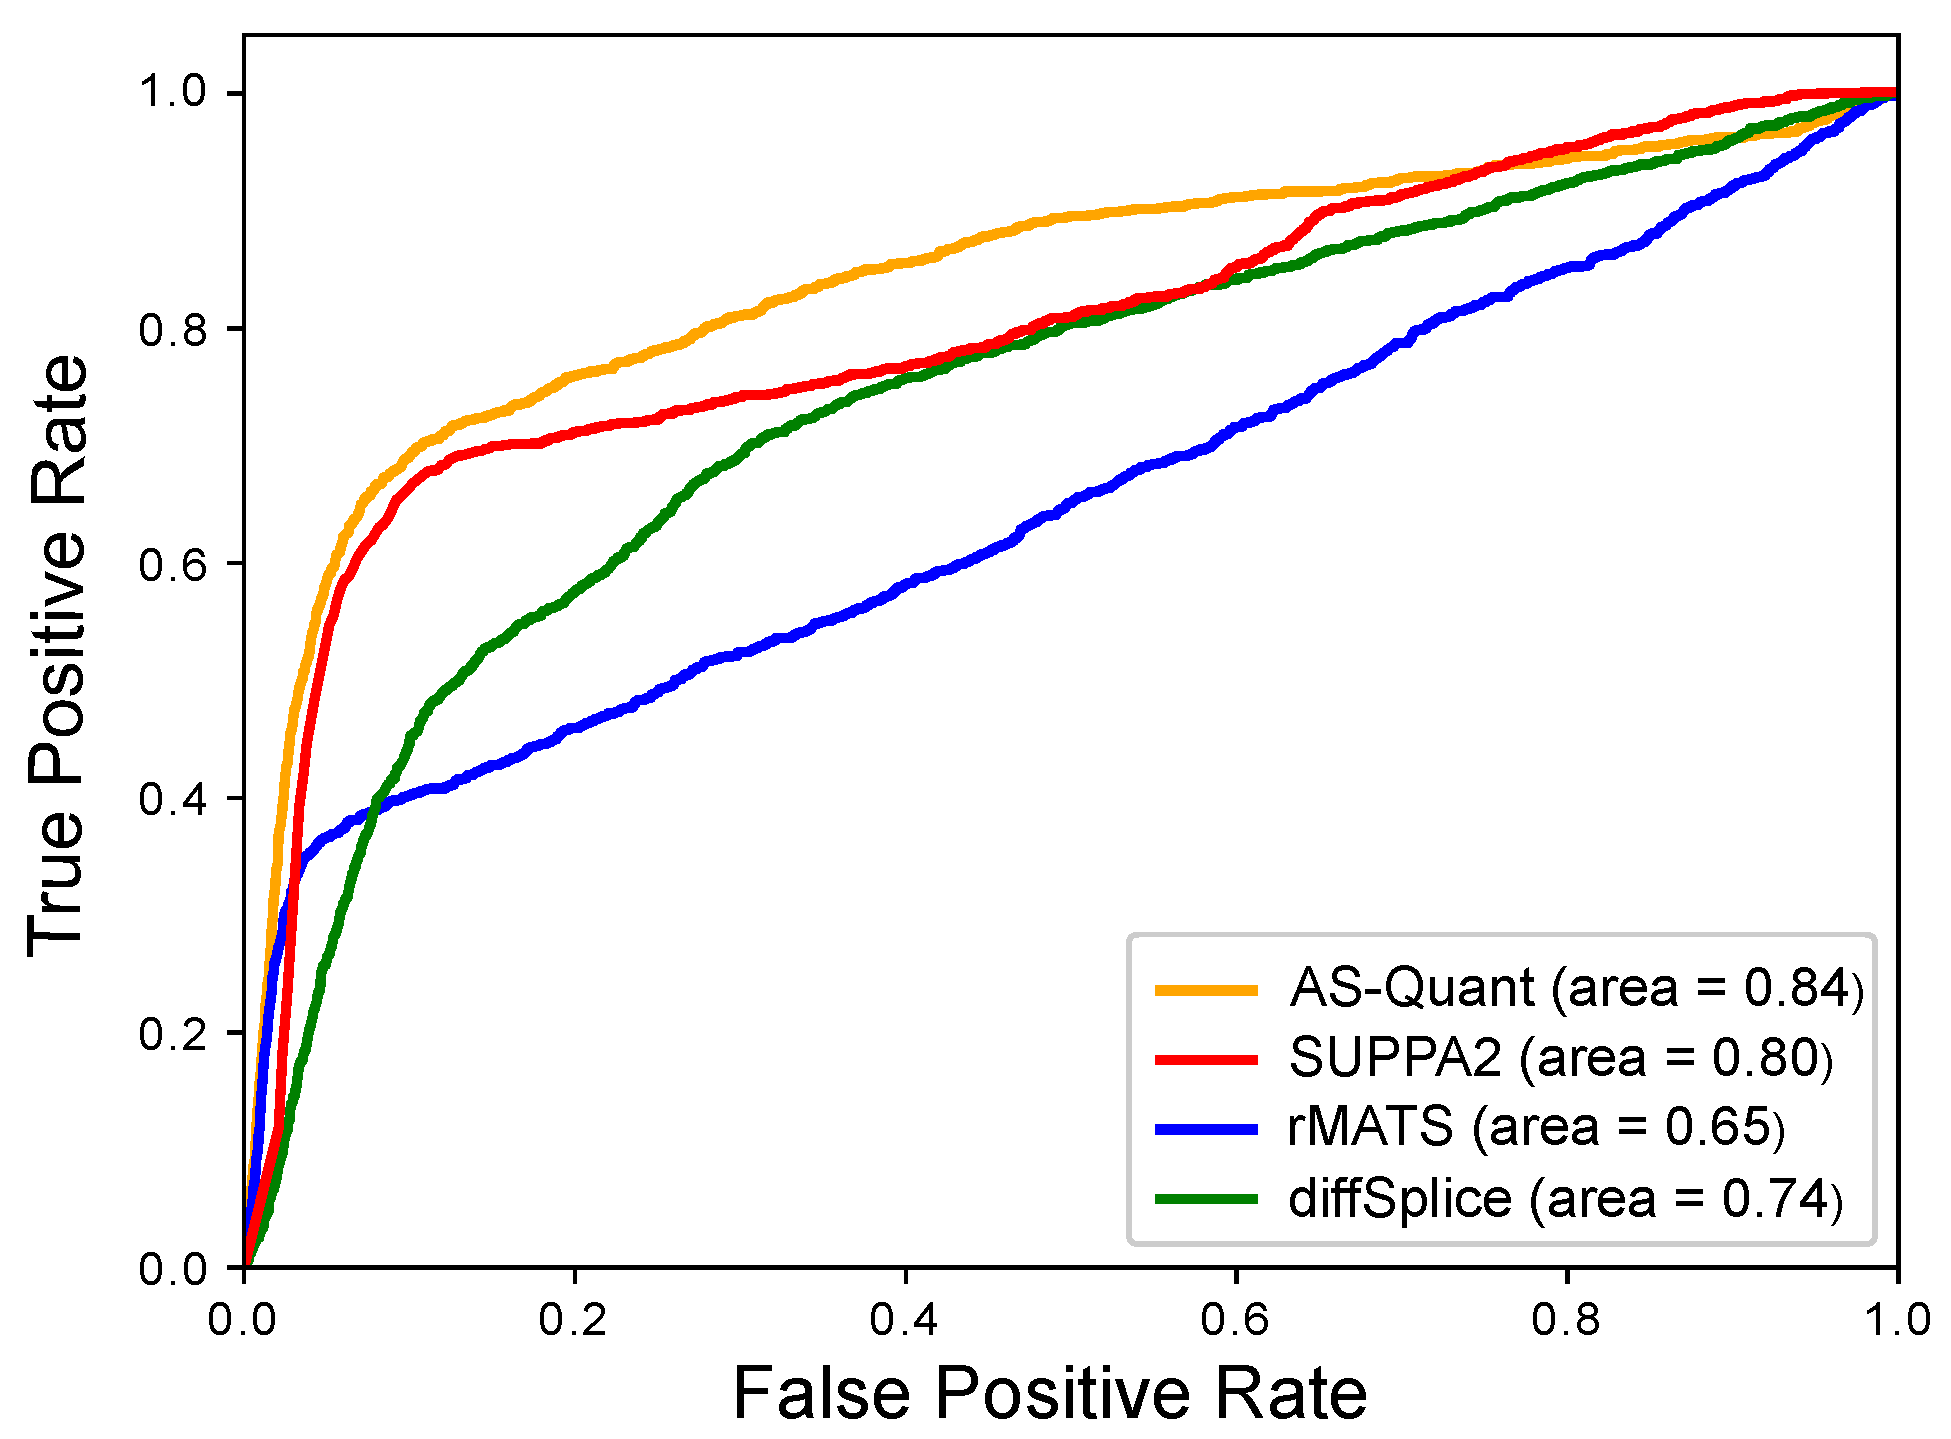
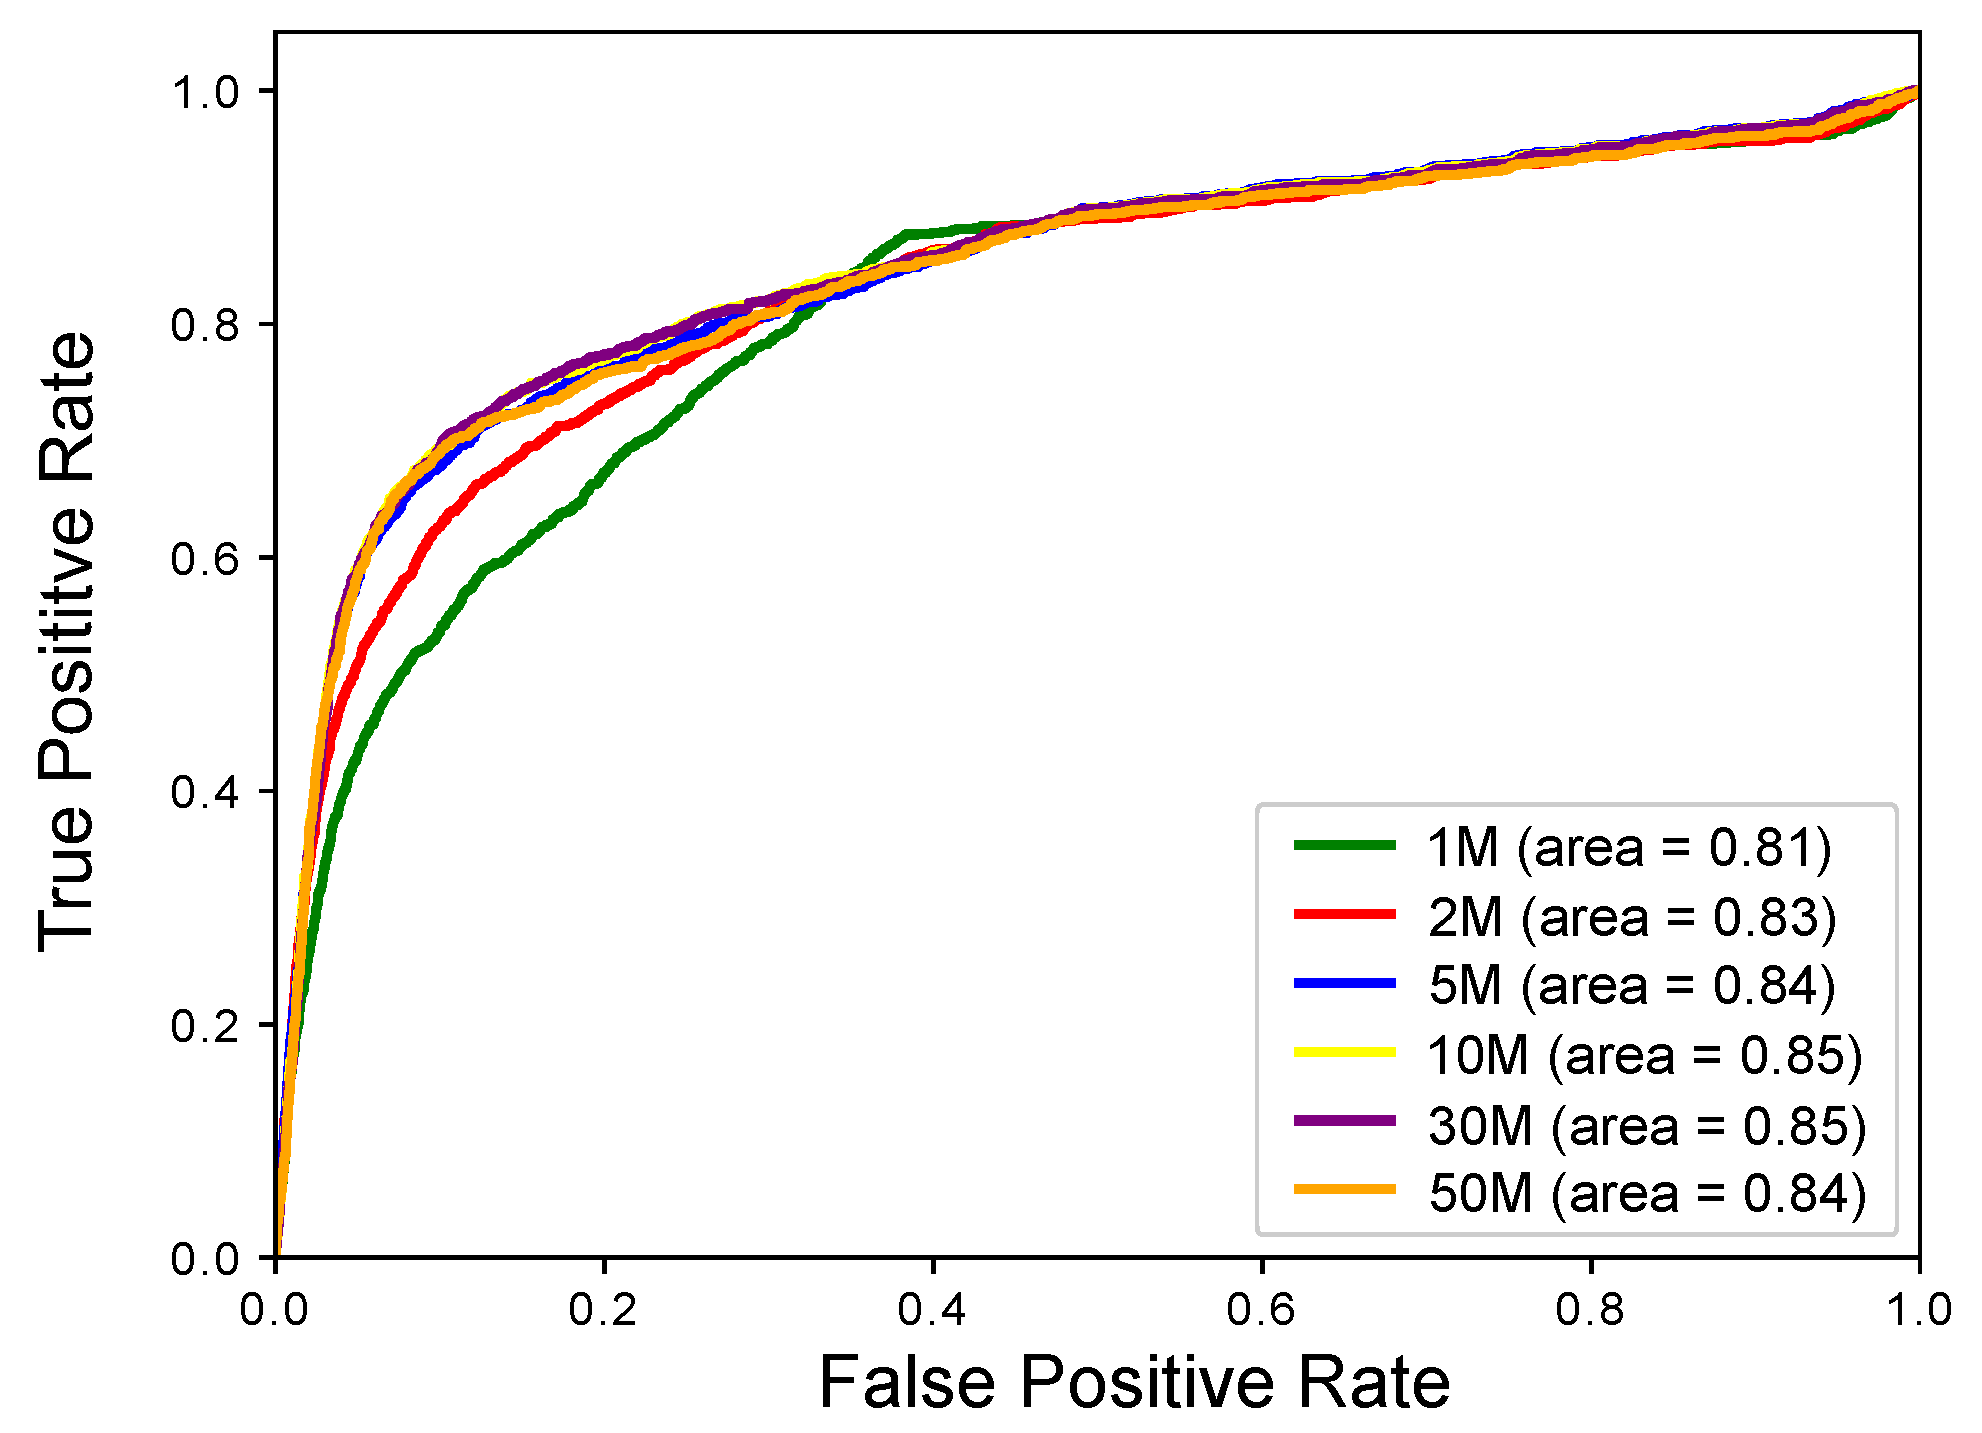
2.1. Experimental Results with Simulated RNA-seq Data
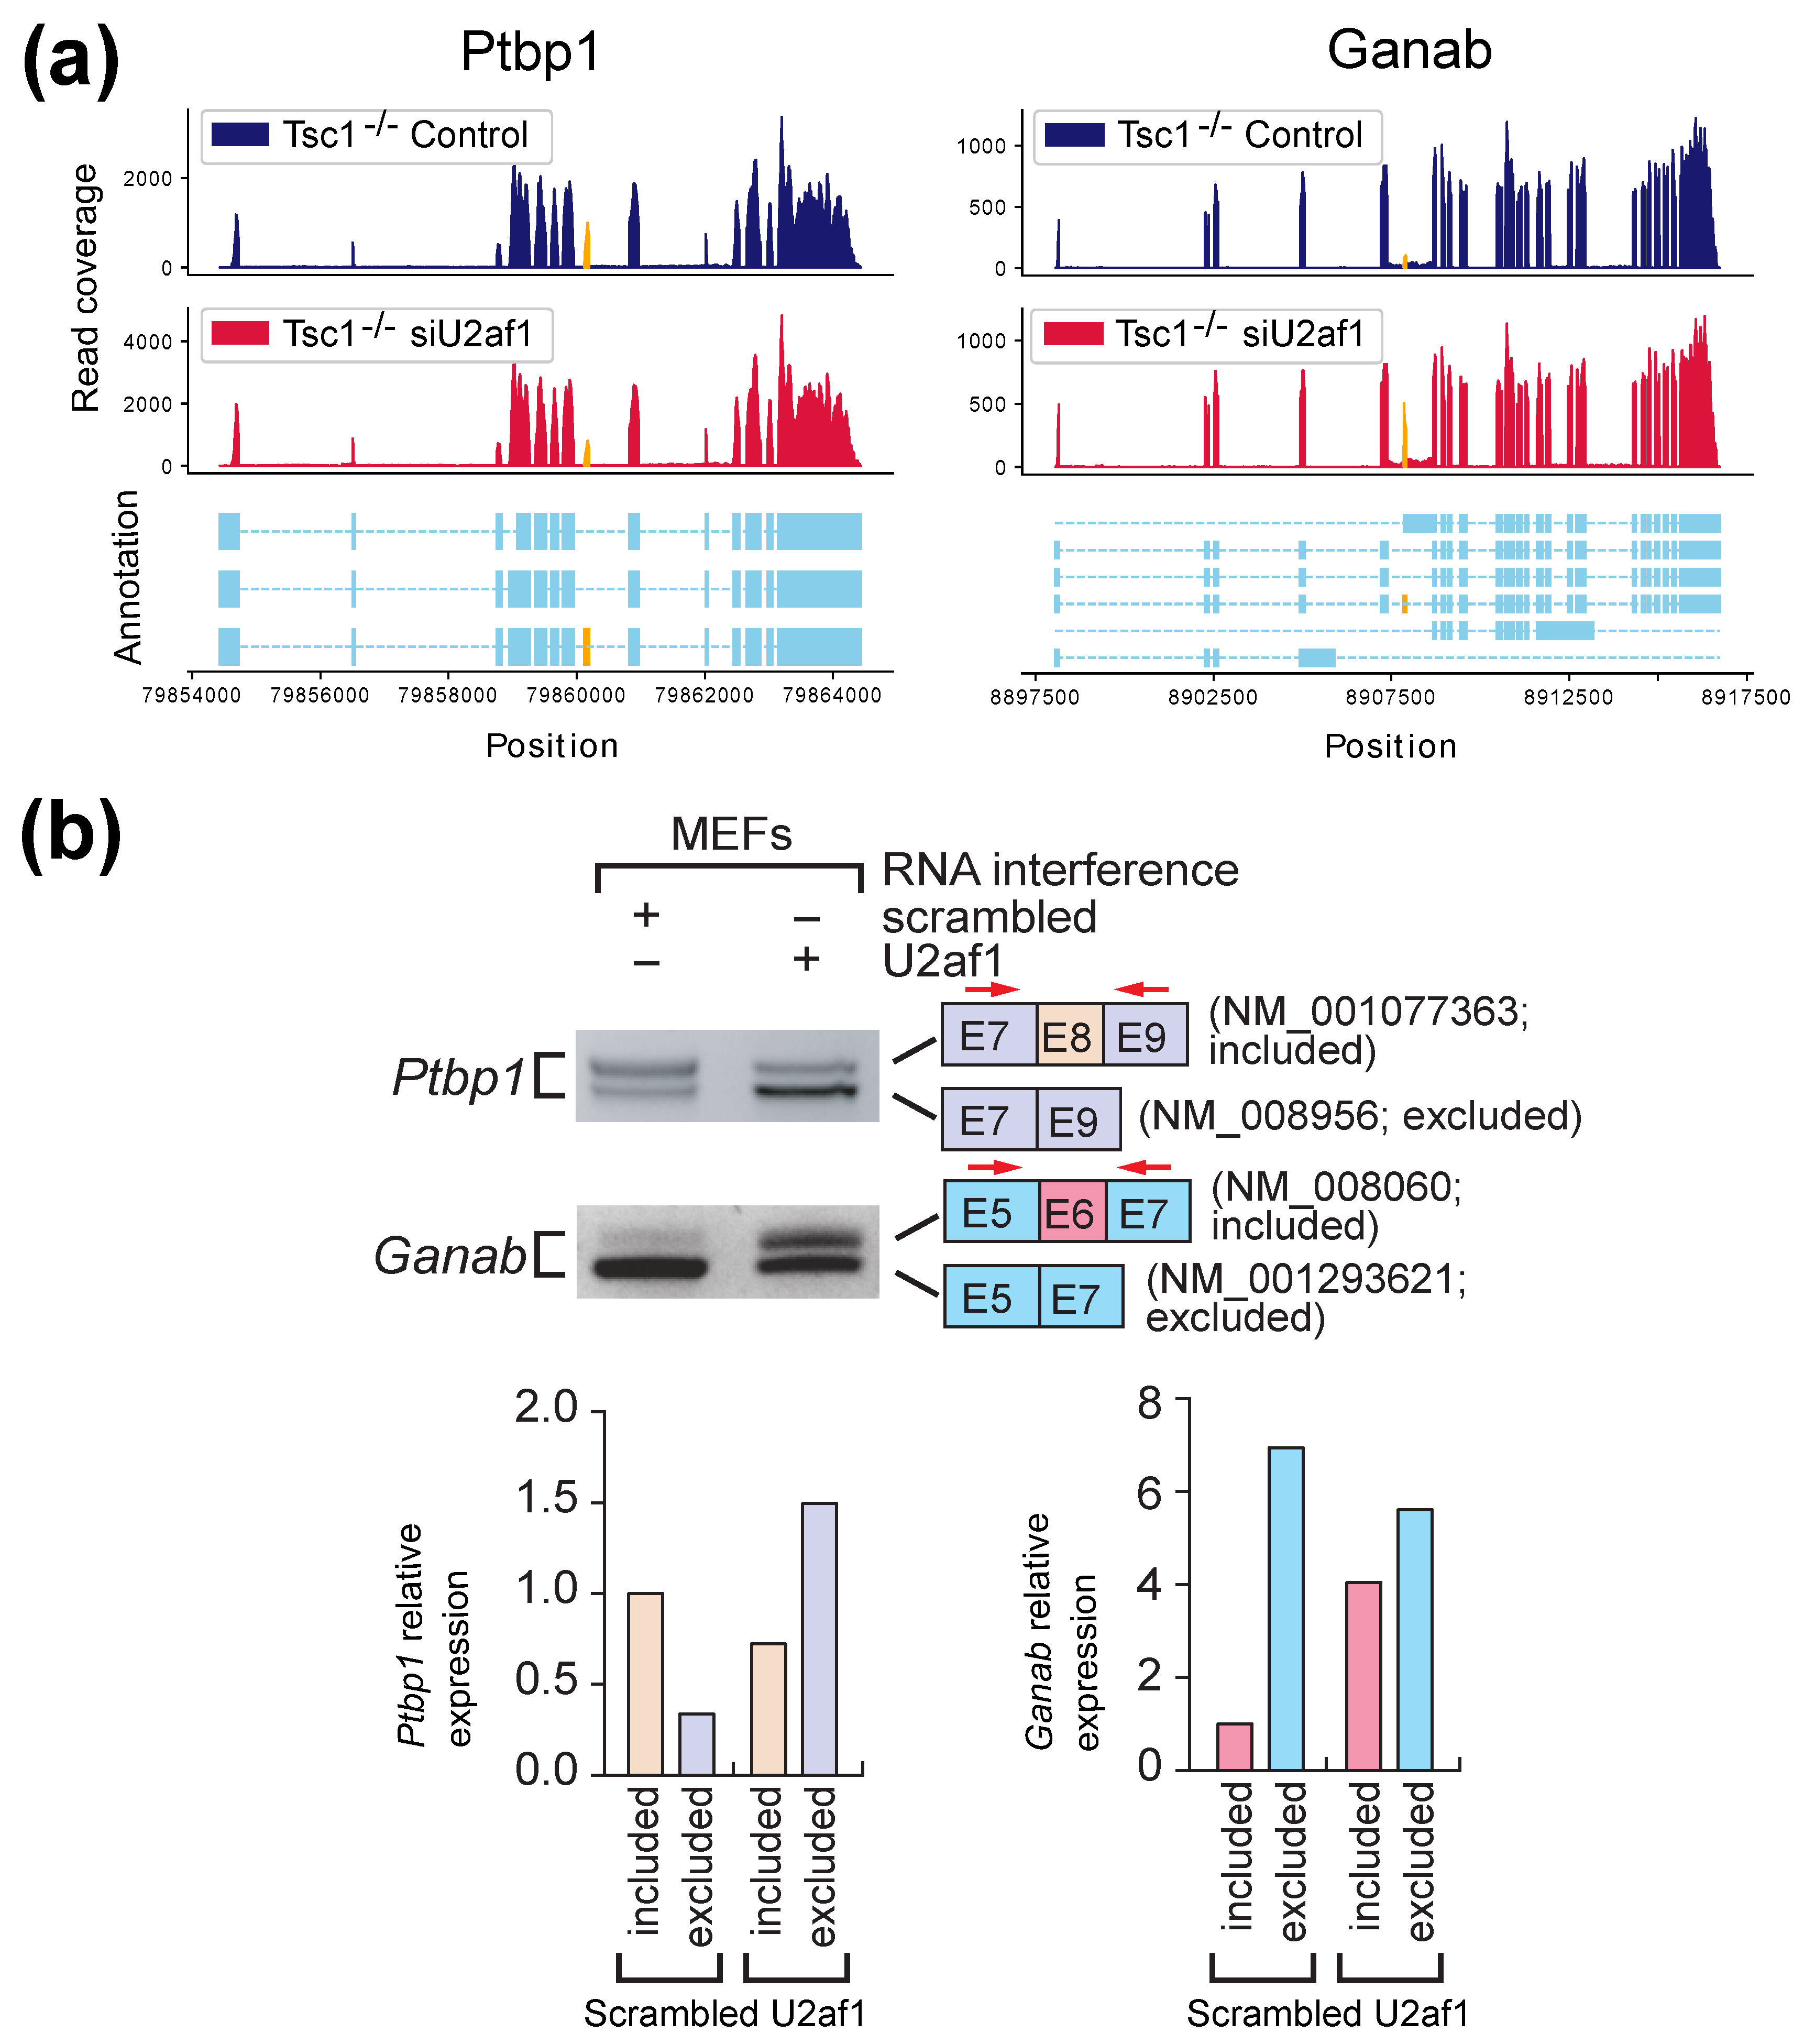
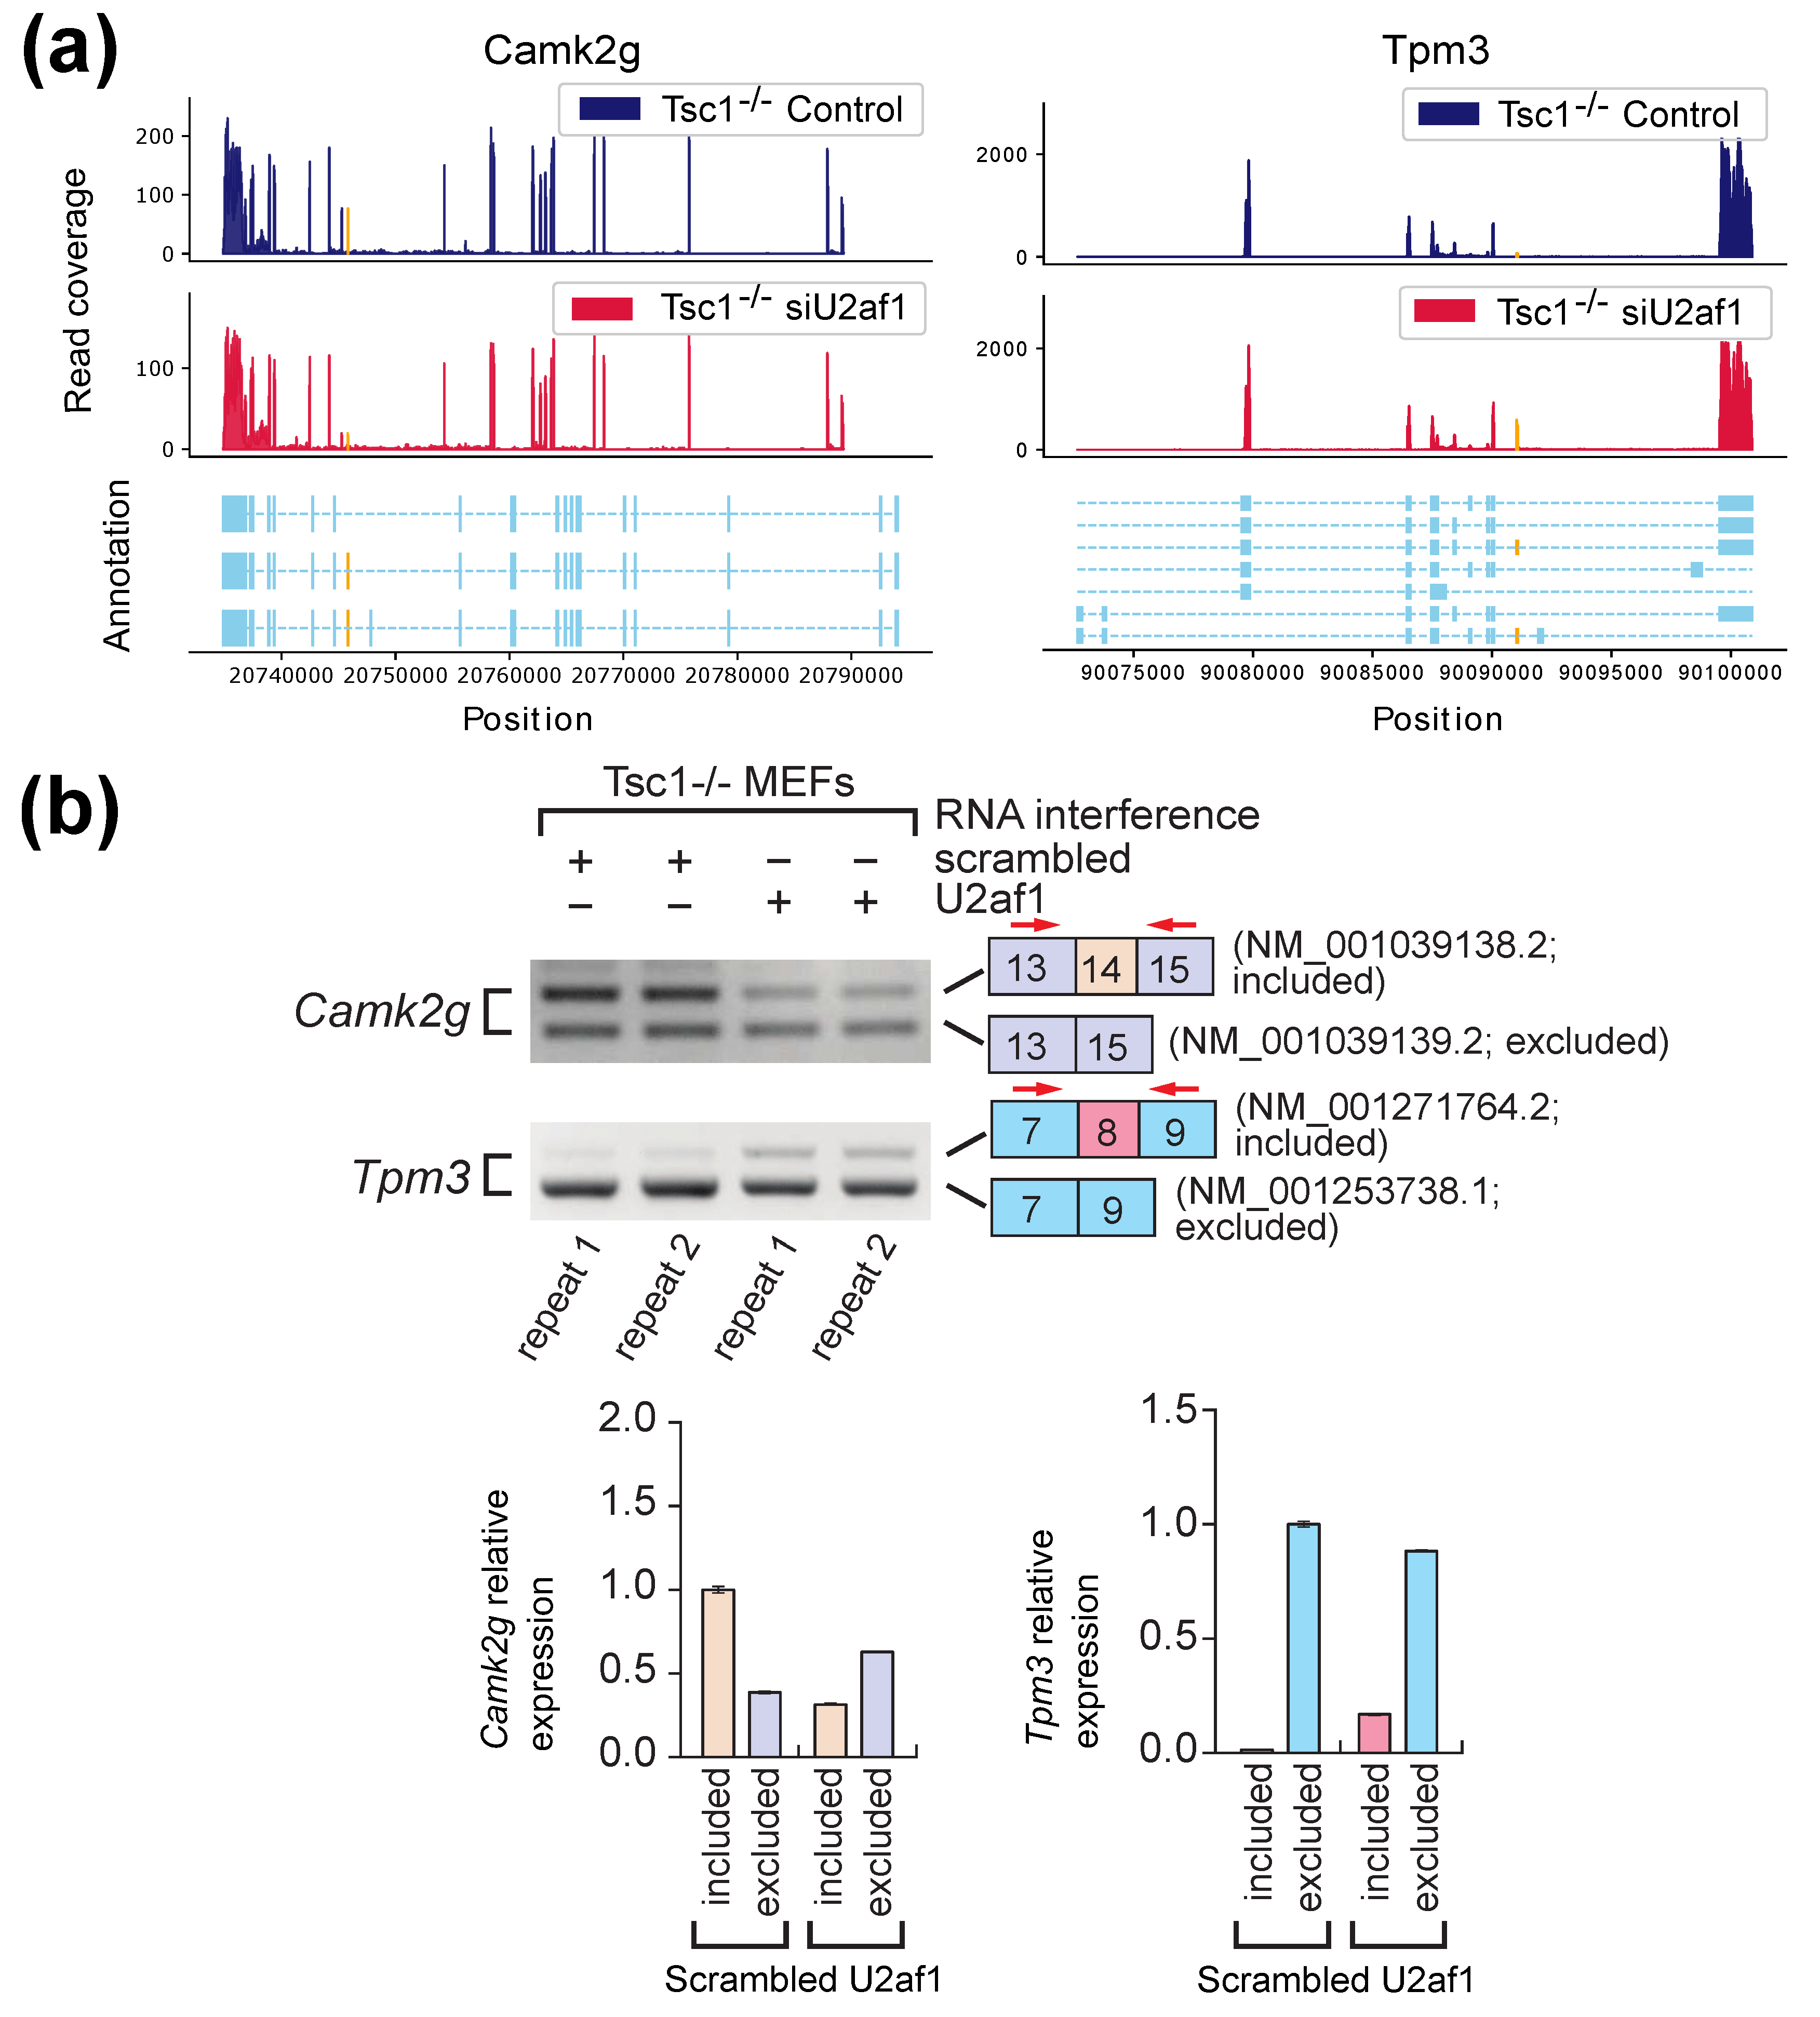
2.2. Experimental Results with Mouse Embryonic Fibroblasts (MEFs) Samples
3. Discussion
4. Materials and Methods
5. Conclusions
Supplementary Materials
Author Contributions
Funding
Institutional Review Board Statement
Informed Consent Statement
Data Availability Statement
Conflicts of Interest
Abbreviations
| AS-Quant | Alternative Splicing itation |
| RT-PCR | Reverse Transcription Polymerase Chain Reaction |
| MEFs | Mouse Embryonic Fibroblasts |
| FDR | False Discovery Rate |
| JSD | Jensen–Shannon Divergence |
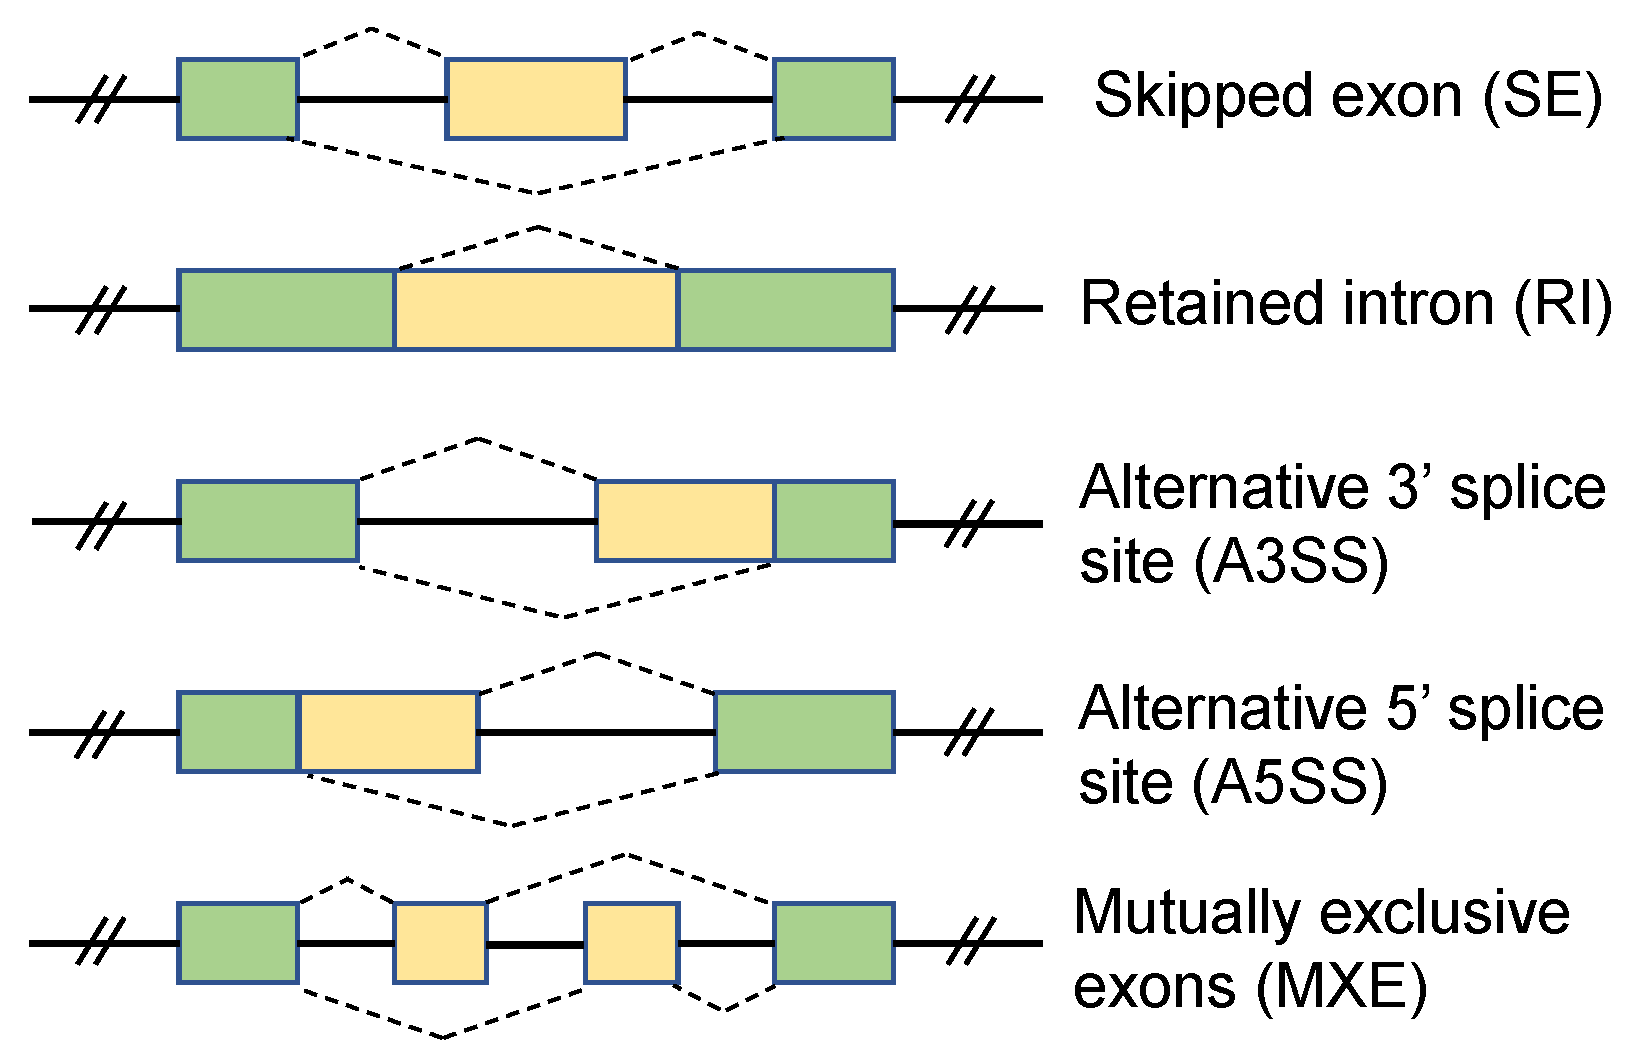
| SE | Skipped Exon |
| MXE | Mutually Exclusive Exon |
| RI | Retained Intron |
| A5SS | Alternative 5’ Splice Site |
| A3SS | Alternative 3’ Splice Site |
References
- Zhiguo, E.; Wang, L.; Zhou, J. Splicing and alternative splicing in rice and humans. BMB Rep. 2013, 46, 439. [Google Scholar]
- Wang, Y.; Liu, J.; Huang, B.; Xu, Y.M.; Li, J.; Huang, L.F.; Lin, J.; Zhang, J.; Min, Q.H.; Yang, W.M.; et al. Mechanism of alternative splicing and its regulation. Biomed. Rep. 2015, 3, 152–158. [Google Scholar] [CrossRef] [PubMed] [Green Version]
- Chang, J.W.; Yeh, H.S.; Park, M.; Erber, L.; Sun, J.; Cheng, S.; Bui, A.M.; Fahmi, N.A.; Nasti, R.; Kuang, R.; et al. mTOR-regulated U2af1 tandem exon splicing specifies transcriptome features for translational control. Nucleic Acids Res. 2019, 47, 10373–10387. [Google Scholar] [CrossRef] [PubMed] [Green Version]
- Shen, S.; Park, J.W.; Huang, J.; Dittmar, K.A.; Lu, Z.X.; Zhou, Q.; Carstens, R.P.; Xing, Y. MATS: A Bayesian framework for flexible detection of differential alternative splicing from RNA-Seq data. Nucleic Acids Res. 2012, 40, e61. [Google Scholar] [CrossRef] [PubMed]
- Zhang, W.; Chang, J.W.; Lin, L.; Minn, K.; Wu, B.; Chien, J.; Yong, J.; Zheng, H.; Kuang, R. Network-based isoform quantification with RNA-seq data for cancer transcriptome analysis. PLoS Comput. Biol. 2015, 11, e1004465. [Google Scholar] [CrossRef] [PubMed] [Green Version]
- Sun, J.; Chang, J.W.; Zhang, T.; Yong, J.; Kuang, R.; Zhang, W. Platform-integrated mRNA Isoform Quantification. Bioinformatics 2020, 36, 2466–2473. [Google Scholar] [CrossRef] [PubMed]
- Hu, Y.; Huang, Y.; Du, Y.; Orellana, C.F.; Singh, D.; Johnson, A.R.; Monroy, A.; Kuan, P.F.; Hammond, S.M.; Makowski, L.; et al. DiffSplice: The genome-wide detection of differential splicing events with RNA-seq. Nucleic Acids Res. 2013, 41, e39. [Google Scholar] [CrossRef] [PubMed]
- Shen, S.; Park, J.W.; Lu, Z.X.; Lin, L.; Henry, M.D.; Wu, Y.N.; Zhou, Q.; Xing, Y. rMATS: Robust and flexible detection of differential alternative splicing from replicate RNA-Seq data. Proc. Natl. Acad. Sci. USA 2014, 111, E5593–E5601. [Google Scholar] [CrossRef] [PubMed] [Green Version]
- Trincado, J.L.; Entizne, J.C.; Hysenaj, G.; Singh, B.; Skalic, M.; Elliott, D.J.; Eyras, E. SUPPA2: Fast, accurate, and uncertainty-aware differential splicing analysis across multiple conditions. Genome Biol. 2018, 19, 1–11. [Google Scholar] [CrossRef] [PubMed] [Green Version]
- Zhang, Z.; Pan, Z.; Ying, Y.; Xie, Z.; Adhikari, S.; Phillips, J.; Carstens, R.P.; Black, D.L.; Wu, Y.; Xing, Y. Deep-learning augmented RNA-seq analysis of transcript splicing. Nat. Methods 2019, 16, 307. [Google Scholar] [CrossRef] [PubMed]
- Griebel, T.; Zacher, B.; Ribeca, P.; Raineri, E.; Lacroix, V.; Guigó, R.; Sammeth, M. Modelling and simulating generic RNA-Seq experiments with the flux simulator. Nucleic Acids Res. 2012, 40, 10073–10083. [Google Scholar] [CrossRef] [PubMed]
- Oshlack, A.; Robinson, M.D.; Young, M.D. From RNA-seq reads to differential expression results. Genome Biol. 2010, 11, 220. [Google Scholar] [CrossRef] [PubMed] [Green Version]
- Patro, R.; Duggal, G.; Love, M.I.; Irizarry, R.A.; Kingsford, C. Salmon provides fast and bias-aware quantification of transcript expression. Nat. Methods 2017, 14, 417–419. [Google Scholar] [CrossRef] [PubMed] [Green Version]
- Mollet, I.; Barbosa-Morais, N.L.; Andrade, J.; Carmo-Fonseca, M. Diversity of human U2AF splicing factors: Based on the EMBO Lecture delivered on 7 July 2005 at the 30th FEBS Congress in Budapest. FEBS J. 2006, 273, 4807–4816. [Google Scholar] [CrossRef] [PubMed]
- Kim, D.; Pertea, G.; Trapnell, C.; Pimentel, H.; Kelley, R.; Salzberg, S.L. TopHat2: Accurate alignment of transcriptomes in the presence of insertions, deletions and gene fusions. Genome Biol. 2013, 14, 1–13. [Google Scholar] [CrossRef] [PubMed] [Green Version]
- Li, H.; Handsaker, B.; Wysoker, A.; Fennell, T.; Ruan, J.; Homer, N.; Marth, G.; Abecasis, G.; Durbin, R. The sequence alignment/map format and SAMtools. Bioinformatics 2009, 25, 2078–2079. [Google Scholar] [CrossRef] [PubMed] [Green Version]


| Method | AUC | Sensitivity | Specificity |
|---|---|---|---|
| AS-Quant | 0.84 | 0.64 | 0.98 |
| SUPPA2 | 0.80 | 0.44 | 0.97 |
| rMATS | 0.65 | 0.22 | 0.49 |
| diffSplice | 0.74 | 0.05 | 0.79 |
| AS Type | Method | AUC | Sensitivity | Specificity |
|---|---|---|---|---|
| AS-Quant | 0.97 | 0.60 | 1.00 | |
| SE | SUPPA2 | 0.84 | 0.64 | 0.99 |
| rMATS | 0.84 | 0.80 | 0.50 | |
| diffSplice | 0.72 | 0.31 | 0.95 | |
| AS-Quant | 0.78 | 0.31 | 1.00 | |
| RI | SUPPA2 | 0.63 | 0.09 | 1.00 |
| rMATS | 0.58 | 0.30 | 0.50 | |
| diffSplice | 0.53 | 0.01 | 0.98 | |
| AS-Quant | 0.98 | 0.91 | 0.82 | |
| MXE | SUPPA2 | 0.66 | 0.37 | 1.00 |
| rMATS | 0.76 | 0.69 | 0.50 | |
| diffSplice | 0.46 | 0.03 | 1.00 | |
| AS-Quant | 0.99 | 0.78 | 1.00 | |
| A3SS | SUPPA2 | 0.80 | 0.56 | 0.99 |
| rMATS | 0.49 | 0.58 | 0.50 | |
| diffSplice | 0.62 | 0.03 | 0.51 | |
| AS-Quant | 0.71 | 0.50 | 0.97 | |
| A5SS | SUPPA2 | 0.83 | 0.66 | 0.99 |
| rMATS | 0.46 | 0.57 | 0.50 | |
| diffSplice | 0.58 | 0.03 | 0.51 |
| SE | RI | MXE | A3SS | A5SS | |
|---|---|---|---|---|---|
| AS-Quant | 257 | 5 | 43 | 101 | 30 |
| SUPPA2 | 172 | 46 | 12 | 121 | 117 |
| rMATS | 1128 | 15 | 129 | 51 | 16 |
| diffSplice | 169 | 560 | 0 | 1125 | |
Publisher’s Note: MDPI stays neutral with regard to jurisdictional claims in published maps and institutional affiliations. |
© 2021 by the authors. Licensee MDPI, Basel, Switzerland. This article is an open access article distributed under the terms and conditions of the Creative Commons Attribution (CC BY) license (https://creativecommons.org/licenses/by/4.0/).
Share and Cite
Fahmi, N.A.; Nassereddeen, H.; Chang, J.; Park, M.; Yeh, H.; Sun, J.; Fan, D.; Yong, J.; Zhang, W. AS-Quant: Detection and Visualization of Alternative Splicing Events with RNA-seq Data. Int. J. Mol. Sci. 2021, 22, 4468. https://0-doi-org.brum.beds.ac.uk/10.3390/ijms22094468
Fahmi NA, Nassereddeen H, Chang J, Park M, Yeh H, Sun J, Fan D, Yong J, Zhang W. AS-Quant: Detection and Visualization of Alternative Splicing Events with RNA-seq Data. International Journal of Molecular Sciences. 2021; 22(9):4468. https://0-doi-org.brum.beds.ac.uk/10.3390/ijms22094468
Chicago/Turabian StyleFahmi, Naima Ahmed, Heba Nassereddeen, Jaewoong Chang, Meeyeon Park, Hsinsung Yeh, Jiao Sun, Deliang Fan, Jeongsik Yong, and Wei Zhang. 2021. "AS-Quant: Detection and Visualization of Alternative Splicing Events with RNA-seq Data" International Journal of Molecular Sciences 22, no. 9: 4468. https://0-doi-org.brum.beds.ac.uk/10.3390/ijms22094468