
Near-Complete Remission of Glioblastoma in a Patient Treated with an Allogenic Dendritic Cell-Based Vaccine: The Role of Tumor-Specific CD4+T-Cell Cytokine Secretion Pattern in Predicting Response and Recurrence

 , , ,
, , ,  , ,
, ,  , , and
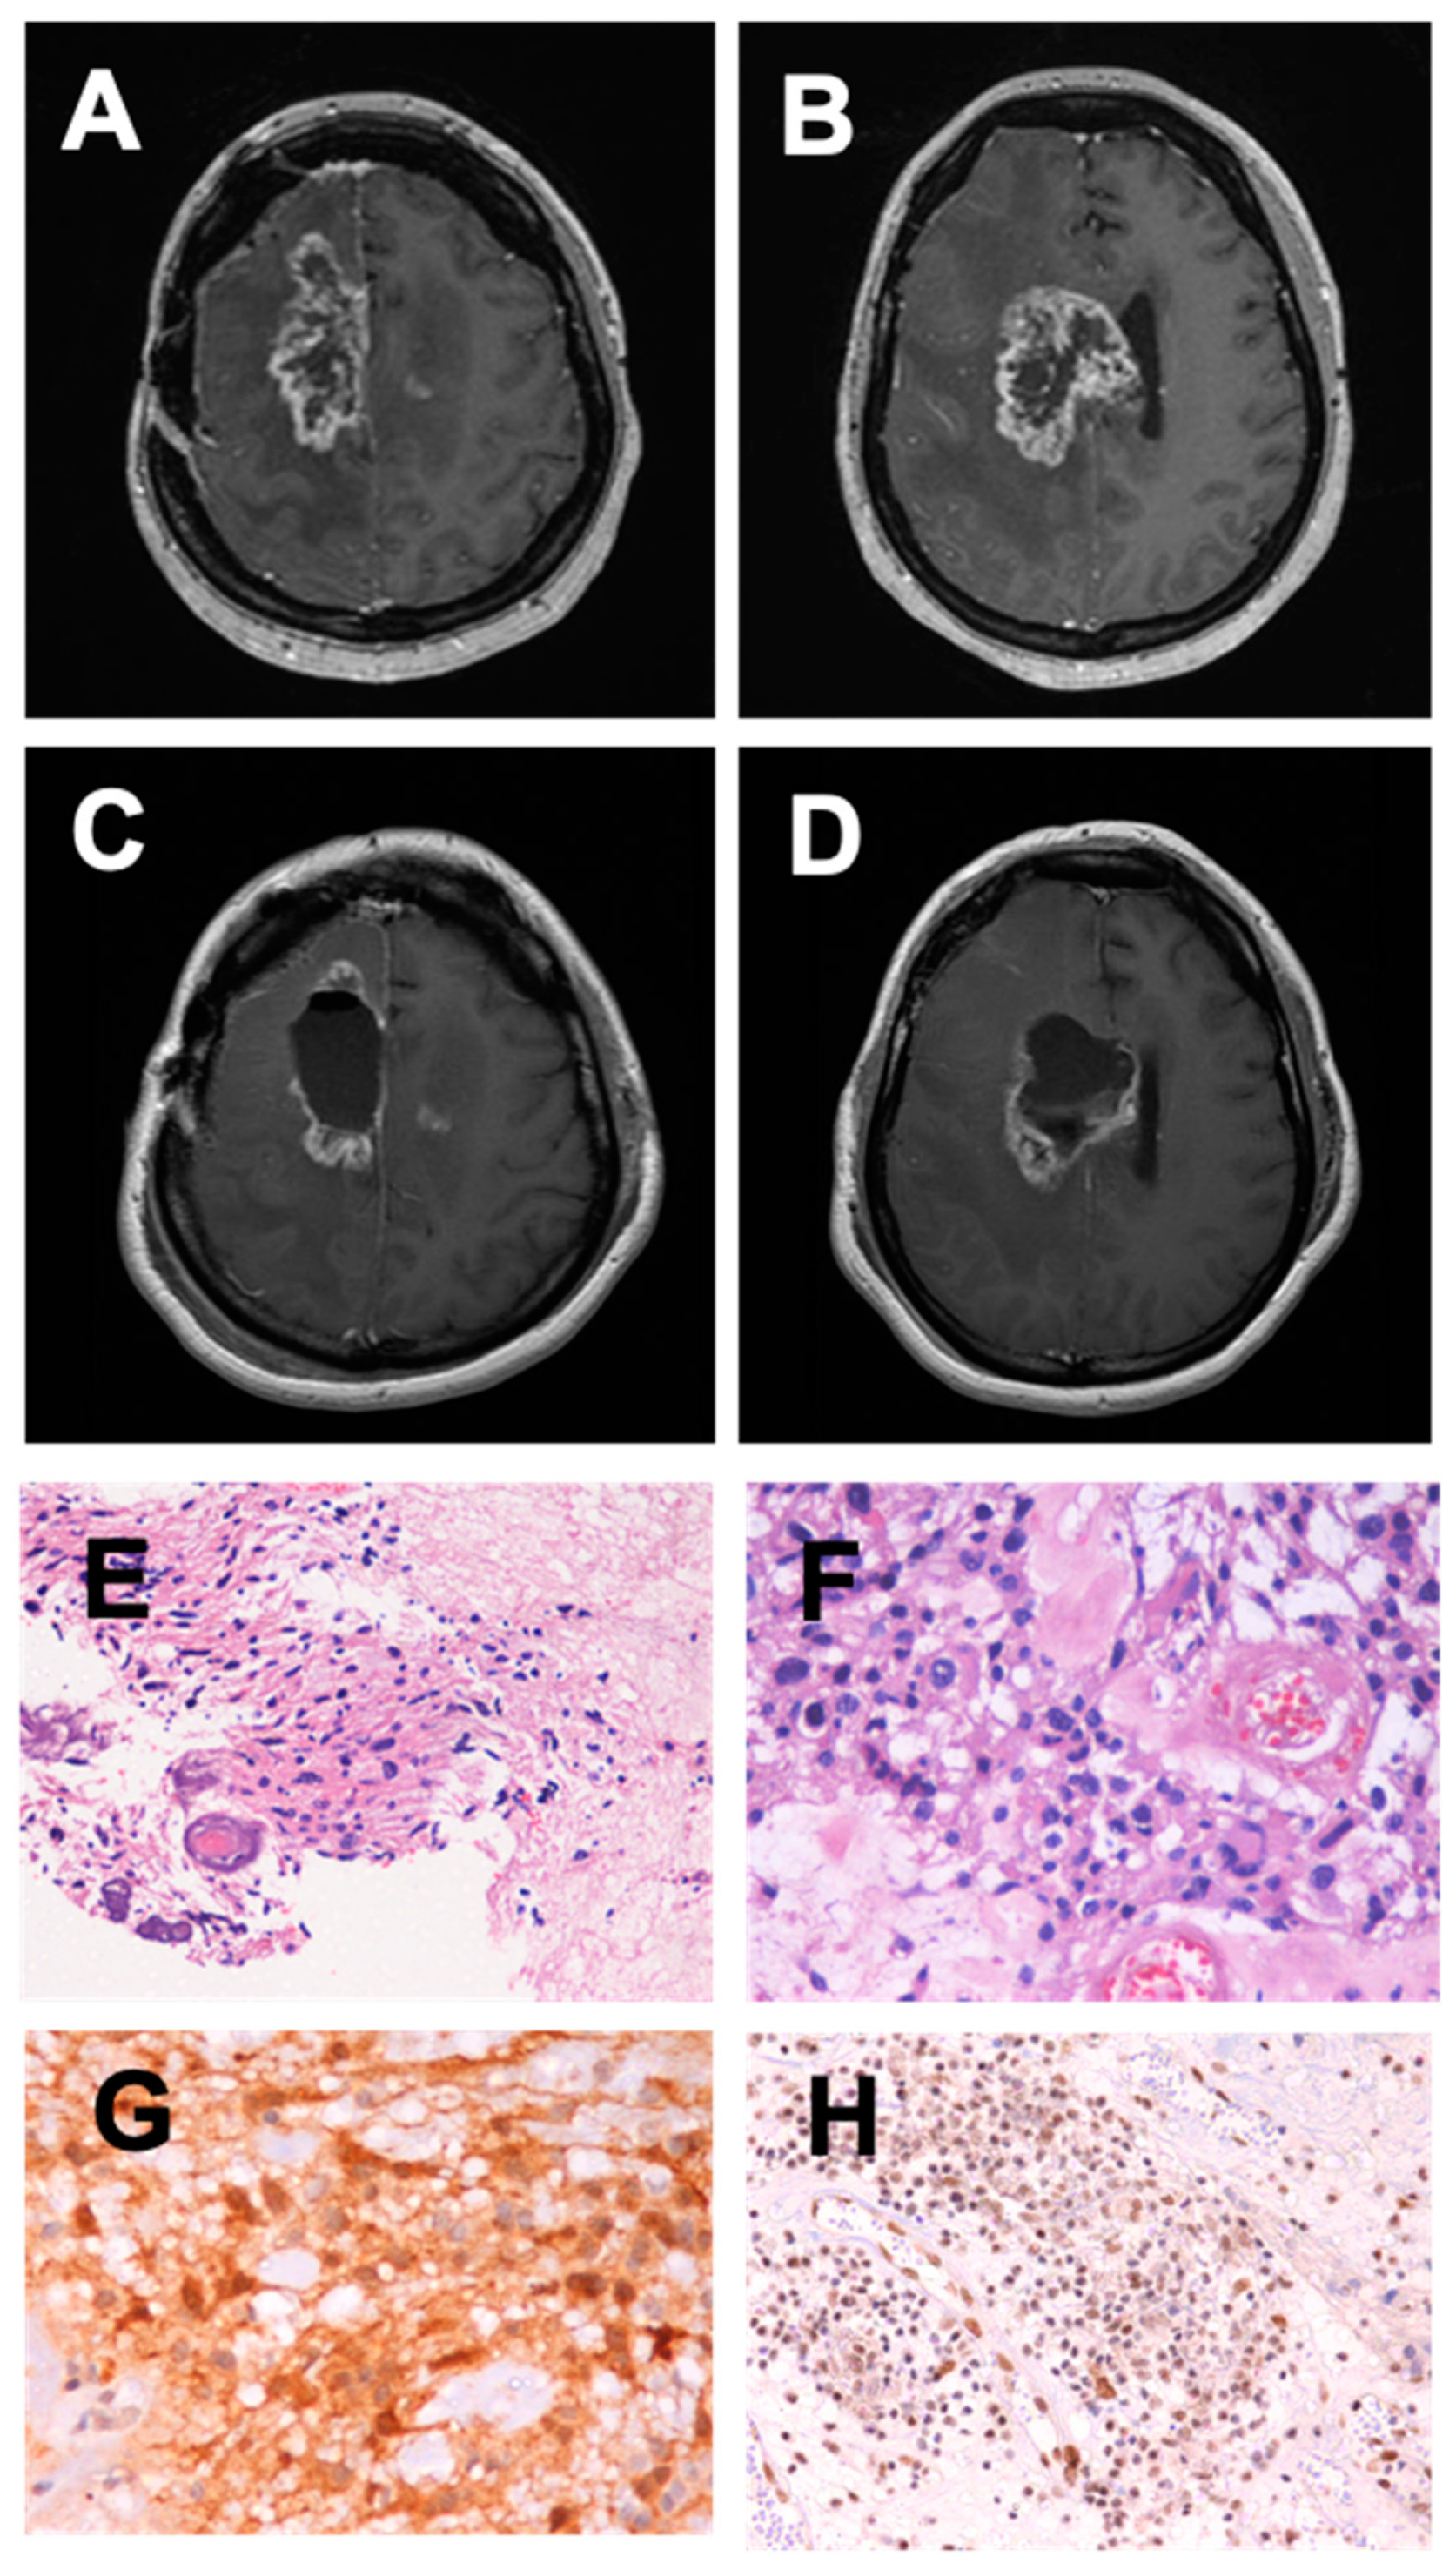
Abstract
:1. Introduction
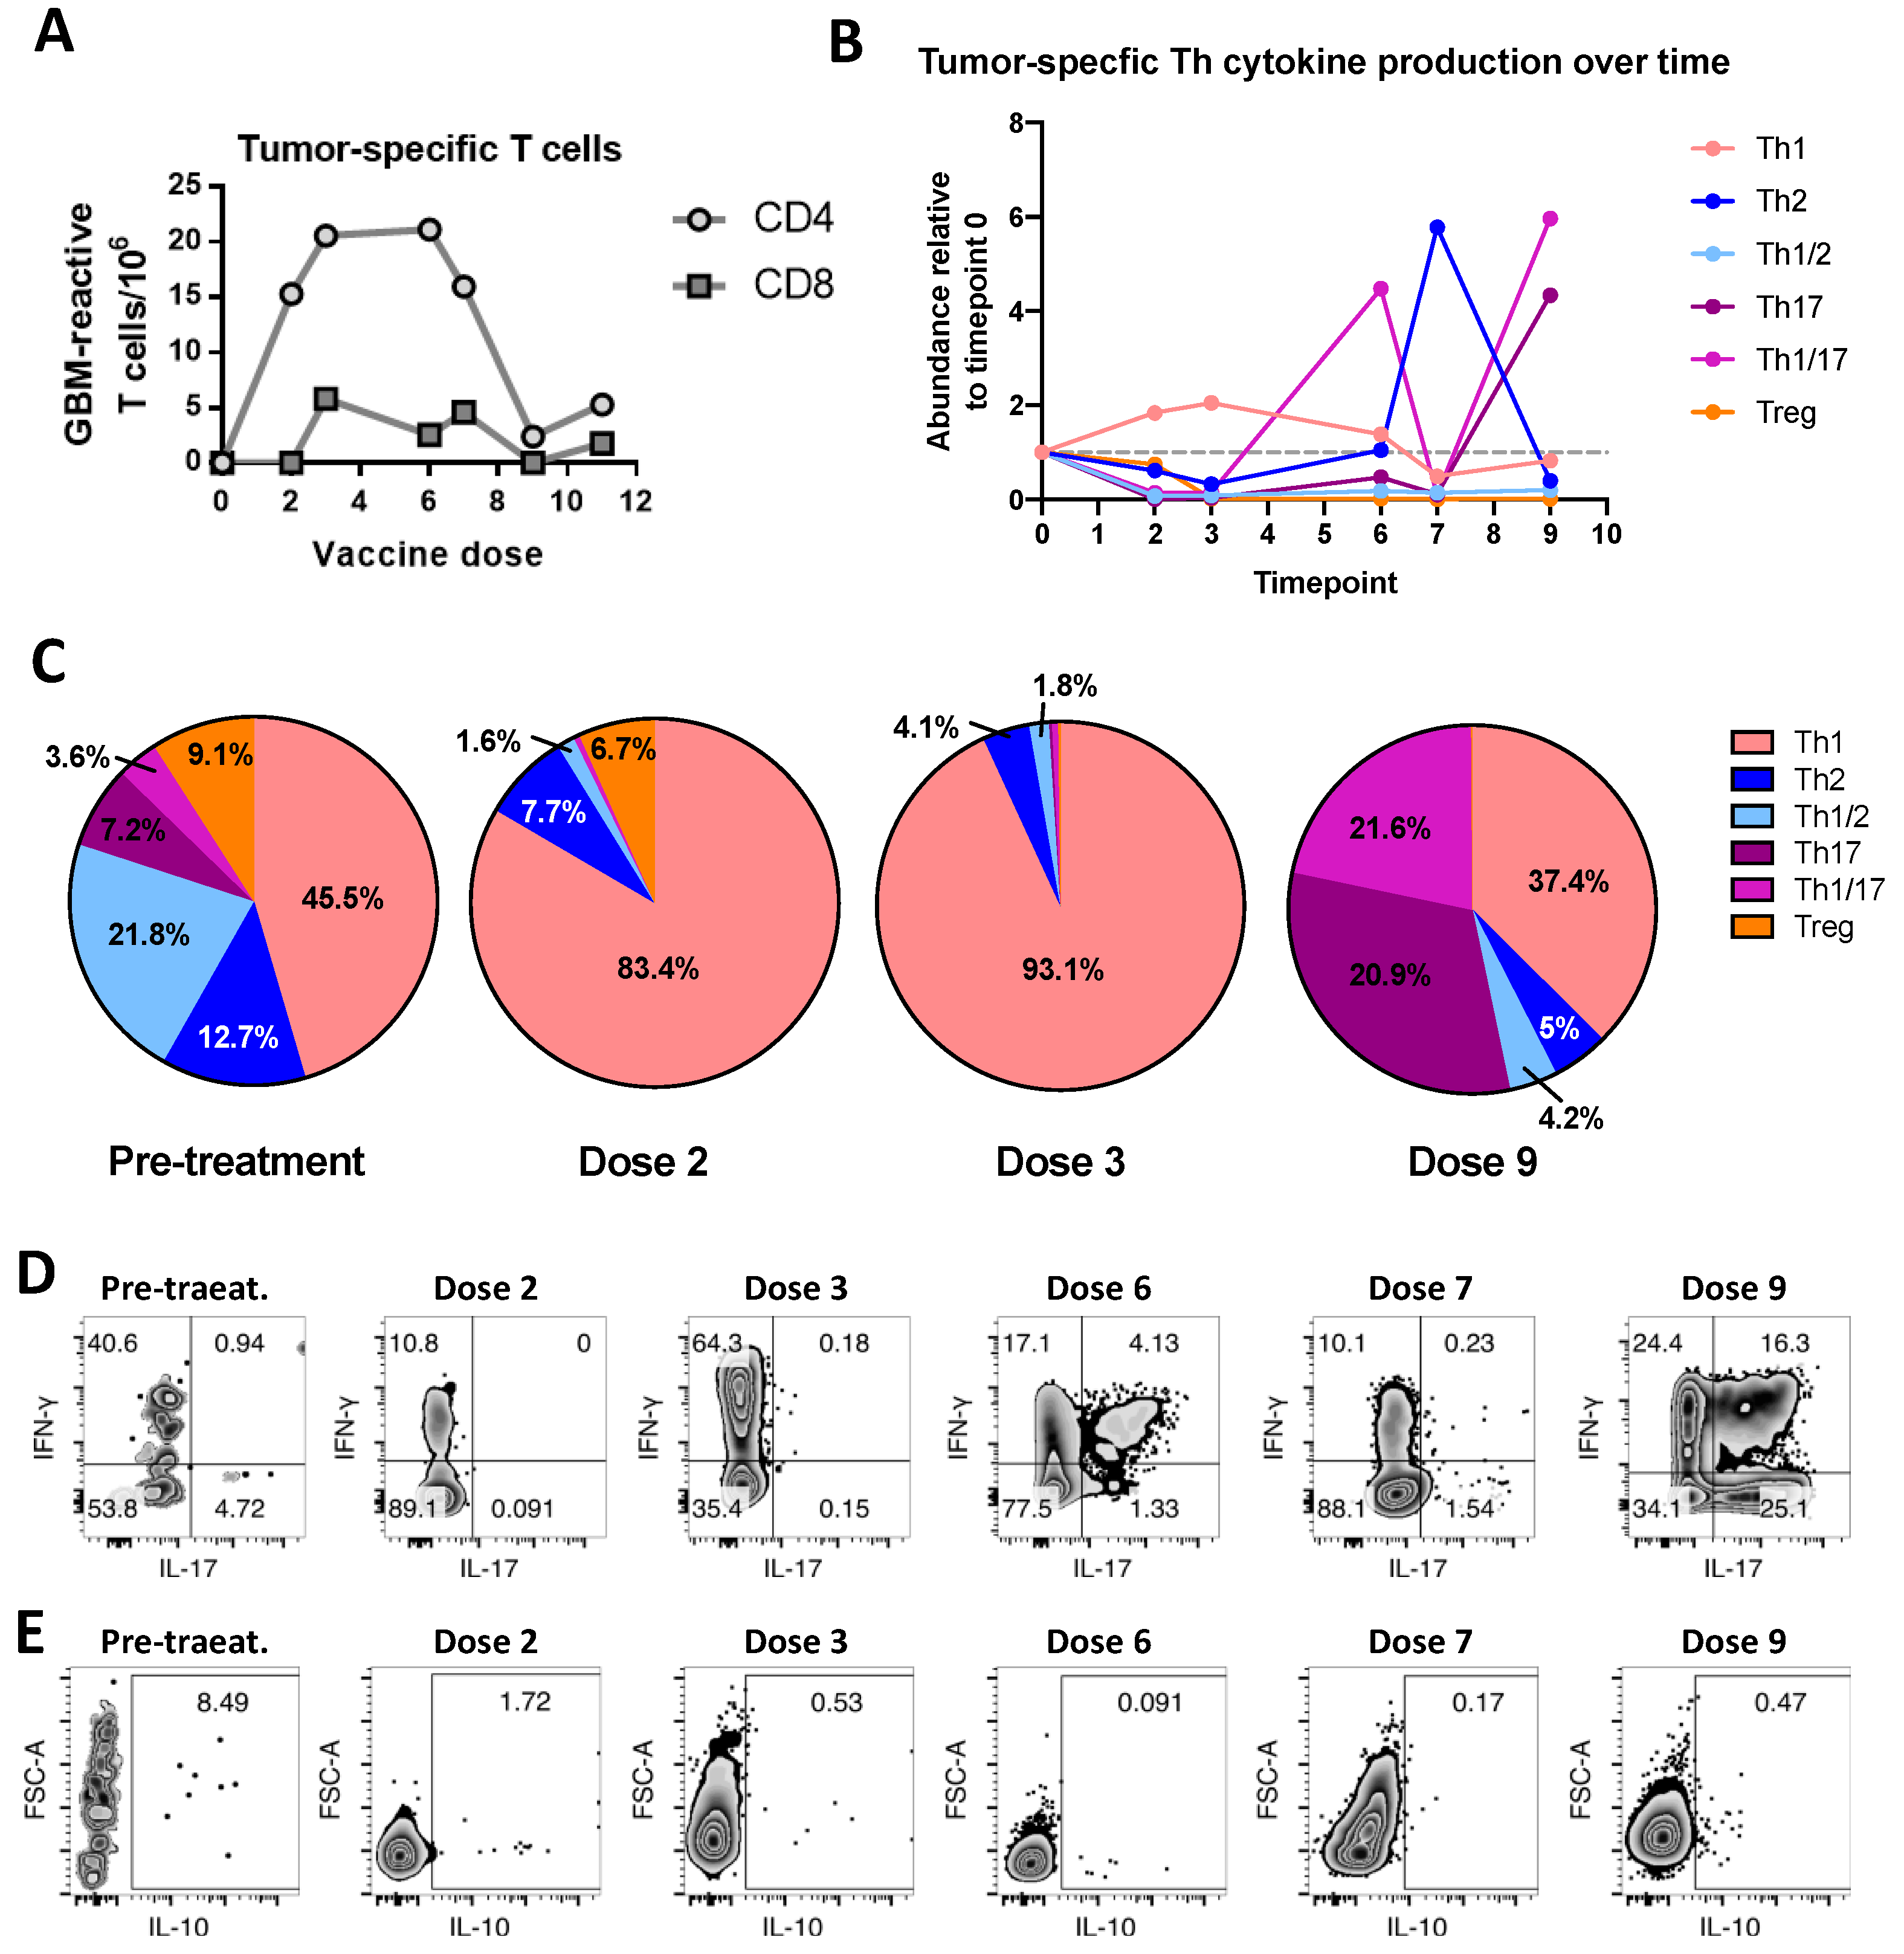
2. Case Report
3. Discussion
4. Methods
4.1. Patient Recruitment and Ethics
4.2. Follow-Up
4.3. Tumor Sample Processing and Vaccine Production
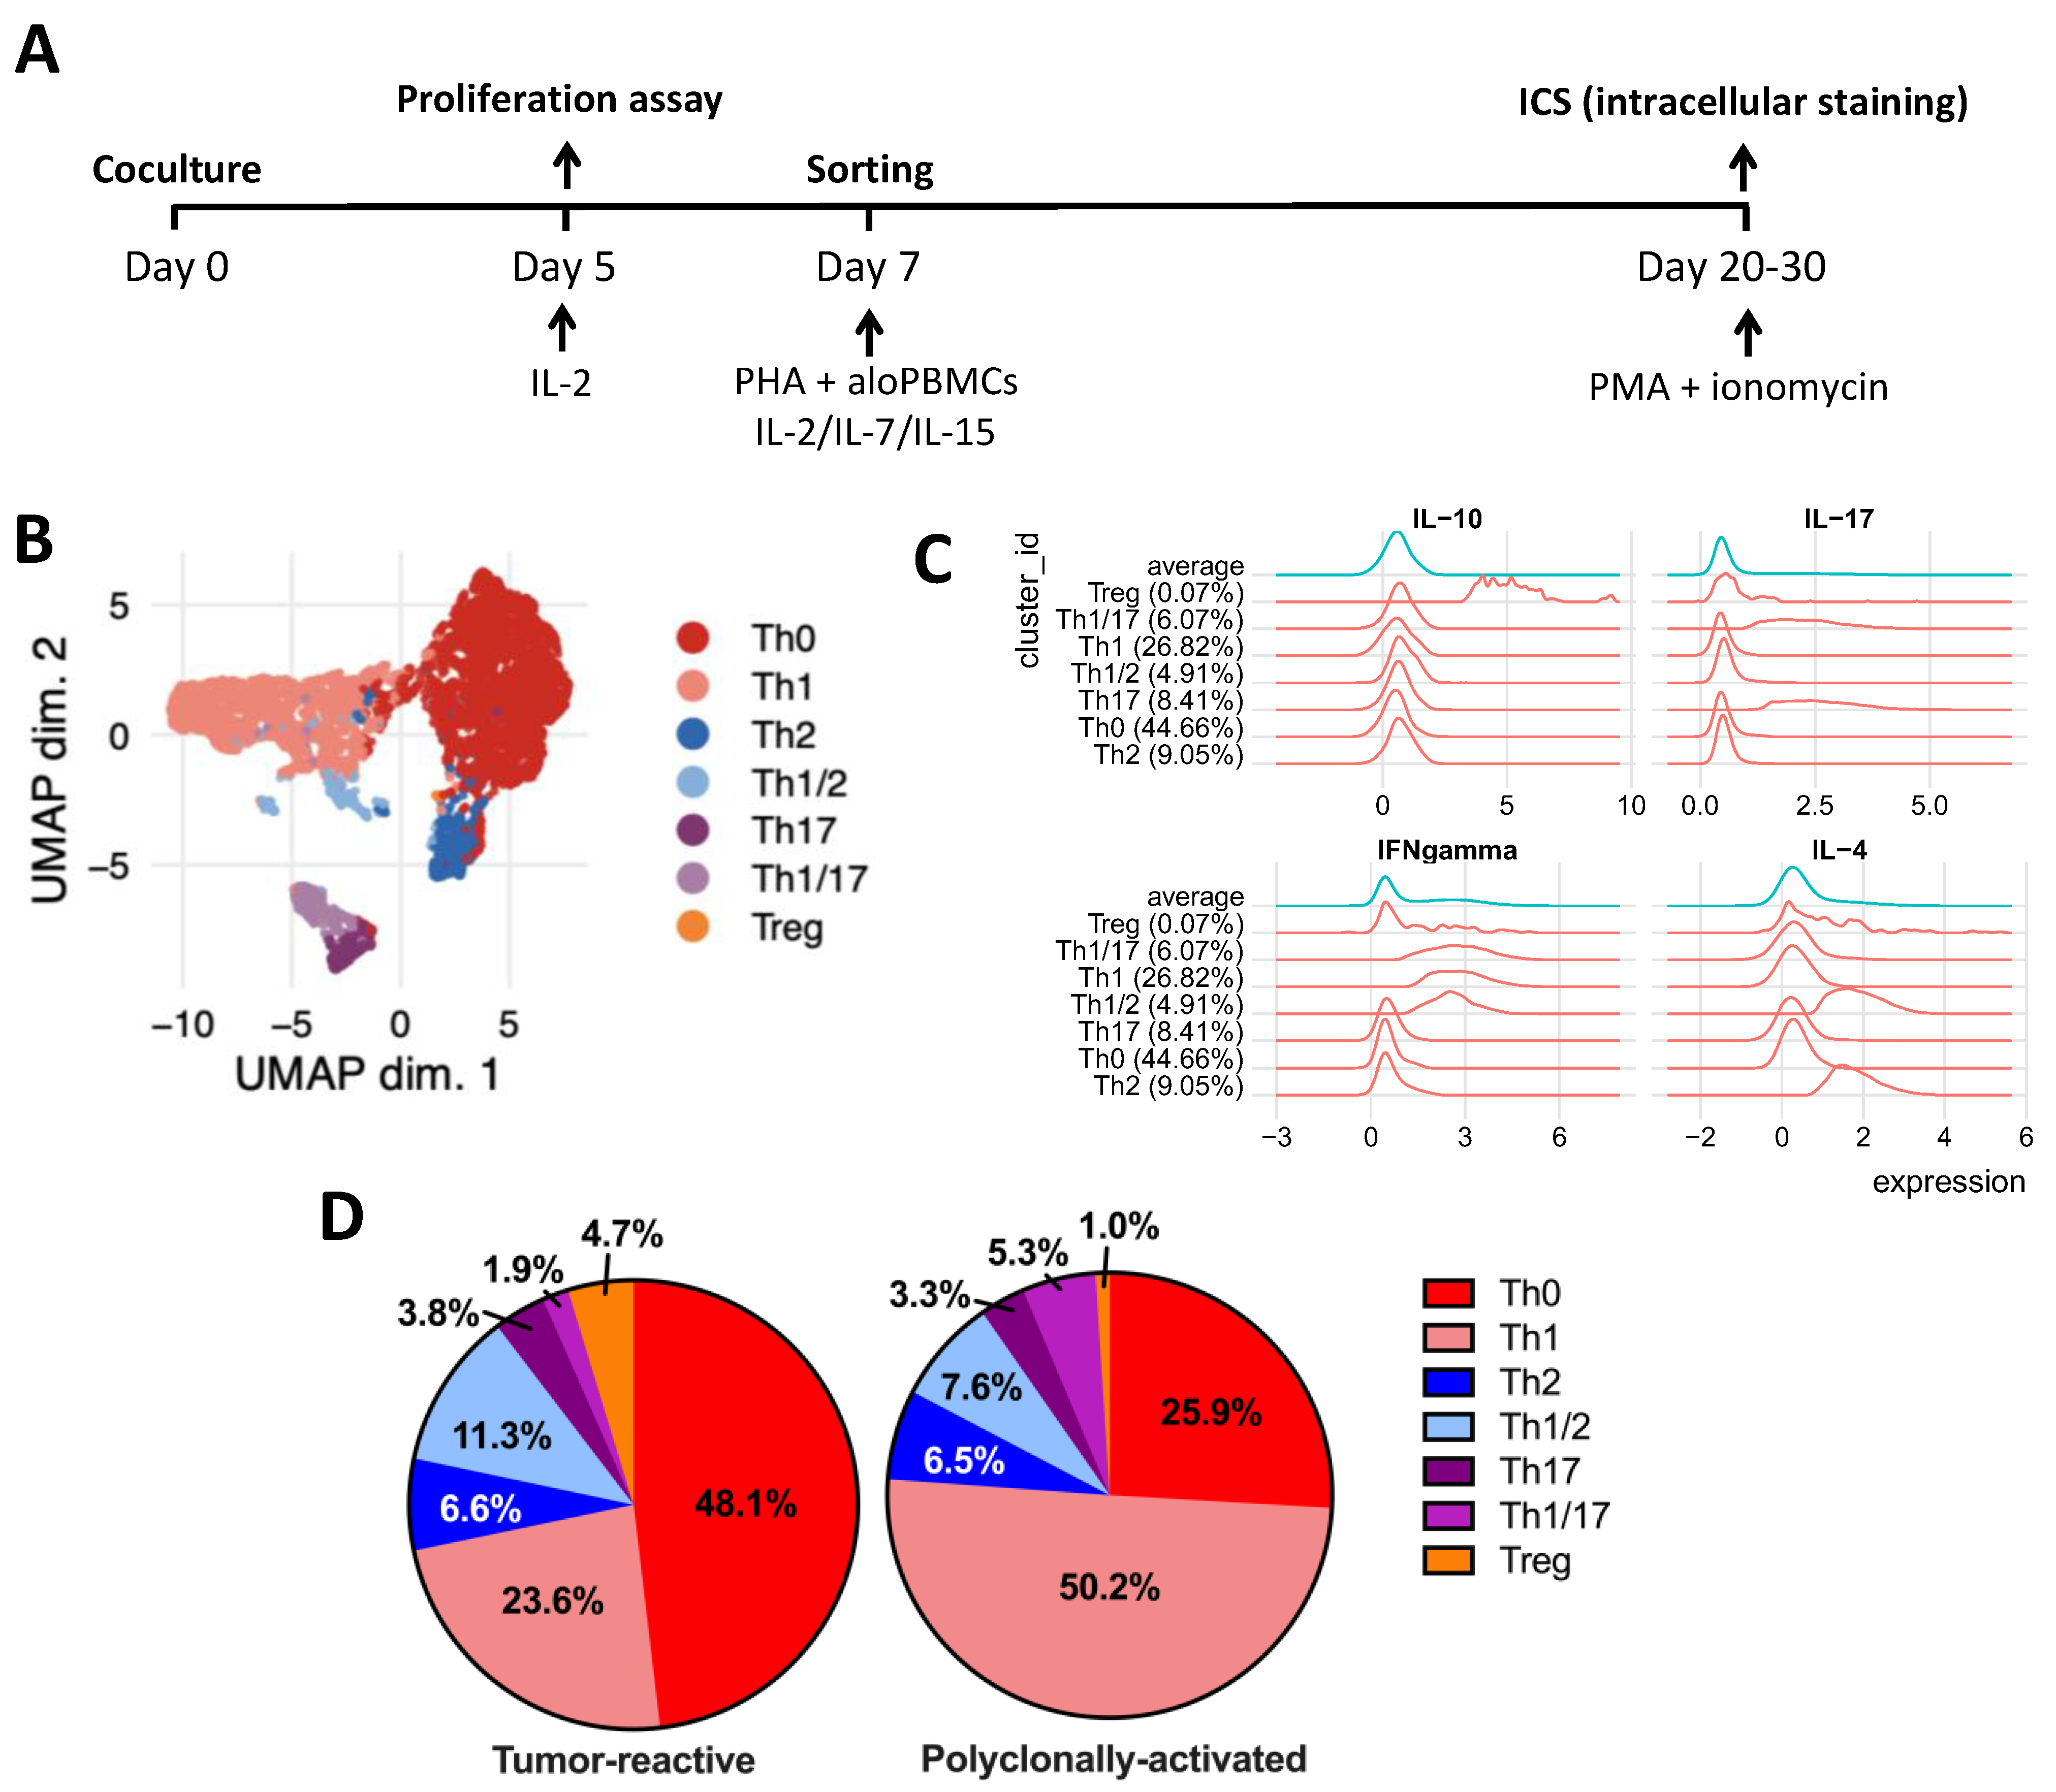
4.4. Tumor-Reactive T-Cell Frequency and Phenotype
Author Contributions
Funding
Institutional Review Board Statement
Informed Consent Statement
Data Availability Statement
Acknowledgments
Conflicts of Interest
References
- Patel, A.P.; Fisher, J.L.; Nichols, E.; Abd-Allah, F.; Abdela, J.; Abdelalim, A.; Abraha, H.N.; Agius, D.; Alahdab, F.; Alam, T.; et al. Global, regional, and national burden of brain and other CNS cancer, 1990–2016: A systematic analysis for the Global Burden of Disease Study 2016. Lancet Neurol. 2019, 18, 376–393. [Google Scholar] [CrossRef] [Green Version]
- Stupp, R.; Mason, W.P.; Van Den Bent, M.J.; Weller, M.; Fisher, B.; Taphoorn, M.J.; Weller, M.; Fisher, B.; Taphoorn, M.J.B.; Belanger, K.; et al. Radiotherapy plus concomitant and adjuvant temozolomide for glioblastoma. N. Engl. J. Med. 2005, 352, 987–996. [Google Scholar] [CrossRef] [PubMed]
- Lau, D.; Magill, S.T.; Aghi, M.K. Molecularly targeted therapies for recurrent glioblastoma: Current and future targets. Neurosurg. Focus 2014, 37, E15. [Google Scholar] [CrossRef] [PubMed]
- Weiss, T.; Weller, M.; Roth, P. Immunotherapy for glioblastoma: Concepts and challenges. Curr. Opin. Neurol. 2015, 28, 639–646. [Google Scholar] [CrossRef] [Green Version]
- Dunn-Pirio, A.M.; Vlahovic, G. Immunotherapy approaches in the treatment of malignant brain tumors. Cancer 2017, 123, 734–750. [Google Scholar] [CrossRef]
- Reardon, D.A.; Freeman, G.; Wu, C.; Chiocca, E.A.; Wucherpfennig, K.W.; Wen, P.Y.; Fritsch, F.F.; Curry, W.T., Jr.; Sampson, J.H.; Dranoff, G. Immunotherapy advances for glioblastoma. Neuro. Oncol. 2014, 16, 1441–1458. [Google Scholar] [CrossRef]
- Steinman, R.M. Decisions about dendritic cells: Past, present, and future. Annu. Rev. Immunol. 2012, 30, 1–22. [Google Scholar] [CrossRef] [Green Version]
- Palucka, K.; Banchereau, J. Cancer immunotherapy via dendritic cells. Nat. Rev. Cancer 2012, 12, 265–277. [Google Scholar] [CrossRef]
- Patente, T.A.; Pinho, M.P.; Oliveira, A.A.; Evangelista, G.C.M.; Bergami-Santos, P.C.; Barbuto, J.A.M. Human Dendritic Cells: Their Heterogeneity and Clinical Application Potential in Cancer Immunotherapy. Front. Immunol. 2018, 9, 3176. [Google Scholar] [CrossRef]
- Liau, L.M.; Ashkan, K.; Tran, D.D.; Campian, J.L.; Trusheim, J.E.; Cobbs, C.S.; Heth, J.A.; Salacz, M.; Taylor, S.; D’Andre, S.D.; et al. First results on survival from a large Phase 3 clinical trial of an autologous dendritic cell vaccine in newly diagnosed glioblastoma. J. Transl. Med. 2018, 16, 142. [Google Scholar] [CrossRef] [Green Version]
- Patel, V.; Shah, J. The current and future aspects of glioblastoma: Immunotherapy a new hope? Eur. J. Neurosci. 2021, 54, 5120–5142. [Google Scholar] [CrossRef] [PubMed]
- Ramos, R.N.; Chin, L.S.; Dos Santos, A.P.; Bergami-Santos, P.C.; Laginha, F.; Barbuto, J.A. Monocyte-derived dendritic cells from breast cancer patients are biased to induce CD4+CD25+Foxp3+ regulatory T cells. J. Leukoc. Biol. 2012, 92, 673–682. [Google Scholar] [CrossRef] [PubMed] [Green Version]
- Toniolo, P.A.; Liu, S.; Yeh, J.E.; Ye, D.Q.; Barbuto, J.A.; Frank, D.A. Deregulation of SOCS5 suppresses dendritic cell function in chronic lymphocytic leukemia. Oncotarget 2016, 7, 46301–46314. [Google Scholar] [CrossRef] [Green Version]
- Barbuto, J.A. Are dysfunctional monocyte-derived dendritic cells in cancer an explanation for cancer vaccine failures? Immunotherapy 2013, 5, 105–107. [Google Scholar] [CrossRef]
- Barbuto, J.A.M.; Ensina, L.F.; Neves, A.R.; Bergami-Santos, P.C.; Leite, K.R.; Marques, R.; Costa, F.; Martins, S.C.; Camara-Lopes, L.H.; Buzaid, A.C. Dendritic cell-tumor cell hybrid vaccination for metastatic cancer. Cancer Immunol. Immunother. 2004, 53, 1111–1118. [Google Scholar] [CrossRef] [PubMed]
- Elfenbein, G.J.; Green, I.; Paul, W.E. The allogeneic effect: Increased cellular immune and inflammatory responses. J. Immunol. 1950, 112, 2166–2175. [Google Scholar]
- Van den Bent, M.J.; Baumert, B.; Erridge, S.C.; Vogelbaum, M.A.; Nowak, A.K.; Sanson, M.; Brandes, A.A.; Clement, P.M.; Baurain, J.F.; Sanson, M.; et al. Interim results from the CATNON trial (EORTC study 26053-22054) of treatment with concurrent and adjuvant temozolomide for 1p/19q non-co-deleted anaplastic glioma: A phase 3, randomised, open-label intergroup study. Lancet 2017, 390, 1645–1653. [Google Scholar] [CrossRef] [Green Version]
- Wen, P.Y.; Macdonald, D.R.; Reardon, D.A.; Cloughesy, T.F.; Sorensen, A.G.; Galanis, E.; DeGroot, J.; Wick, W.; Gilbert, M.R.; Lassma, A.B.; et al. Updated response assessment criteria for high-grade gliomas: Response assessment in neuro-oncology working group. J. Clin. Oncol. 2010, 28, 1963–1972. [Google Scholar] [CrossRef]
- Pinho, M.P.; Patente, T.A.; Flatow, E.A.; Sallusto, F.; Barbuto, J.A.M. Frequency determination of breast tumor-reactive CD4 and CD8 T cells in humans: Unveiling the antitumor immune response. Oncoimmunology 2019, 8, 1607674. [Google Scholar] [CrossRef] [Green Version]
- Nowicka, M.; Krieg, C.; Weber, L.M.; Hartmann, F.J.; Guglietta, S.; Becher, B.; Levesque, M.P.; Robinson, M.D. CyTOF workflow: Differential discovery in high-throughput high-dimensional cytometry datasets. F1000Res 2017, 6, 748. [Google Scholar] [CrossRef]
- Dunn, G.P.; Old, L.J.; Schreiber, R.D. The three Es of cancer immunoediting. Annu. Rev. Immunol. 2004, 22, 329–360. [Google Scholar] [CrossRef] [PubMed]
- Boog, C.J.; Kast, W.M.; Timmers, H.T.; Boes, J.; de Waal, L.P.; Melief, C.J. Abolition of specific immune response defect by immunization with dendritic cells. Nature 1985, 318, 59–62. [Google Scholar] [CrossRef] [PubMed]
- Shimizu, Y.; Guidotti, L.G.; Fowler, P.; Chisari, F.V. Dendritic cell immunization breaks cytotoxic T lymphocyte tolerance in hepatitis B virus transgenic mice. J. Immunol. 1998, 161, 4520–4529. [Google Scholar] [PubMed]
- Ramos, R.N.; de Moraes, C.J.; Zelante, B.; Barbuto, J.A. What are the molecules involved in regulatory T-cells induction by dendritic cells in cancer? Clin. Dev. Immunol. 2013, 2013, 806025. [Google Scholar] [CrossRef] [PubMed]
- Pinho, M.P.; Sundarasetty, B.S.; Bergami-Santos, P.C.; Steponavicius-Cruz, K.; Ferreira, A.K.; Stripecke, R.; Barbuto, J.A.M. Dendritic-tumor cell hybrids induce tumor-specific immune responses more effectively than the simple mixture of dendritic and tumor cells. Cytotherapy 2016, 18, 570–580. [Google Scholar] [CrossRef]
- Young, M.R. Th17 Cells in Protection from Tumor or Promotion of Tumor Progression. J. Clin. Cell Immunol. 2016, 7, 431. [Google Scholar] [CrossRef]
- Wilke, C.M.; Kryczek, I.; Wei, S.; Zhao, E.; Wu, K.; Wang, G.; Zou, W. Th17 cells in cancer: Help or hindrance? Carcinogenesis 2011, 32, 643–649. [Google Scholar] [CrossRef] [Green Version]
- Scarpace, L.; Mikkelsen, T.; Cha, S.; Rao, S.; Tekchandani, S.; Gutman, D.; Saltz, J.H.; Erickson, B.J.; Pedano, N.; Flanders, A.E.; et al. Radiology Data from The Cancer Genome Atlas Glioblastoma Multiforme [TCGA-GBM] collection [Data set]. Cancer Imaging Arch. 2016, 11, 1. [Google Scholar] [CrossRef]


Publisher’s Note: MDPI stays neutral with regard to jurisdictional claims in published maps and institutional affiliations. |
© 2022 by the authors. Licensee MDPI, Basel, Switzerland. This article is an open access article distributed under the terms and conditions of the Creative Commons Attribution (CC BY) license (https://creativecommons.org/licenses/by/4.0/).
Share and Cite
Pinho, M.P.; Lepski, G.A.; Rehder, R.; Chauca-Torres, N.E.; Evangelista, G.C.M.; Teixeira, S.F.; Flatow, E.A.; de Oliveira, J.V.; Fogolin, C.S.; Peres, N.; et al. Near-Complete Remission of Glioblastoma in a Patient Treated with an Allogenic Dendritic Cell-Based Vaccine: The Role of Tumor-Specific CD4+T-Cell Cytokine Secretion Pattern in Predicting Response and Recurrence. Int. J. Mol. Sci. 2022, 23, 5396. https://0-doi-org.brum.beds.ac.uk/10.3390/ijms23105396
Pinho MP, Lepski GA, Rehder R, Chauca-Torres NE, Evangelista GCM, Teixeira SF, Flatow EA, de Oliveira JV, Fogolin CS, Peres N, et al. Near-Complete Remission of Glioblastoma in a Patient Treated with an Allogenic Dendritic Cell-Based Vaccine: The Role of Tumor-Specific CD4+T-Cell Cytokine Secretion Pattern in Predicting Response and Recurrence. International Journal of Molecular Sciences. 2022; 23(10):5396. https://0-doi-org.brum.beds.ac.uk/10.3390/ijms23105396
Chicago/Turabian StylePinho, Mariana P., Guilherme A. Lepski, Roberta Rehder, Nadia E. Chauca-Torres, Gabriela C. M. Evangelista, Sarah F. Teixeira, Elizabeth A. Flatow, Jaqueline V. de Oliveira, Carla S. Fogolin, Nataly Peres, and et al. 2022. "Near-Complete Remission of Glioblastoma in a Patient Treated with an Allogenic Dendritic Cell-Based Vaccine: The Role of Tumor-Specific CD4+T-Cell Cytokine Secretion Pattern in Predicting Response and Recurrence" International Journal of Molecular Sciences 23, no. 10: 5396. https://0-doi-org.brum.beds.ac.uk/10.3390/ijms23105396