
Metformin Reduces Potassium Currents and Prolongs Repolarization in Non-Diabetic Heart

 , , , , and
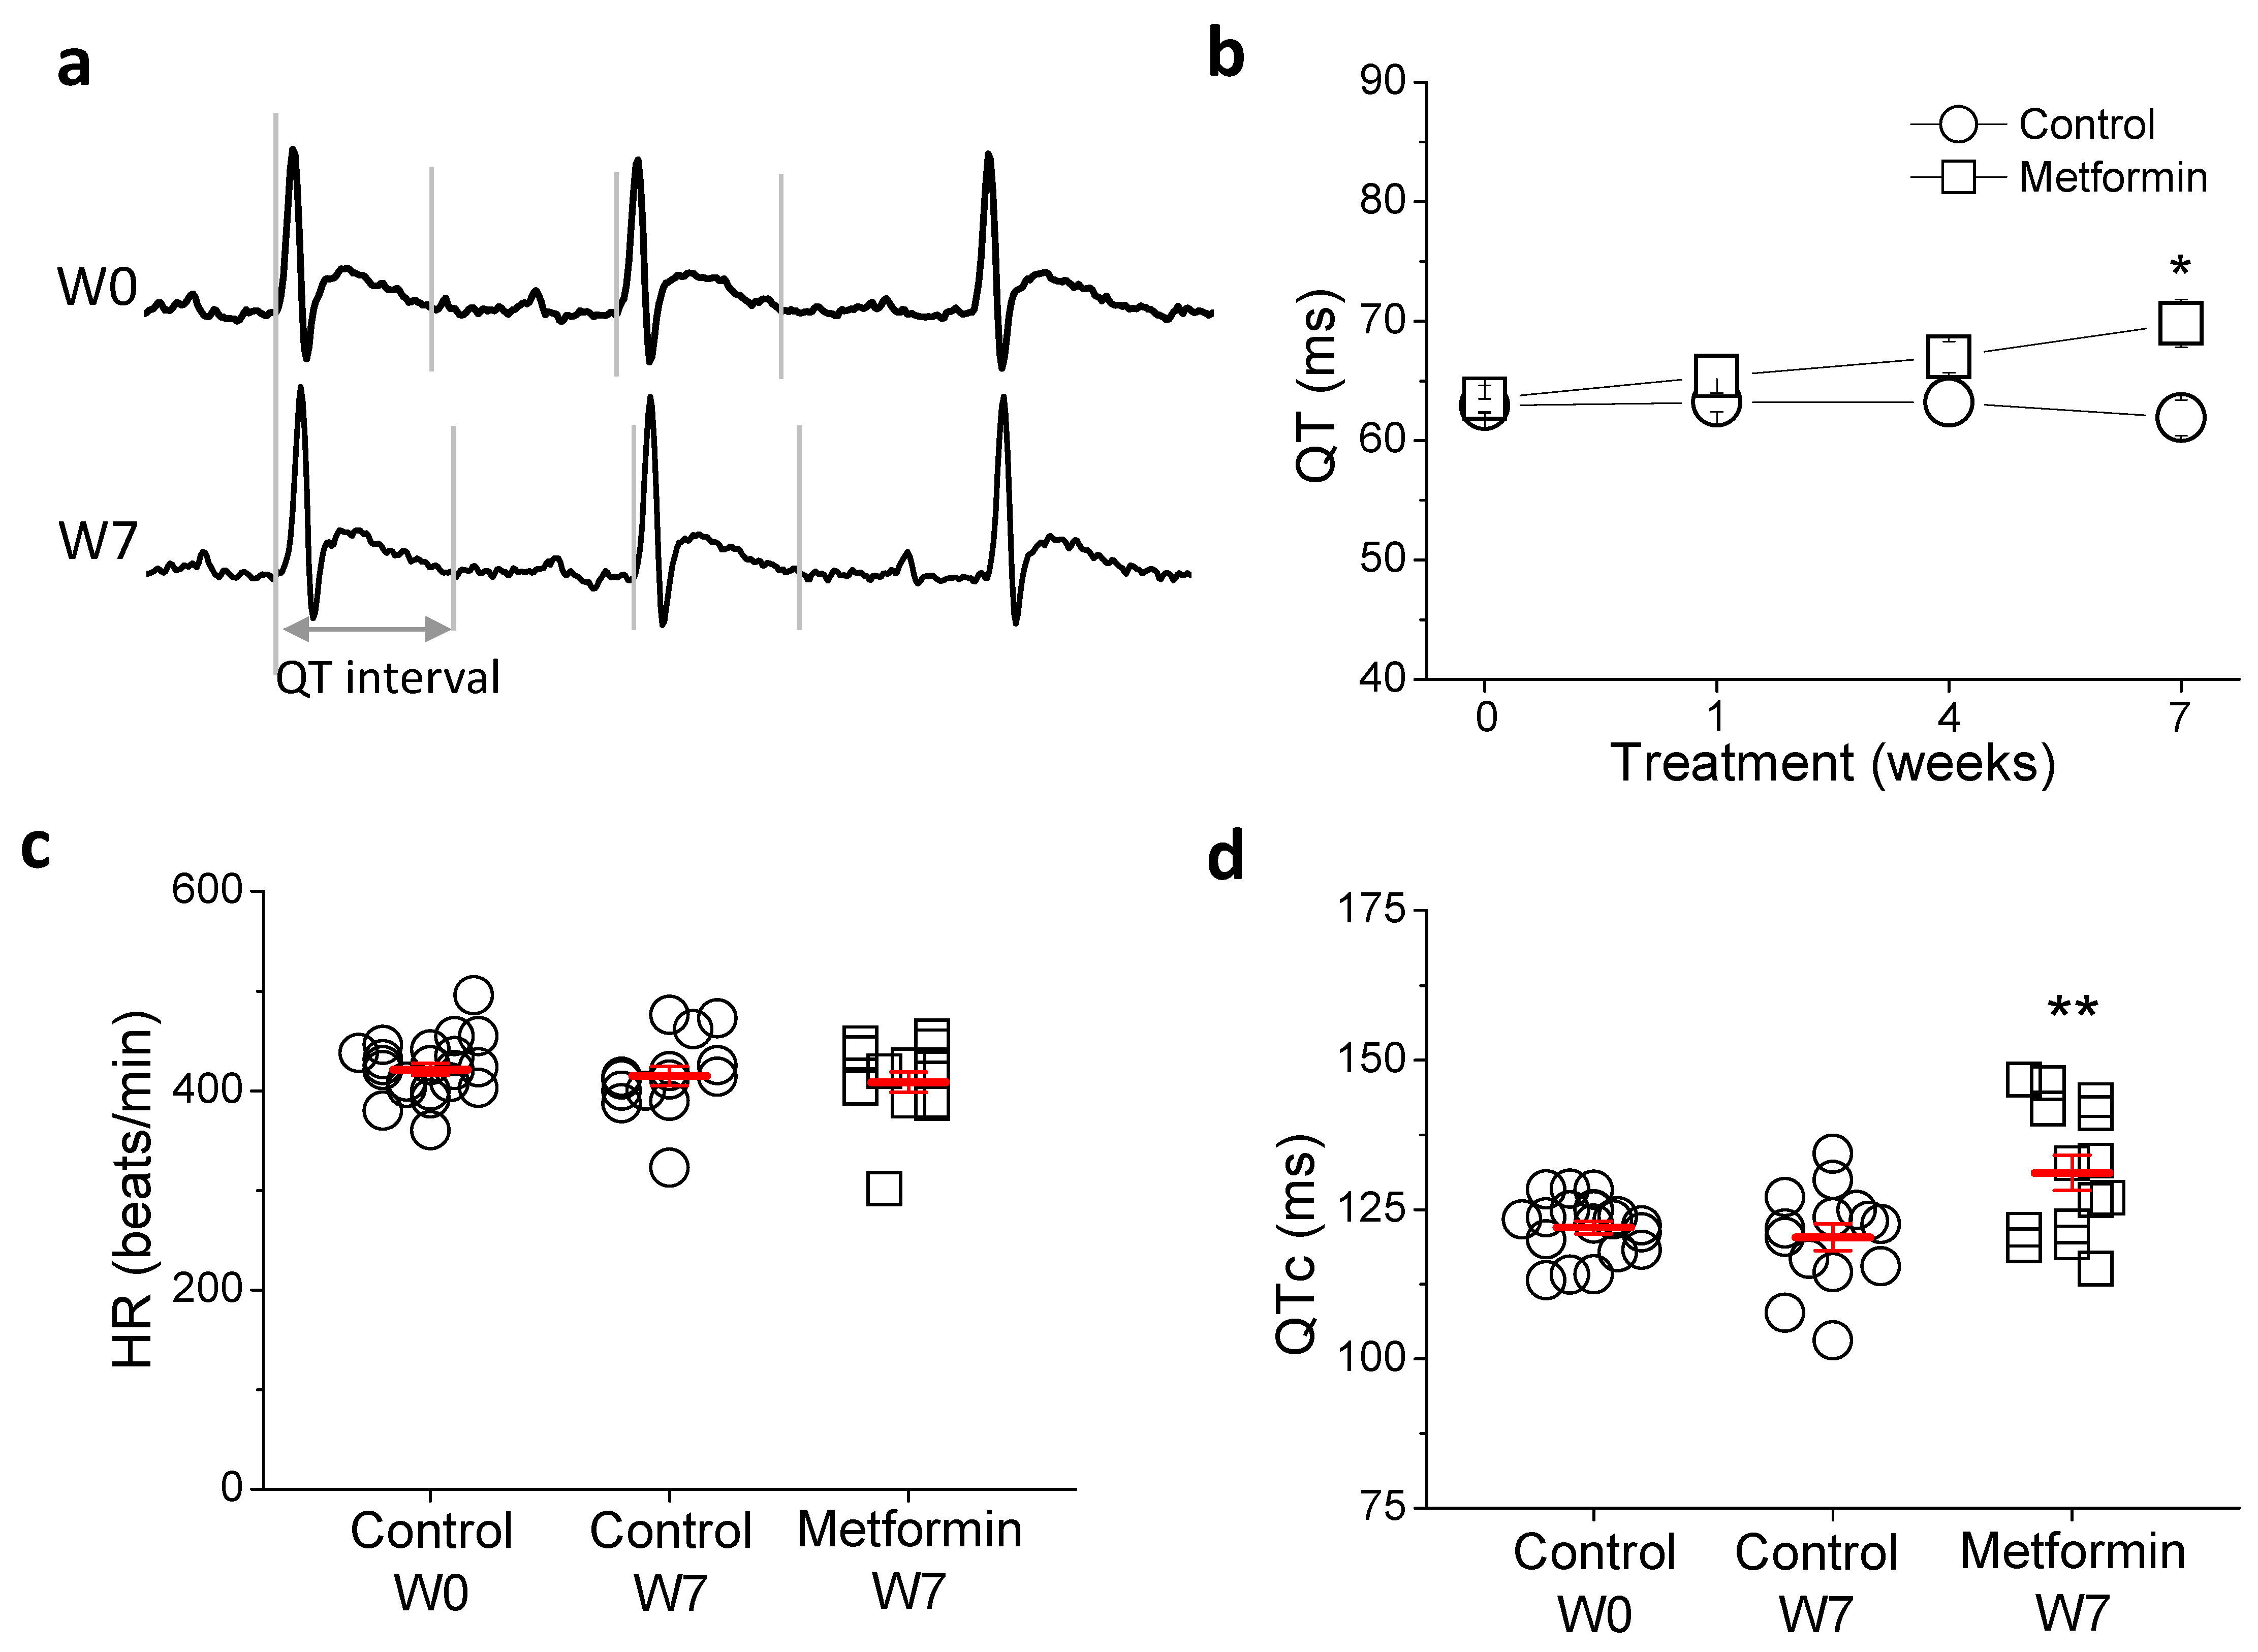
Abstract
:1. Introduction
2. Results
2.1. Metformin Treatment Prolongs QTc
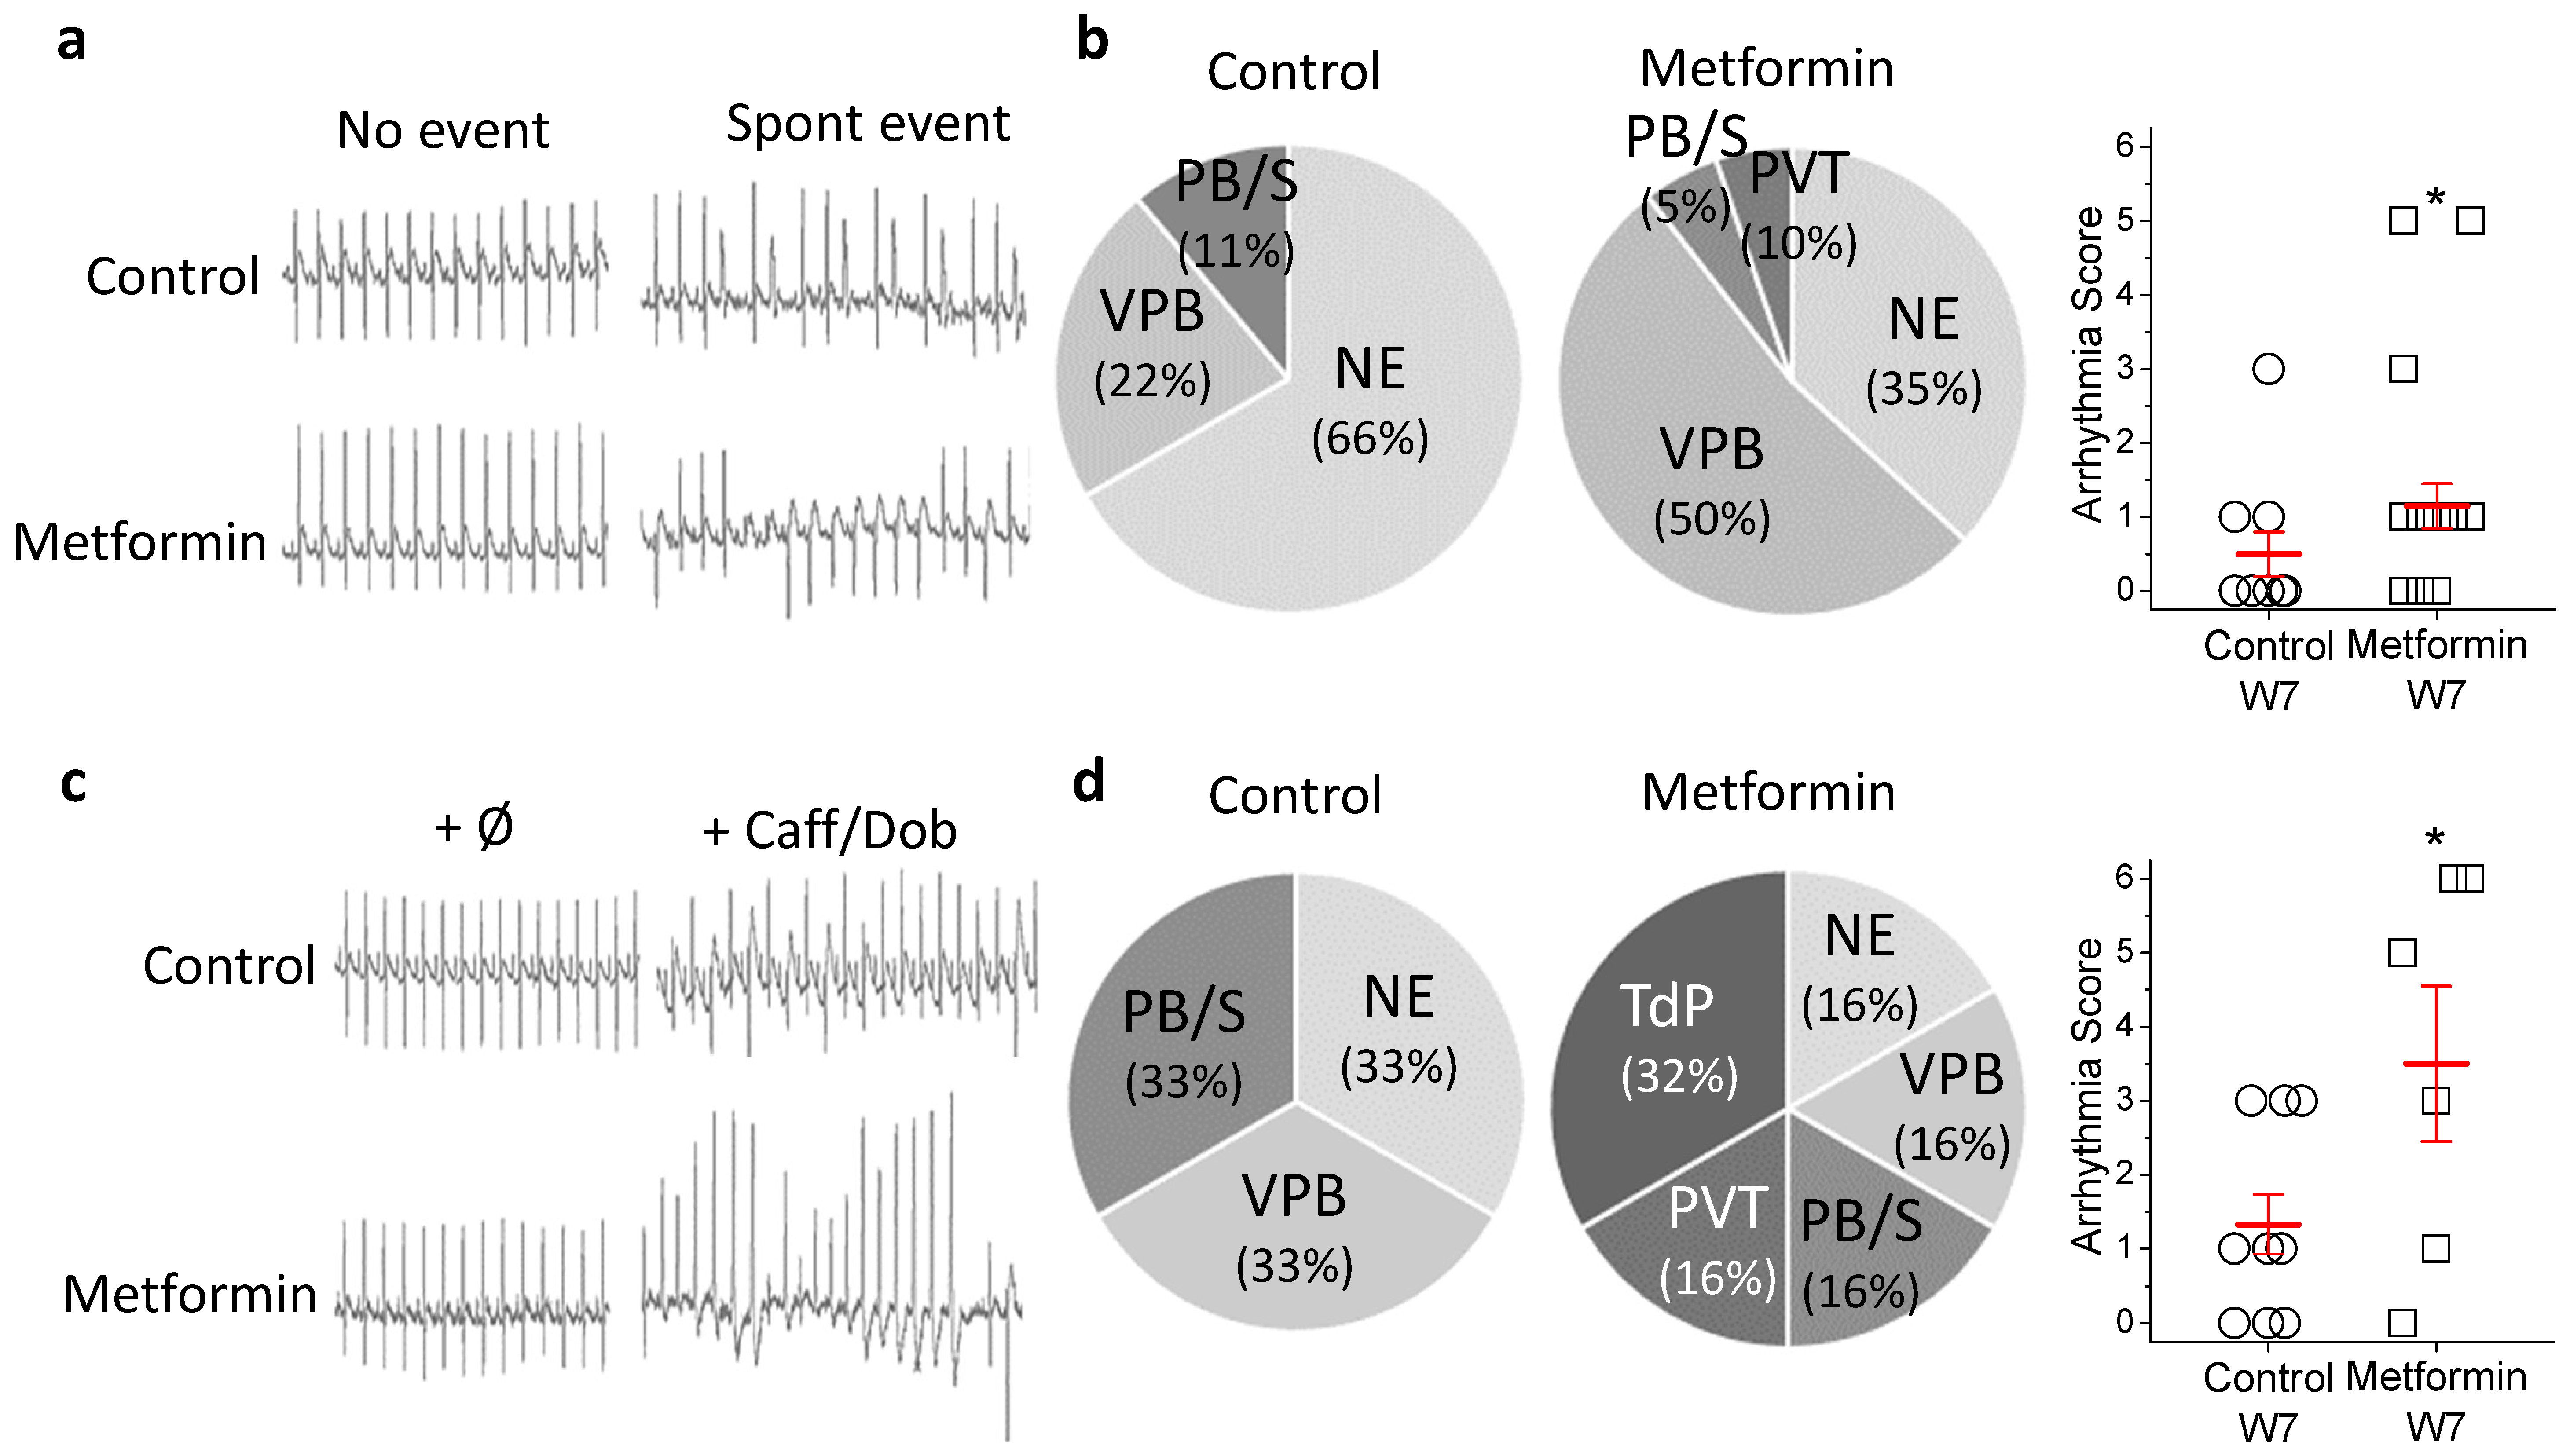
2.2. Metformin Treatment Increases In Vivo Arrhythmia Susceptibility
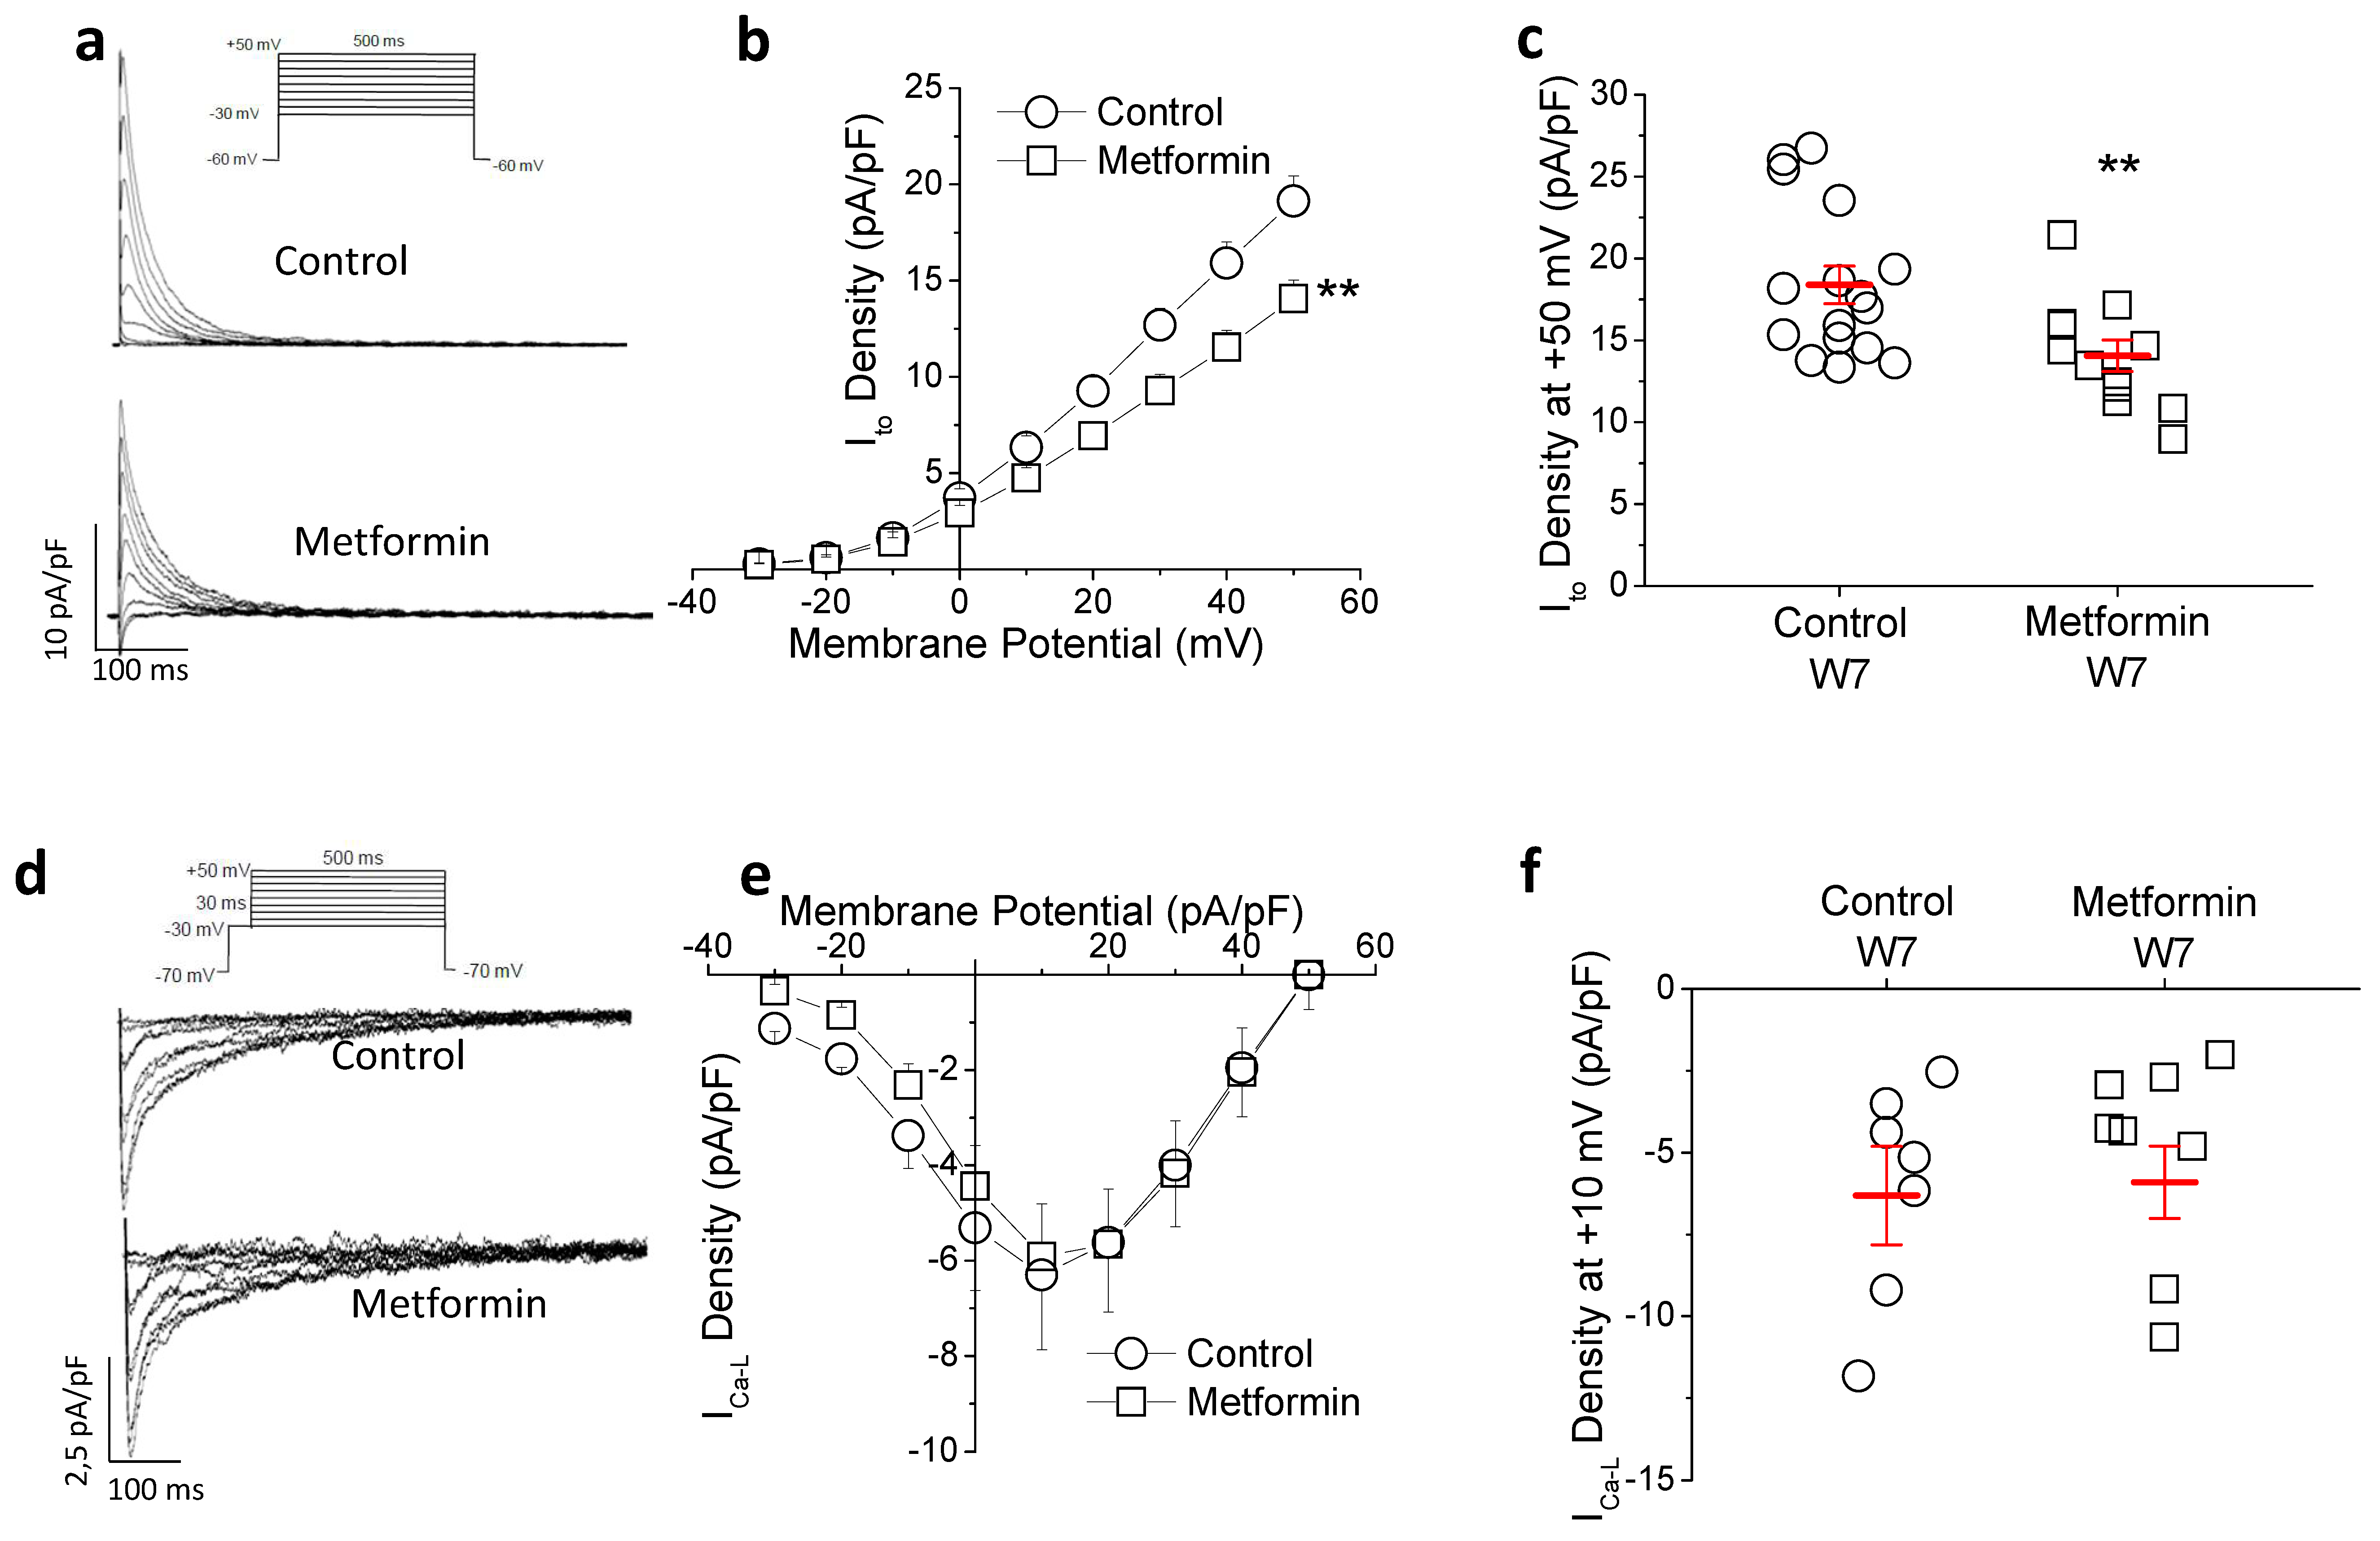
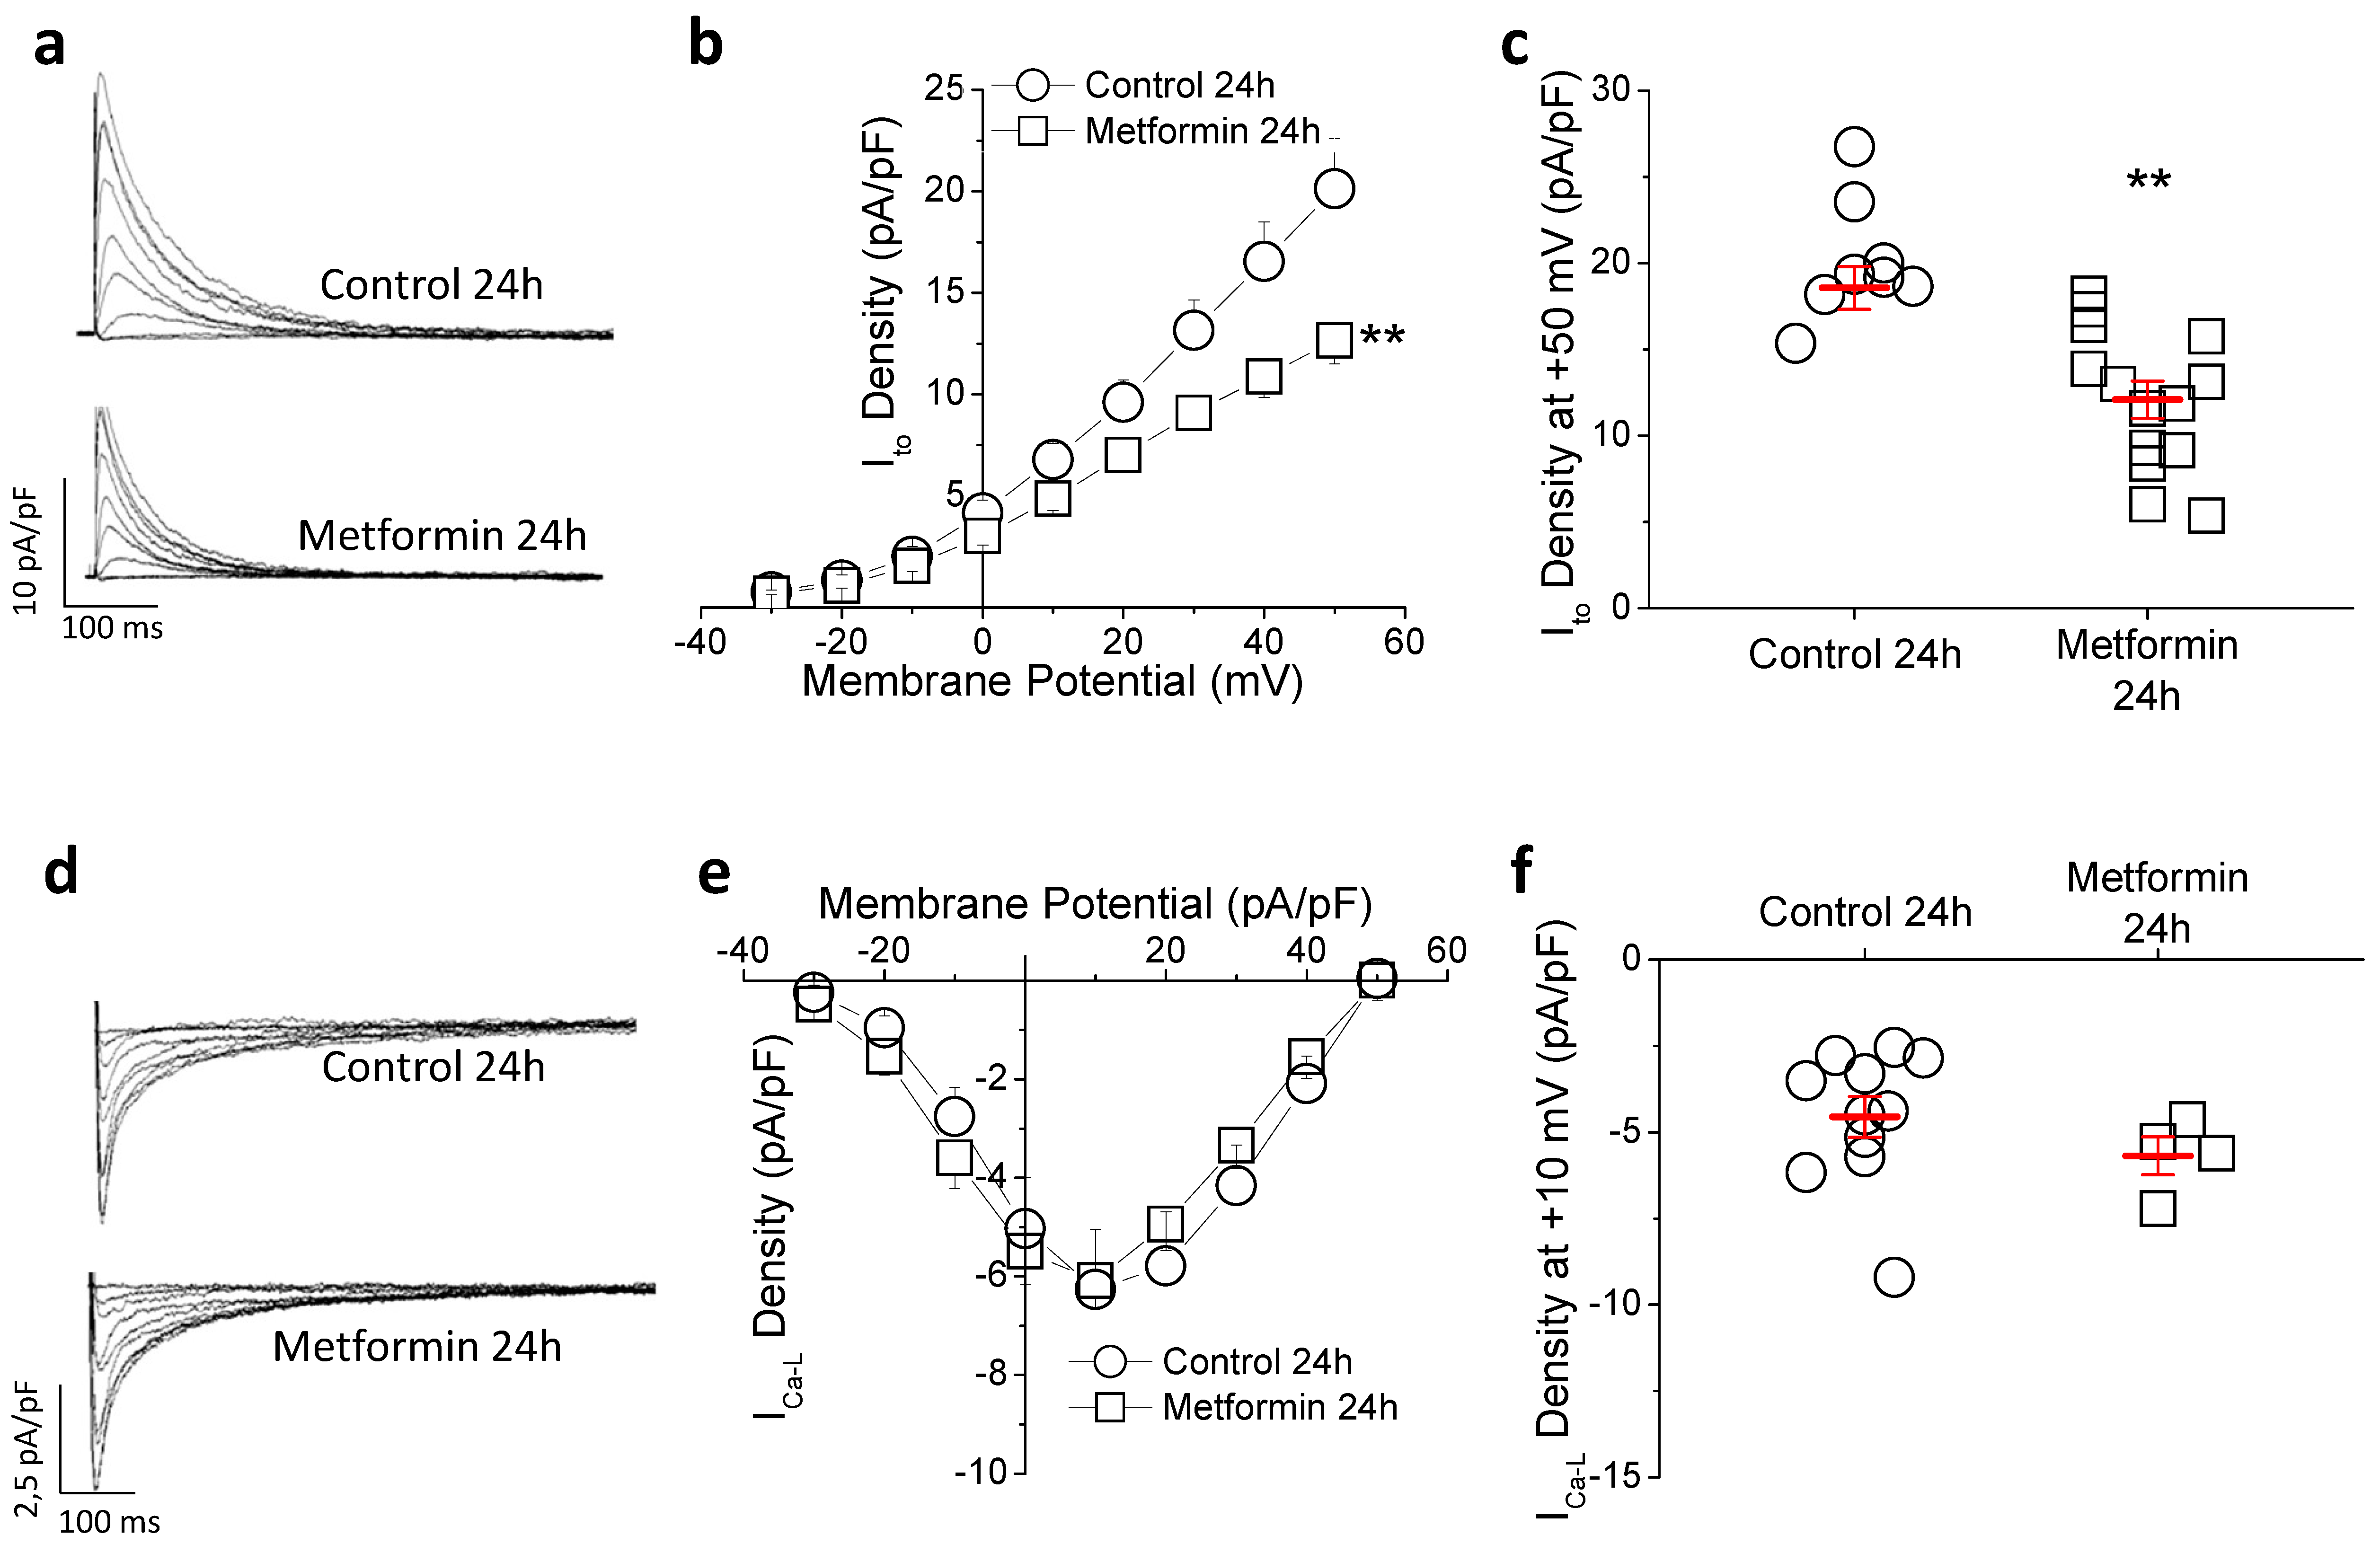
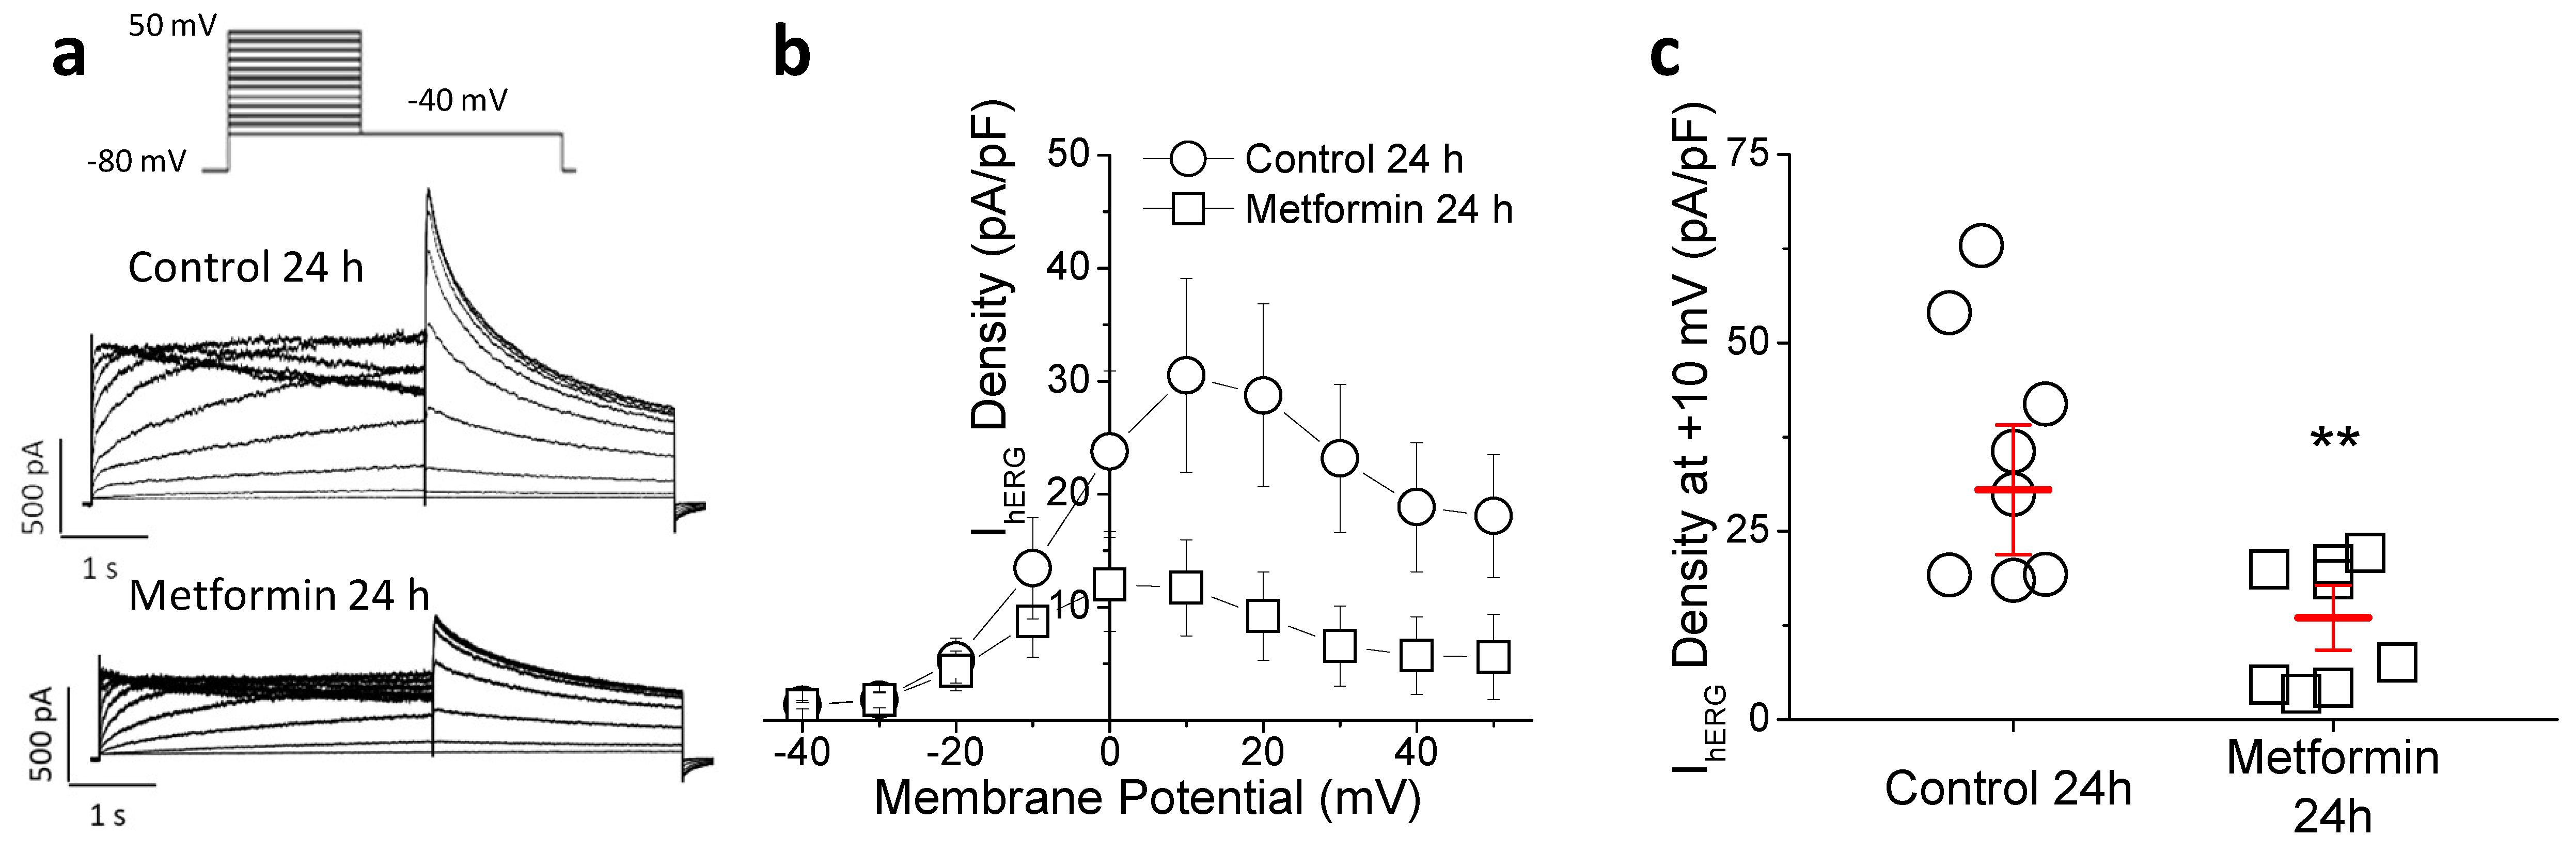
2.3. Metformin Treatment Reduces Transient Outward Potassium but Not L-Type Calcium Current (ICa-L)
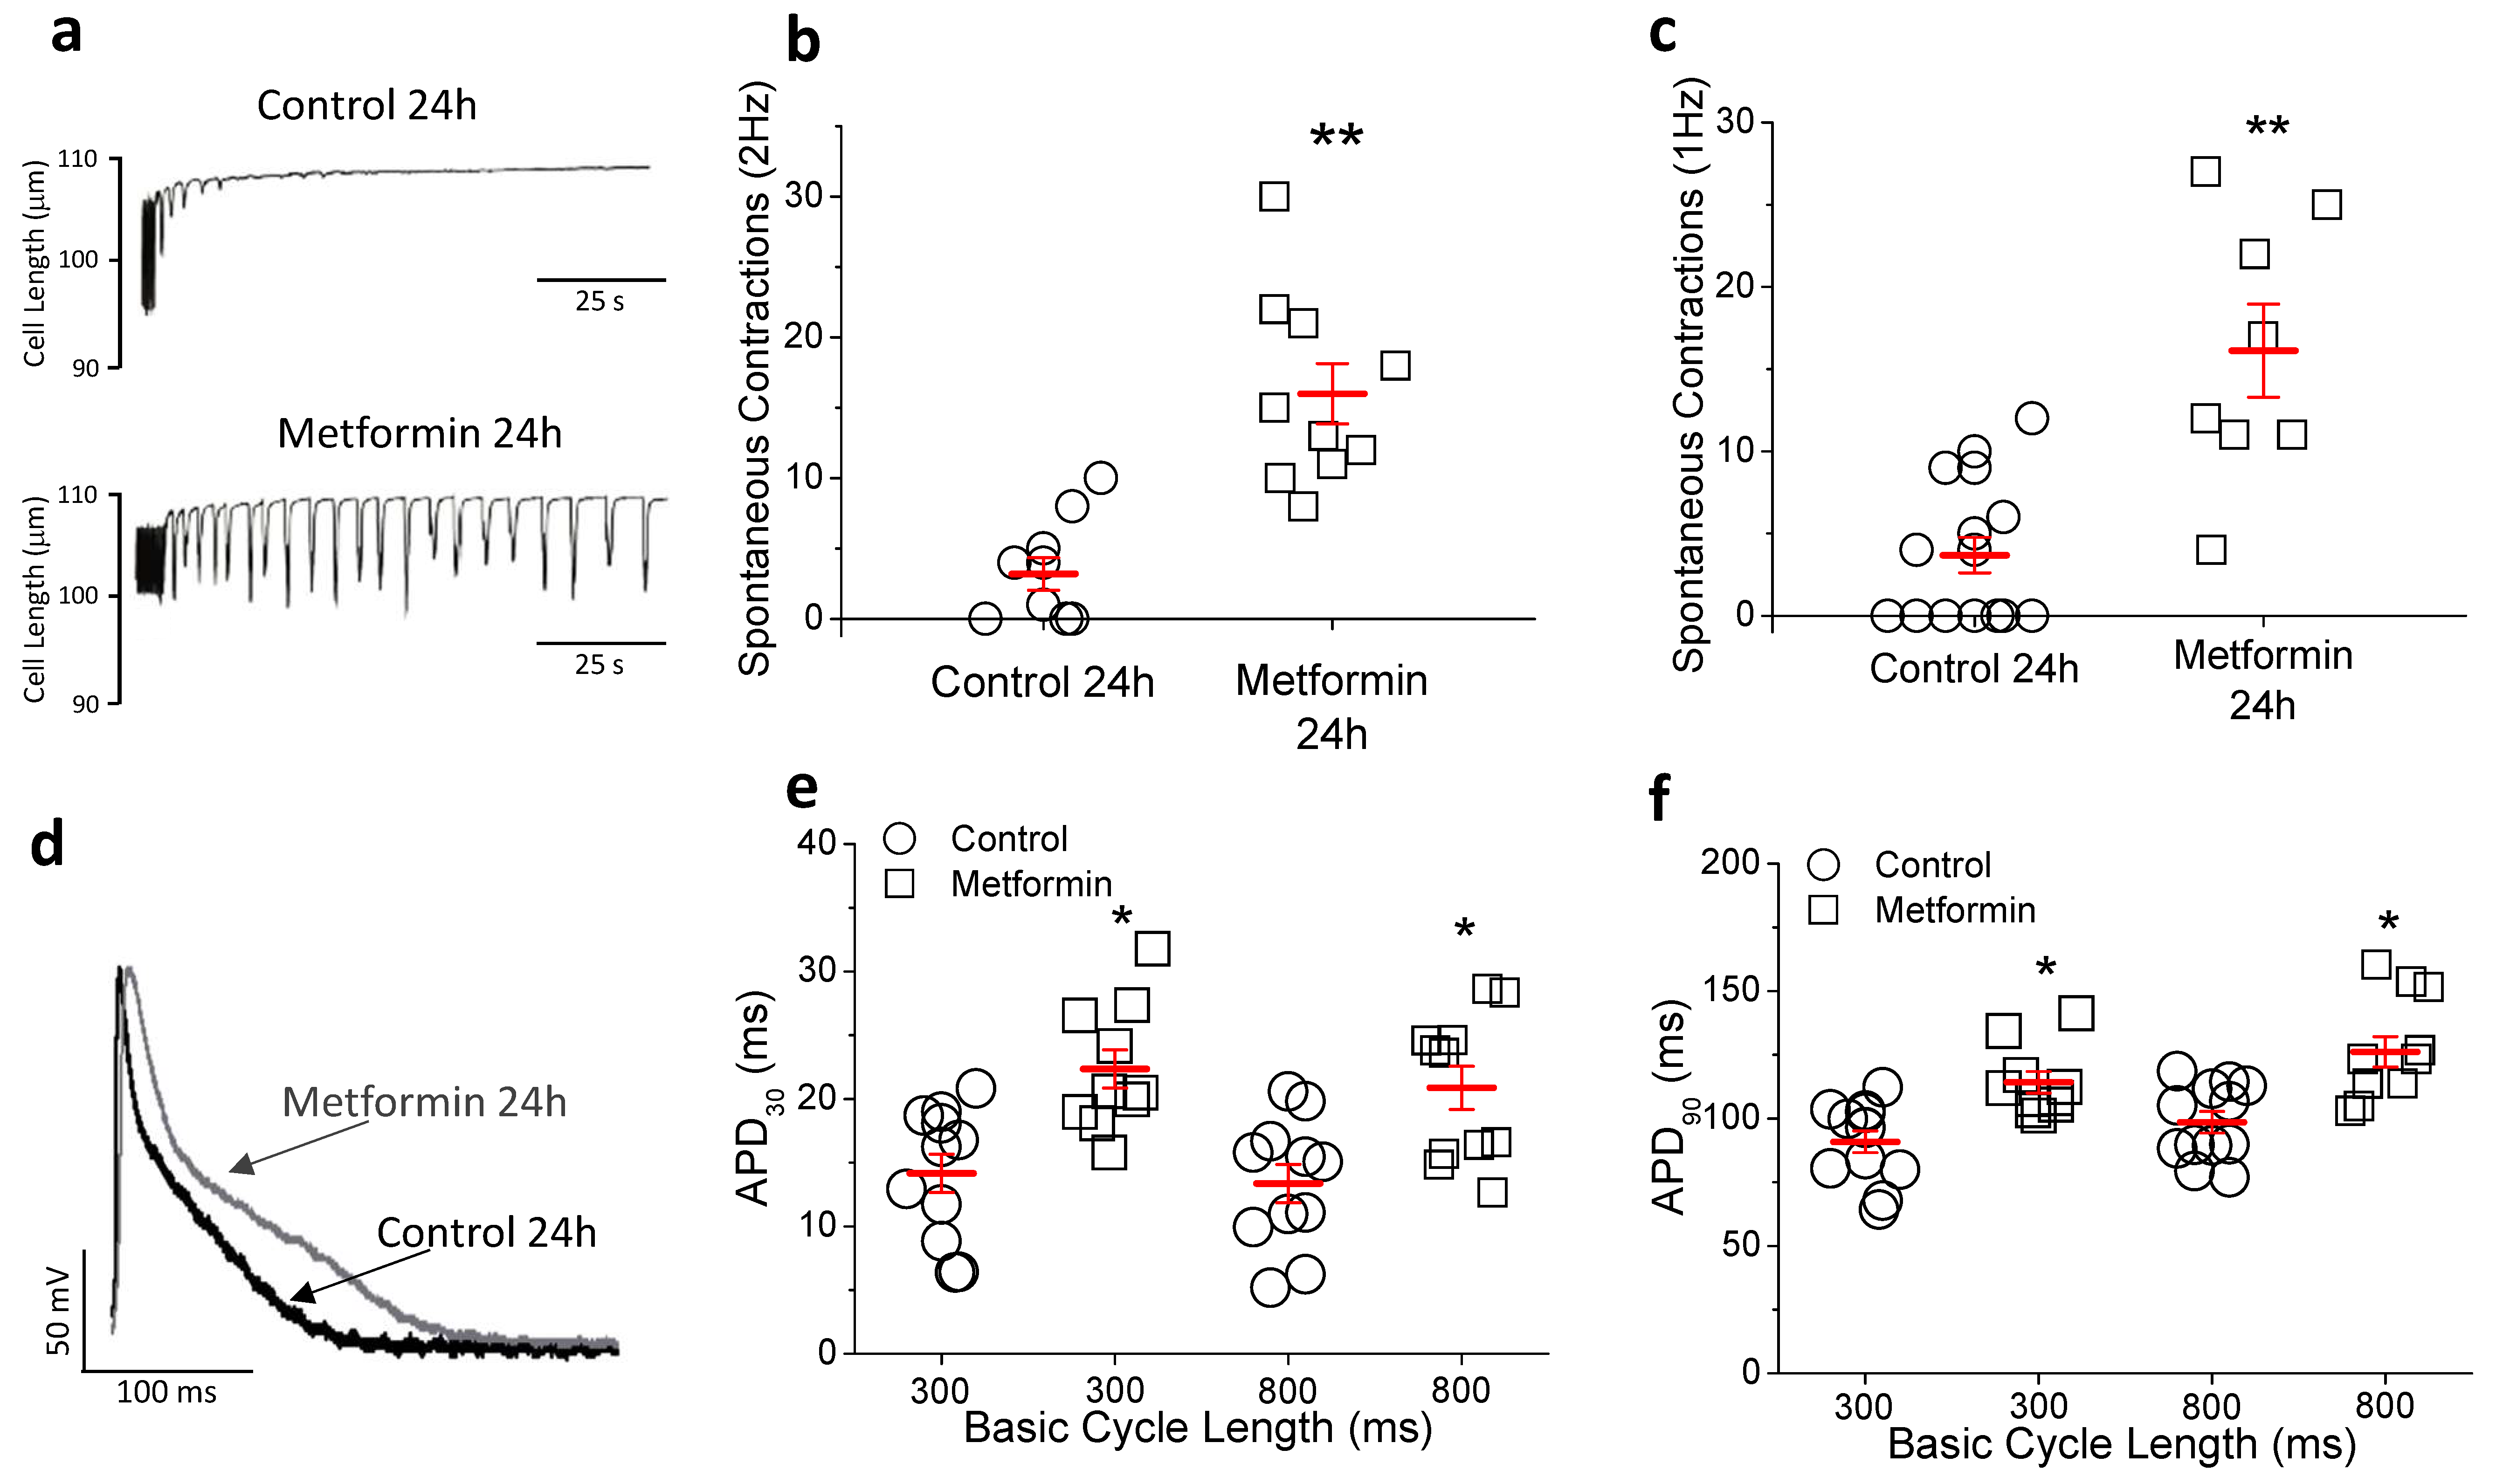
2.4. In Vitro Metformin Reproduces the Effects Observed In Vivo
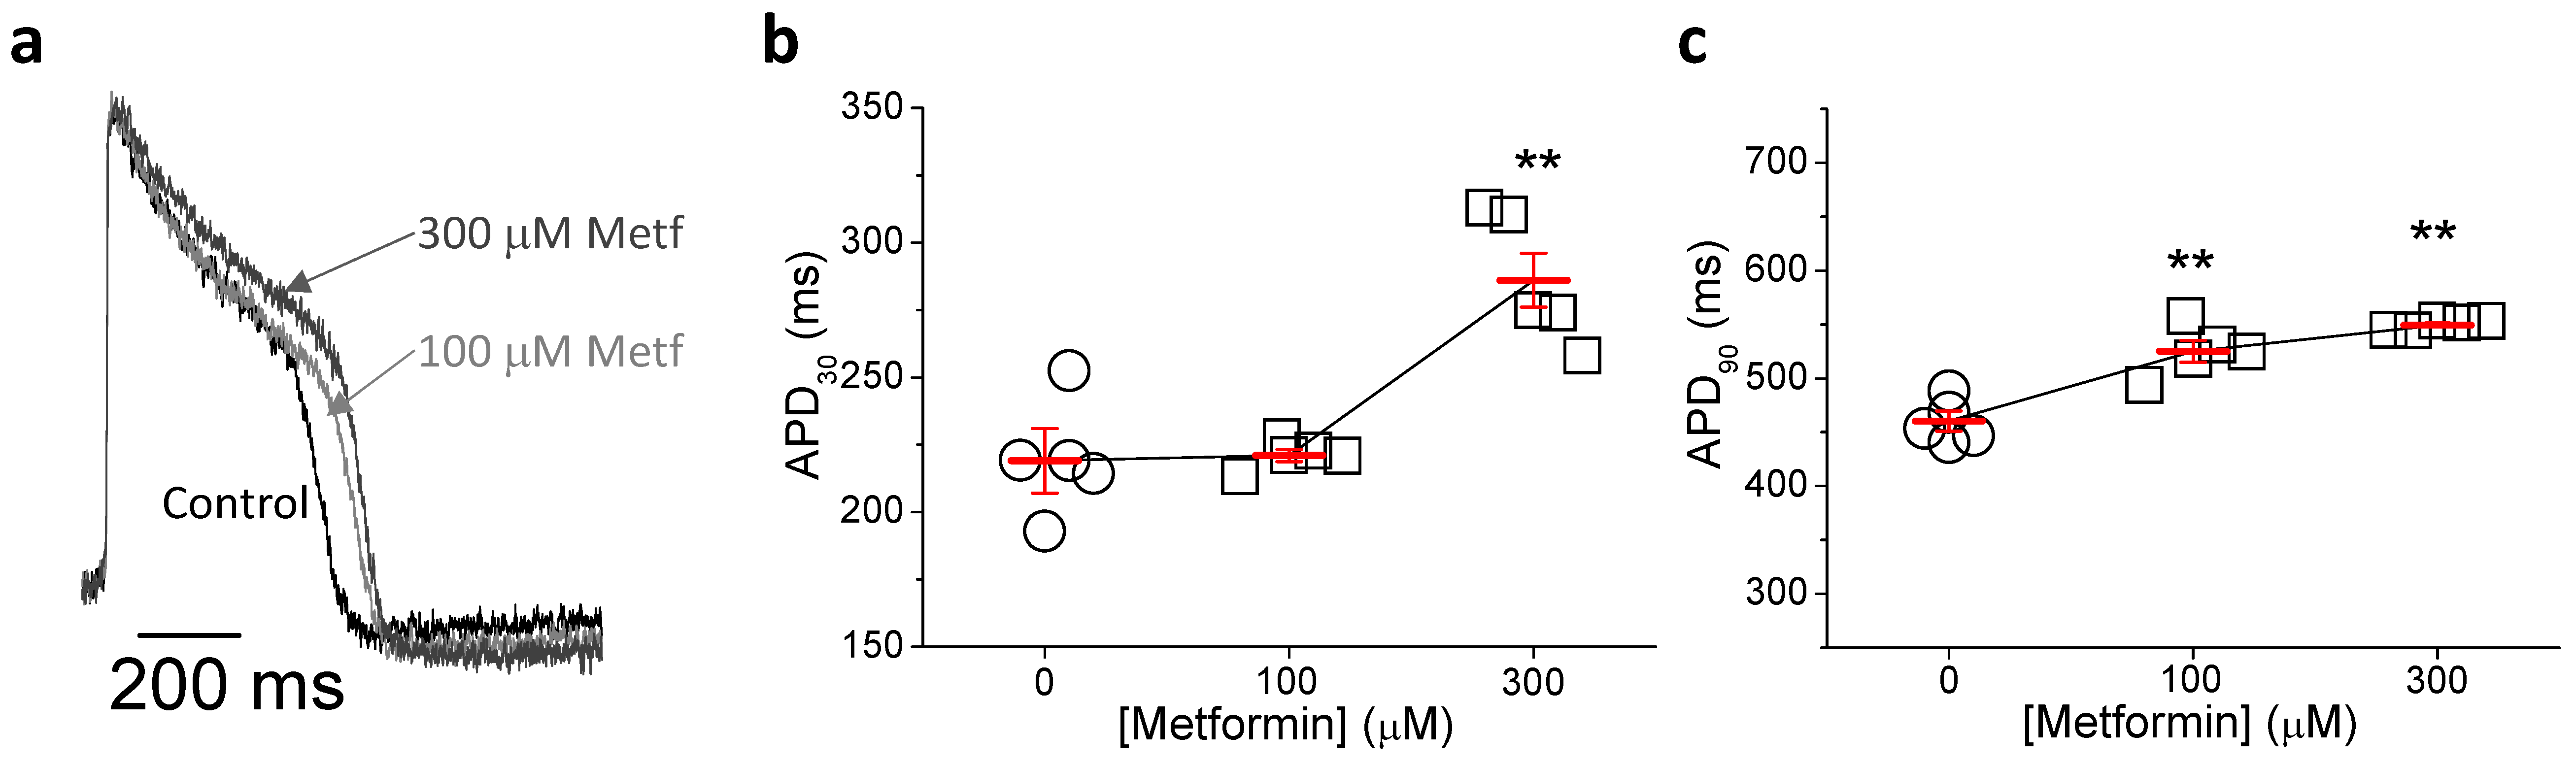
2.5. Metformin Prolongs Repolarization in hIPSC-CMs
3. Discussion
4. Materials and Methods
4.1. Ethics Statement and In Vivo Treatment
4.2. In Vivo ECG Recordings
4.3. Cardiomyocyte Isolation
4.4. Patch-Clamp
4.5. Calcium Handling
4.6. Membrane Potential Recording
4.7. Culture of HEK-hERG Cells
4.8. hiPSC-CMs Cell Culture
4.9. Electrical Activity Measurements in hiPSC-CMs Using Voltage Sensitive Dyes
4.10. Statistics
Supplementary Materials
Author Contributions
Funding
Institutional Review Board Statement
Informed Consent Statement
Data Availability Statement
Acknowledgments
Conflicts of Interest
References
- Zhou, B.; Lu, Y.; Hajifathalian, K.; Bentham, J.; Di Cesare, M.; Danaei, G.; Bixby, H.; Cowan, M.J.; Ali, M.K.; Taddei, C.; et al. Worldwide trends in diabetes since 1980: A pooled analysis of 751 population-based studies with 4.4 million participants. Lancet 2016, 387, 1513–1530. [Google Scholar] [CrossRef] [Green Version]
- WHO. Global Report on Diabetes. 2021. Available online: http://www.who.int (accessed on 13 March 2022).
- UPKDS Group. Effect of intensive blood-glucose control with metformin on complications in overweight patients with type 2 diabetes (UKPDS 34). Lancet 1998, 352, 854–865. [Google Scholar] [CrossRef]
- Bailey, C.J. Metformin: Historical overview. Diabetologia 2017, 60, 1566–1576. [Google Scholar] [CrossRef] [Green Version]
- Remme, C.A. Sudden cardiac death in diabetes and obesity: Mechanisms and therapeutic strategies. Can. J. Cardiol. 2022, 38, 418–426. [Google Scholar] [CrossRef] [PubMed]
- Svane, J.; Pedersen-Bjergaard, U.; Tfelt-Hansen, J. Diabetes and the Risk of Sudden Cardiac Death. Curr. Cardiol. Rep. 2020, 22, 112–122. [Google Scholar] [CrossRef] [PubMed]
- Gallego, M.; Zayas-Arrabal, J.; Alquiza, A.; Apellaniz, B.; Casis, O. Electrical Features of the Diabetic Myocardium. Arrhythmic and Cardiovascular Safety Considerations in Diabetes. Front. Pharmacol. 2021, 12, 687256. [Google Scholar] [CrossRef]
- Schouten, E.G.; Dekker, J.M.; Meppelink, P.; Kok, F.J.; Vandenbroucke, J.P.; Pool, J. QT interval prolongation predicts cardiovascular mortality in an apparently healthy population. Circulation 1991, 84, 1516–1523. [Google Scholar] [CrossRef] [Green Version]
- Ninkovic, V.M.; Ninkovic, S.M.; Miloradovic, V.; Stanojevic, D.; Babic, M.; Giga, V.; Dobric, M.; Trenell, M.I.; Lalic, N.; Seferovic, P.M.; et al. Prevalence and risk factors for prolonged QT interval and QT dispersion in patients with type 2 diabetes. Acta Diabetol. 2016, 53, 737–744. [Google Scholar] [CrossRef] [Green Version]
- Zayas-Arrabal, J.; Alquiza, A.; Rodríguez-de-Yurre, A.; Echeazarra, L.; Fernández-López, V.; Gallego, M.; ·Casis, O. Kv1.3 Channel Blockade Improves Inflammatory Profile, Reduces Cardiac Electrical Remodeling, and Prevents Arrhythmia in Type 2 Diabetic Rats. Cardiovasc. Drugs Ther. 2021, 1–11. [Google Scholar] [CrossRef]
- Ostropolets, A.; Elias, P.A.; Reyes, M.V.; Wan, E.Y.; Pajvani, U.B.; Hripcsak, G.; Morrow, J.P. Metformin Is Associated with a Lower Risk of Atrial Fibrillation and Ventricular Arrhythmias Compared with Sulfonylureas. An Observational Study. Circ. Arrhythm. Electrophysiol. 2021, 14, e009115. [Google Scholar] [CrossRef]
- Nantsupawat, T.; Wongcharoen, W.; Chattipakorn, S.C.; Chattipakorn, N. Effects of metformin on atrial and ventricular arrhythmias: Evidence from cell to patient. Cardiovasc. Diabetol. 2020, 19, 198. [Google Scholar] [CrossRef] [PubMed]
- Davis, T.M.; Parsons, R.W.; Broadhurst, R.J.; Hobbs, M.S.; Jamrozik, K. Arrhythmias and mortality after myocardial infarction in diabetic patients. Relationship to diabetes treatment. Diabetes Care 1998, 21, 637–640. [Google Scholar] [CrossRef] [PubMed]
- Cacciapuoti, F.; Spiezia, R.; Bianchi, U.; Lama, D.; D’Avino, M.; Varricchio, M. Effectiveness of glibenclamide on myocardial ischemic ventricular arrhythmias in non-insulin-dependent diabetes mellitus. Am. J. Cardiol. 1991, 67, 843–847. [Google Scholar] [CrossRef]
- He, L.; Wondisford, F.E. Metformin action: Concentrations matter. Cell. Metab. 2015, 21, 159–162. [Google Scholar] [CrossRef] [PubMed] [Green Version]
- Thomsen, M.B.; Verduyn, S.C.; Stengl, M.; Beekman, J.D.; de Pater, G.; Van Opstal, J.M.; Volders, P.G.; Vos, M.A. Increased short-term variability of repolarization predicts d-sotalol-Induced torsades de tointes in dogs. Circulation 2004, 110, 2453–2459. [Google Scholar] [CrossRef] [PubMed] [Green Version]
- Orosz, A.; Baczkó, I.; Nyiraty, S.; Körei, A.E.; Putz, Z.; Takács, R.; Nemes, A.; Várkonyi, T.T.; Balogh, L.; Ábrahám, G.; et al. Increased Short-Term Beat-to-Beat QT Interval Variability in Patients with Impaired Glucose Tolerance. Front. Endocrinol. 2017, 8, 129. [Google Scholar] [CrossRef] [PubMed]
- Li, J.; Li, B.; Bai, F.; Ma, Y.; Liu, N.; Liu, Y.; Wang, Y.; Liu, Q. Metformin therapy confers cardioprotection against the remodeling of gap junction in tachycardia induced atrial fibrillation dog model. Life Sci. 2020, 254, 117759. [Google Scholar] [CrossRef]
- Wang, H.; Wang, C.; Lu, Y.; Yan, Y.; Leng, D.; Tian, S.; Zheng, D.; Wang, Z.; Bai, Y. Metformin shortens prolonged QT interval in diabetic mice by inhibiting L-type calcium current: A possible therapeutic approach. Front. Pharmacol. 2020, 11, 614. [Google Scholar] [CrossRef]
- Ma, J.; Guo, L.; Fiene, S.J.; Anson, B.D.; Thomson, J.A.; Kamp, T.J.; Kolaja, K.L.; Swanson, B.J.; January, C.T. High purity human-induced pluripotent stem cell-derived cardiomyocytes: Electrophysiological properties of action potentials and ionic currents. Am. J. Physiol.-Heart Circ. Physiol. 2011, 301, H2006–H2017. [Google Scholar] [CrossRef]
- Cordeiro, J.M.; Nesterenko, V.V.; Sicouri, S.; Goodrow, R.J.; Treat, J.A.; Desai, M.; Wu, Y.; Doss, M.X.; Antzelevitch, C.; Di Diego, J.M. Identification and characterization of a transient outward K+ current in human induced pluripotent stem cell-derived cardiomyocytes. J. Mol. Cell. Cardiol. 2013, 60, 36–46. [Google Scholar] [CrossRef] [Green Version]
- Zhou, G.; Myers, R.; Li, Y.; Chen, Y.; Shen, X.; Fenyk-Melody, J.; Wu, M.; Ventre, J.; Doebber, T.; Fujii, N.; et al. Role of AMP-activated protein kinase in mechanism of metformin action. J. Clin. Investig. 2001, 108, 1167–1174. [Google Scholar] [CrossRef] [PubMed]
- Torres-Jacome, J.; Gallego, M.; Rodriguez-Robledo, J.M.; Sánchez-Chapula, J.A.; Casis, O. Improvement of the metabolic status recovers cardiac potassium cannel synthesis in experimental diabetes. Acta Physiol. 2013, 207, 447–449. [Google Scholar] [CrossRef] [PubMed]
- Almilaji, A.; Munoz, C.; Elvira, B.; Fajol, A.; Pakladok, T.; Honisch, S.; Shumilina, E.; Lang, F.; Föller, M. AMP-activated protein kinase regulates hERG potassium channel. Pflug. Arch. 2013, 465, 1573–1582. [Google Scholar] [CrossRef] [PubMed]
- Foretz, M.; He’brard, S.; Leclerc, J.; Zarrinpashneh, E.; Soty, M.; Mithieux, G.; Sakamoto, K.; Andreelli, F.; Viollet, B. Metformin inhibits hepatic gluconeogenesis in mice independently of the LKB1/AMPK pathway via a decrease in hepatic energy state. J. Clin. Investig. 2010, 120, 2355–2369. [Google Scholar] [CrossRef] [Green Version]
- Ter Keurs, H.E.; Boyden, P.A. Calcium and arrhythmogenesis. Physiol. Rev. 2007, 87, 457–506. [Google Scholar] [CrossRef]
- Aroda, V.R.; Knowler, W.C.; Crandall, J.P.; Group DPPR. Metformin for diabetes prevention: Insights gained from the Diabetes Prevention Program/Diabetes Prevention Program Outcomes Study. Diabetologia 2017, 60, 1601–1611. [Google Scholar] [CrossRef] [Green Version]
- Igel, L.I.; Sinha, A.; Saunders, K.H.; Apovian, C.M.; Vojta, D.; Aronne, L.J. Metformin: An old therapy that deserves a new indicator for the treatment of obesity. Curr. Atheroscler. Rep. 2016, 18, 6. [Google Scholar] [CrossRef]
- De Silva, V.A.; Suraweera, C.; Ratnatunga, S.S.; Dayabandara, M.; Wanniarachchi, N.; Hanwella, R. Metformin in prevention and treatment of antipsychotic induced weight gain: A systematic review and meta-analysis. BMC Psychiatry 2016, 16, 341. [Google Scholar] [CrossRef] [Green Version]
- Sam, S.; Ehrmann, D.A. Metformin therapy for the reproductive and metabolic consequences of polycystic ovary syndrome. Diabetologia 2017, 60, 1656–1661. [Google Scholar] [CrossRef]
- Erickson, J.R.; Pereira, L.; Wang, L.; Han, G.; Ferguson, A.; Dao, K.; Copeland, R.J.; Despa, F.; Hart, G.W.; Ripplinger, C.M.; et al. Diabetic hyperglycaemia activates CaMKII and arrhythmias by O-linked glycosylation. Nature 2013, 502, 372–376. [Google Scholar] [CrossRef]
- Curtis, M.J.; Hancox, J.C.; Farkas, A.; Wainwright, C.L.; Stables, C.L.; Saint, D.A.; Clements-Jewery, H.; Lambiase, P.D.; Billman, G.E.; Janse, M.J.; et al. The Lambeth Conventions (II): Guidelines for the study of animal and human ventricular and supraventricular arrhythmias. Pharmacol. Ther. 2013, 139, 213–248. [Google Scholar] [CrossRef] [PubMed]
- Zhou, Z.; Gong, Q.; Ye, B.; Fan, Z.; Makielski, J.C.; Robertson, G.A.; January, C.T. Properties of HERG channels stably expressed in HEK 293 cells studied at physiological temperature. Biophys. J. 1998, 74, 230–241. [Google Scholar] [CrossRef] [Green Version]
- Hortigón-Vinagre, M.P.; Zamora, V.; Burton, F.L.; Green, J.; Gintant, G.A.; Smith, G. The Use of ratiometric fluorescence measurements of the voltage sensitive dye Di-4-ANEPPS to examine action potential characteristics and drug effects on human induced pluripotent stem cell-derived cardiomyocytes. Toxicol. Sci. 2016, 154, 320–331. [Google Scholar] [CrossRef] [PubMed] [Green Version]


Publisher’s Note: MDPI stays neutral with regard to jurisdictional claims in published maps and institutional affiliations. |
© 2022 by the authors. Licensee MDPI, Basel, Switzerland. This article is an open access article distributed under the terms and conditions of the Creative Commons Attribution (CC BY) license (https://creativecommons.org/licenses/by/4.0/).
Share and Cite
Malagueta-Vieira, L.; Fernández-Ruocco, J.; Hortigón-Vinagre, M.P.; Zamora, V.; Zayas-Arrabal, J.; Echeazarra, L.; Smith, G.L.; Vila Petroff, M.; Medei, E.; Casis, Ó.; et al. Metformin Reduces Potassium Currents and Prolongs Repolarization in Non-Diabetic Heart. Int. J. Mol. Sci. 2022, 23, 6021. https://0-doi-org.brum.beds.ac.uk/10.3390/ijms23116021
Malagueta-Vieira L, Fernández-Ruocco J, Hortigón-Vinagre MP, Zamora V, Zayas-Arrabal J, Echeazarra L, Smith GL, Vila Petroff M, Medei E, Casis Ó, et al. Metformin Reduces Potassium Currents and Prolongs Repolarization in Non-Diabetic Heart. International Journal of Molecular Sciences. 2022; 23(11):6021. https://0-doi-org.brum.beds.ac.uk/10.3390/ijms23116021
Chicago/Turabian StyleMalagueta-Vieira, Layse, Julieta Fernández-Ruocco, María P. Hortigón-Vinagre, Víctor Zamora, Julián Zayas-Arrabal, Leyre Echeazarra, Godfrey L. Smith, Martín Vila Petroff, Emiliano Medei, Óscar Casis, and et al. 2022. "Metformin Reduces Potassium Currents and Prolongs Repolarization in Non-Diabetic Heart" International Journal of Molecular Sciences 23, no. 11: 6021. https://0-doi-org.brum.beds.ac.uk/10.3390/ijms23116021