
Role of Organic Cation Transporter 2 in Autophagy Induced by Platinum Derivatives


Abstract
:1. Introduction
2. Results
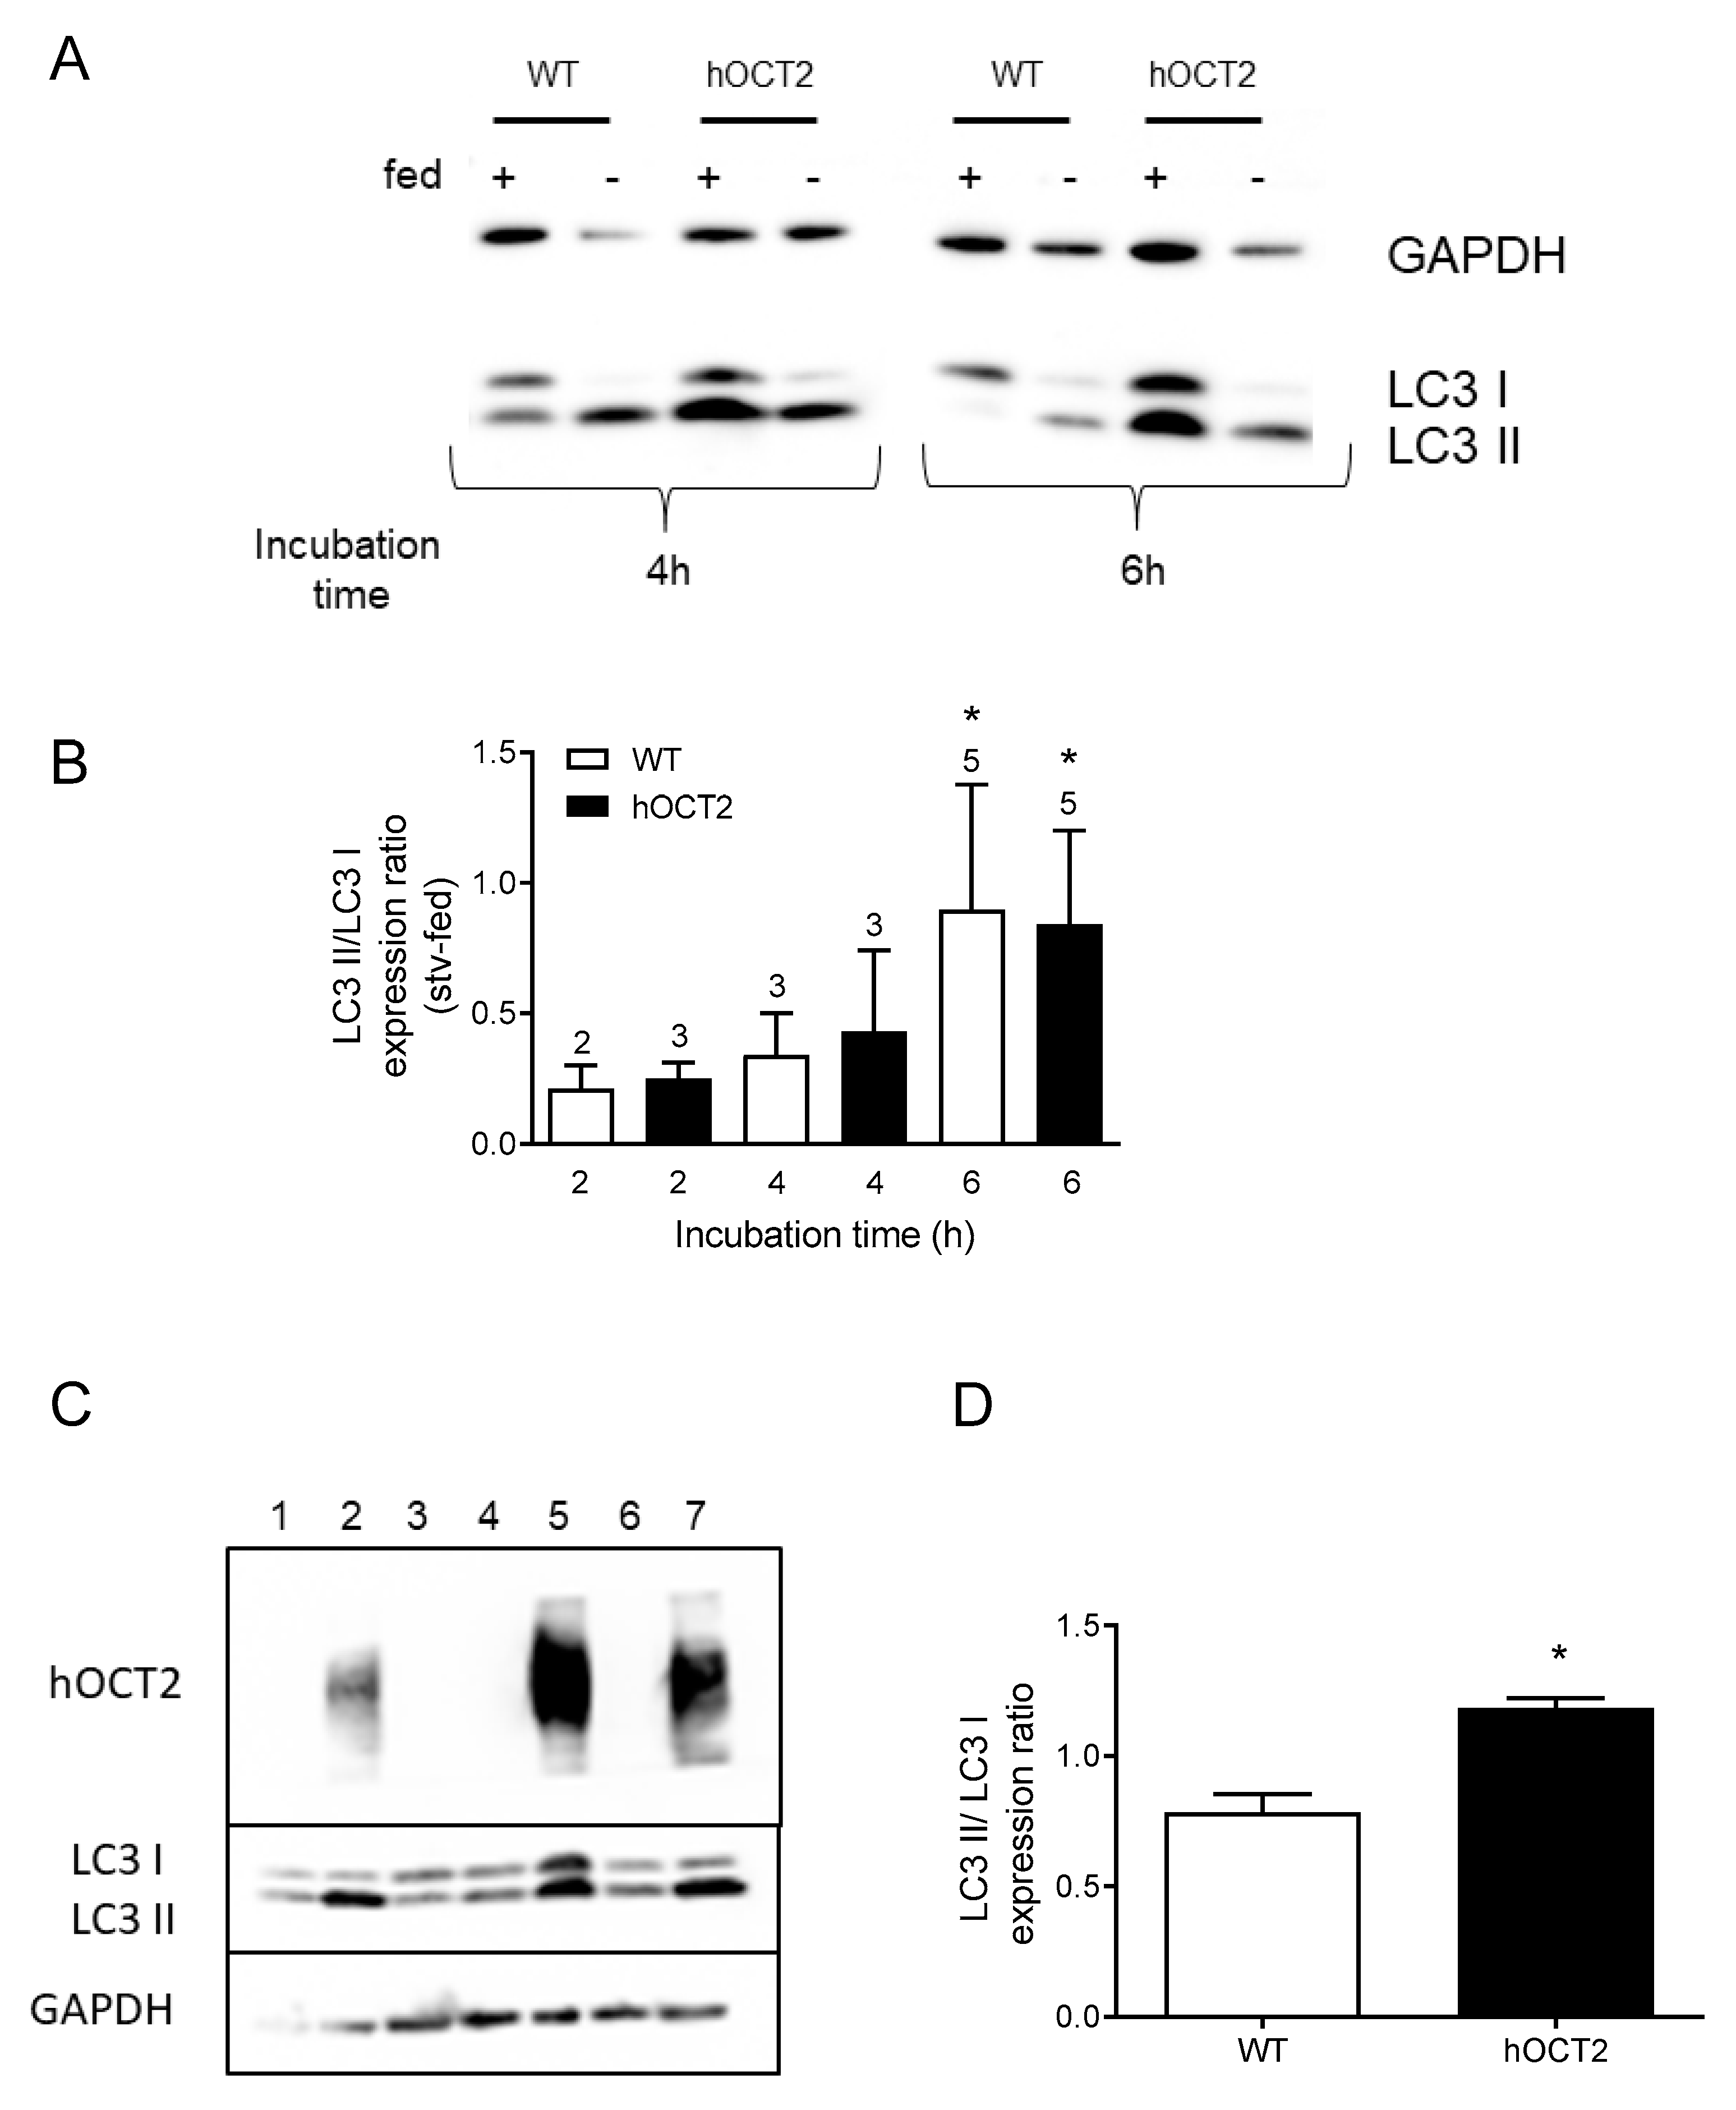
2.1. Starvation Promotes LC3 II Accumulation in HEK293 Cells
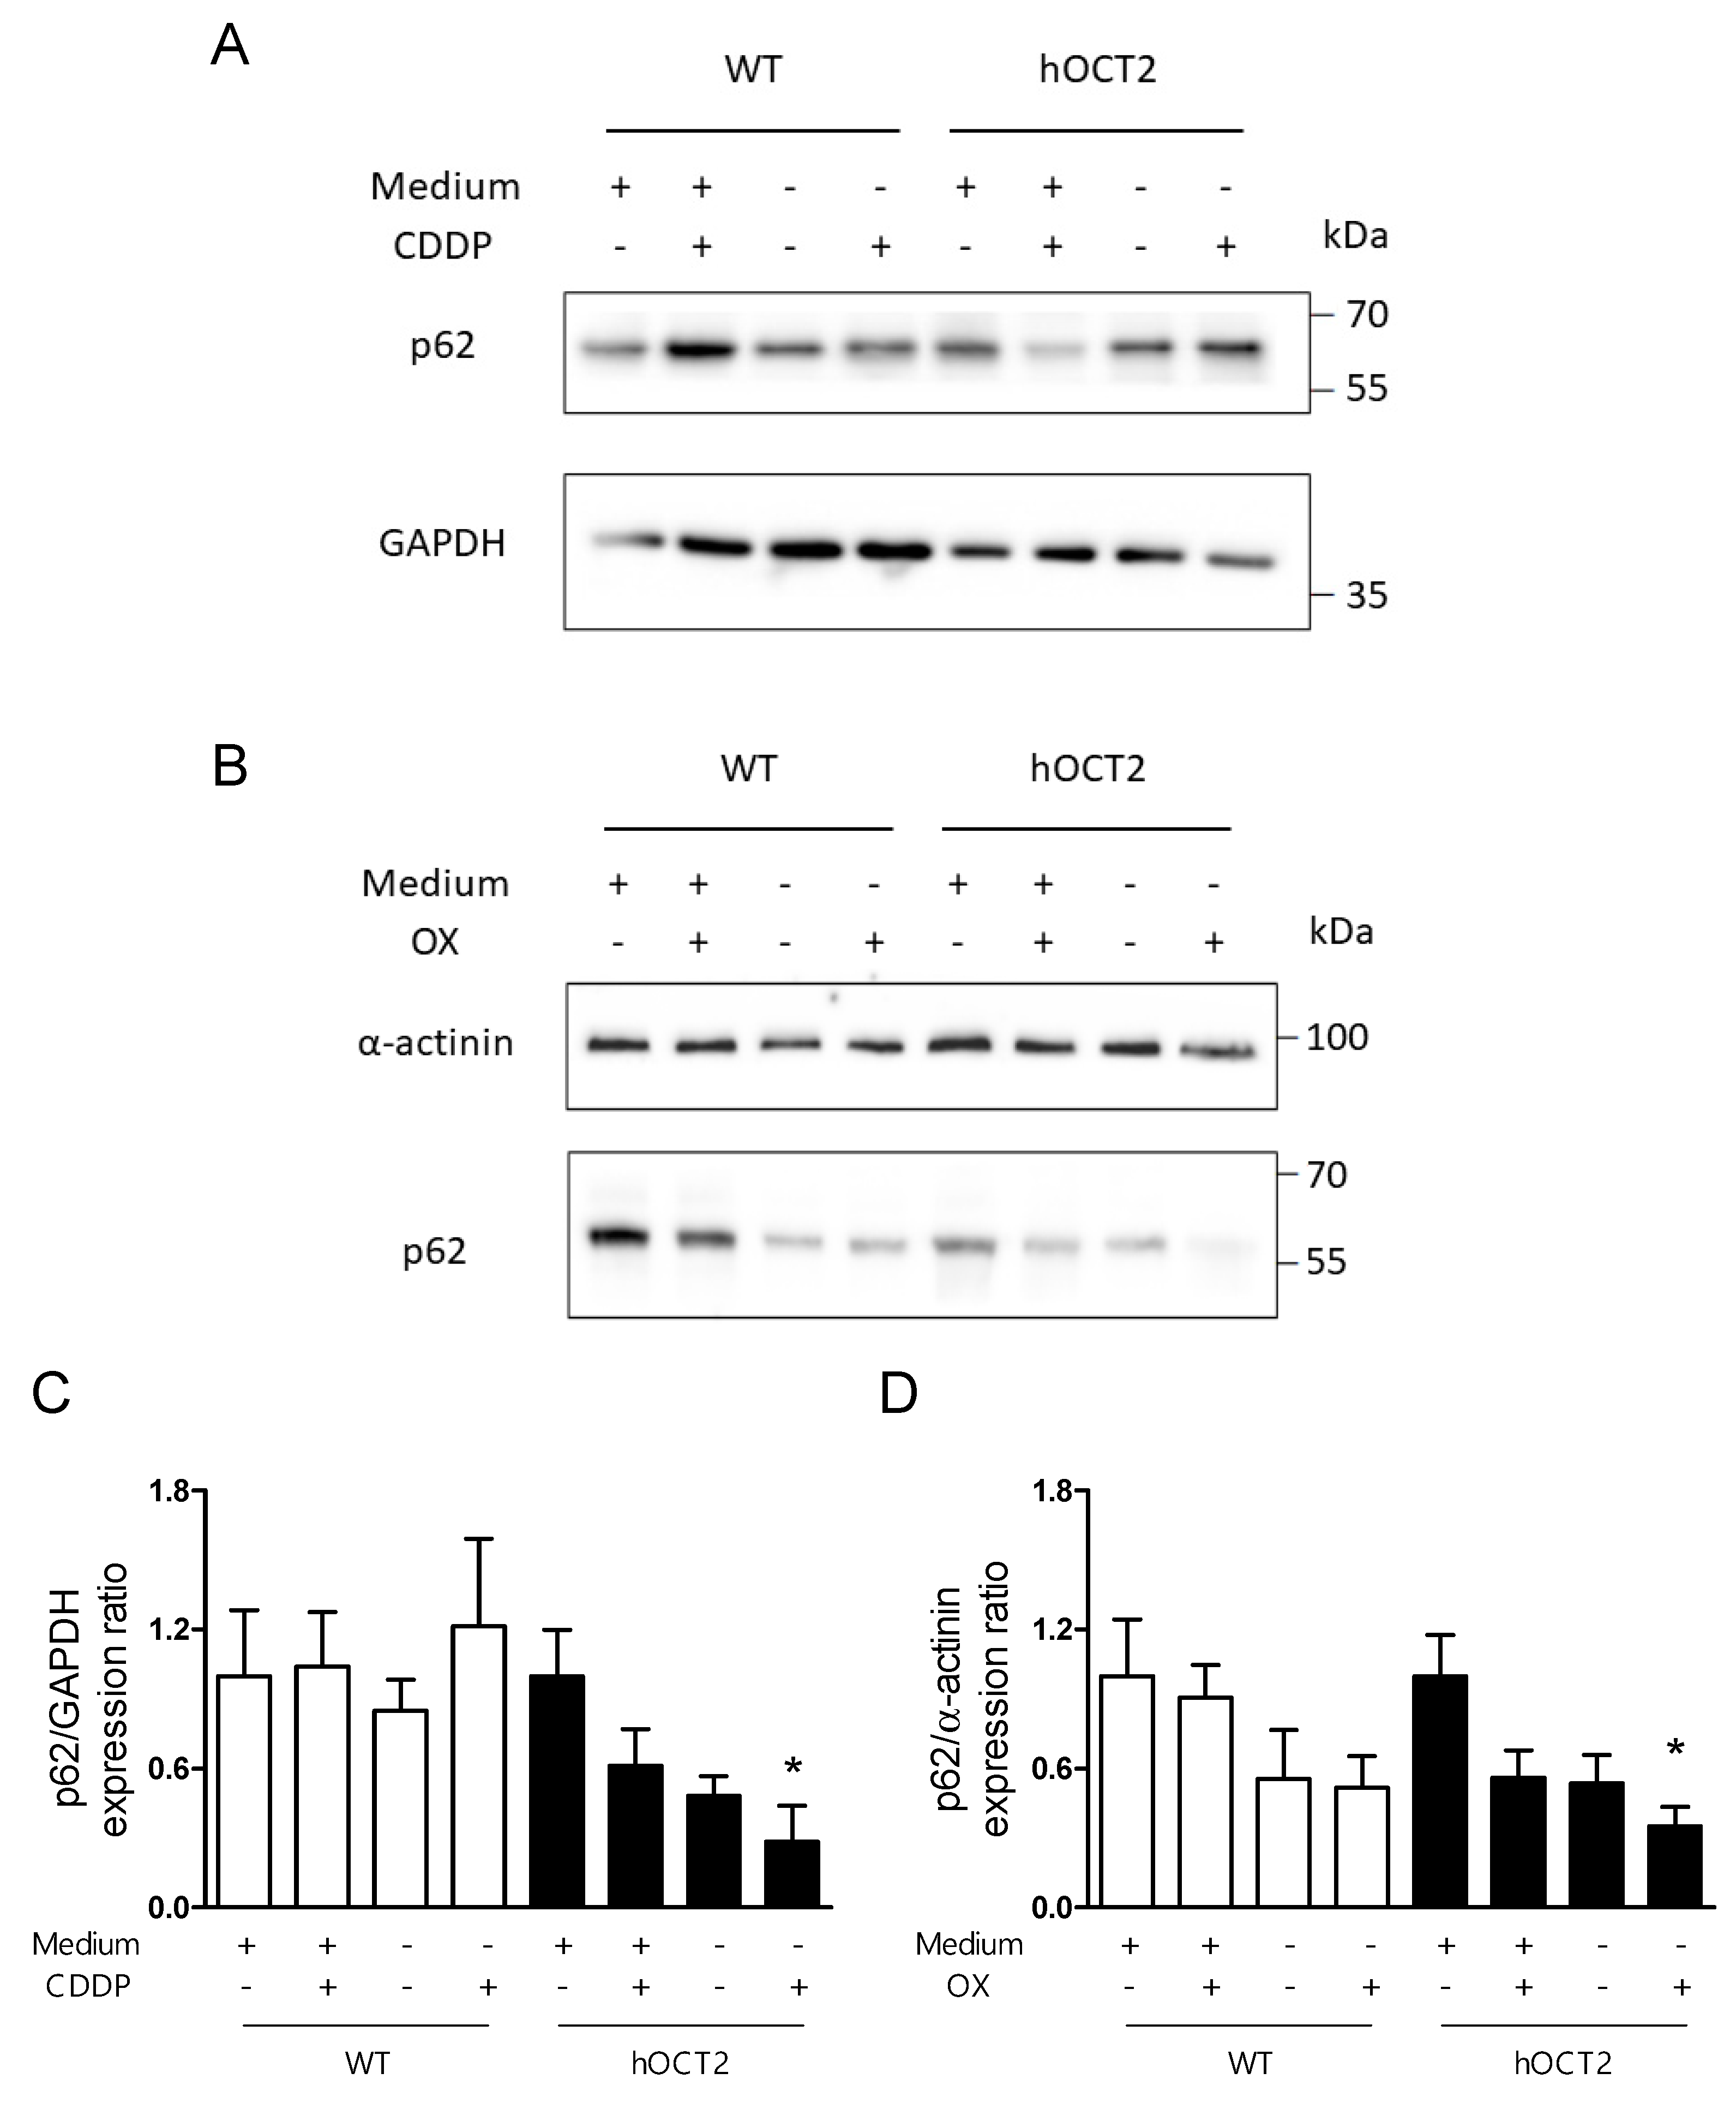
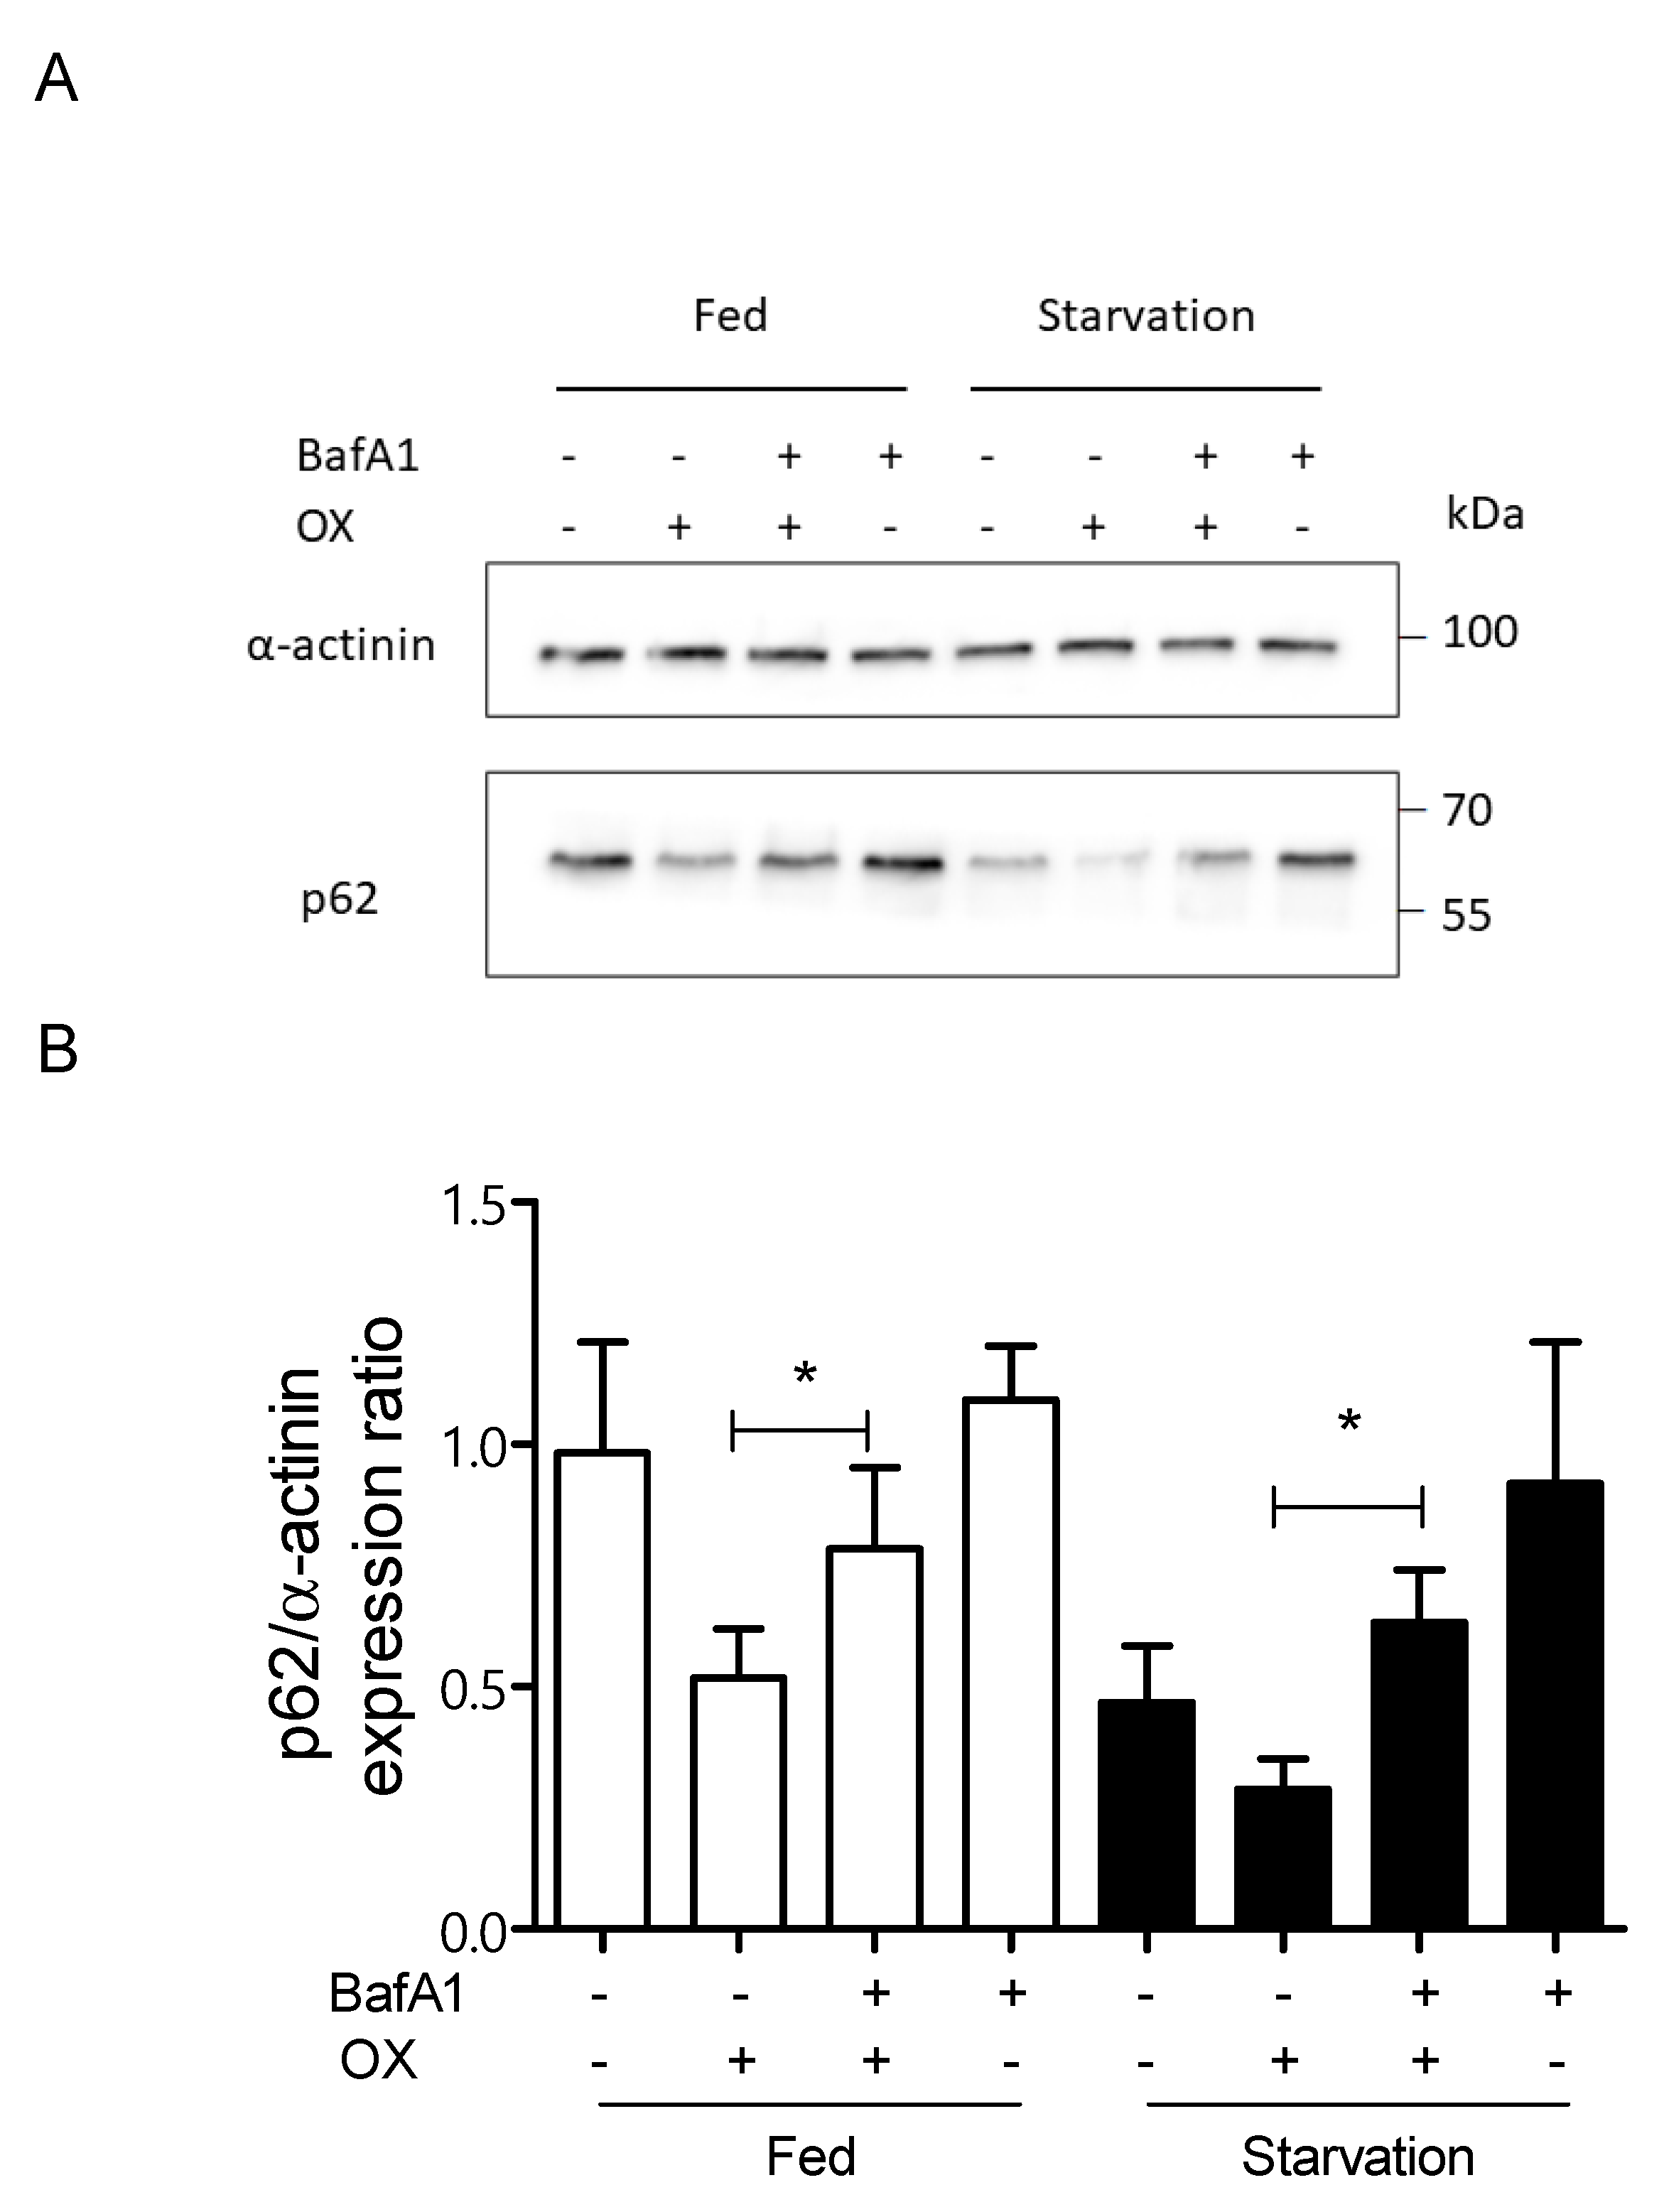
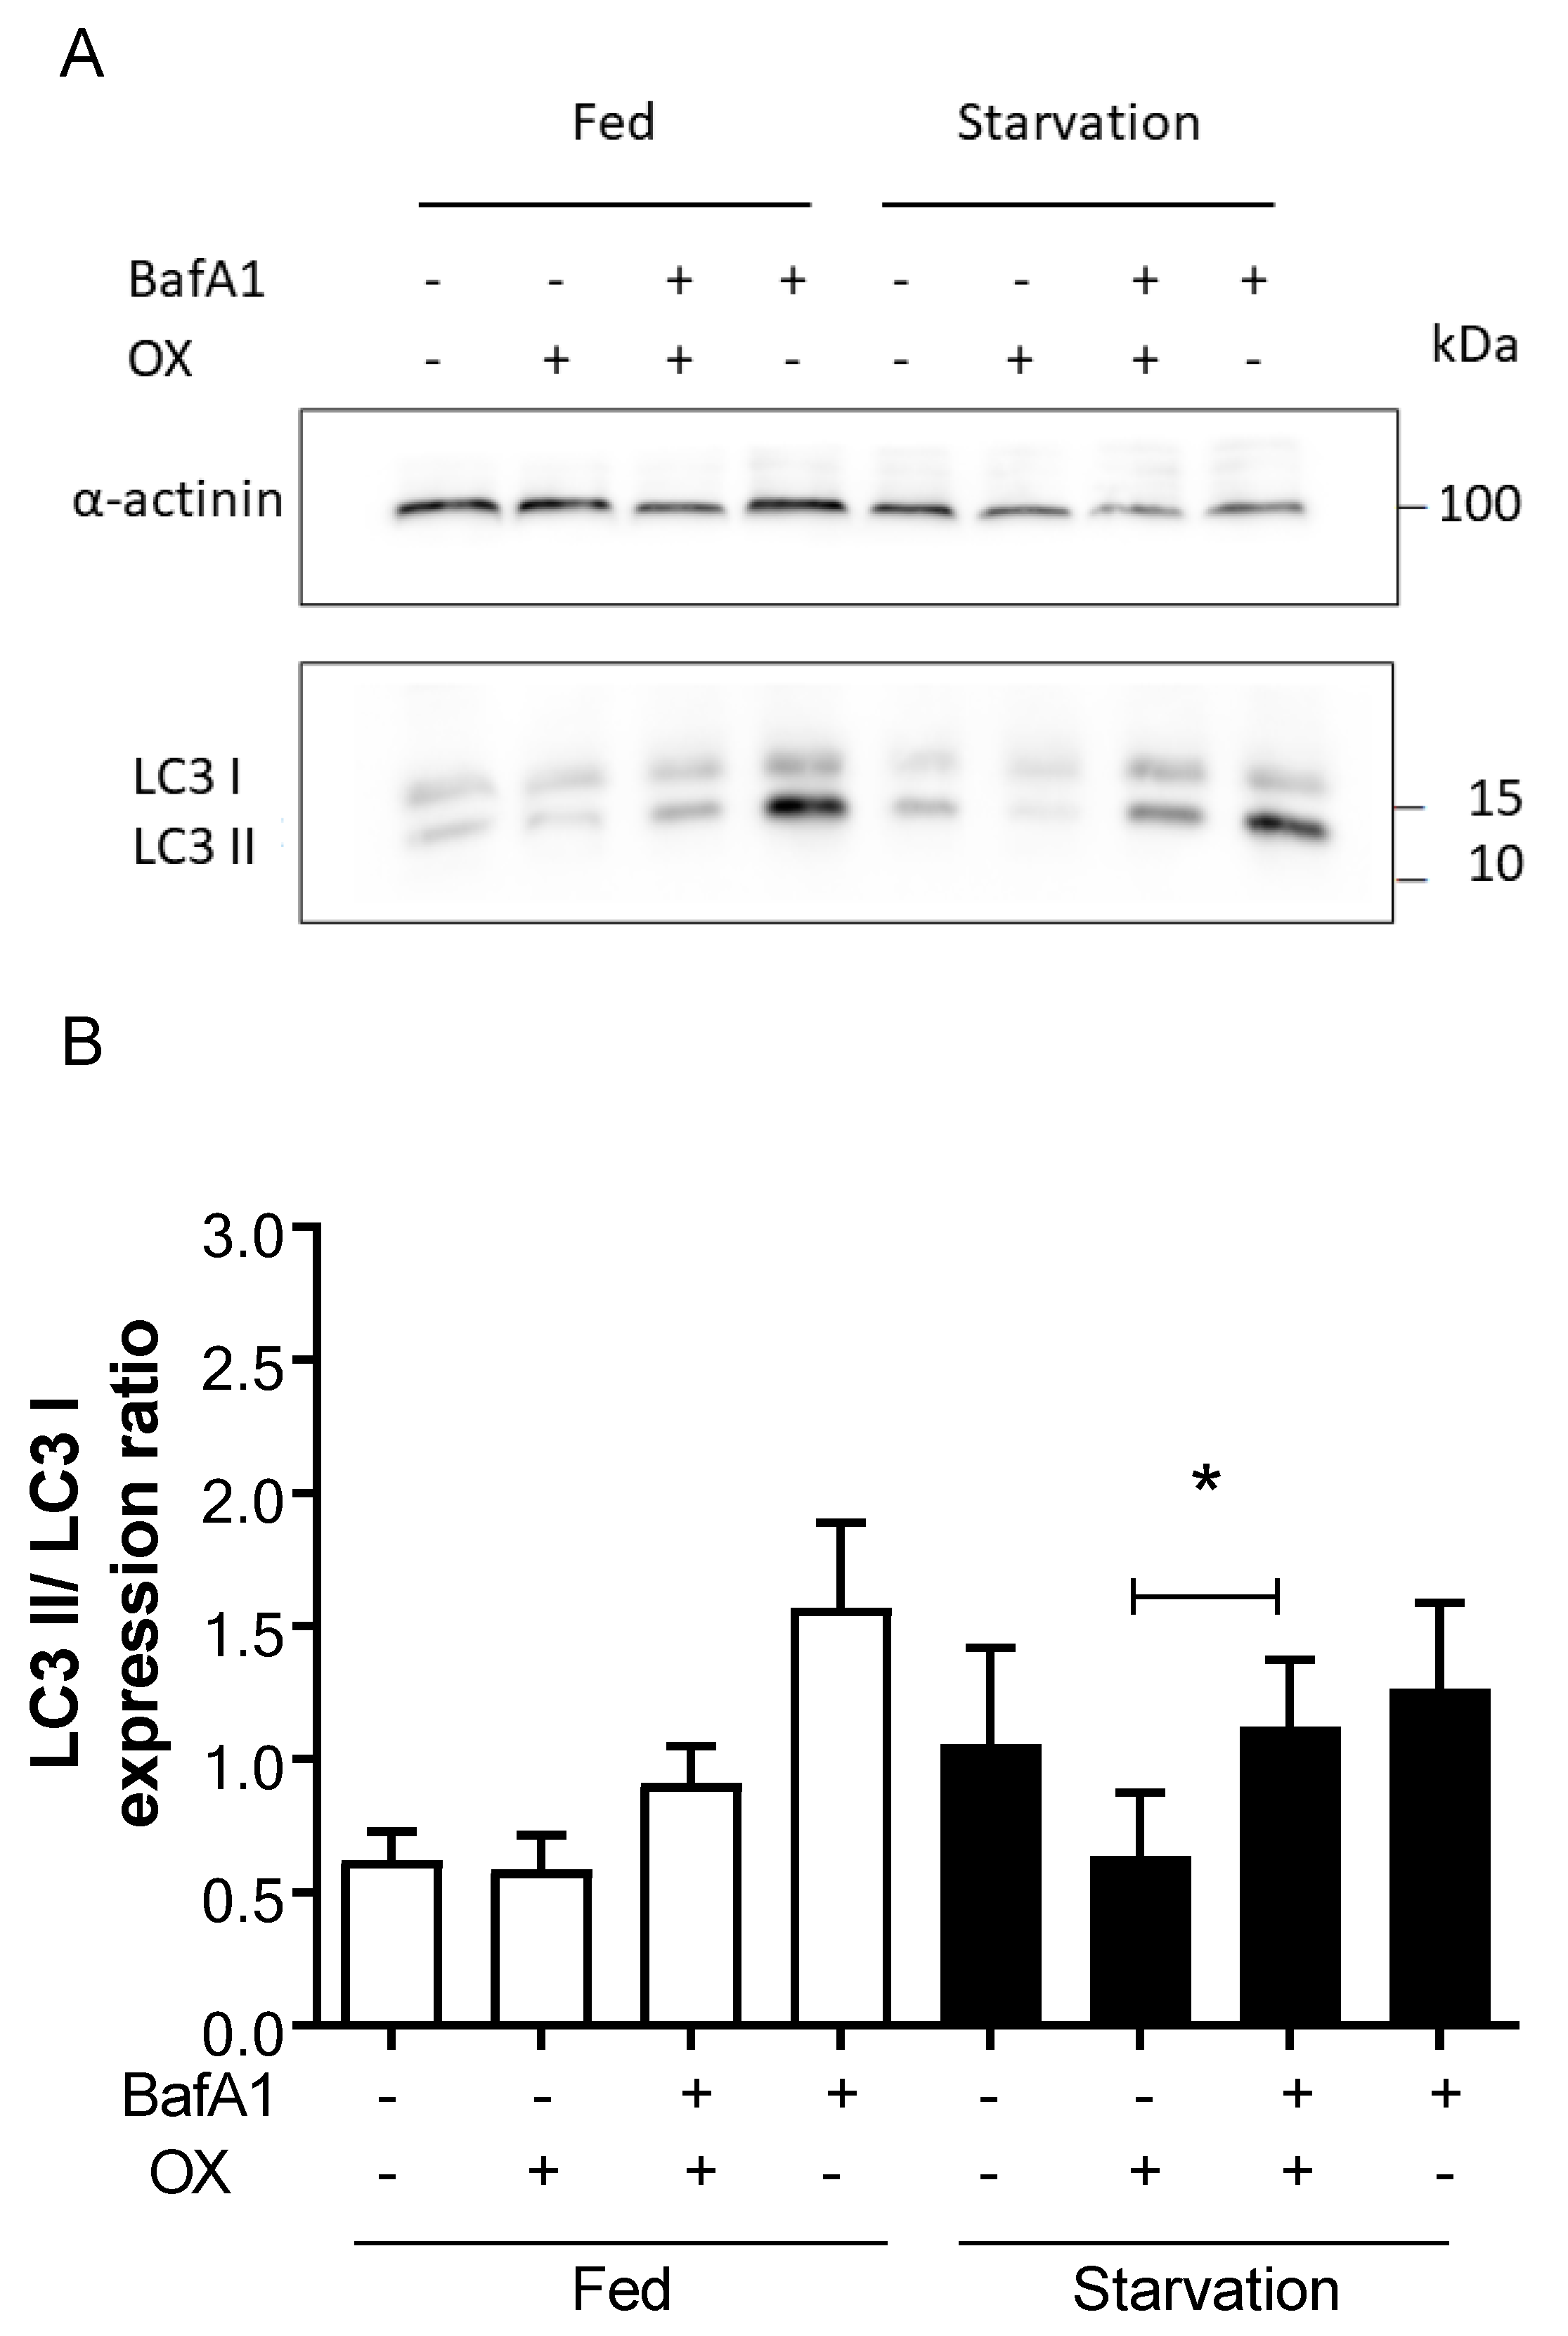
2.2. Induction of Autophagy in Response to CDDP and OX Treatment
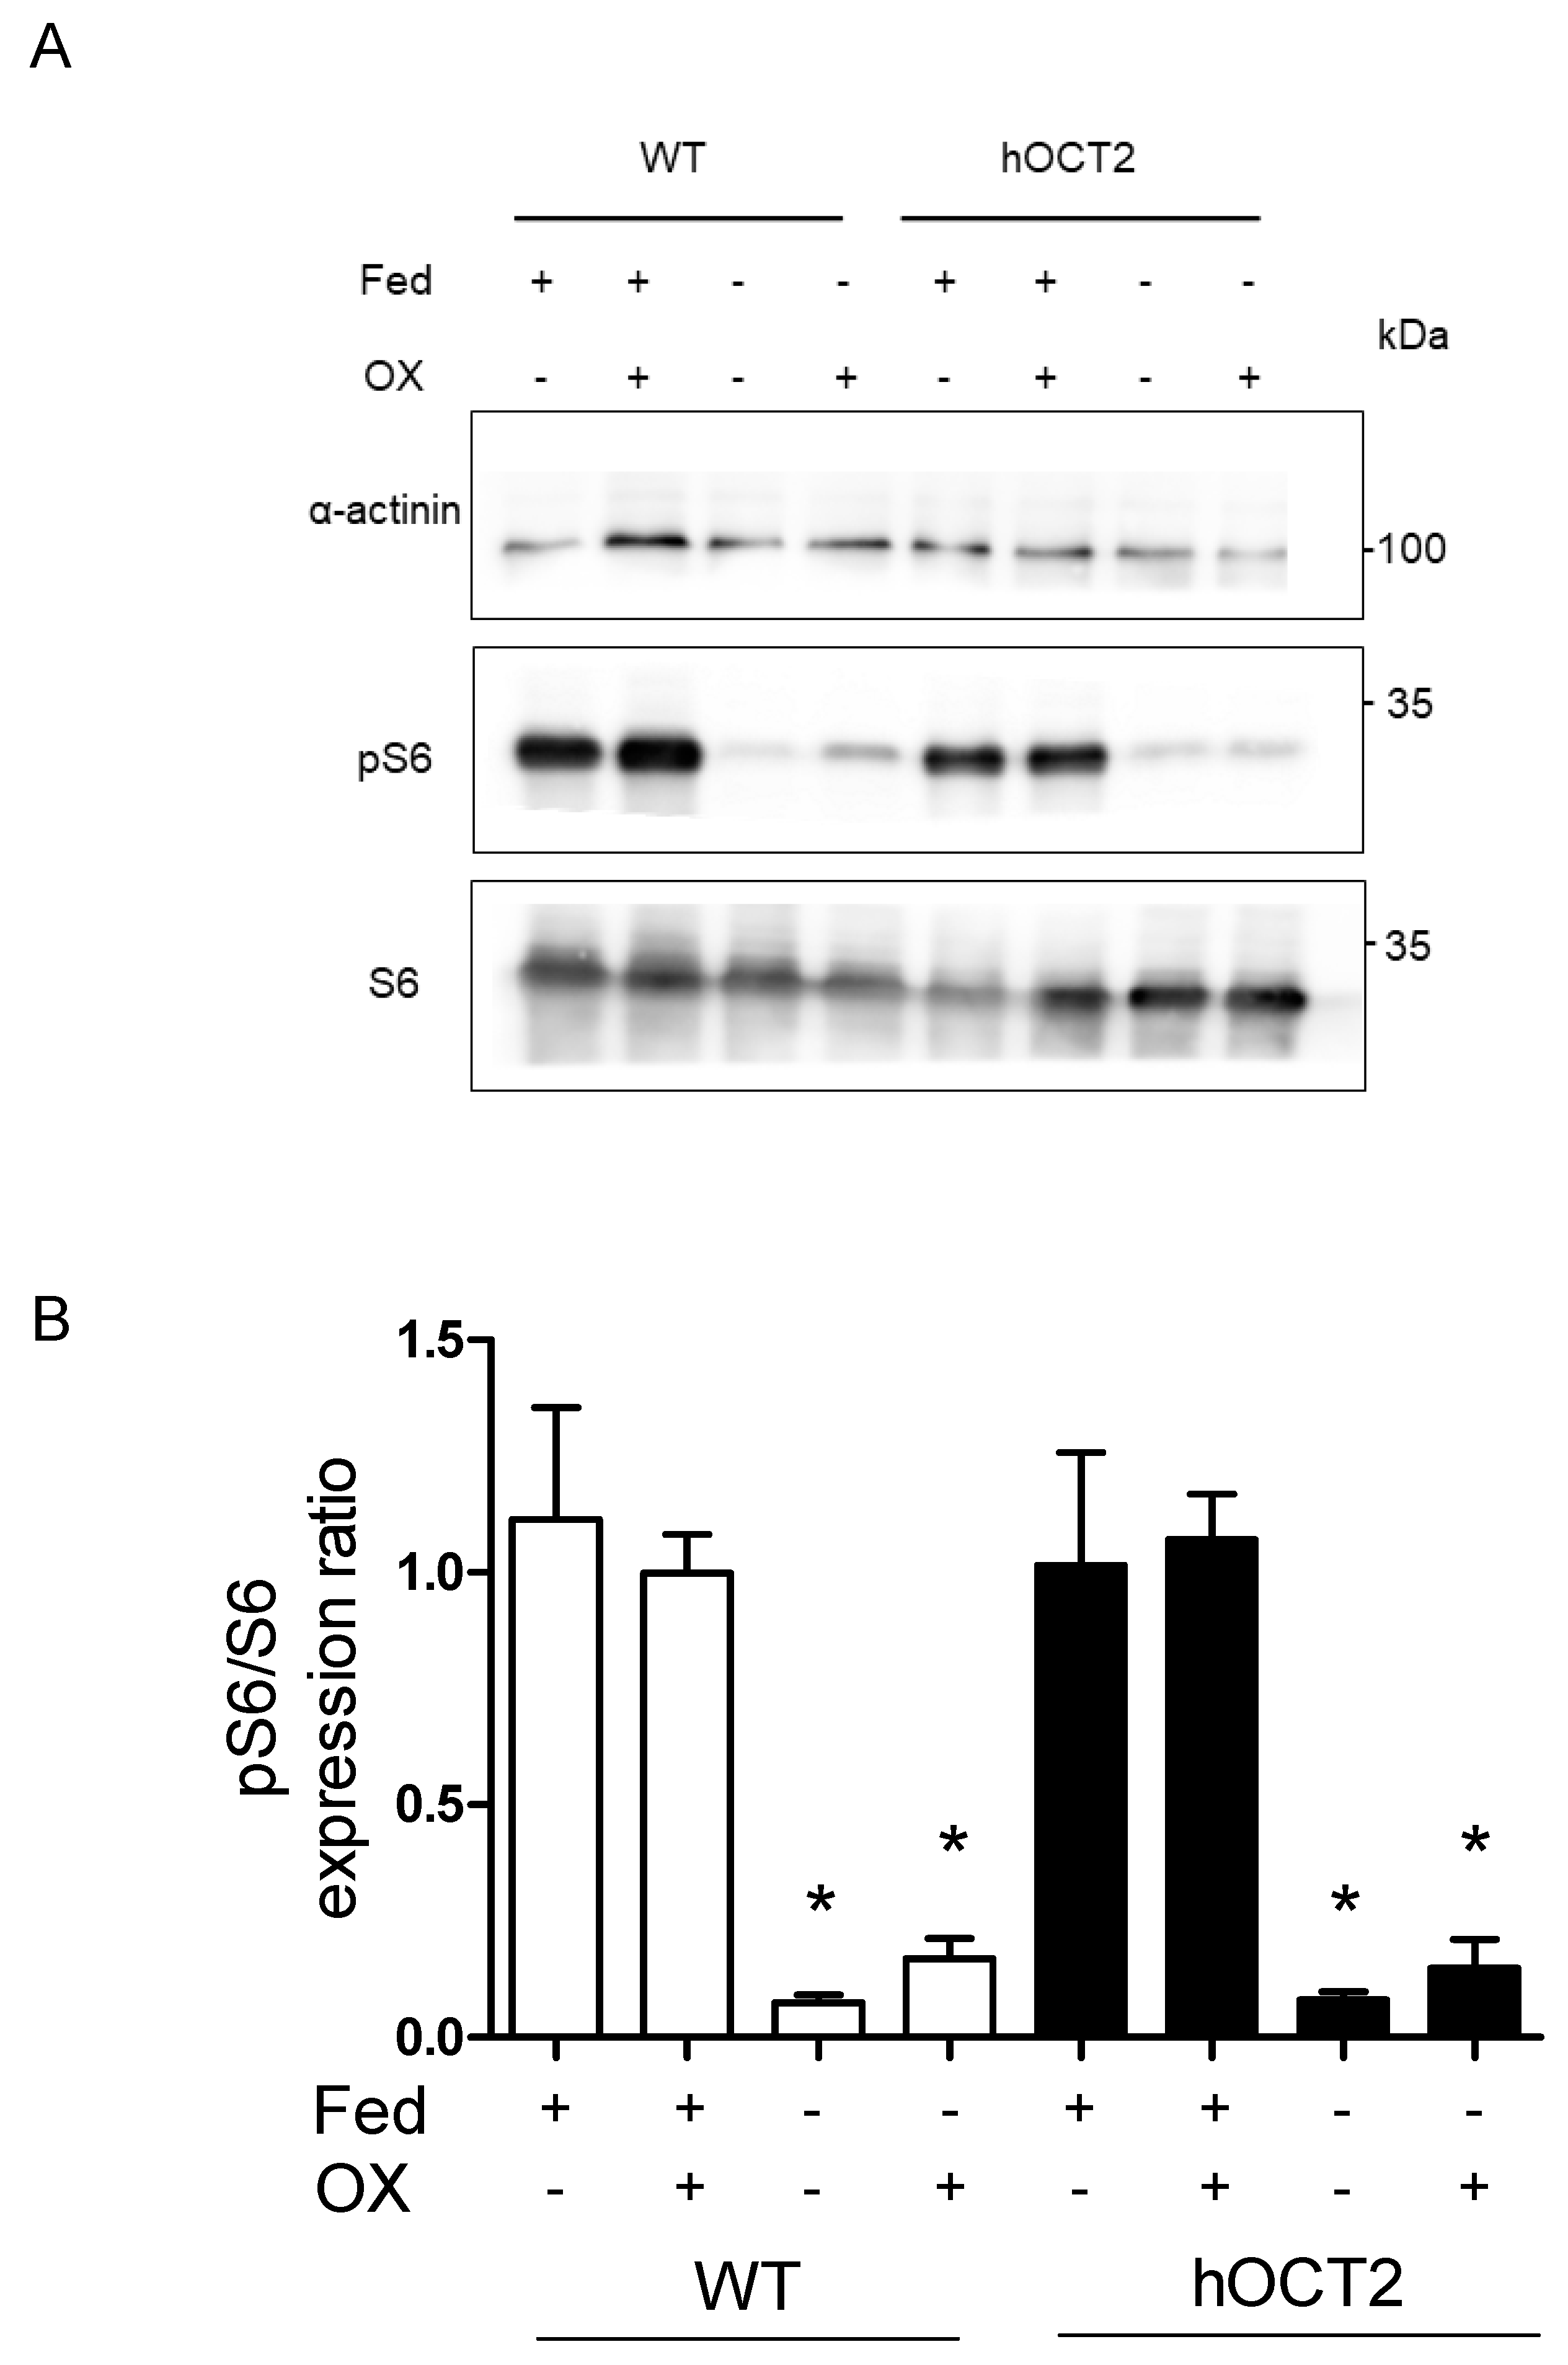
2.3. MTORC1 Is Downregulated during Starvation in HEK293-WT and HEK293-hOCT2 Cells
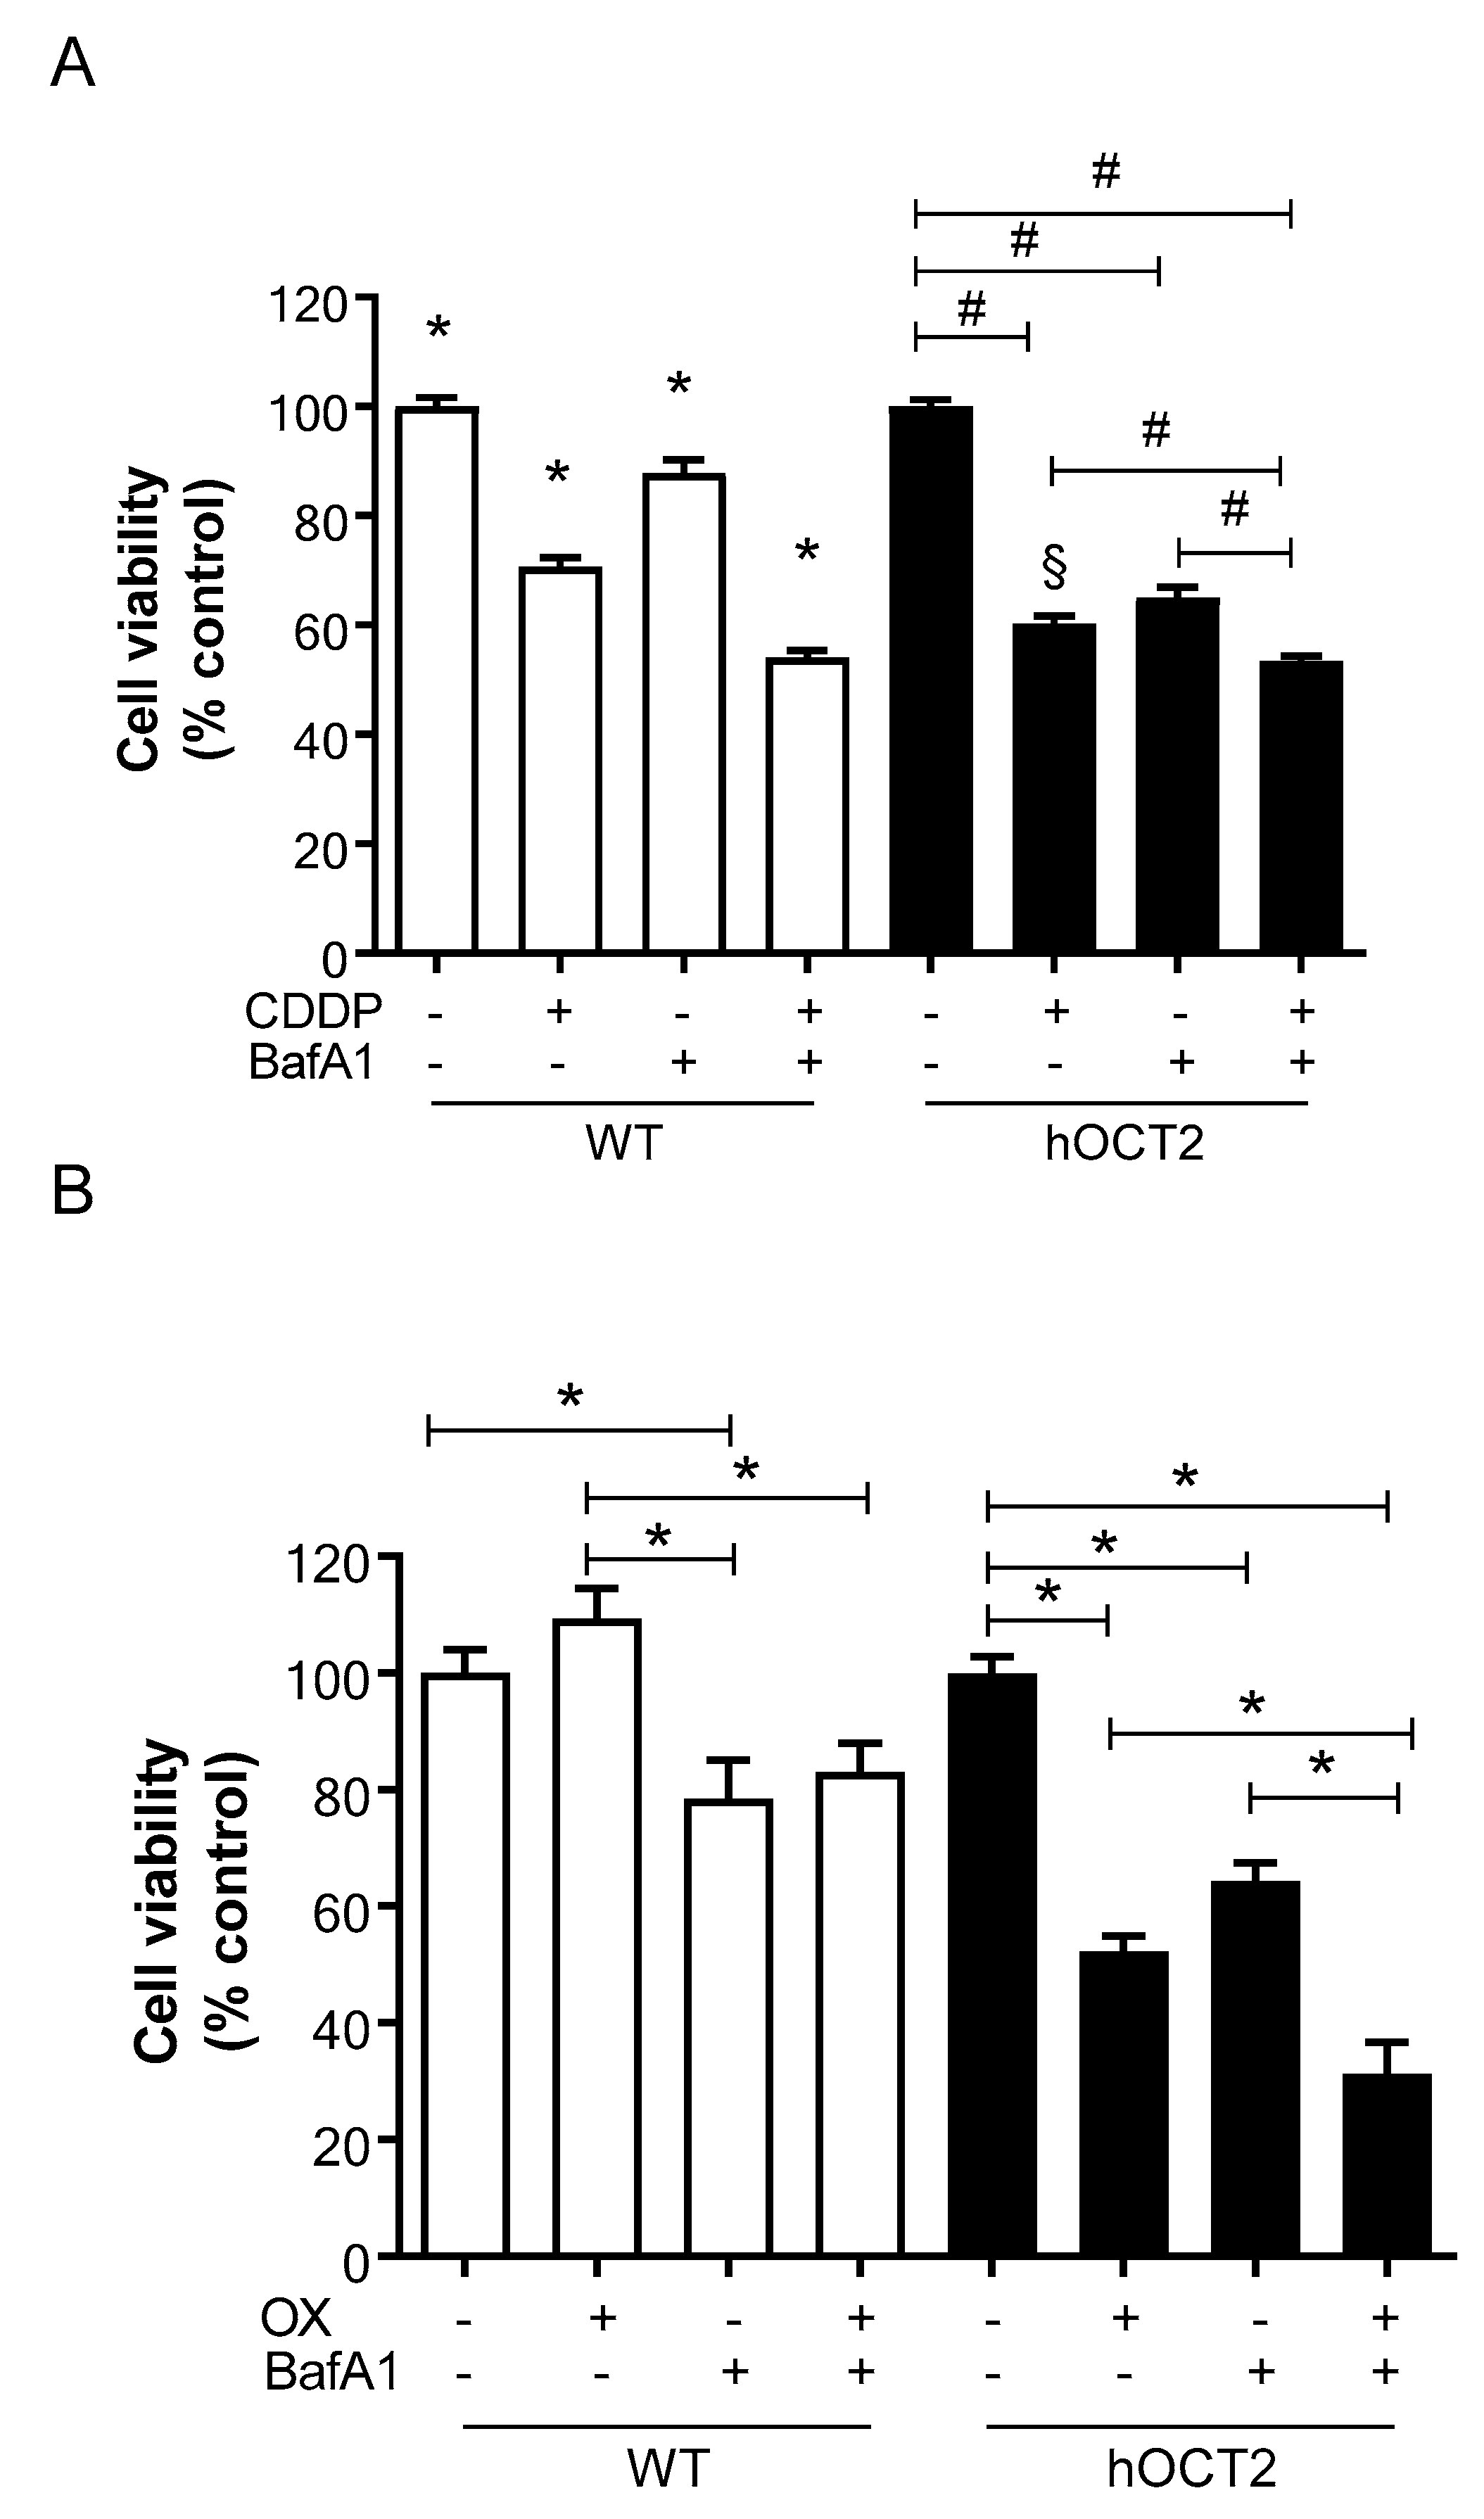
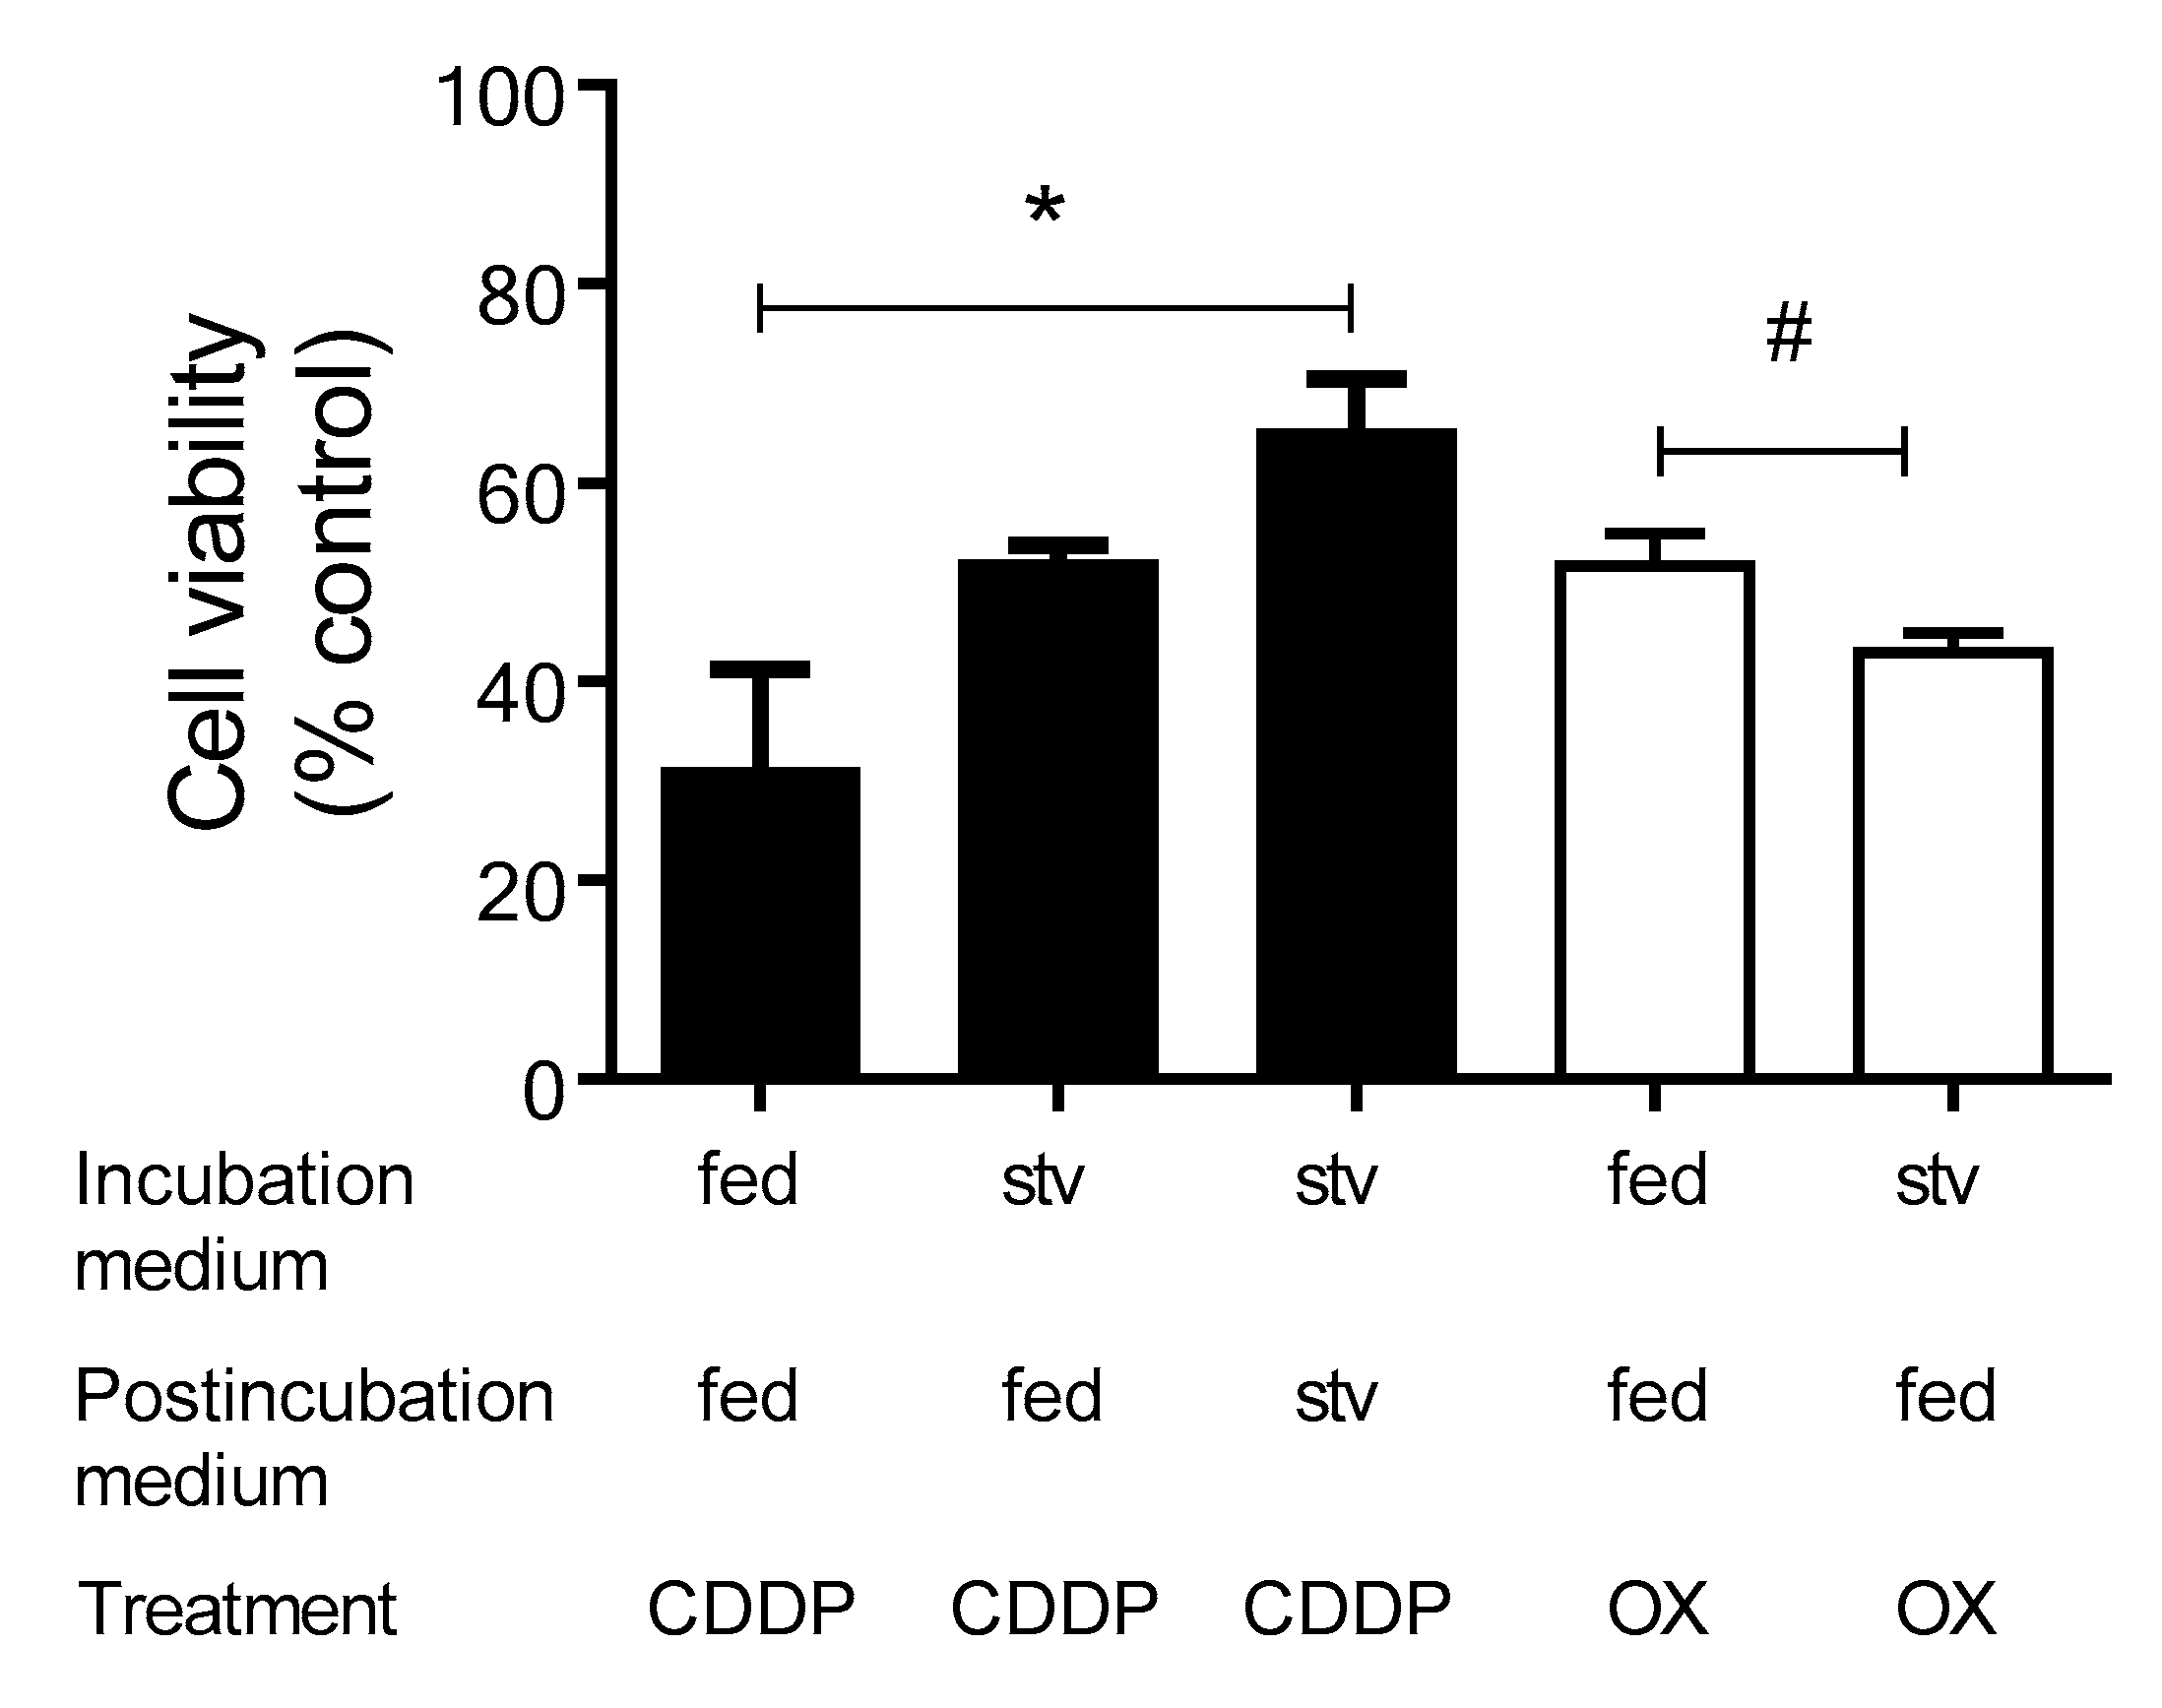
2.4. Autophagy Inhibition Exacerbates CDDP- and OX-Induced Cytotoxicity
3. Discussion
4. Materials and Methods
4.1. Cell Culture
4.2. Western Blot Analysis of CDDP and OX Effects on Autophagy
4.3. Cell Viability
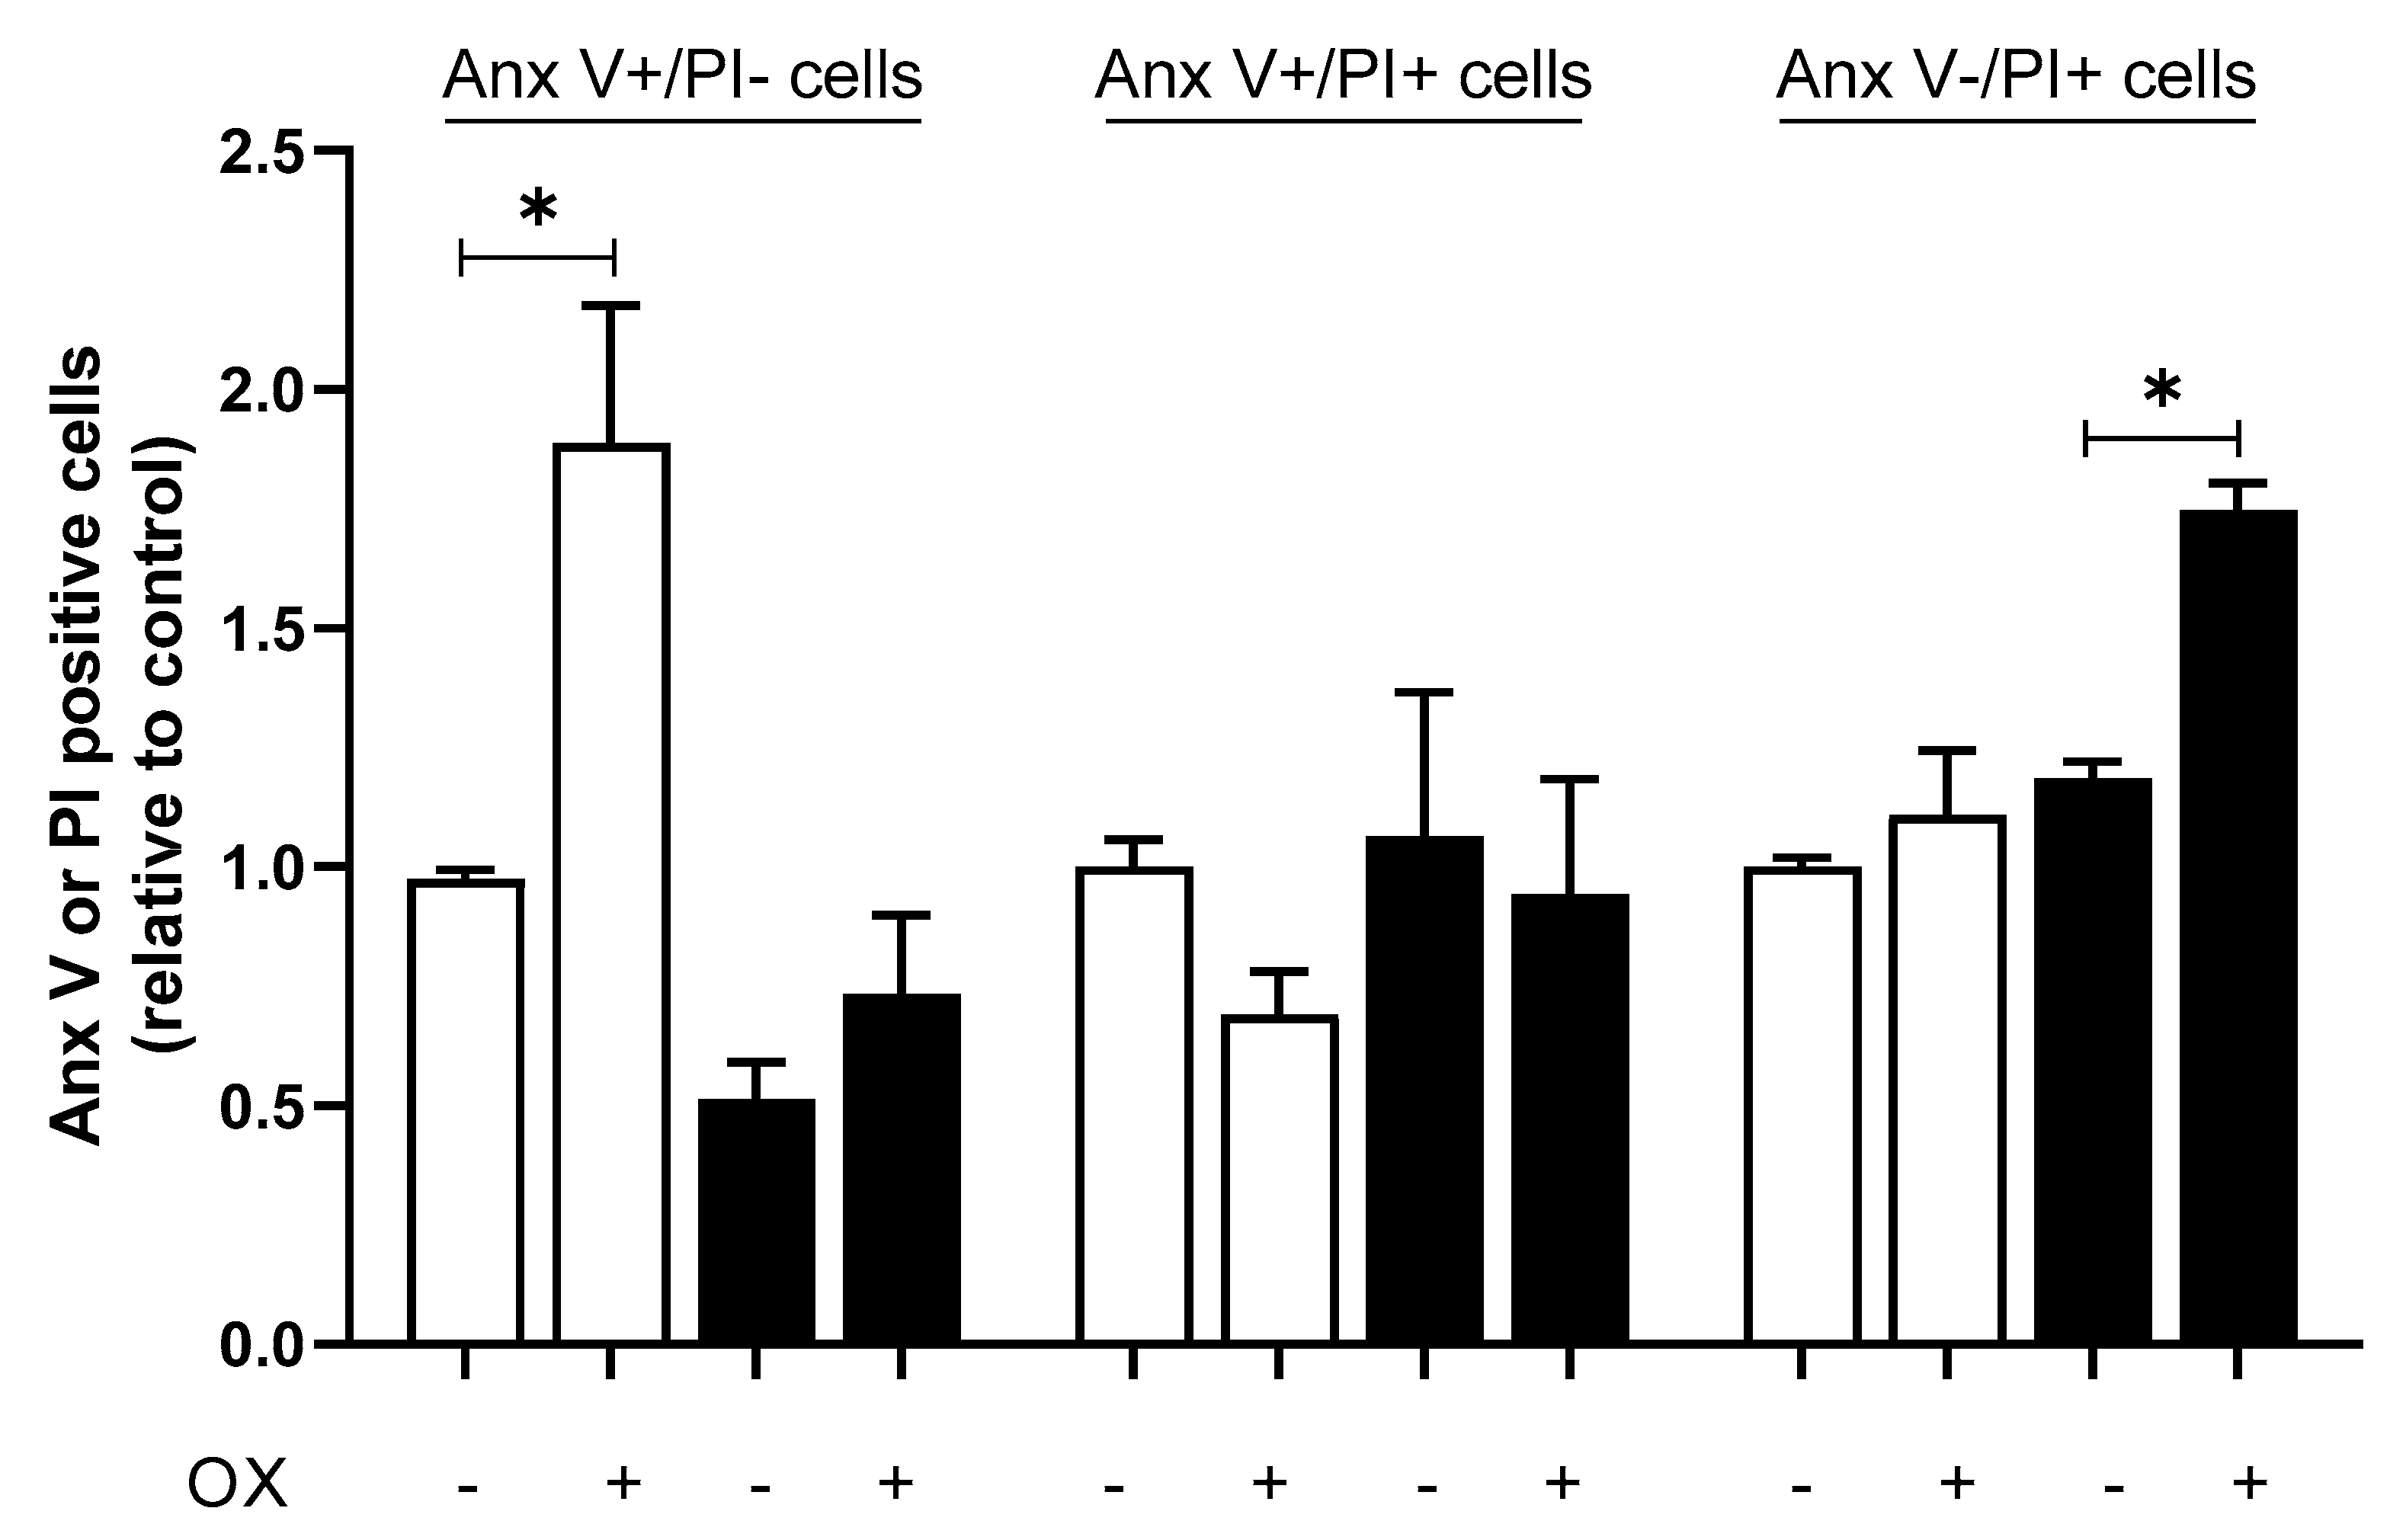
4.4. Flow Cytometry
4.5. Statistical Analysis
Supplementary Materials
Author Contributions
Funding
Data Availability Statement
Conflicts of Interest
References
- Wang, D.; Lippard, S.J. Cellular Processing of Platinum Anticancer Drugs. Nat. Rev. Drug Discov. 2005, 4, 307–320. [Google Scholar] [CrossRef]
- Ciarimboli, G. Role of Organic Cation Transporters in Drug-Induced Toxicity. Expert Opin. Drug Metab. Toxicol. 2011, 7, 159–174. [Google Scholar] [CrossRef] [PubMed]
- Yimit, A.; Adebali, O.; Sancar, A.; Jiang, Y. Differential Damage and Repair of DNA-Adducts Induced by Anti-Cancer Drug Cisplatin across Mouse Organs. Nat. Commun. 2019, 10, 309. [Google Scholar] [CrossRef] [Green Version]
- Harrach, S.; Ciarimboli, G. Role of Transporters in the Distribution of Platinum-Based Drugs. Front. Pharm. 2015, 6, 85. [Google Scholar] [CrossRef] [PubMed] [Green Version]
- Fuertes, M.; Castilla, J.; Alonso, C.; Perez, J. Novel Concepts in the Development of Platinum Antitumor Drugs. Curr. Med. Chem. Anti Cancer Agents 2002, 2, 539–551. [Google Scholar] [CrossRef] [PubMed]
- Alian, O.M.; Azmi, A.S.; Mohammad, R.M. Network Insights on Oxaliplatin Anti-cancer Mechanisms. Clin. Transl. Med. 2012, 1, 26. [Google Scholar] [CrossRef] [PubMed] [Green Version]
- de Luca, A.; Parker, L.J.; Ang, W.H.; Rodolfo, C.; Gabbarini, V.; Hancock, N.C.; Palone, F.; Mazzetti, A.P.; Menin, L.; Morton, C.J.; et al. A Structure-Based Mechanism of Cisplatin Resistance Mediated by Glutathione Transferase P1-1. Proc. Natl. Acad. Sci. USA 2019, 116, 13943–13951. [Google Scholar] [CrossRef] [Green Version]
- Ciarimboli, G.; Ludwig, T.; Lang, D.; Pavenstädt, H.; Koepsell, H.; Piechota, H.J.; Haier, J.; Jaehde, U.; Zisowsky, J.; Schlatter, E. Cisplatin Nephrotoxicity Is Critically Mediated via the Human Organic Cation Transporter 2. Am. J. Pathol. 2005, 167, 1477–1484. [Google Scholar] [CrossRef] [Green Version]
- Sprowl, J.A.; Ciarimboli, G.; Lancaster, C.S.; Giovinazzo, H.; Gibson, A.A.; Du, G.; Janke, L.J.; Cavaletti, G.; Shields, A.F.; Sparreboom, A. Oxaliplatin-Induced Neurotoxicity Is Dependent on the Organic Cation Transporter OCT2. Proc. Natl. Acad. Sci. USA 2013, 110, 11199–11204. [Google Scholar] [CrossRef] [Green Version]
- Yonezawa, A.; Masuda, S.; Yokoo, S.; Katsura, T.; Inui, K.-I. Cisplatin and Oxaliplatin, but Not Carboplatin and Nedaplatin, Are Substrates for Human Organic Cation Transporters (SLC22A1-3 and Multidrug and Toxin Extrusion Family). J. Pharmacol. Exp. Ther. 2006, 319, 879–886. [Google Scholar] [CrossRef] [Green Version]
- Huang, K.M.; Leblanc, A.F.; Uddin, M.E.; Kim, J.Y.; Chen, M.; Eisenmann, E.D.; Gibson, A.A.; Li, Y.; Hong, K.W.; DiGiacomo, D.; et al. Neuronal Uptake Transporters Contribute to Oxaliplatin Neurotoxicity in Mice. J. Clin. Investig. 2020, 130, 4601–4606. [Google Scholar] [CrossRef] [PubMed]
- Ciarimboli, G.; Deuster, D.; Knief, A.; Sperling, M.; Holtkamp, M.; Edemir, B.; Pavenstädt, H.; Lanvers-Kaminsky, C.; Am Zehnhoff-Dinnesen, A.; Schinkel, A.H.; et al. Organic Cation Transporter 2 Mediates Cisplatin-Induced Oto- and Nephrotoxicity and Is a Target for Protective Interventions. Am. J. Pathol. 2010, 176, 1169–1180. [Google Scholar] [CrossRef] [PubMed]
- Sprowl, J.A.; van Doorn, L.; Hu, S.; van Gerven, L.; de Bruijn, P.; Li, L.; Gibson, A.A.; Mathijssen, R.H.; Sparreboom, A. Conjunctive Therapy of Cisplatin with the OCT2 Inhibitor Cimetidine: Influence on Antitumor Efficacy and Systemic Clearance. Clin. Pharmacol. Ther. 2013, 94, 585–592. [Google Scholar] [CrossRef] [PubMed] [Green Version]
- Yang, C.; Kaushal, V.; Shah, S.V.; Kaushal, G.P. Autophagy Is Associated with Apoptosis in Cisplatin Injury to Renal Tubular Epithelial Cells. Am. J. Physiol. Ren. Physiol. 2008, 294, F777–F787. [Google Scholar] [CrossRef] [PubMed] [Green Version]
- Shi, Y.; Tang, B.; Yu, P.-W.; Tang, B.; Hao, Y.-X.; Lei, X.; Luo, H.-X.; Zeng, D.-Z. Autophagy Protects against Oxaliplatin-Induced Cell Death via ER Stress and ROS in Caco-2 Cells. PLoS ONE 2012, 7, e51076. [Google Scholar] [CrossRef] [PubMed]
- Fung, C.; Lock, R.; Gao, S.; Salas, E.; Debnath, J. Induction of Autophagy during Extracellular Matrix Detachment Promotes Cell Survival. Mol. Biol. Cell 2008, 19, 797–806. [Google Scholar] [CrossRef] [Green Version]
- Shi, F.; Luo, D.; Zhou, X.; Sun, Q.; Shen, P.; Wang, S. Combined Effects of Hyperthermia and Chemotherapy on the Regulate Autophagy of Oral Squamous Cell Carcinoma Cells under a Hypoxic Microenvironment. Cell Death Discov. 2021, 7, 227. [Google Scholar] [CrossRef]
- Yang, H.-Z.; Ma, Y.; Zhou, Y.; Xu, L.-M.; Chen, X.-J.; Ding, W.-B.; Zou, H.-B. Autophagy Contributes to the Enrichment and Survival of Colorectal Cancer Stem Cells under Oxaliplatin Treatment. Cancer Lett. 2015, 361, 128–136. [Google Scholar] [CrossRef]
- Qiang, L.; Wu, C.; Ming, M.; Viollet, B.; He, Y.-Y. Autophagy Controls P38 Activation to Promote Cell Survival under Genotoxic Stress. J. Biol. Chem. 2013, 288, 1603–1611. [Google Scholar] [CrossRef] [Green Version]
- Nishida, K.; Kyoi, S.; Yamaguchi, O.; Sadoshima, J.; Otsu, K. The Role of Autophagy in the Heart. Cell Death Differ. 2009, 16, 31–38. [Google Scholar] [CrossRef] [PubMed] [Green Version]
- Luo, L.; Zhang, P.; Zhu, R.; Fu, J.; Su, J.; Zheng, J.; Wang, Z.; Wang, D.; Gong, Q. Autophagy Is Rapidly Induced by Salt Stress and Is Required for Salt Tolerance in Arabidopsis. Front. Plant Sci. 2017, 8, 1459. [Google Scholar] [CrossRef] [Green Version]
- Xiong, Y.; Contento, A.L.; Bassham, D.C. AtATG18a Is Required for the Formation of Autophagosomes during Nutrient Stress and Senescence in Ara-bidopsis Thaliana. Plant J. 2005, 42, 535–546. [Google Scholar] [CrossRef]
- He, C.; Klionsky, D.J. Regulation Mechanisms and Signaling Pathways of Autophagy. Annu. Rev. Genet. 2009, 43, 67–93. [Google Scholar] [CrossRef] [PubMed] [Green Version]
- Mizushima, N.; Yoshimori, T. How to Interpret LC3 Immunoblotting. Autophagy 2007, 3, 542–545. [Google Scholar] [CrossRef] [PubMed]
- Buccarelli, M.; Marconi, M.; Pacioni, S.; de Pascalis, I.; D’Alessandris, Q.G.; Martini, M.; Ascione, B.; Malorni, W.; Larocca, L.M.; Pallini, R.; et al. Inhibition of Autophagy Increases Susceptibility of Glioblastoma Stem Cells to Temozolomide by Igniting Ferroptosis. Cell Death Dis. 2018, 9, 841. [Google Scholar] [CrossRef]
- Xu, L.; Qu, X.-J.; Liu, Y.-P.; Xu, Y.-Y.; Liu, J.; Hou, K.-Z.; Zhang, Y. Protective Autophagy Antagonizes Oxaliplatin-Induced Apoptosis in Gastric Cancer Cells. Chin. J. Cancer 2011, 30, 490–496. [Google Scholar] [CrossRef] [PubMed]
- Huang, R.; Xu, Y.; Wan, W.; Shou, X.; Qian, J.; You, Z.; Liu, B.; Chang, C.; Zhou, T.; Lippincott-Schwartz, J.; et al. Deacetylation of Nuclear LC3 Drives Autophagy Initiation under Starvation. Mol. Cell 2015, 57, 456–466. [Google Scholar] [CrossRef] [Green Version]
- Scott, R.C.; Schuldiner, O.; Neufeld, T.P. Role and Regulation of Starvation-Induced Autophagy in the Drosophila Fat Body. Dev. Cell 2004, 7, 167–178. [Google Scholar] [CrossRef] [Green Version]
- Liu, W.J.; Ye, L.; Huang, W.F.; Guo, L.J.; Xu, Z.G.; Wu, H.L.; Yang, C.; Liu, H.F. p62 Links the Autophagy Pathway and the Ubiqutin–Proteasome System upon Ubiquitinated Protein Degradation. Cell. Mol. Biol. Lett. 2016, 21, 29. [Google Scholar] [CrossRef] [Green Version]
- Yuan, N.; Song, L.; Zhang, S.; Lin, W.; Cao, Y.; Xu, F.; Fang, Y.; Wang, Z.; Zhang, H.; Li, X.; et al. Bafilomycin A1 Targets Both Autophagy and Apoptosis Pathways in Pediatric B-Cell Acute Lymphoblastic Leukemia. Haematologica 2015, 100, 345–356. [Google Scholar] [CrossRef] [Green Version]
- Tanida, I.; Minematsu-Ikeguchi, N.; Ueno, T.; Kominami, E. Lysosomal Turnover, but Not a Cellular Level, of Endogenous LC3 Is a Marker for Autophagy. Autophagy 2005, 1, 84–91. [Google Scholar] [CrossRef] [Green Version]
- Du, W.; Gerald, D.; Perruzzi, C.A.; Rodriguez-Waitkus, P.; Enayati, L.; Krishnan, B.; Edmonds, J.; Hochman, M.L.; Lev, D.C.; Phung, T.L. Vascular Tumors Have Increased P70 S6-Kinase Activation and Are Inhibited by Topical Rapamycin. Lab. Investig. 2013, 93, 1115–1127. [Google Scholar] [CrossRef] [Green Version]
- Zhang, D.; Pan, J.; Xiang, X.; Liu, Y.; Dong, G.; Livingston, M.J.; Chen, J.-K.; Yin, X.-M.; Dong, Z. Protein Kinase C δ Suppresses Autophagy to Induce Kidney Cell Apoptosis in Cisplatin Nephrotoxicity. J. Am. Soc. Nephrol. 2017, 28, 1131–1144. [Google Scholar] [CrossRef] [Green Version]
- Zhang, S.; Lovejoy, K.S.; Shima, J.E.; Lagpacan, L.L.; Shu, Y.; Lapuk, A.; Chen, Y.; Komori, T.; Gray, J.W.; Chen, X.; et al. Organic Cation Transporters Are Determinants of Oxaliplatin Cytotoxicity. Cancer Res. 2006, 66, 8847–8857. [Google Scholar] [CrossRef] [Green Version]
- Noguchi, M.; Hirata, N.; Tanaka, T.; Suizu, F.; Nakajima, H.; Chiorini, J.A. Autophagy as a Modulator of Cell Death Machinery. Cell Death Dis. 2020, 11, 517. [Google Scholar] [CrossRef]
- Levy, J.M.M.; Towers, C.G.; Thorburn, A. Targeting Autophagy in Cancer. Nat. Rev. Cancer 2017, 17, 528–542. [Google Scholar] [CrossRef] [PubMed]
- Ravanan, P.; Srikumar, I.F.; Talwar, P. Autophagy: The Spotlight for Cellular Stress Responses. Life Sci. 2017, 188, 53–67. [Google Scholar] [CrossRef] [PubMed]
- Moriya, H. Quantitative Nature of Overexpression Experiments. Mol. Biol. Cell 2015, 26, 3932–3939. [Google Scholar] [CrossRef] [PubMed]
- Yoshii, S.R.; Mizushima, N. Monitoring and Measuring Autophagy. Int. J. Mol. Sci. 2017, 18, 1865. [Google Scholar] [CrossRef] [PubMed]
- Periyasamy-Thandavan, S.; Jiang, M.; Wei, Q.; Smith, R.; Yin, X.-M.; Dong, Z. Autophagy Is Cytoprotective during Cisplatin Injury of Renal Proximal Tubular Cells. Kidney Int. 2008, 74, 631–640. [Google Scholar] [CrossRef] [Green Version]
- Rabanal-Ruiz, Y.; Otten, E.G.; Korolchuk, V.I. MTORC1 as the Main Gateway to Autophagy. Essays Biochem. 2017, 61, 565–584. [Google Scholar] [CrossRef] [Green Version]
- Szwed, A.; Kim, E.; Jacinto, E. Regulation and Metabolic Functions of MTORC1 and MTORC2. Physiol. Rev. 2021, 101, 1371–1426. [Google Scholar] [CrossRef] [PubMed]
- Kim, Y.C.; Guan, K.-L. MTOR: A Pharmacologic Target for Autophagy Regulation. J. Clin. Investig. 2015, 125, 25–32. [Google Scholar] [CrossRef] [PubMed] [Green Version]
- Dufner, A.; Thomas, G. Ribosomal S6 Kinase Signaling and the Control of Translation. Exp. Cell Res. 1999, 253, 100–109. [Google Scholar] [CrossRef] [PubMed]
- Al-Bari, M.A.A.; Xu, P. Molecular Regulation of Autophagy Machinery by MTOR-dependent and -independent Pathways. Ann. N. Y. Acad. Sci. 2020, 1467, 3–20. [Google Scholar] [CrossRef] [PubMed]
- Rabinowitz, J.D.; White, E. Autophagy and Metabolism. Science 2010, 330, 1344–1348. [Google Scholar] [CrossRef] [PubMed] [Green Version]
- Lin, J.-F.; Lin, Y.-C.; Tsai, T.-F.; Chen, H.-E.; Chou, K.-Y.; Hwang, I.-S. Cisplatin Induces Protective Autophagy through Activation of BECN1 in Human Bladder Cancer Cells. Drug Des. Dev. Ther. 2017, 11, 1517–1533. [Google Scholar] [CrossRef] [PubMed] [Green Version]
- Bialik, S.; Dasari, S.K.; Kimchi, A. Autophagy-Dependent Cell Death—Where, How and Why a Cell Eats Itself to Death. J. Cell Sci. 2018, 131, jcs215152. [Google Scholar] [CrossRef] [Green Version]
- Funato, N.; Ohtani, K.; Ohyama, K.; Kuroda, T.; Nakamura, M. Common Regulation of Growth Arrest and Differentiation of Osteoblasts by Helix-Loop-Helix Factors. Mol. Cell. Biol. 2001, 21, 7416–7428. [Google Scholar] [CrossRef] [Green Version]
- Kwon, Y.H.; Jovanovic, A.; Serfas, M.S.; Tyner, A.L. The Cdk Inhibitor p21 Is Required for Necrosis, but It Inhibits Apoptosis Following Toxin-Induced Liver Injury. J. Biol. Chem. 2003, 278, 30348–30355. [Google Scholar] [CrossRef] [Green Version]
- Späth, M.R.; Bartram, M.P.; Palacio-Escat, N.; Hoyer, K.J.R.; Debes, C.; Demir, F.; Schroeter, C.B.; Mandel, A.M.; Grundmann, F.; Ciarimboli, G.; et al. The Proteome Microenvironment Determines the Protective Effect of Preconditioning in Cisplatin-Induced Acute Kidney Injury. Kidney Int. 2019, 95, 333–349. [Google Scholar] [CrossRef]
- Kopeina, G.S.; Senichkin, V.V.; Zhivotovsky, B. Caloric Restriction—A Promising Anti-Cancer Approach: From Molecular Mechanisms to Clinical Trials. Biochim. Biophys. Acta Rev. Cancer 2017, 1867, 29–41. [Google Scholar] [CrossRef]
- Eroglu, Z.; Tawbi, H.A.; Hu, J.; Guan, M.; Frankel, P.H.; Ruel, N.H.; Wilczynski, S.; Christensen, S.; Gandara, D.R.; Chow, W.A. A Randomised Phase II Trial of Selumetinib vs Selumetinib plus Temsirolimus for Soft-Tissue Sarcomas. Br. J. Cancer 2015, 112, 1644–1651. [Google Scholar] [CrossRef] [PubMed] [Green Version]
- Hess, G.; Keller, U.; Scholz, C.W.; Witzens-Harig, M.; Atta, J.; Buske, C.; Kirschey, S.; Ruckes, C.; Medler, C.; van Oordt, C.; et al. Safety and Efficacy of Temsirolimus in Combination with Bendamustine and Rituximab in Relapsed Mantle Cell and Follicular Lymphoma. Leukemia 2015, 29, 1695–1701. [Google Scholar] [CrossRef]
- Yun, C.; Lee, S. The Roles of Autophagy in Cancer. Int. J. Mol. Sci. 2018, 19, 3466. [Google Scholar] [CrossRef] [PubMed] [Green Version]
- White, E. The Role for Autophagy in Cancer. J. Clin. Investig. 2015, 125, 42–46. [Google Scholar] [CrossRef] [PubMed] [Green Version]
- Xia, M.; Yu, H.; Gu, S.; Xu, Y.; Su, J.; Li, H.; Kang, J.; Cui, M. P62/SQSTM1 Is In-volved in Cisplatin Resistance in Human Ovarian Cancer Cells via the Keap1-Nrf2-ARE System. Int. J. Oncol. 2014, 45, 2341–2348. [Google Scholar] [CrossRef] [PubMed]
- Ren, J.-H.; He, W.-S.; Nong, L.; Zhu, Q.-Y.; Hu, K.; Zhang, R.-G.; Huang, L.-L.; Zhu, F.; Wu, G. Acquired Cisplatin Resistance in Human Lung Adenocarcinoma Cells Is Associated with Enhanced Autophagy. Cancer Biother. Radio-Pharm. 2010, 25, 75–80. [Google Scholar] [CrossRef]
- Lee, W.-K.; Reichold, M.; Edemir, B.; Ciarimboli, G.; Warth, R.; Koepsell, H.; Thévenod, F. Organic Cation Transporters OCT1, 2, and 3 Mediate High-Affinity Transport of the Mutagenic Vital Dye Ethidium in the Kidney Proximal Tubule. Am. J. Physiol. Ren. Physiol. 2009, 296, F1504–F1513. [Google Scholar] [CrossRef] [Green Version]
- Legin, A.A.; Schintlmeister, A.; Sommerfeld, N.S.; Eckhard, M.; Theiner, S.; Reipert, S.; Strohhofer, D.; Jakupec, M.A.; Galanski, M.; Wagner, M.; et al. Nano-Scale Imaging of Dual Stable Isotope Labeled Oxaliplatin in Human Colon Cancer Cells Reveals the Nucleolus as a Putative Node for Therapeutic Effect. Nanoscale Adv. 2021, 3, 249–262. [Google Scholar] [CrossRef]
- Ludwig, T.; Riethmüller, C.; Gekle, M.; Schwerdt, G.; Oberleithner, H. Nephrotoxicity of Platinum Complexes Is Related to Basolateral Organic Cation Transport. Kidney Int. 2004, 66, 196–202. [Google Scholar] [CrossRef] [PubMed] [Green Version]
- Biermann, J.; Lang, D.; Gorboulev, V.; Koepsell, H.; Sindic, A.; Schröter, R.; Zvirbliene, A.; Pavenstädt, H.; Schlatter, E.; Ciarimboli, G. Characterization of Regulatory Mechanisms and States of Human Organic Cation Transporter 2. Am. J. Physiol. Cell Physiol. 2006, 290, C1521–C1531. [Google Scholar] [CrossRef] [PubMed]
- Schneider, C.A.; Rasband, W.S.; Eliceiri, K.W. NIH Image to ImageJ: 25 Years of Image Analysis. Nat. Methods 2012, 9, 671–675. [Google Scholar] [CrossRef] [PubMed]


Publisher’s Note: MDPI stays neutral with regard to jurisdictional claims in published maps and institutional affiliations. |
© 2022 by the authors. Licensee MDPI, Basel, Switzerland. This article is an open access article distributed under the terms and conditions of the Creative Commons Attribution (CC BY) license (https://creativecommons.org/licenses/by/4.0/).
Share and Cite
Eltayeb, S.A.; Ciarimboli, G.; Beul, K.; Seno Di Marco, G.; Barz, V. Role of Organic Cation Transporter 2 in Autophagy Induced by Platinum Derivatives. Int. J. Mol. Sci. 2022, 23, 1090. https://0-doi-org.brum.beds.ac.uk/10.3390/ijms23031090
Eltayeb SA, Ciarimboli G, Beul K, Seno Di Marco G, Barz V. Role of Organic Cation Transporter 2 in Autophagy Induced by Platinum Derivatives. International Journal of Molecular Sciences. 2022; 23(3):1090. https://0-doi-org.brum.beds.ac.uk/10.3390/ijms23031090
Chicago/Turabian StyleEltayeb, Sara Ahmed, Giuliano Ciarimboli, Katrin Beul, Giovana Seno Di Marco, and Vivien Barz. 2022. "Role of Organic Cation Transporter 2 in Autophagy Induced by Platinum Derivatives" International Journal of Molecular Sciences 23, no. 3: 1090. https://0-doi-org.brum.beds.ac.uk/10.3390/ijms23031090