
Non-Invasive Profiling of Advanced Prostate Cancer via Multi-Parametric Liquid Biopsy and Radiomic Analysis

 , , , , , ,
Abstract
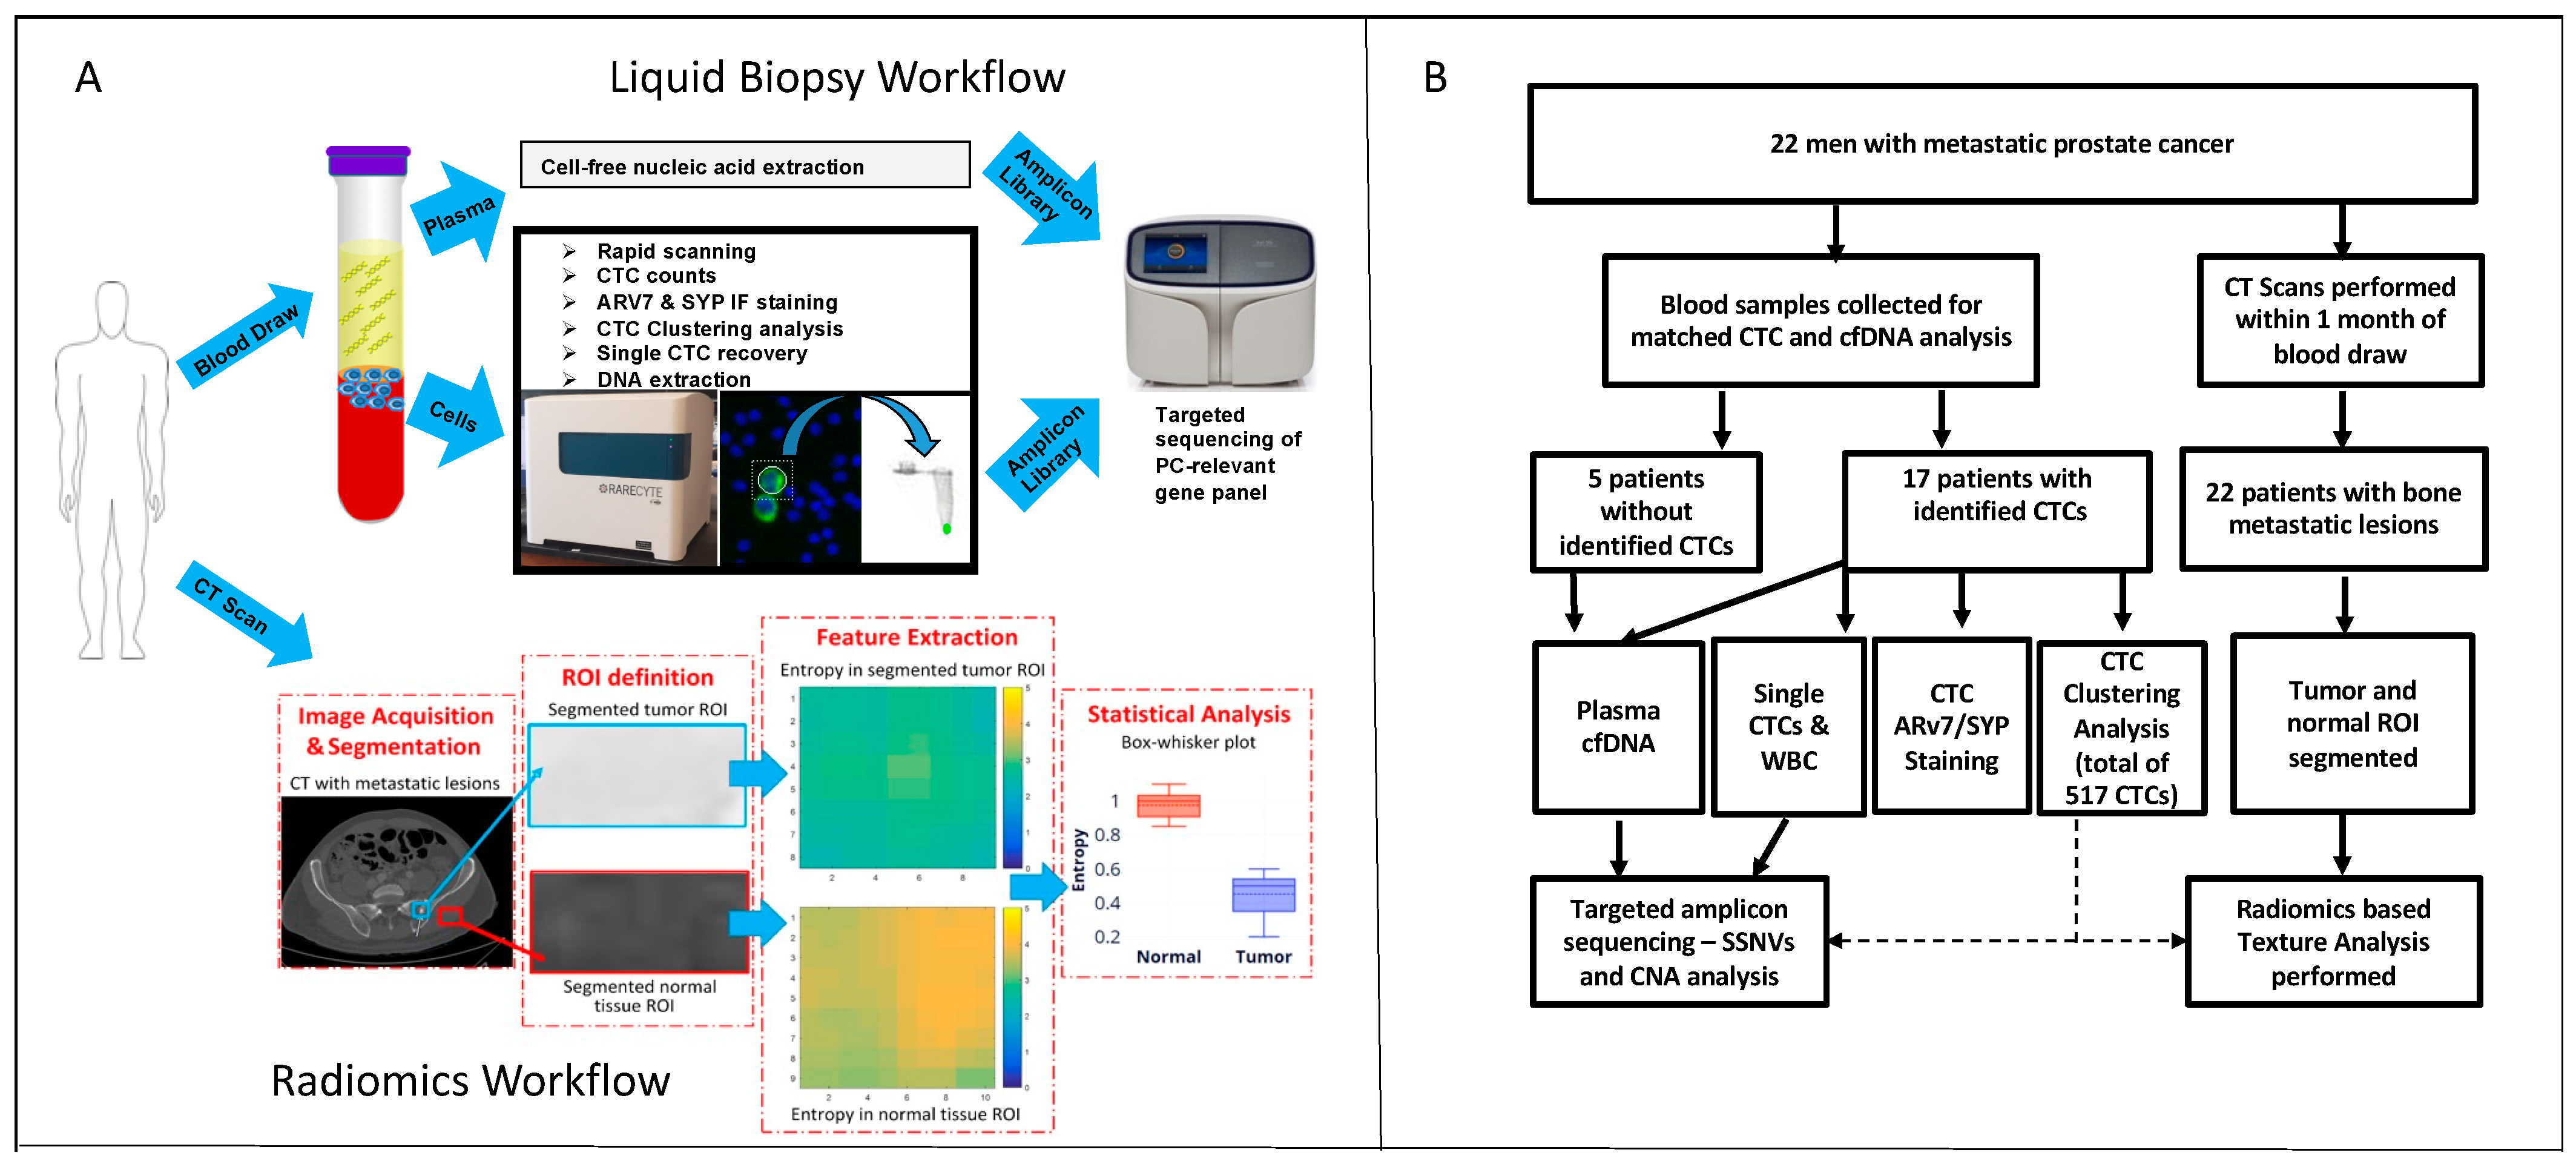
:1. Introduction
2. Results
2.1. Patient Cohorts
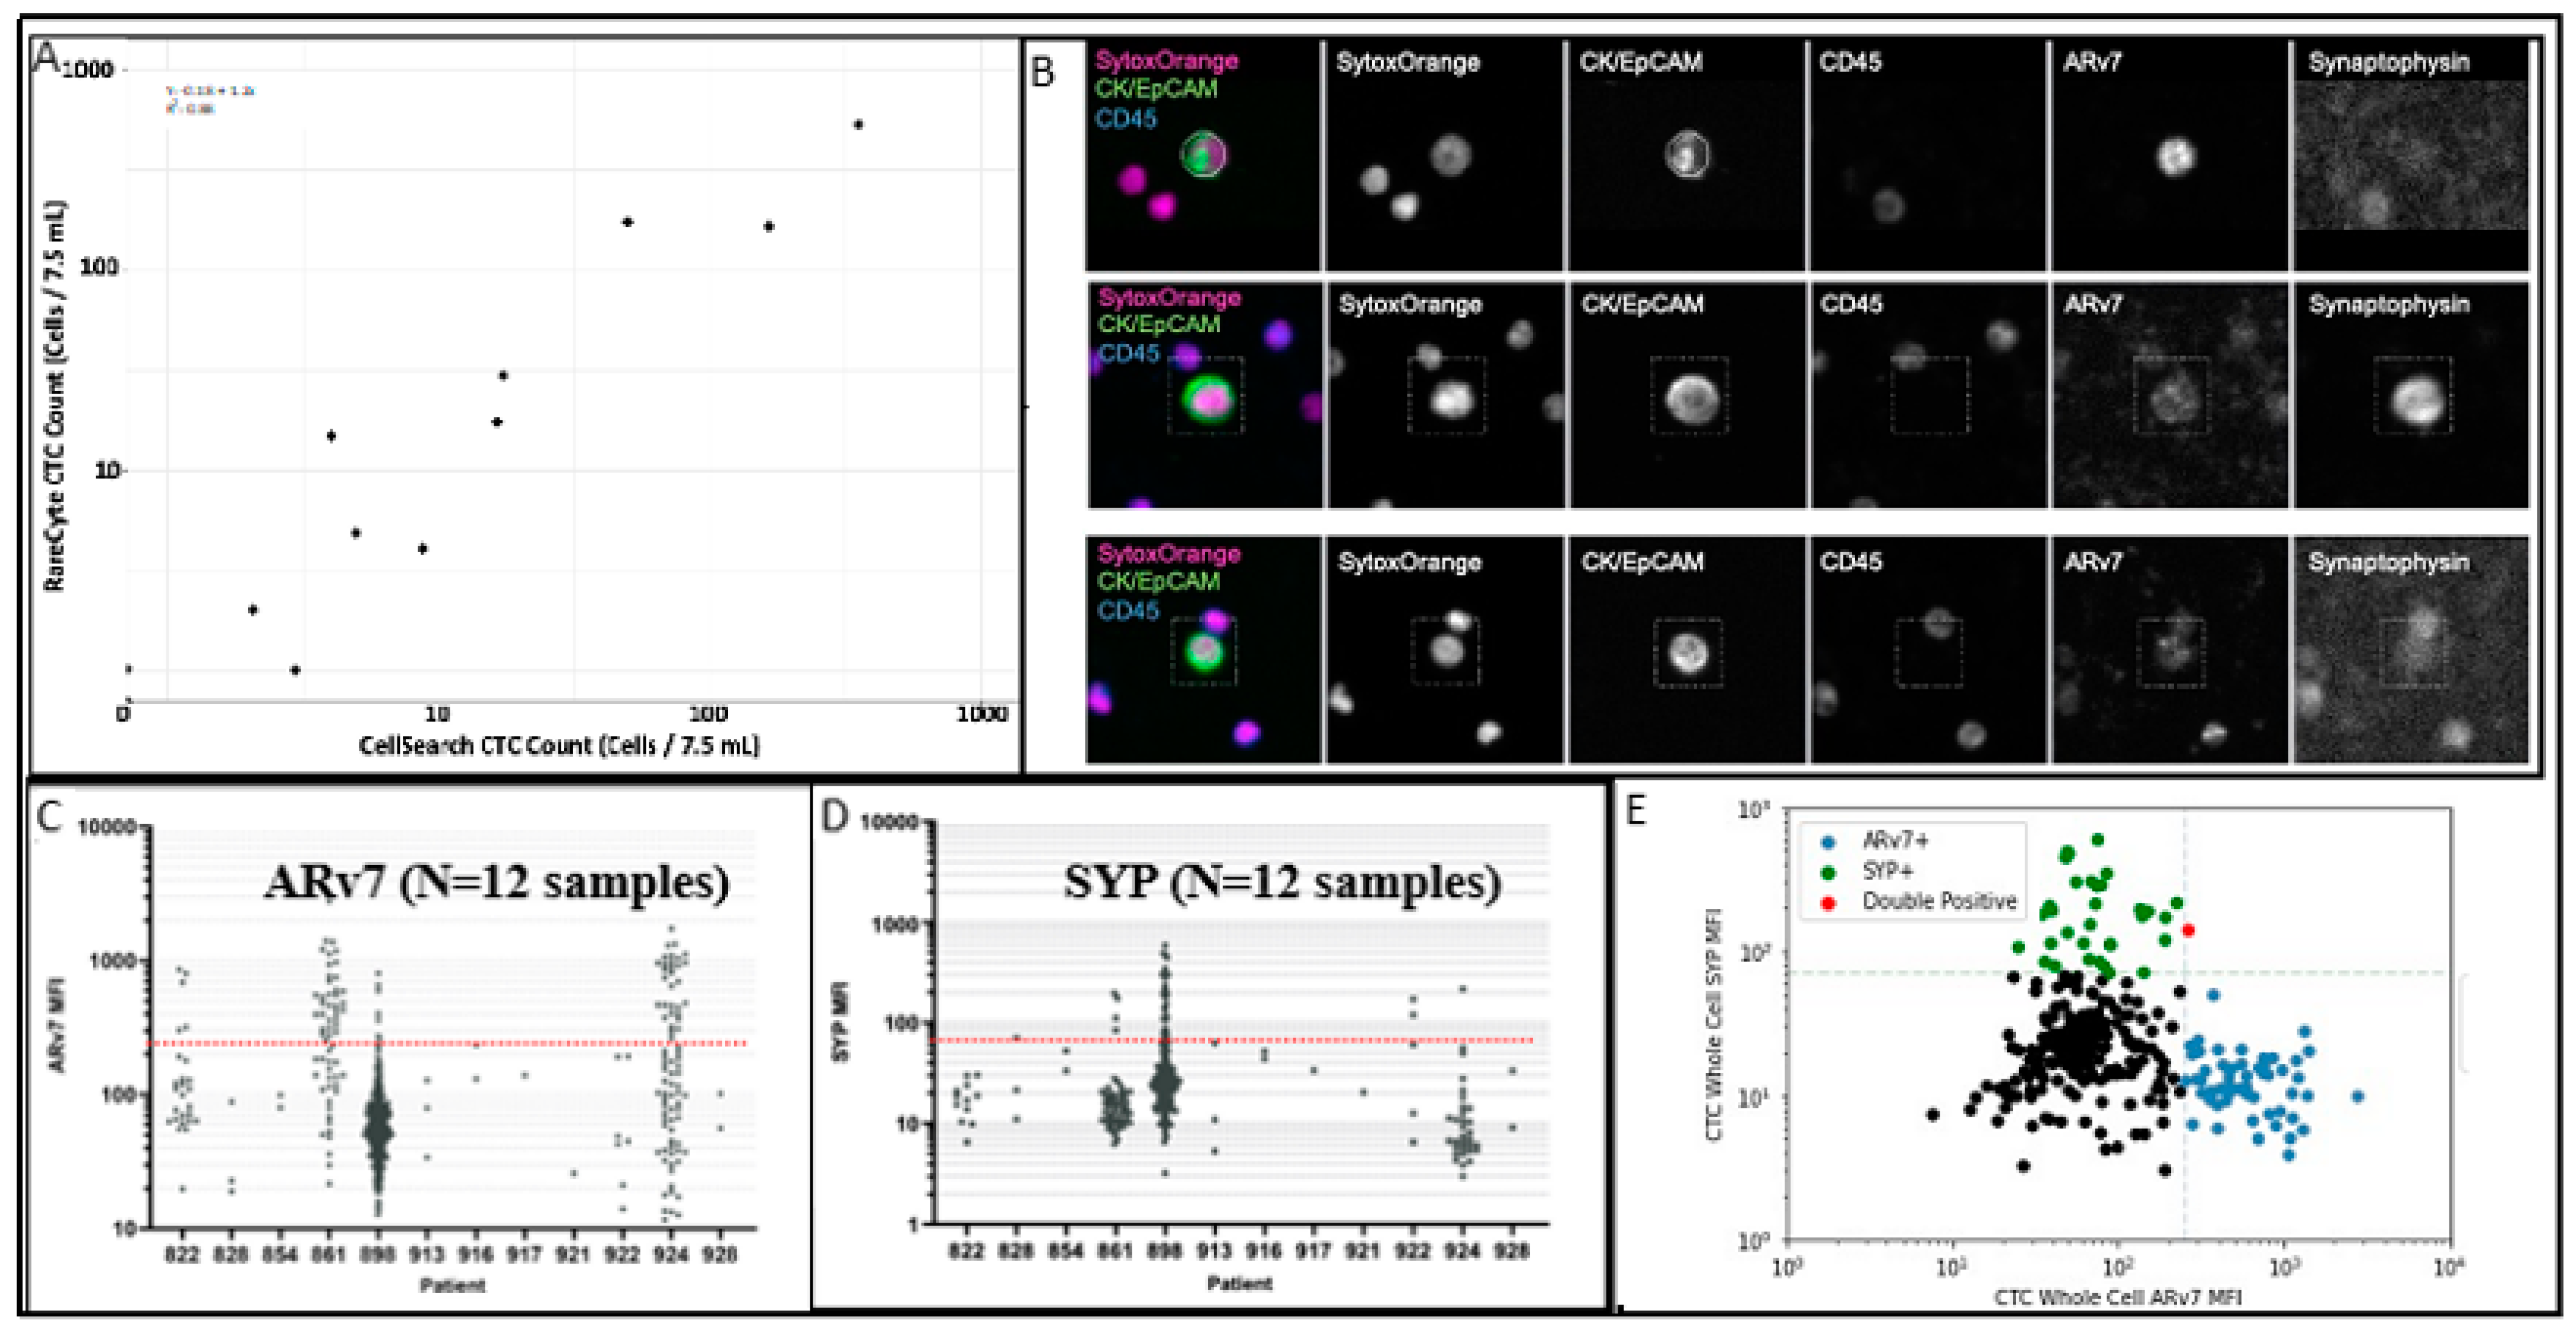
2.2. CTC Enumeration and Quantitative Immunofluorescence
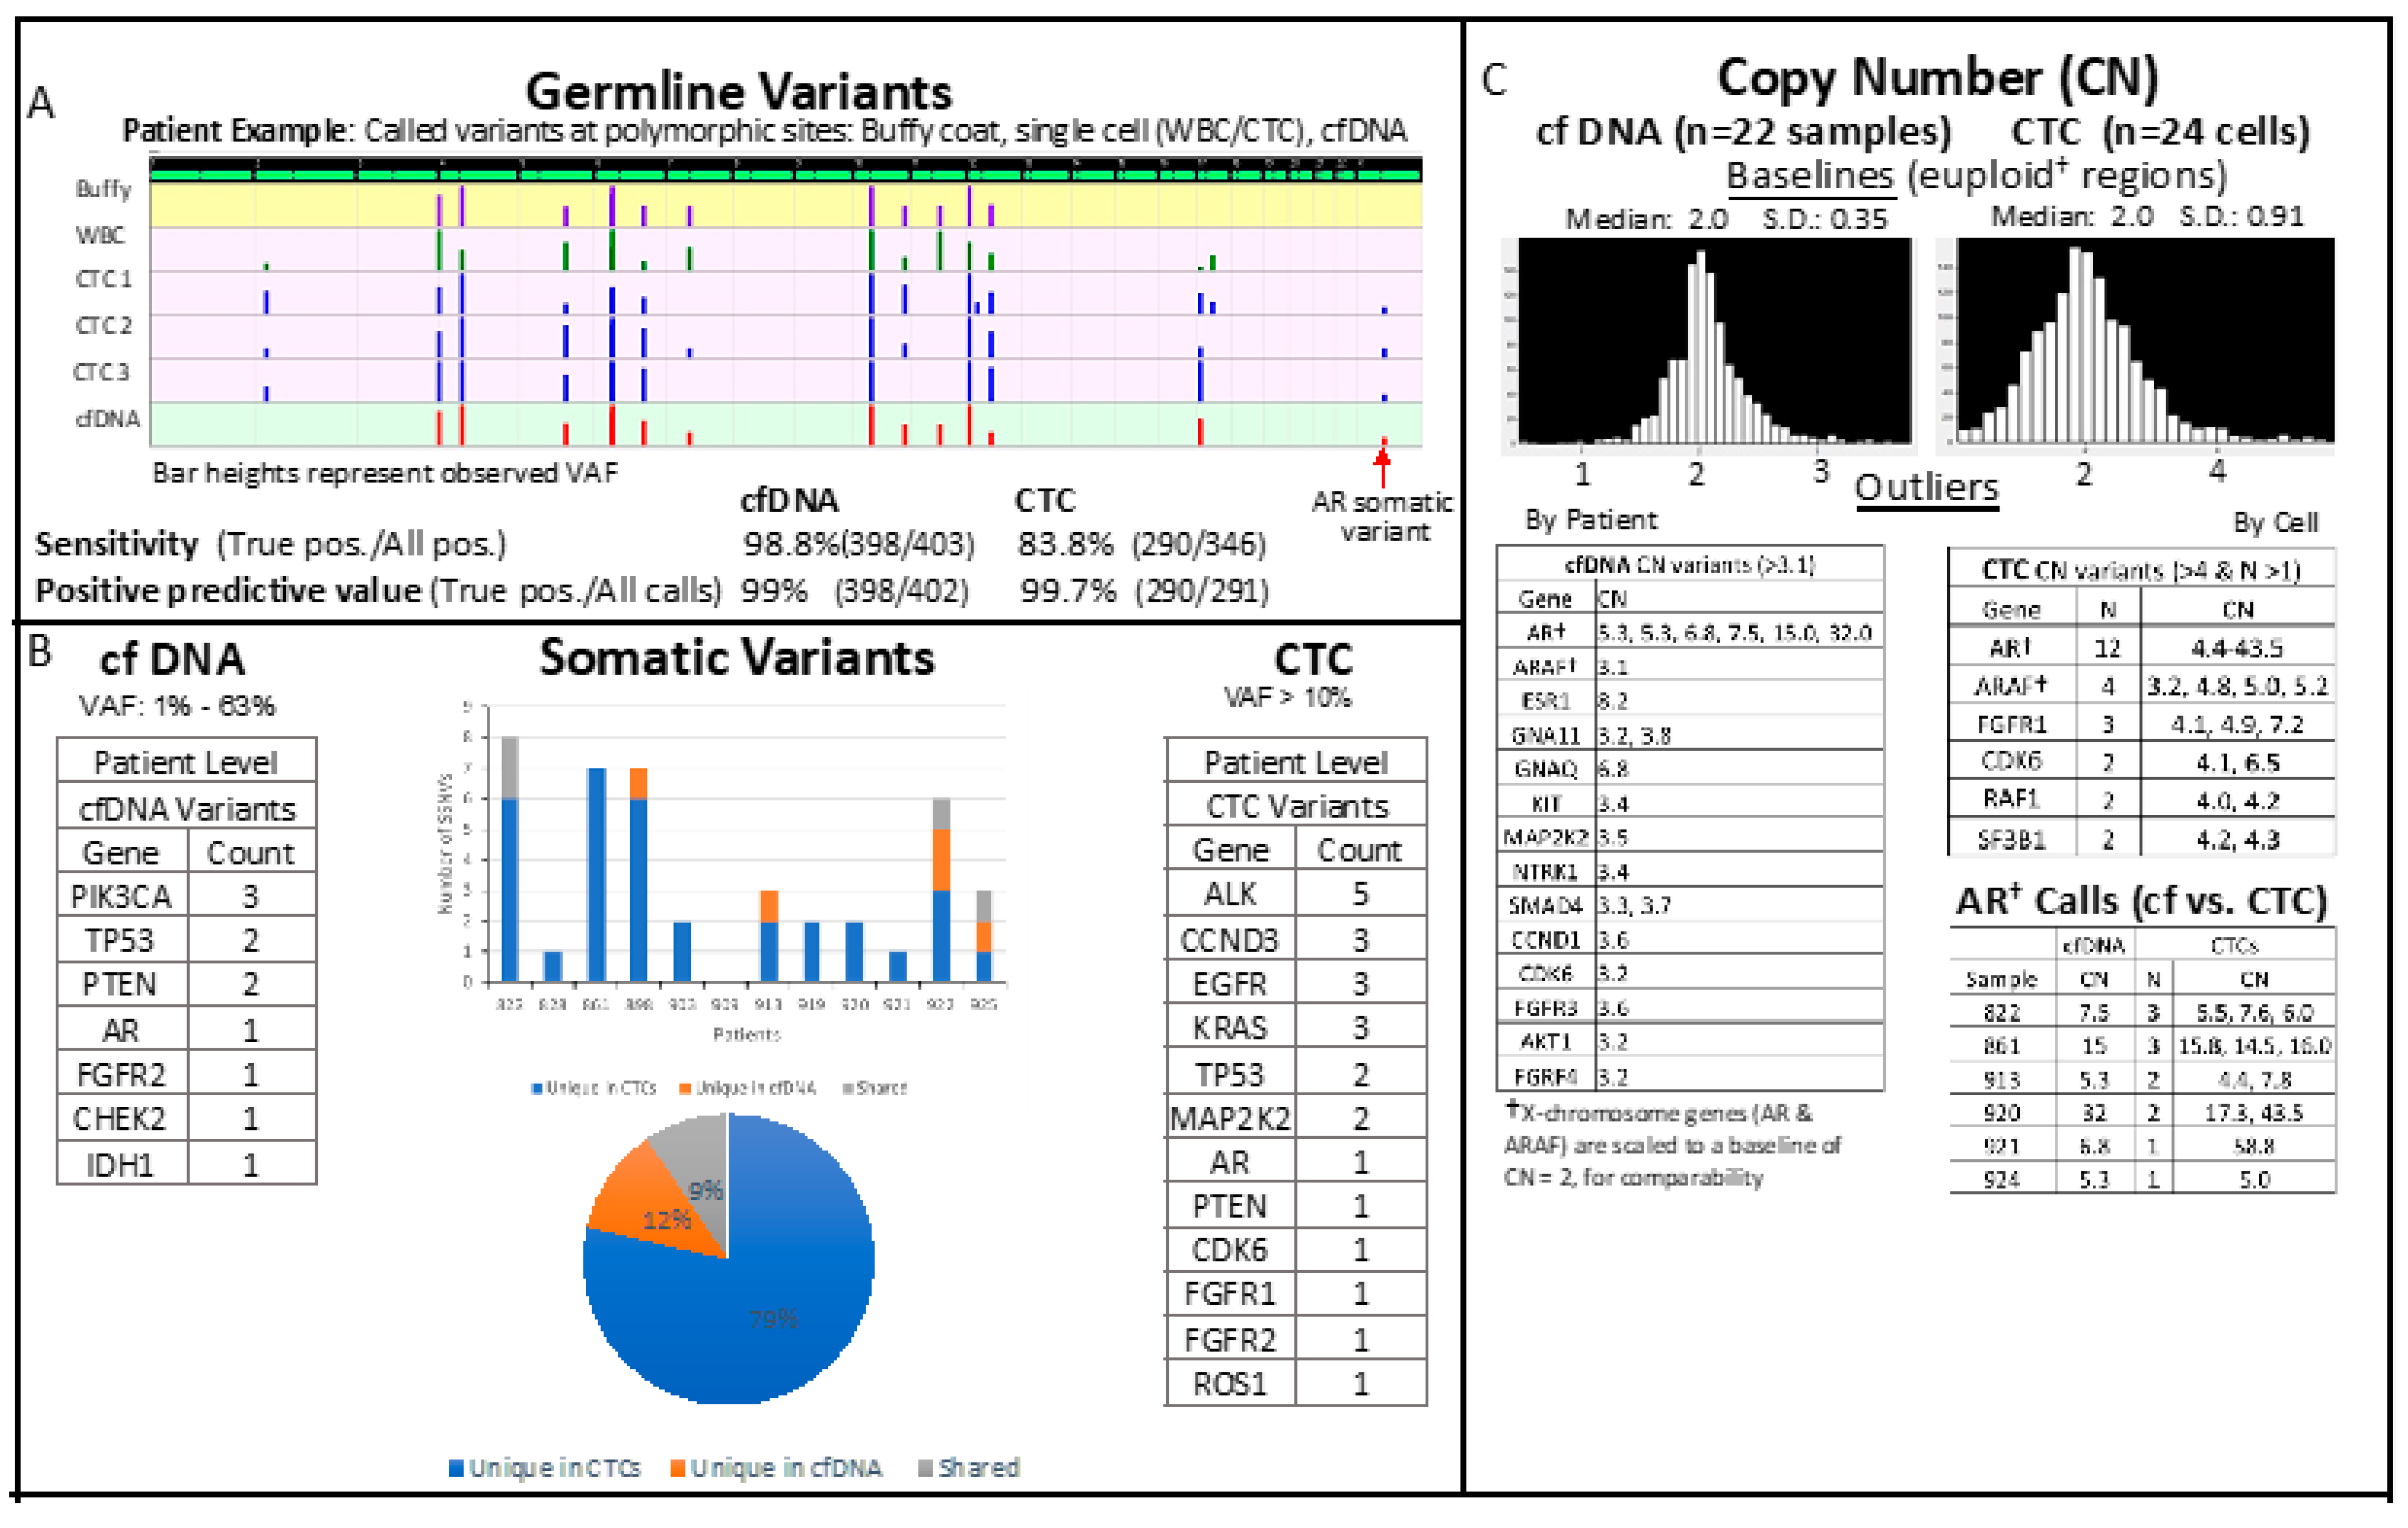
2.3. Matched CTC and cfDNA Targeted Amplicon Sequencing
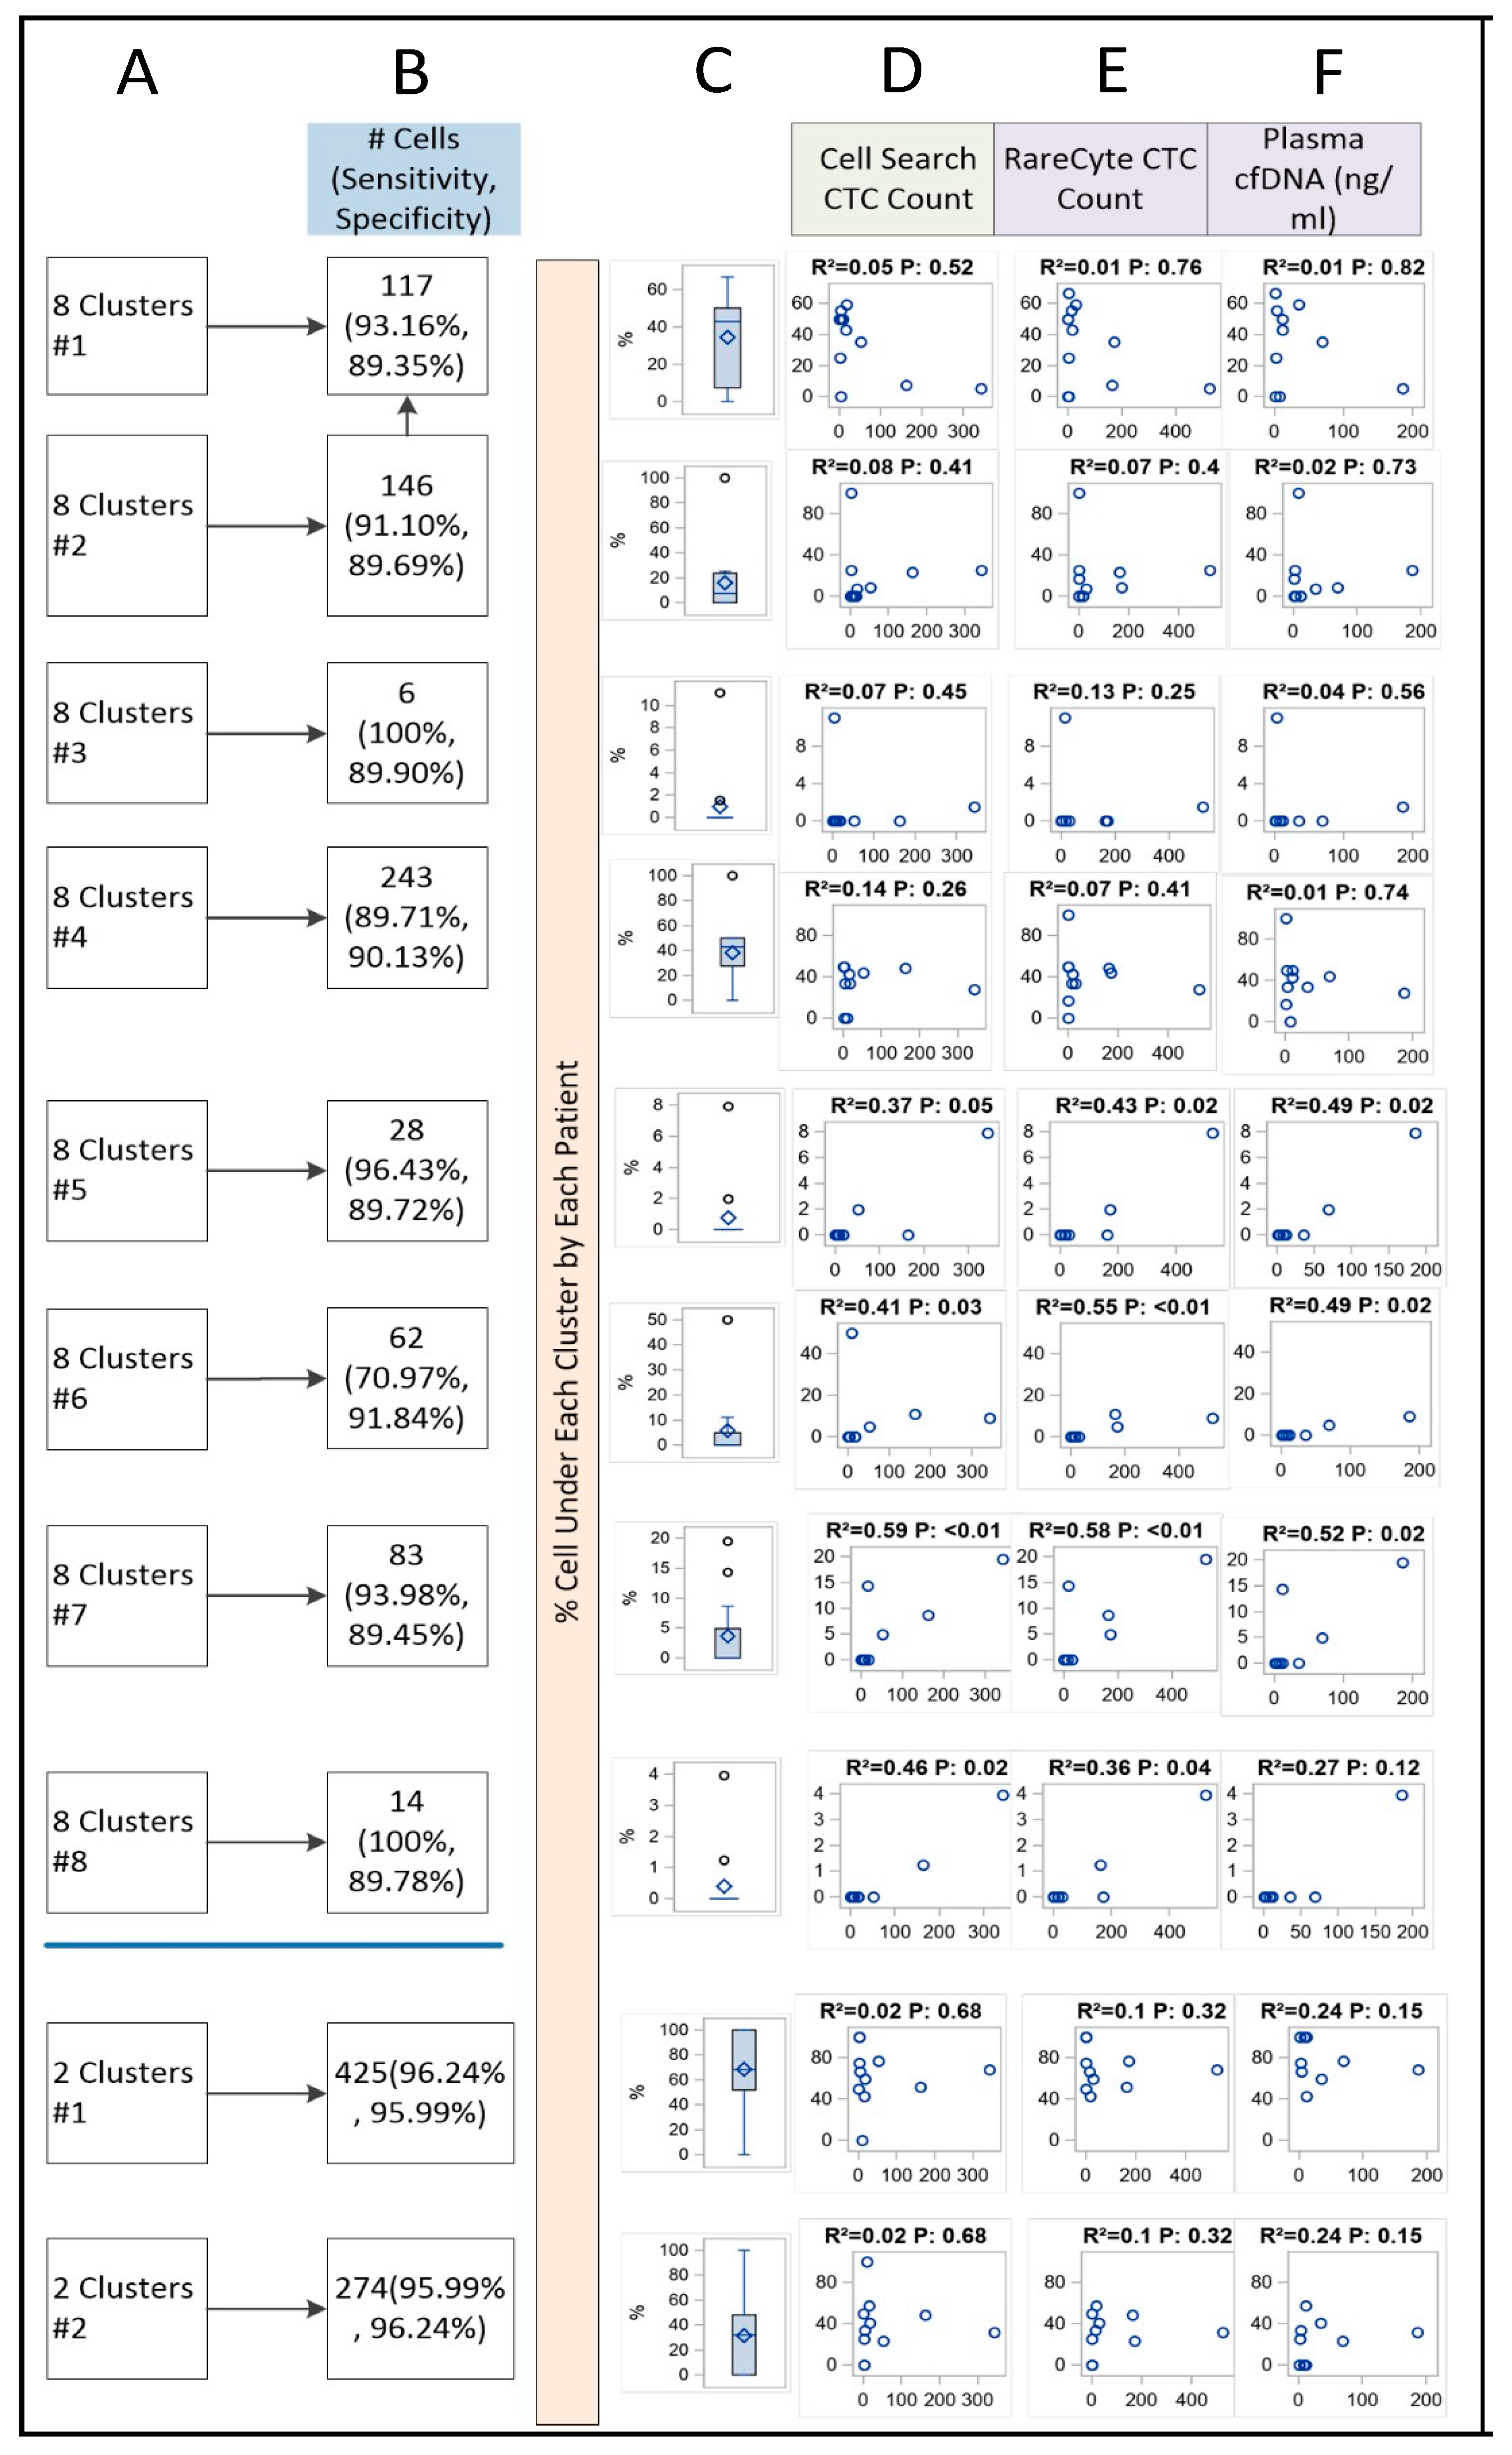
2.4. Cluster Analysis
2.5. Association between Radiomics and Liquid Biopsy Readouts
2.6. Sample Patient
3. Discussion
4. Materials and Methods
4.1. Patient Sample Collection
4.2. AccuCyte Sample Preparation
4.3. Immunofluorescence Staining
4.4. Imaging and Analysis
4.5. Clustering Analysis
4.6. Interpretation of K-Means Clusters and Validation with Established Biomarker and Clinical Data
4.7. Single-Cell Retrieval
4.8. Single-Cell Lysis
4.9. Plasma cfDNA Extraction
4.10. Amplicon-Based Sequencing and Variant Calling
4.11. Radiomic Signature or Radiomics-Based Tumor Texture Analysis
Supplementary Materials
Author Contributions
Funding
Institutional Review Board Statement
Informed Consent Statement
Data Availability Statement
Acknowledgments
Conflicts of Interest
References
- Scher, H.I.; Fizazi, K.; Saad, F.; Taplin, M.-E.; Sternberg, C.N.; Miller, K.; De Wit, R.; Mulders, P.; Chi, K.N.; Shore, N.D.; et al. Increased Survival with Enzalutamide in Prostate Cancer after Chemotherapy. N. Engl. J. Med. 2012, 367, 1187–1197. [Google Scholar] [CrossRef] [PubMed] [Green Version]
- Armstrong, A.J.; Szmulewitz, R.Z.; Petrylak, D.P.; Holzbeierlein, J.; Villers, A.; Azad, A.; Alcaraz, A.; Alekseev, B.; Iguchi, T.; Shore, N.D.; et al. ARCHES: A Randomized, Phase III Study of Androgen Deprivation Therapy With Enzalutamide or Placebo in Men With Metastatic Hormone-Sensitive Prostate Cancer. J. Clin. Oncol. 2019, 37, 2974–2986. [Google Scholar] [CrossRef]
- Fizazi, K.; Tran, N.; Fein, L.; Matsubara, N.; Rodriguez-Antolin, A.; Alekseev, B.Y.; Özgüroglu, M.; Ye, D.; Feyerabend, S.; Protheroe, A.; et al. Abiraterone acetate plus prednisone in patients with newly diagnosed high-risk metastatic castration-sensitive prostate cancer (LATITUDE): Final overall survival analysis of a randomised, double-blind, phase 3 trial. Lancet Oncol. 2019, 20, 686–700. [Google Scholar] [CrossRef]
- Teo, M.Y.; Rathkopf, D.E.; Kantoff, P. Treatment of Advanced Prostate Cancer. Annu. Rev. Med. 2019, 70, 479–499. [Google Scholar] [CrossRef] [PubMed]
- De Bono, J.; Mateo, J.; Fizazi, K.; Saad, F.; Shore, N.; Sandhu, S.; Chi, K.N.; Sartor, O.; Agarwal, N.; Olmos, D.; et al. Olaparib for Metastatic Castration-Resistant Prostate Cancer. N. Engl. J. Med. 2020, 382, 2091–2102. [Google Scholar] [CrossRef]
- Liu, Z.; Wang, L.; Zhou, Y.; Wang, C.; Ma, Y.; Zhao, Y.; Tian, J.; Huang, H.; Wang, H.; Wang, Y.; et al. Application of metastatic biopsy based on “When, Who, Why, Where, How (4W1H)” principle in diagnosis and treatment of metastatic castration-resistance prostate cancer. Transl. Androl. Urol. 2021, 10, 1723–1733. [Google Scholar] [CrossRef]
- Ferro, M.; de Cobelli, O.; Vartolomei, M.D.; Lucarelli, G.; Crocetto, F.; Barone, B.; Sciarra, A.; Del Giudice, F.; Muto, M.; Maggi, M.; et al. Prostate Cancer Radiogenomics-From Imaging to Molecular Characterization. Int. J. Mol. Sci. 2021, 22, 9971. [Google Scholar] [CrossRef]
- Lu, Y.T.; Delijani, K.; Mecum, A.; Goldkorn, A. Current status of liquid biopsies for the detection and management of prostate cancer. Cancer Manag. Res. 2019, 11, 5271–5291. [Google Scholar] [CrossRef] [Green Version]
- De Bono, J.S.; Scher, H.I.; Montgomery, R.B.; Parker, C.; Miller, M.C.; Tissing, H.; Doyle, G.V.; Terstappen, L.W.W.M.; Pienta, K.J.; Raghavan, D. Circulating Tumor Cells Predict Survival Benefit from Treatment in Metastatic Castration-Resistant Prostate Cancer. Clin. Cancer Res. 2008, 14, 6302–6309. [Google Scholar] [CrossRef] [Green Version]
- Scher, H.I.; Jia, X.; de Bono, J.S.; Fleisher, M.; Pienta, K.J.; Raghavan, D.; Heller, G. Circulating tumour cells as prognostic markers in progressive, castration-resistant prostate cancer: A reanalysis of IMMC38 trial data. Lancet Oncol. 2009, 10, 233–239. [Google Scholar] [CrossRef] [Green Version]
- Goldkorn, A.; Ely, B.; Quinn, D.I.; Tangen, C.M.; Fink, L.M.; Xu, T.; Twardowski, P.; Van Veldhuizen, P.J.; Agarwal, N.; Carducci, M.A.; et al. Circulating tumor cell counts are prognostic of overall survival in SWOG S0421: A phase III trial of docetaxel with or without atrasentan for metastatic castration-resistant prostate cancer. J. Clin. Oncol. 2014, 32, 1136–1142. [Google Scholar] [CrossRef]
- Heller, G.; Fizazi, K.; McCormack, R.; Molina, A.; MacLean, D.; Webb, I.J.; Saad, F.; de Bono, J.S.; Scher, H.I. The Added Value of Circulating Tumor Cell Enumeration to Standard Markers in Assessing Prognosis in a Metastatic Castration-Resistant Prostate Cancer Population. Clin. Cancer Res. 2017, 23, 1967–1973. [Google Scholar] [CrossRef] [PubMed] [Green Version]
- Heller, G.; McCormack, R.; Kheoh, T.; Molina, A.; Smith, M.R.; Dreicer, R.; Saad, F.; De Wit, R.; Aftab, D.T.; Hirmand, M.; et al. Circulating Tumor Cell Number as a Response Measure of Prolonged Survival for Metastatic Castration-Resistant Prostate Cancer: A Comparison with Prostate-Specific Antigen Across Five Randomized Phase III Clinical Trials. J. Clin. Oncol. 2018, 36, 572–580. [Google Scholar] [CrossRef] [PubMed]
- Lorente, D.; Olmos, D.; Mateo, J.; Dolling, D.; Bianchini, D.; Seed, G.; Flohr, P.; Crespo, M.; Figueiredo, I.; Miranda, S.; et al. Circulating tumour cell increase as a biomarker of disease progression in metastatic castration-resistant prostate cancer patients with low baseline CTC counts. Ann. Oncol. 2018, 29, 1554–1560. [Google Scholar] [CrossRef]
- Lozano, R.; Lorente, D.; Aragon, I.; Romero-Laorden, N.; Nombela, P.; Mateo, J.; Reid, A.; Cendón, Y.; Bianchini, D.; Llacer, C.; et al. Value of Early Circulating Tumor Cells Dynamics to Estimate Docetaxel Benefit in Metastatic Castration-Resistant Prostate Cancer (mCRPC) Patients. Cancers 2021, 13, 2334. [Google Scholar] [CrossRef]
- Gerdtsson, E.; Pore, M.; Thiele, J.-A.; Gerdtsson, A.S.; Malihi, P.D.; Nevarez, R.; Kolatkar, A.; Velasco, C.R.; Wix, S.; Singh, M.; et al. Multiplex protein detection on circulating tumor cells from liquid biopsies using imaging mass cytometry. Converg. Sci. Phys. Oncol. 2018, 4, 015002. [Google Scholar] [CrossRef] [PubMed]
- Hodara, E.; Morrison, G.; Cunha, A.; Zainfeld, D.; Xu, T.; Xu, Y.; Dempsey, P.W.; Pagano, P.C.; Bischoff, F.; Khurana, A.; et al. Multiparametric liquid biopsy analysis in metastatic prostate cancer. JCI Insight 2019, 4, e125529. [Google Scholar] [CrossRef]
- Antonarakis, E.S.; Lu, C.; Wang, H.; Luber, B.; Nakazawa, M.; Roeser, J.C.; Chen, Y.; Mohammad, T.A.; Chen, Y.; Fedor, H.L.; et al. AR-V7 and Resistance to Enzalutamide and Abiraterone in Prostate Cancer. N. Engl. J. Med. 2014, 371, 1028–1038. [Google Scholar] [CrossRef] [Green Version]
- Scher, H.I.; Lu, D.; Schreiber, N.A.; Louw, J.; Graf, R.P.; Vargas, H.A.; Johnson, A.; Jendrisak, A.; Bambury, R.; Danila, D.; et al. Association of AR-V7 on Circulating Tumor Cells as a Treatment-Specific Biomarker with Outcomes and Survival in Castration-Resistant Prostate Cancer. JAMA Oncol. 2016, 2, 1441–1449. [Google Scholar] [CrossRef]
- Scher, H.I.; Graf, R.P.; Schreiber, N.A.; Jayaram, A.; Winquist, E.; McLaughlin, B.; Lu, D.; Fleisher, M.; Orr, S.; Lowes, L.; et al. Assessment of the Validity of Nuclear-Localized Androgen Receptor Splice Variant 7 in Circulating Tumor Cells as a Predictive Biomarker for Castration-Resistant Prostate Cancer. JAMA Oncol. 2018, 4, 1179–1186. [Google Scholar] [CrossRef]
- Armstrong, A.J.; Halabi, S.; Luo, J.; Nanus, D.M.; Giannakakou, P.; Szmulewitz, R.Z.; Danila, D.C.; Healy, P.; Anand, M.; Rothwell, C.J.; et al. Prospective Multicenter Validation of Androgen Receptor Splice Variant 7 and Hormone Therapy Resistance in High-Risk Castration-Resistant Prostate Cancer: The Prophecy Study. J. Clin. Oncol. 2019, 37, 1120–1129. [Google Scholar] [CrossRef] [PubMed]
- Mehra, N.; Dolling, D.; Sumanasuriya, S.; Christova, R.; Pope, L.; Carreira, S.; Seed, G.; Yuan, W.; Goodall, J.; Hall, E.; et al. Plasma Cell-free DNA Concentration and Outcomes from Taxane Therapy in Metastatic Castration-resistant Prostate Cancer from Two Phase III Trials (FIRSTANA and PROSELICA). Eur. Urol. 2018, 74, 283–291. [Google Scholar] [CrossRef] [PubMed] [Green Version]
- Vandekerkhove, G.; Struss, W.J.; Annala, M.; Kallio, H.M.L.; Khalaf, D.; Warner, E.W.; Herberts, C.; Ritch, E.; Beja, K.; Loktionova, Y.; et al. Circulating Tumor DNA Abundance and Potential Utility in De Novo Metastatic Prostate Cancer. Eur. Urol. 2019, 75, 667–675. [Google Scholar] [CrossRef] [PubMed] [Green Version]
- Wyatt, A.W.; Azad, A.A.; Volik, S.V.; Annala, M.; Beja, K.; McConeghy, B.; Haegert, A.; Warner, E.W.; Mo, F.; Brahmbhatt, S.; et al. Genomic Alterations in Cell-Free DNA and Enzalutamide Resistance in Castration-Resistant Prostate Cancer. JAMA Oncol. 2016, 2, 1598–1606. [Google Scholar] [CrossRef]
- Torquato, S.; Pallavajjala, A.; Goldstein, A.; Toro, P.V.; Silberstein, J.L.; Lee, J.; Nakazawa, M.; Waters, I.; Chu, D.; Shinn, D.; et al. Genetic Alterations Detected in Cell-Free DNA Are Associated with Enzalutamide and Abiraterone Resistance in Castration-Resistant Prostate Cancer. JCO Precis. Oncol. 2019, 3, 1–14. [Google Scholar] [CrossRef]
- Goodall, J.; Mateo, J.; Yuan, W.; Mossop, H.; Porta, N.; Miranda, S.; Perez-Lopez, R.; Dolling, D.; Robinson, D.R.; Sandhu, S.; et al. Circulating Cell-Free DNA to Guide Prostate Cancer Treatment with PARP Inhibition. Cancer Discov. 2017, 7, 1006–1017. [Google Scholar] [CrossRef] [PubMed] [Green Version]
- Sperger, J.M.; Strotman, L.N.; Welsh, A.; Casavant, B.P.; Chalmers, Z.; Horn, S.; Heninger, E.; Thiede, S.M.; Tokar, J.; Gibbs, B.K.; et al. Integrated Analysis of Multiple Biomarkers from Circulating Tumor Cells Enabled by Exclusion-Based Analyte Isolation. Clin. Cancer Res. 2017, 23, 746–756. [Google Scholar] [CrossRef] [Green Version]
- Varghese, B.A.; Cen, S.Y.; Hwang, D.H.; Duddalwar, V.A. Texture Analysis of Imaging: What Radiologists Need to Know. Am. J. Roentgenol. 2019, 212, 520–528. [Google Scholar] [CrossRef]
- Tomaszewski, M.R.; Gillies, R.J. The Biological Meaning of Radiomic Features. Radiology 2021, 298, 505–516. [Google Scholar] [CrossRef]
- Renard-Penna, R.; Cancel-Tassin, G.; Comperat, E.; Varinot, J.; Léon, P.; Roupret, M.; Mozer, P.; Vaessen, C.; Lucidarme, O.; Bitker, M.-O.; et al. Multiparametric Magnetic Resonance Imaging Predicts Postoperative Pathology but Misses Aggressive Prostate Cancers as Assessed by Cell Cycle Progression Score. J. Urol. 2015, 194, 1617–1623. [Google Scholar] [CrossRef]
- Stoyanova, R.; Pollack, A.; Takhar, M.; Lynne, C.; Parra, N.; Lam, L.L.; Alshalalfa, M.; Buerki, C.; Castillo, R.; Jorda, M.; et al. Association of multiparametric MRI quantitative imaging features with prostate cancer gene expression in MRI-targeted prostate biopsies. Oncotarget 2016, 7, 53362–53376. [Google Scholar] [CrossRef] [PubMed] [Green Version]
- Varghese, B.A.; Hwang, D.; Cen, S.Y.; Lei, X.; Levy, J.; Desai, B.; Goodenough, D.J.; Duddalwar, V.A. Identification of robust and reproducible CT-texture metrics using a customized 3D-printed texture phantom. J. Appl. Clin. Med. Phys. 2021, 22, 98–107. [Google Scholar] [CrossRef] [PubMed]
- Tixier, F.; Jaouen, V.; Hognon, C.; Gallinato, O.; Colin, T.; Visvikis, D. Evaluation of conventional and deep learning based image harmonization methods in radiomics studies. Phys. Med. Biol. 2021, 66, 245009. [Google Scholar] [CrossRef] [PubMed]
- Schonhoft, J.D.; Zhao, J.L.; Jendrisak, A.; Carbone, E.A.; Barnett, E.S.; Hullings, M.A.; Gill, A.; Sutton, R.; Lee, J.; Dago, A.E.; et al. Morphology-Predicted Large-Scale Transition Number in Circulating Tumor Cells Identifies a Chromosomal Instability Biomarker Associated with Poor Outcome in Castration-Resistant Prostate Cancer. Cancer Res. 2020, 80, 4892–4903. [Google Scholar] [CrossRef] [PubMed]
- Brown, L.C.; Halabi, S.; Schonhoft, J.D.; Yang, Q.; Luo, J.; Nanus, D.M.; Giannakakou, P.; Szmulewitz, R.Z.; Danila, D.C.; Barnett, E.S.; et al. Circulating Tumor Cell Chromosomal Instability and Neuroendocrine Phenotype by Immunomorphology and Poor Outcomes in Men with mCRPC Treated with Abiraterone or Enzalutamide. Clin. Cancer Res. 2021, 27, 4077–4088. [Google Scholar] [CrossRef] [PubMed]
- Spetsieris, N.; Boukovala, M.; Patsakis, G.; Alafis, I.; Efstathiou, E. Neuroendocrine and Aggressive-Variant Prostate Cancer. Cancers 2020, 12, 3792. [Google Scholar] [CrossRef]
- Armstrong, A.J.; Luo, J.; Nanus, D.M.; Giannakakou, P.; Szmulewitz, R.Z.; Danila, D.C.; Healy, P.; Anand, M.; Berry, W.R.; Zhang, T.; et al. Prospective Multicenter Study of Circulating Tumor Cell AR-V7 and Taxane Versus Hormonal Treatment Outcomes in Metastatic Castration-Resistant Prostate Cancer. JCO Precis. Oncol. 2020, 4, 1285–1301. [Google Scholar] [CrossRef]
- Hamada, A.; Sissung, T.; Price, D.K.; Danesi, R.; Chau, C.H.; Sharifi, N.; Venzon, D.; Maeda, K.; Nagao, K.; Sparreboom, A.; et al. Effect of SLCO1B3 Haplotype on Testosterone Transport and Clinical Outcome in Caucasian Patients with Androgen-Independent Prostatic Cancer. Clin. Cancer Res. 2008, 14, 3312–3318. [Google Scholar] [CrossRef] [Green Version]
- Wright, J.L.; Kwon, E.M.; Ostrander, E.; Montgomery, R.B.; Lin, D.W.; Vessella, R.; Stanford, J.L.; Mostaghel, E.A. Expression of SLCO Transport Genes in Castration-Resistant Prostate Cancer and Impact of Genetic Variation in SLCO1B3 and SLCO2B1 on Prostate Cancer Outcomes. Cancer Epidemiol. Biomark. Prev. 2011, 20, 619–627. [Google Scholar] [CrossRef] [Green Version]
- Yang, M.; Xie, W.; Mostaghel, E.; Nakabayashi, M.; Werner, L.; Sun, T.; Pomerantz, M.; Freedman, M.; Ross, R.; Regan, M.; et al. SLCO2B1 and SLCO1B3 May Determine Time to Progression for Patients Receiving Androgen Deprivation Therapy for Prostate Cancer. J. Clin. Oncol. 2011, 29, 2565–2573. [Google Scholar] [CrossRef] [Green Version]
- Cancer Genome Atlas Research Network. The Molecular Taxonomy of Primary Prostate Cancer. Cell 2015, 163, 1011–1025. [Google Scholar] [CrossRef] [PubMed] [Green Version]
- Gundem, G.; Van Loo, P.; Kremeyer, B.; Alexandrov, L.B.; Tubio, J.M.C.; Papaemmanuil, E.; Brewer, D.S.; Kallio, H.M.L.; Hognas, G.; Annala, M.; et al. The evolutionary history of lethal metastatic prostate cancer. Nature 2015, 520, 353–357. [Google Scholar] [CrossRef] [PubMed]
- Robinson, D.; Van Allen, E.M.; Wu, Y.-M.; Schultz, N.; Lonigro, R.J.; Mosquera, J.-M.; Montgomery, B.; Taplin, M.-E.; Pritchard, C.C.; Attard, G.; et al. Integrative Clinical Genomics of Advanced Prostate Cancer. Cell 2015, 161, 1215–1228. [Google Scholar] [CrossRef] [PubMed] [Green Version]
- Aparicio, A.M.; Shen, L.; Tapia, E.M.L.N.; Lu, J.-F.; Chen, H.-C.; Zhang, J.; Wu, G.; Wang, X.; Troncoso, P.; Corn, P.G.; et al. Combined Tumor Suppressor Defects Characterize Clinically Defined Aggressive Variant Prostate Cancers. Clin. Cancer Res. 2015, 22, 1520–1530. [Google Scholar] [CrossRef] [Green Version]
- Corn, P.G.; Tapia, E.L.N.; Xiao, L.; Heath, E.I.; Chancoco, H.; Hoang, A.; Efstathiou, E.; Thompson, T.C.; Troncoso, P.; Logothetis, C.; et al. Confirmatory analysis to determine associations between platinum-sensitivity, molecular signature of combined tumor suppressor defects and aggressive variant prostate carcinomas (AVPC). J. Clin. Oncol. 2016, 34, 5020. [Google Scholar] [CrossRef]
- Hearn, J.W.D.; AbuAli, G.; Reichard, C.A.; Reddy, C.A.; Magi-Galluzzi, C.; Chang, K.H.; Carlson, R.; Rangel, L.; Reagan, K.; Davis, B.J.; et al. HSD3B1 and resistance to androgen-deprivation therapy in prostate cancer: A retrospective, multicohort study. Lancet Oncol. 2016, 17, 1435–1444. [Google Scholar] [CrossRef] [Green Version]
- Kumar, A.; Coleman, I.; Morrissey, C.; Zhang, X.; True, L.D.; Gulati, R.; Etzioni, R.; Bolouri, H.; Montgomery, B.; White, T.; et al. Substantial interindividual and limited intraindividual genomic diversity among tumors from men with metastatic prostate cancer. Nat. Med. 2016, 22, 369–378. [Google Scholar] [CrossRef]
- Pritchard, C.C.; Mateo, J.; Walsh, M.F.; De Sarkar, N.; Abida, W.; Beltran, H.; Garofalo, A.; Gulati, R.; Carreira, S.; Eeles, R.; et al. Inherited DNA-Repair Gene Mutations in Men with Metastatic Prostate Cancer. N. Engl. J. Med. 2016, 375, 443–453. [Google Scholar] [CrossRef]
- Abida, W.; Armenia, J.; Gopalan, A.; Brennan, R.; Walsh, M.; Barron, D.; Danila, D.; Rathkopf, D.; Morris, M.; Slovin, S.; et al. Prospective Genomic Profiling of Prostate Cancer Across Disease States Reveals Germline and Somatic Alterations That May Affect Clinical Decision Making. JCO Precis. Oncol. 2017, 1, 1–16. [Google Scholar] [CrossRef] [PubMed]
- Fraser, M.; Sabelnykova, V.Y.; Yamaguchi, T.N.; Heisler, L.E.; Livingstone, J.; Huang, V.; Shiah, Y.J.; Yousif, F.; Lin, X.; Masella, A.P.; et al. Genomic hallmarks of localized, non-indolent prostate cancer. Nature 2017, 541, 359–364. [Google Scholar] [CrossRef]
- Ku, S.Y.; Rosario, S.; Wang, Y.; Mu, P.; Seshadri, M.; Goodrich, Z.W.; Goodrich, M.M.; Labbe, D.P.; Gomez, E.C.; Wang, J.; et al. Rb1 and Trp53 cooperate to suppress prostate cancer lineage plasticity, metastasis, and antiandrogen resistance. Science 2017, 355, 78–83. [Google Scholar] [CrossRef] [Green Version]
- Mu, P.; Zhang, Z.; Benelli, M.; Karthaus, W.R.; Hoover, E.; Chen, C.-C.; Wongvipat, J.; Ku, S.-Y.; Gao, D.; Cao, Z.; et al. SOX2 promotes lineage plasticity and antiandrogen resistance in TP53- and RB1-deficient prostate cancer. Science 2017, 355, 84–88. [Google Scholar] [CrossRef] [Green Version]
- Armenia, J.; Wankowicz, S.A.M.; Liu, D.; Gao, J.; Kundra, R.; Reznik, E.; Chatila, W.K.; Chakravarty, D.; Han, G.C.; Coleman, I.; et al. The long tail of oncogenic drivers in prostate cancer. Nat. Genet. 2018, 50, 645–651. [Google Scholar] [CrossRef] [PubMed]
- Viswanathan, S.; Ha, G.; Hoff, A.M.; Wala, J.A.; Carrot-Zhang, J.; Whelan, C.; Haradhvala, N.J.; Freeman, S.; Reed, S.; Rhoades, J.; et al. Structural Alterations Driving Castration-Resistant Prostate Cancer Revealed by Linked-Read Genome Sequencing. Cell 2018, 174, 433–447.e19. [Google Scholar] [CrossRef] [PubMed] [Green Version]
- Wedge, D.C.; Gundem, G.; Mitchell, T.; Woodcock, D.J.; Martincorena, I.; Ghori, M.; Zamora, J.; Butler, A.; Whitaker, H.; Kote-Jarai, Z.; et al. Sequencing of prostate cancers identifies new cancer genes, routes of progression and drug targets. Nat. Genet. 2018, 50, 682–692. [Google Scholar] [CrossRef] [Green Version]
- Zhao, X.-Y.; Malloy, P.J.; Krishnan, A.V.; Swami, S.; Navone, N.M.; Peehl, D.M.; Feldman, D. Glucocorticoids can promote androgen-independent growth of prostate cancer cells through a mutated androgen receptor. Nat. Med. 2000, 6, 703–706. [Google Scholar] [CrossRef] [PubMed]
- Krishnan, A.V.; Zhao, X.Y.; Swami, S.; Brive, L.; Peehl, D.M.; Ely, K.R.; Feldman, D. A glucocorticoid-responsive mutant androgen receptor exhibits unique ligand specificity: Therapeutic implications for androgen-independent prostate cancer. Endocrinology 2002, 143, 1889–1900. [Google Scholar] [CrossRef]
- Joseph, J.D.; Lu, N.; Qian, J.; Sensintaffar, J.; Shao, G.; Brigham, D.; Moon, M.; Maneval, E.C.; Chen, I.; Darimont, B.; et al. A clinically relevant androgen receptor mutation confers resistance to second-generation antiandrogens enzalutamide and ARN-509. Cancer Discov. 2013, 3, 1020–1029. [Google Scholar] [CrossRef] [Green Version]
- Korpal, M.; Korn, J.M.; Gao, X.; Rakiec, D.P.; Ruddy, D.A.; Doshi, S.; Yuan, J.; Kovats, S.G.; Kim, S.; Cooke, V.G.; et al. An F876L mutation in androgen receptor confers genetic and phenotypic resistance to MDV3100 (enzalutamide). Cancer Discov. 2013, 3, 1030–1043. [Google Scholar] [CrossRef] [PubMed] [Green Version]
- Azad, A.A.; Volik, S.V.; Wyatt, A.W.; Haegert, A.; Le Bihan, S.; Bell, R.H.; Anderson, S.A.; McConeghy, B.; Shukin, R.; Bazov, J.; et al. Androgen Receptor Gene Aberrations in Circulating Cell-Free DNA: Biomarkers of Therapeutic Resistance in Castration-Resistant Prostate Cancer. Clin. Cancer Res. 2015, 21, 2315–2324. [Google Scholar] [CrossRef] [Green Version]
- Annala, M.; Vandekerkhove, G.; Khalaf, D.; Taavitsainen, S.; Beja, K.; Warner, E.W.; Sunderland, K.; Kollmannsberger, C.; Eigl, B.J.; Finch, D.; et al. Circulating Tumor DNA Genomics Correlate with Resistance to Abiraterone and Enzalutamide in Prostate Cancer. Cancer Discov. 2018, 8, 444–457. [Google Scholar] [CrossRef] [Green Version]
- Manier, S.; Park, J.; Capelletti, M.; Bustoros, M.; Freeman, S.S.; Ha, G.; Rhoades, J.; Liu, C.J.; Huynh, D.; Reed, S.C.; et al. Whole-exome sequencing of cell-free DNA and circulating tumor cells in multiple myeloma. Nat. Commun. 2018, 9, 1691. [Google Scholar] [CrossRef] [PubMed]
- Gerratana, L.; Davis, A.A.; Zhang, Q.; Basile, D.; Rossi, G.; Strickland, K.; Franzoni, A.; Allegri, L.; Mu, Z.; Zhang, Y.; et al. Longitudinal Dynamics of Circulating Tumor Cells and Circulating Tumor DNA for Treatment Monitoring in Metastatic Breast Cancer. JCO Precis. Oncol. 2021, 5, 943–952. [Google Scholar] [CrossRef]
- Scher, H.I.; Graf, R.P.; Schreiber, N.A.; McLaughlin, B.; Jendrisak, A.; Wang, Y.; Lee, J.; Greene, S.; Krupa, R.; Lu, D.; et al. Phenotypic Heterogeneity of Circulating Tumor Cells Informs Clinical Decisions between AR Signaling Inhibitors and Taxanes in Metastatic Prostate Cancer. Cancer Res. 2017, 77, 5687–5698. [Google Scholar] [CrossRef] [Green Version]
- Cucchiara, F.; Del Re, M.; Valleggi, S.; Romei, C.; Petrini, I.; Lucchesi, M.; Crucitta, S.; Rofi, E.; De Liperi, A.; Chella, A.; et al. Integrating Liquid Biopsy and Radiomics to Monitor Clonal Heterogeneity of EGFR-Positive Non-Small Cell Lung Cancer. Front. Oncol. 2020, 10, 593831. [Google Scholar] [CrossRef] [PubMed]
- Campton, D.E.; Ramirez, A.B.; Nordberg, J.J.; Drovetto, N.; Clein, A.C.; Varshavskaya, P.; Friemel, B.H.; Quarre, S.; Breman, A.; Dorschner, M.; et al. High-recovery visual identification and single-cell retrieval of circulating tumor cells for genomic analysis using a dual-technology platform integrated with automated immunofluorescence staining. BMC Cancer 2015, 15, 360. [Google Scholar] [CrossRef] [PubMed] [Green Version]
- Kaldjian, E.P.; Ramirez, A.B.; Sun, Y.; Campton, D.E.; Werbin, J.L.; Varshavskaya, P.; Quarre, S.; George, T.; Madan, A.; Blau, C.A.; et al. The RareCyte(R) platform for next-generation analysis of circulating tumor cells. Cytom. A 2018, 93, 1220–1225. [Google Scholar] [CrossRef] [PubMed] [Green Version]
- Yushkevich, P.A.; Piven, J.; Hazlett, H.C.; Smith, R.G.; Ho, S.; Gee, J.C.; Gerig, G. User-guided 3D active contour segmentation of anatomical structures: Significantly improved efficiency and reliability. NeuroImage 2006, 31, 1116–1128. [Google Scholar] [CrossRef] [PubMed] [Green Version]
- Davatzikos, C.; Rathore, S.; Bakas, S.; Pati, S.; Bergman, M.; Kalarot, R.; Sridharan, P.; Gastounioti, A.; Jahani, N.; Cohen, E.; et al. Cancer imaging phenomics toolkit: Quantitative imaging analytics for precision diagnostics and predictive modeling of clinical outcome. J. Med. Imaging 2018, 5, 011018. [Google Scholar] [CrossRef]
- Zwanenburg, A.; Leger, S.; Vallières, M.; Löck, S. Image biomarker standardization initiative. arXiv 2016, arXiv:1612.07003. [Google Scholar]


Publisher’s Note: MDPI stays neutral with regard to jurisdictional claims in published maps and institutional affiliations. |
© 2022 by the authors. Licensee MDPI, Basel, Switzerland. This article is an open access article distributed under the terms and conditions of the Creative Commons Attribution (CC BY) license (https://creativecommons.org/licenses/by/4.0/).
Share and Cite
Morrison, G.; Buckley, J.; Ostrow, D.; Varghese, B.; Cen, S.Y.; Werbin, J.; Ericson, N.; Cunha, A.; Lu, Y.-T.; George, T.; et al. Non-Invasive Profiling of Advanced Prostate Cancer via Multi-Parametric Liquid Biopsy and Radiomic Analysis. Int. J. Mol. Sci. 2022, 23, 2571. https://0-doi-org.brum.beds.ac.uk/10.3390/ijms23052571
Morrison G, Buckley J, Ostrow D, Varghese B, Cen SY, Werbin J, Ericson N, Cunha A, Lu Y-T, George T, et al. Non-Invasive Profiling of Advanced Prostate Cancer via Multi-Parametric Liquid Biopsy and Radiomic Analysis. International Journal of Molecular Sciences. 2022; 23(5):2571. https://0-doi-org.brum.beds.ac.uk/10.3390/ijms23052571
Chicago/Turabian StyleMorrison, Gareth, Jonathan Buckley, Dejerianne Ostrow, Bino Varghese, Steven Y. Cen, Jeffrey Werbin, Nolan Ericson, Alexander Cunha, Yi-Tsung Lu, Thaddeus George, and et al. 2022. "Non-Invasive Profiling of Advanced Prostate Cancer via Multi-Parametric Liquid Biopsy and Radiomic Analysis" International Journal of Molecular Sciences 23, no. 5: 2571. https://0-doi-org.brum.beds.ac.uk/10.3390/ijms23052571