
Insights into S. aureus-Induced Bone Deformation in a Mouse Model of Chronic Osteomyelitis Using Fluorescence and Raman Imaging
 , , ,
, , , 
 and
and 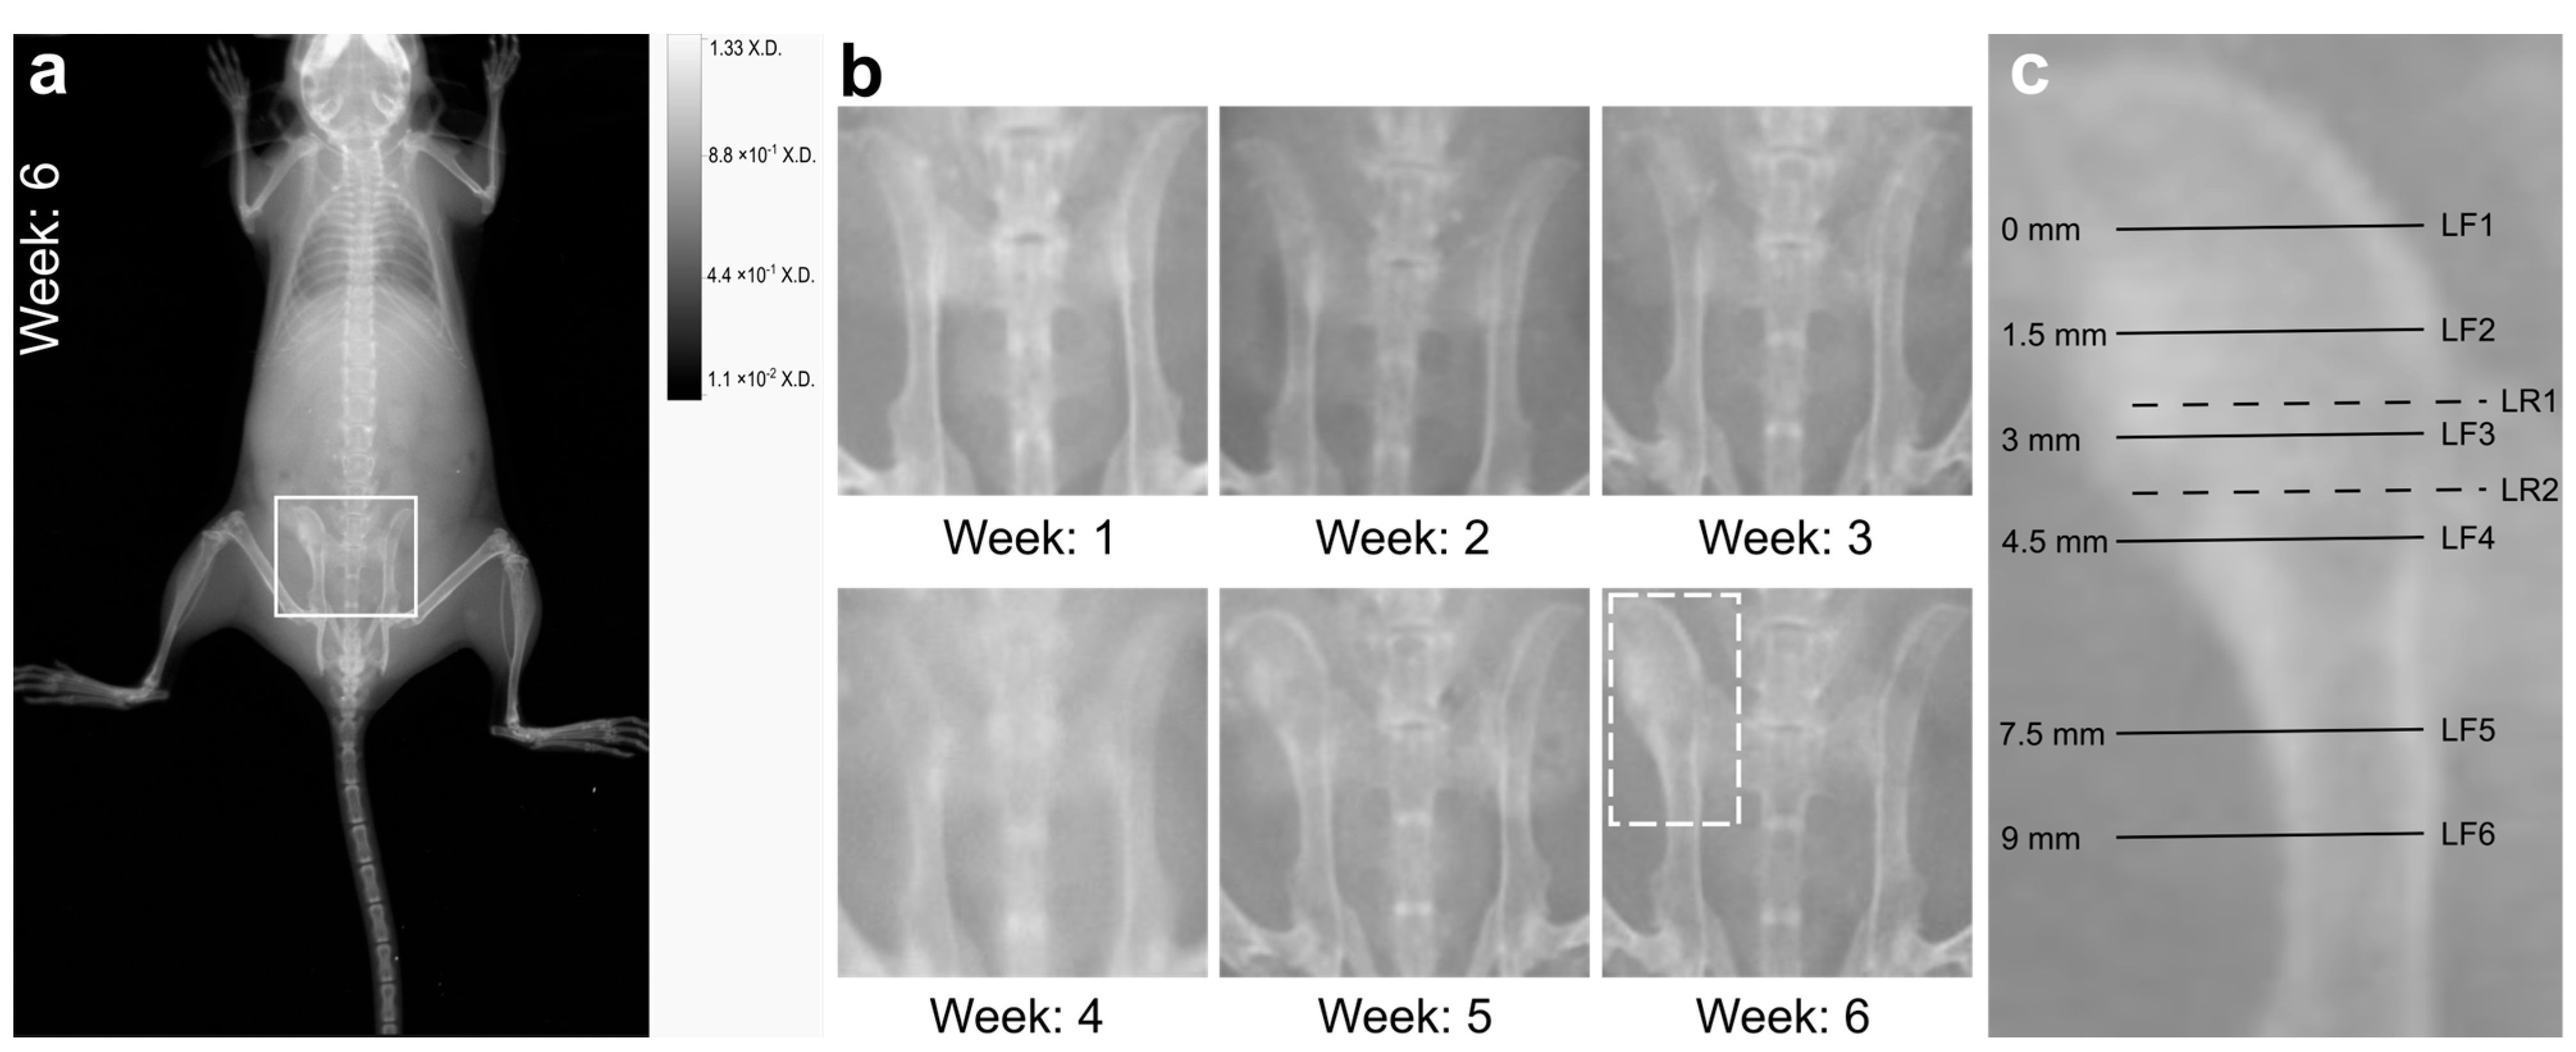
Abstract
:1. Introduction
2. Results and Discussion
2.1. Infection Caused Phenotypic Changes
2.2. X-ray Imaging Revealed Macroscopic Signs of Osteomyelitis
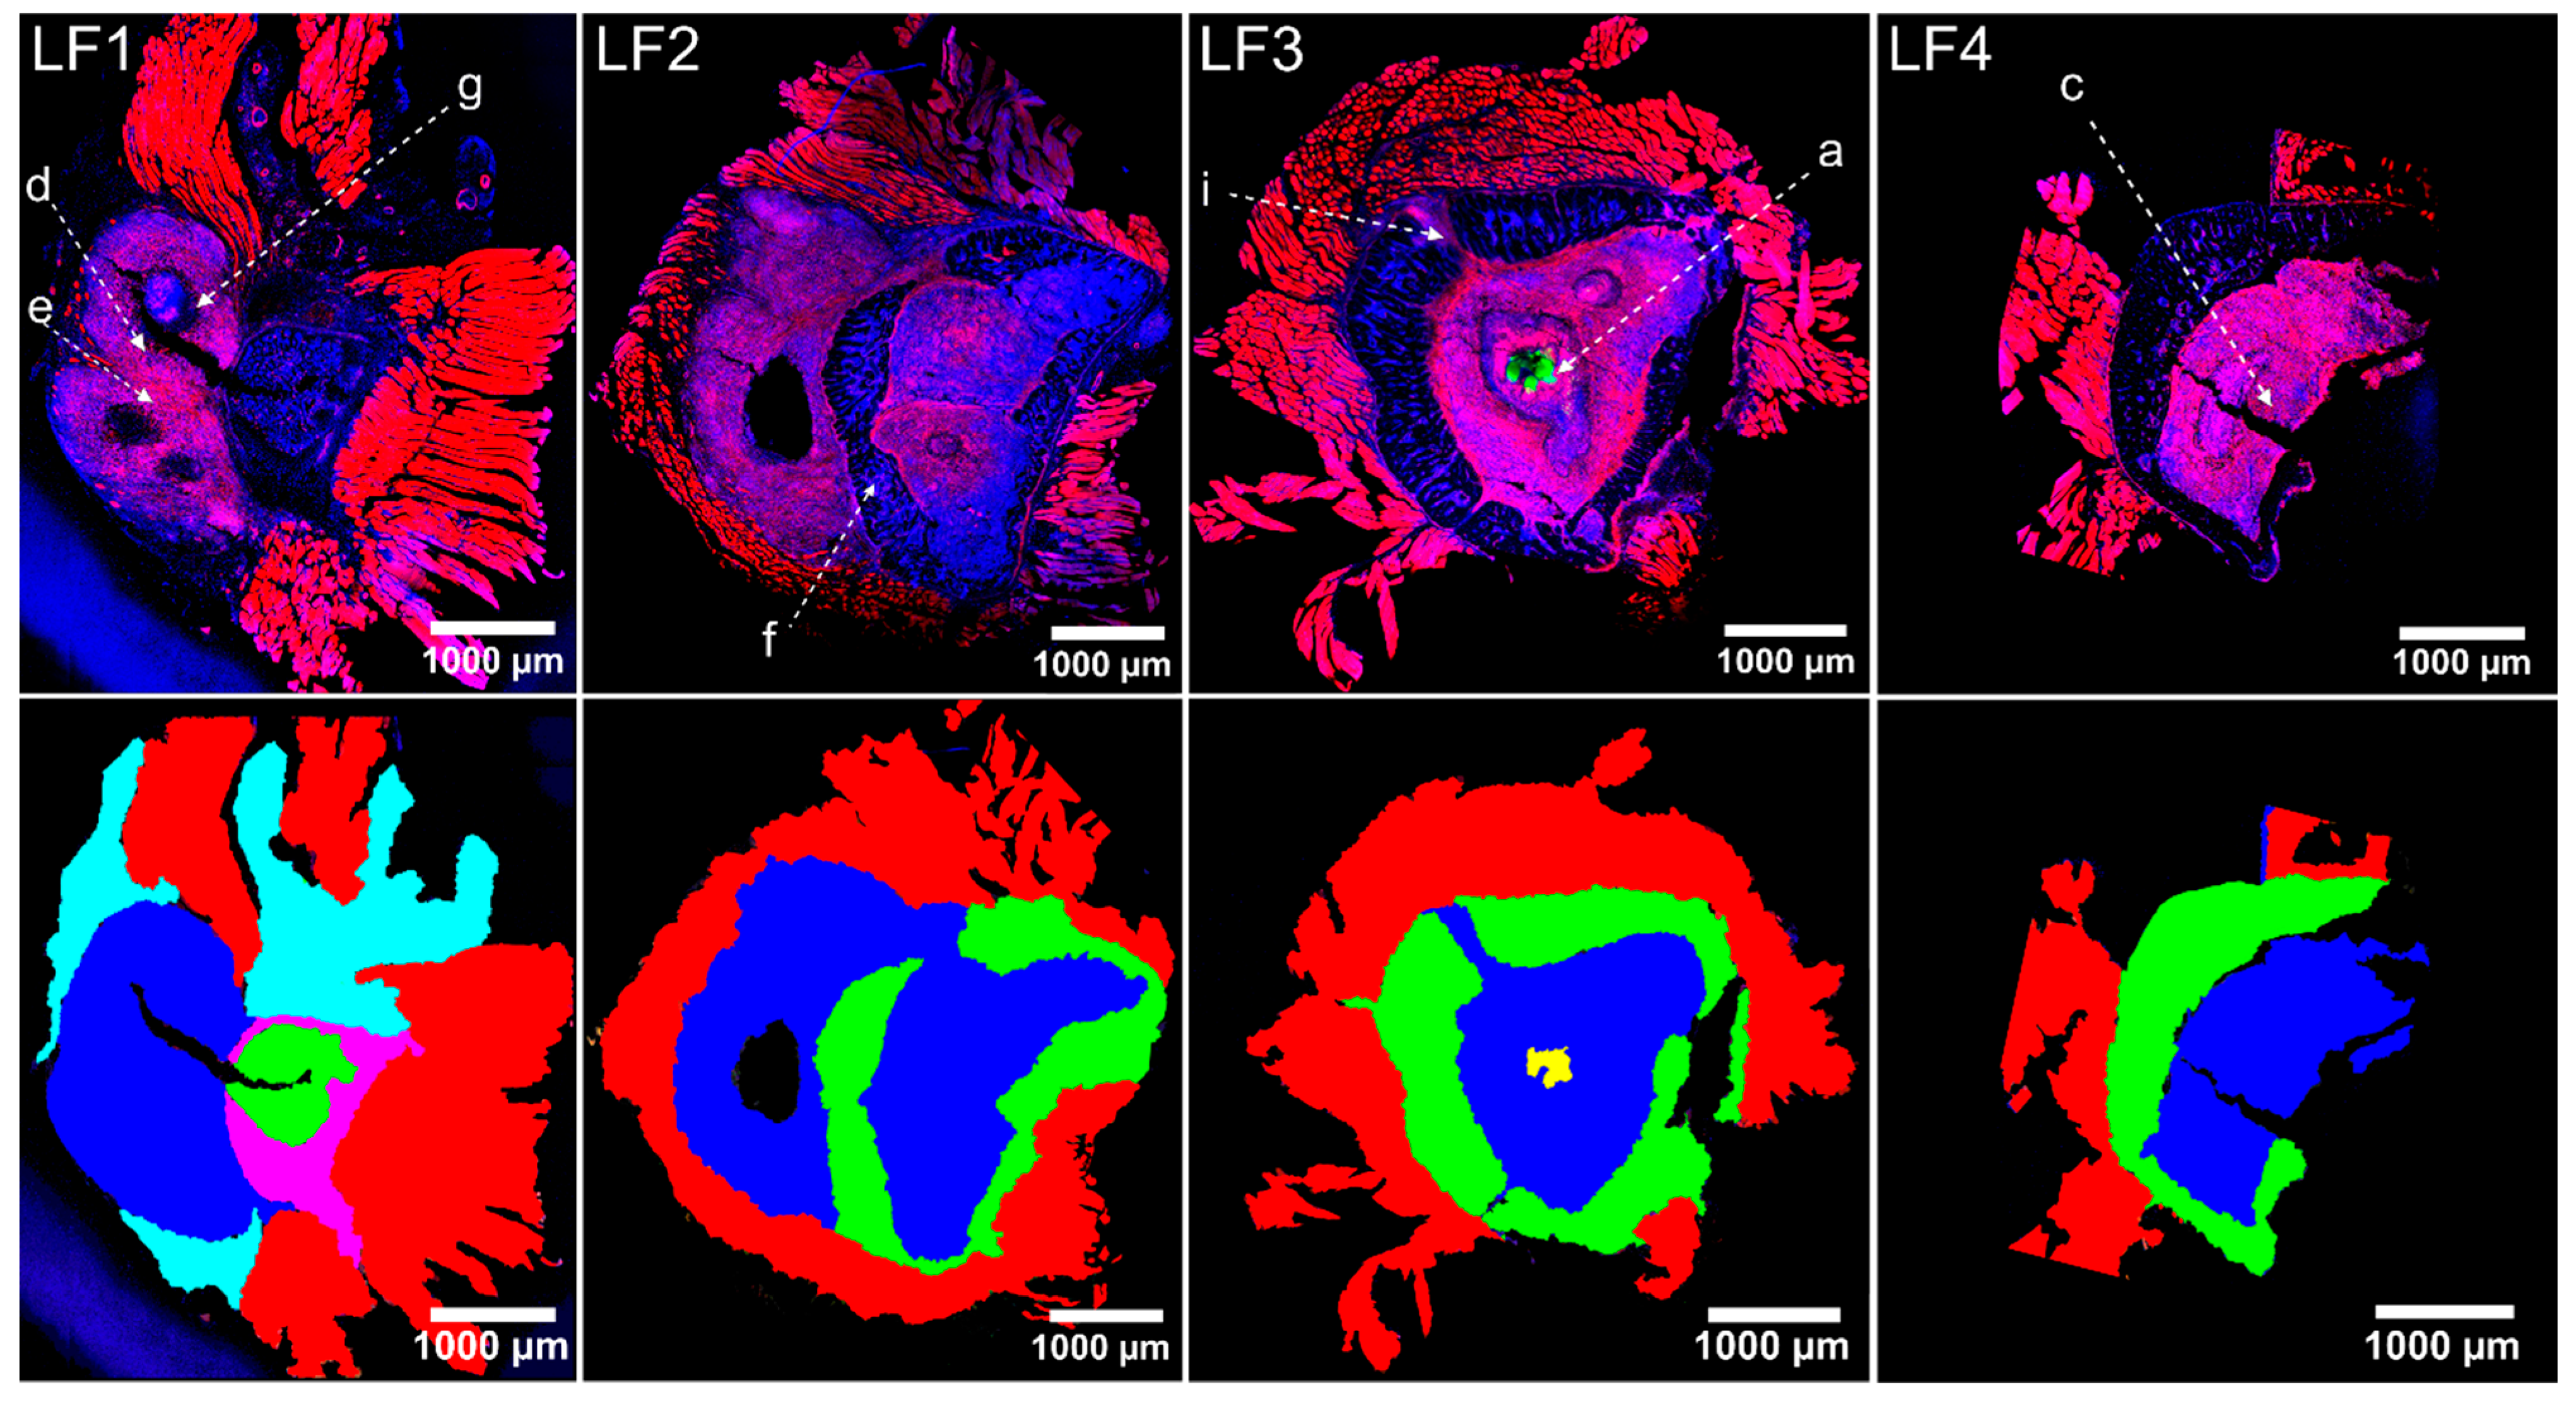
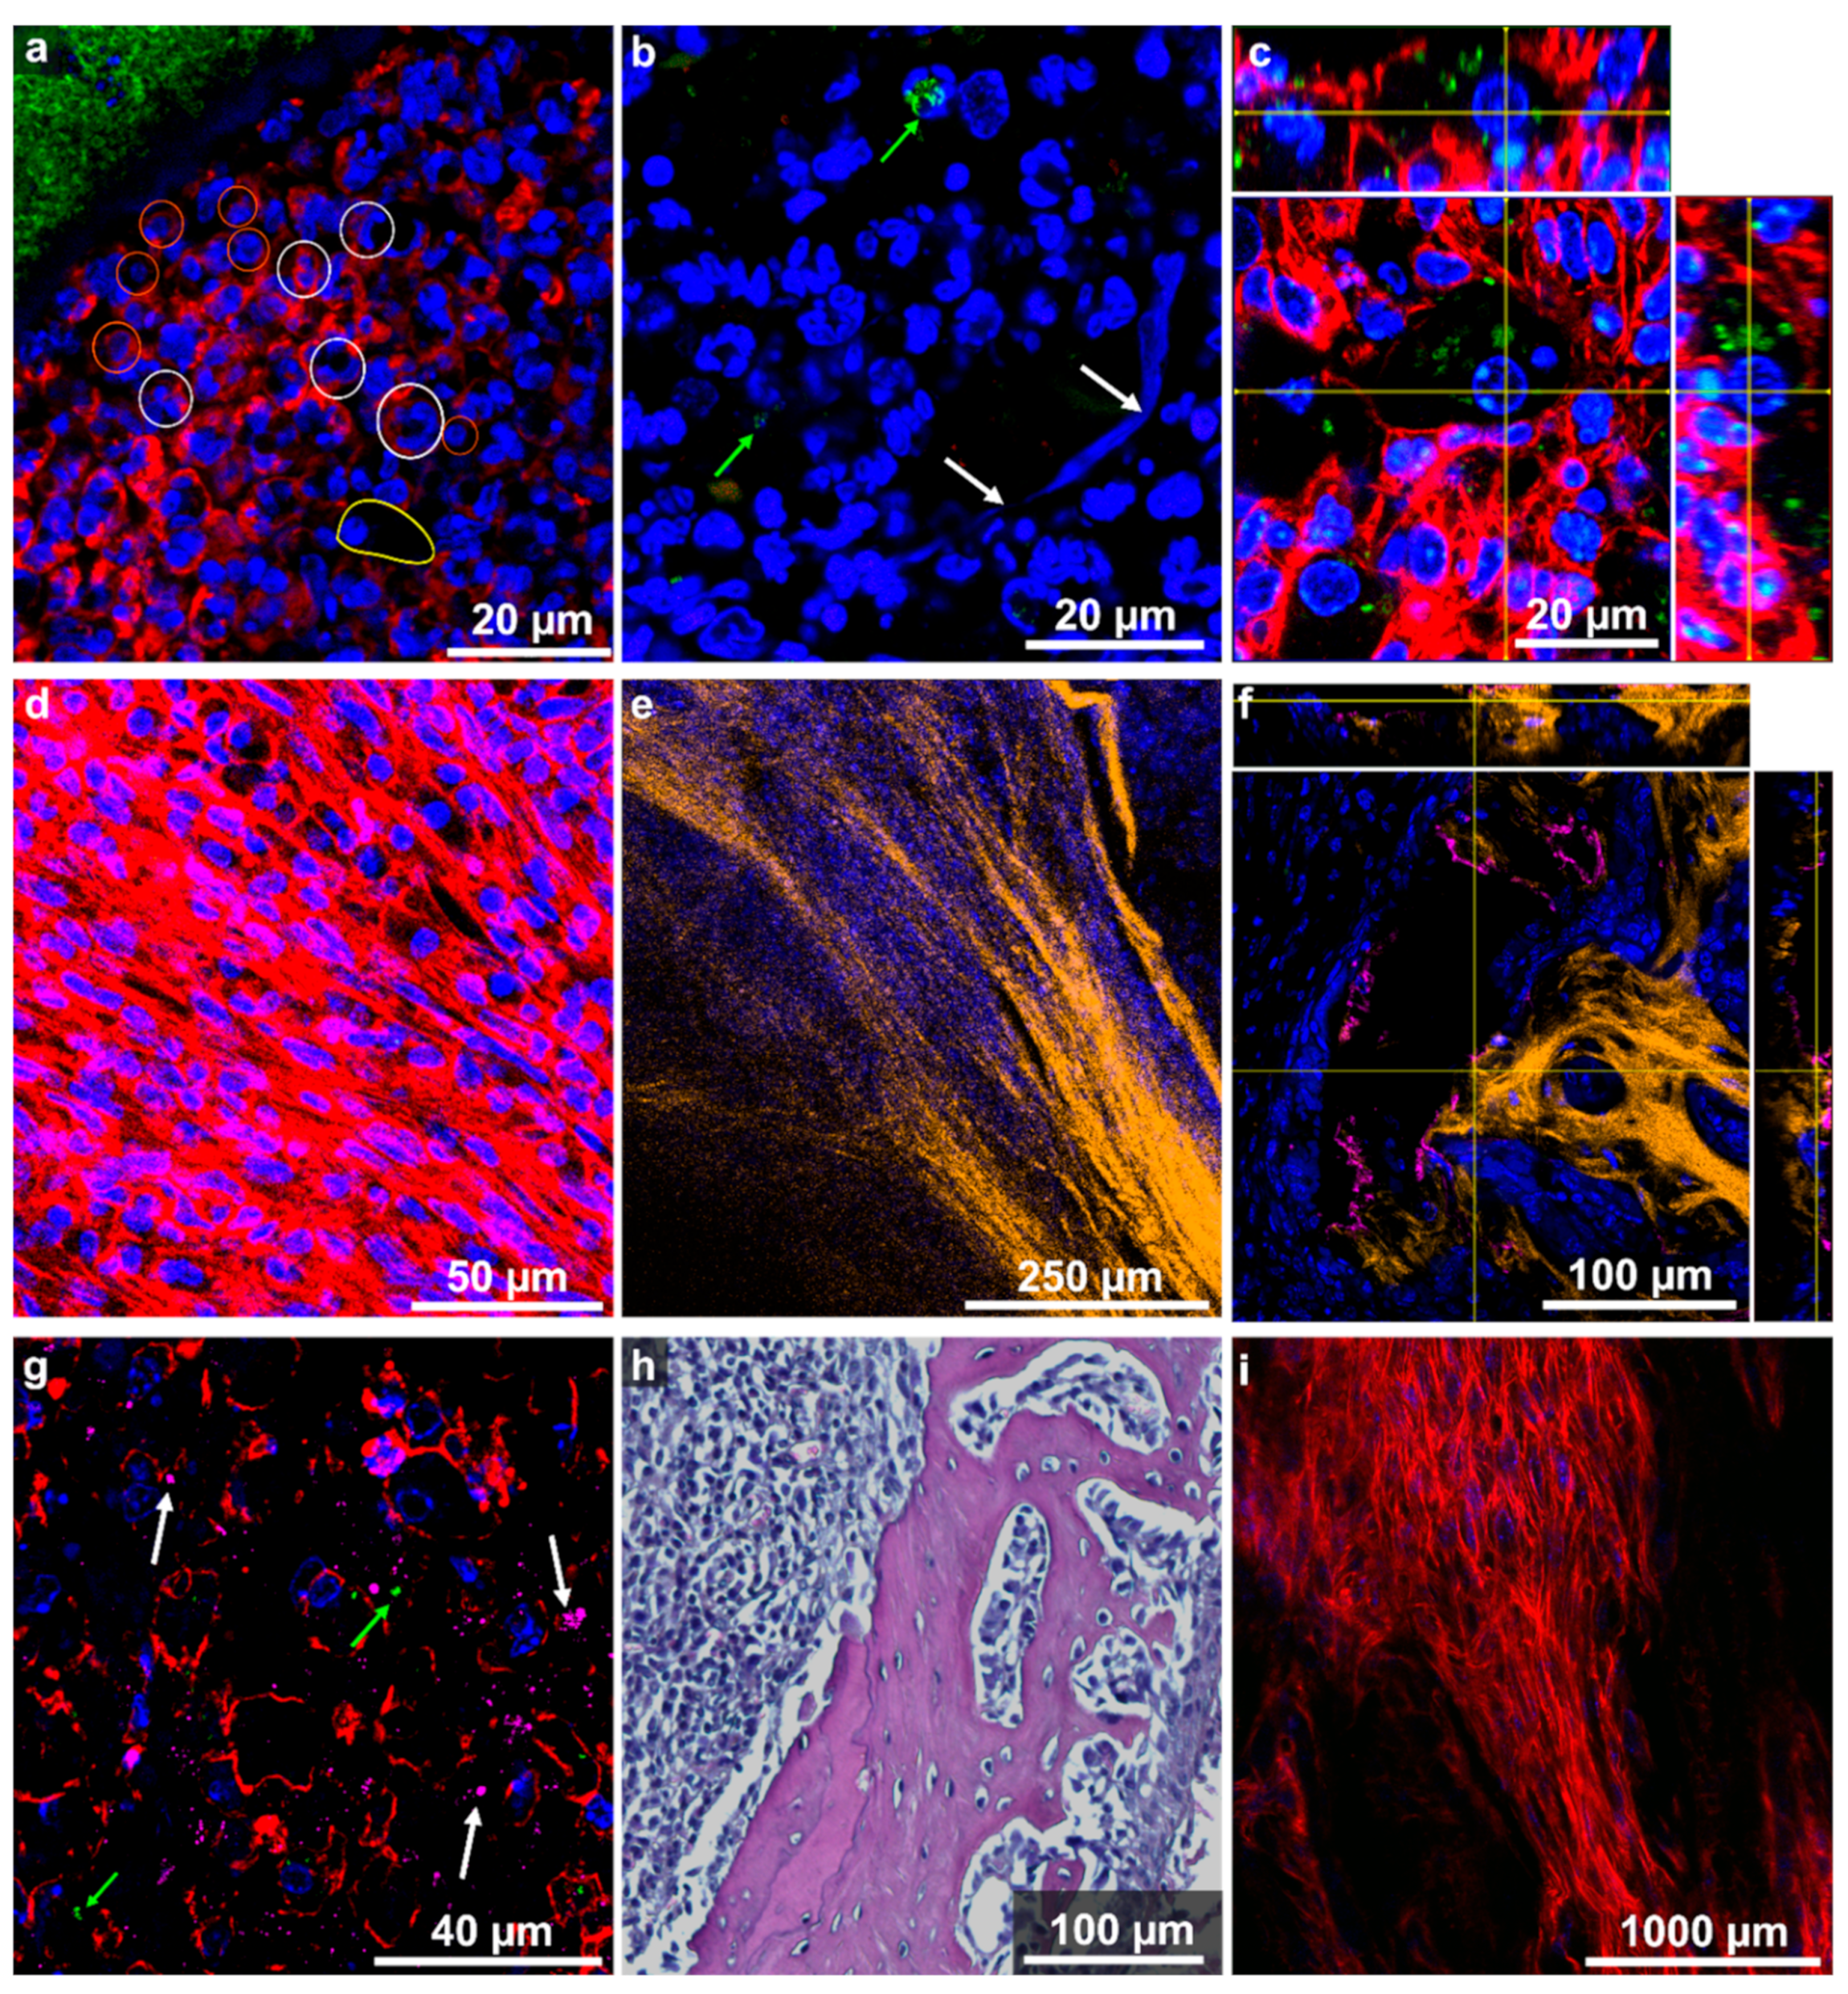
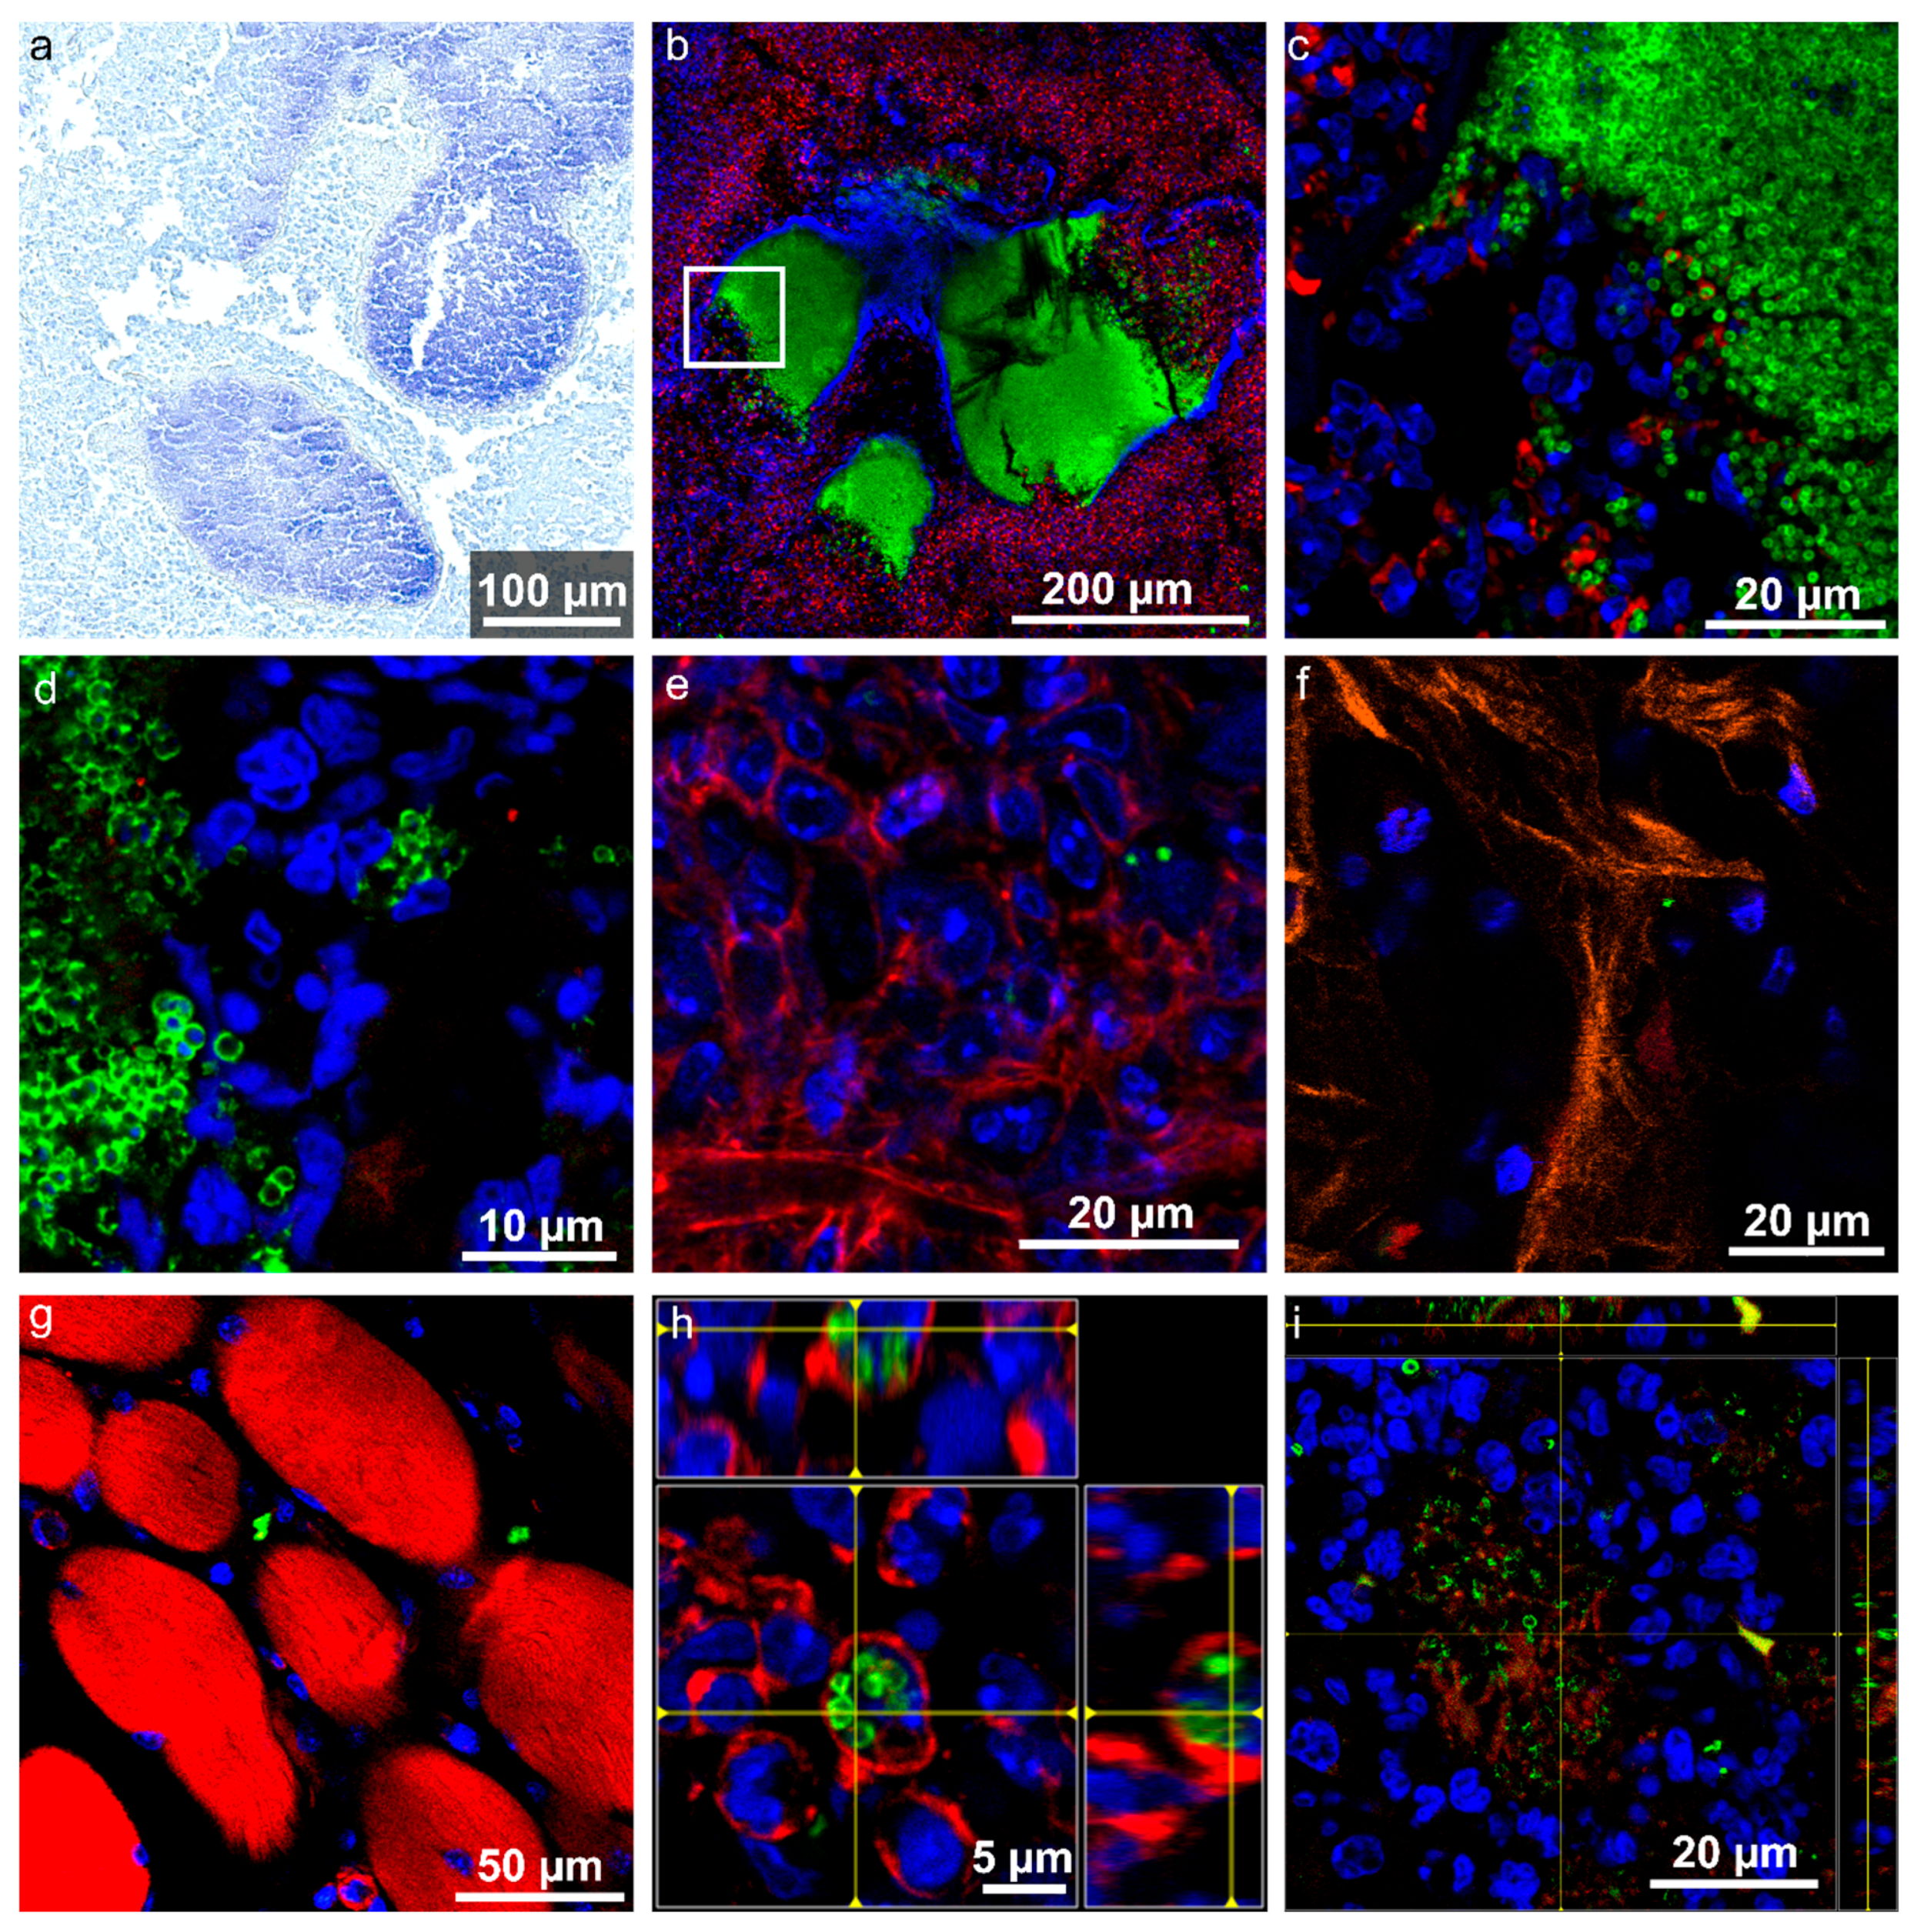
2.3. On Microscopic Scale, Severe Lesions and Bacterial Abscesses Were Visible

2.4. Host Tissue Feature Analysis Indicated the Presence of a Chronically Florid Osteomyelitis

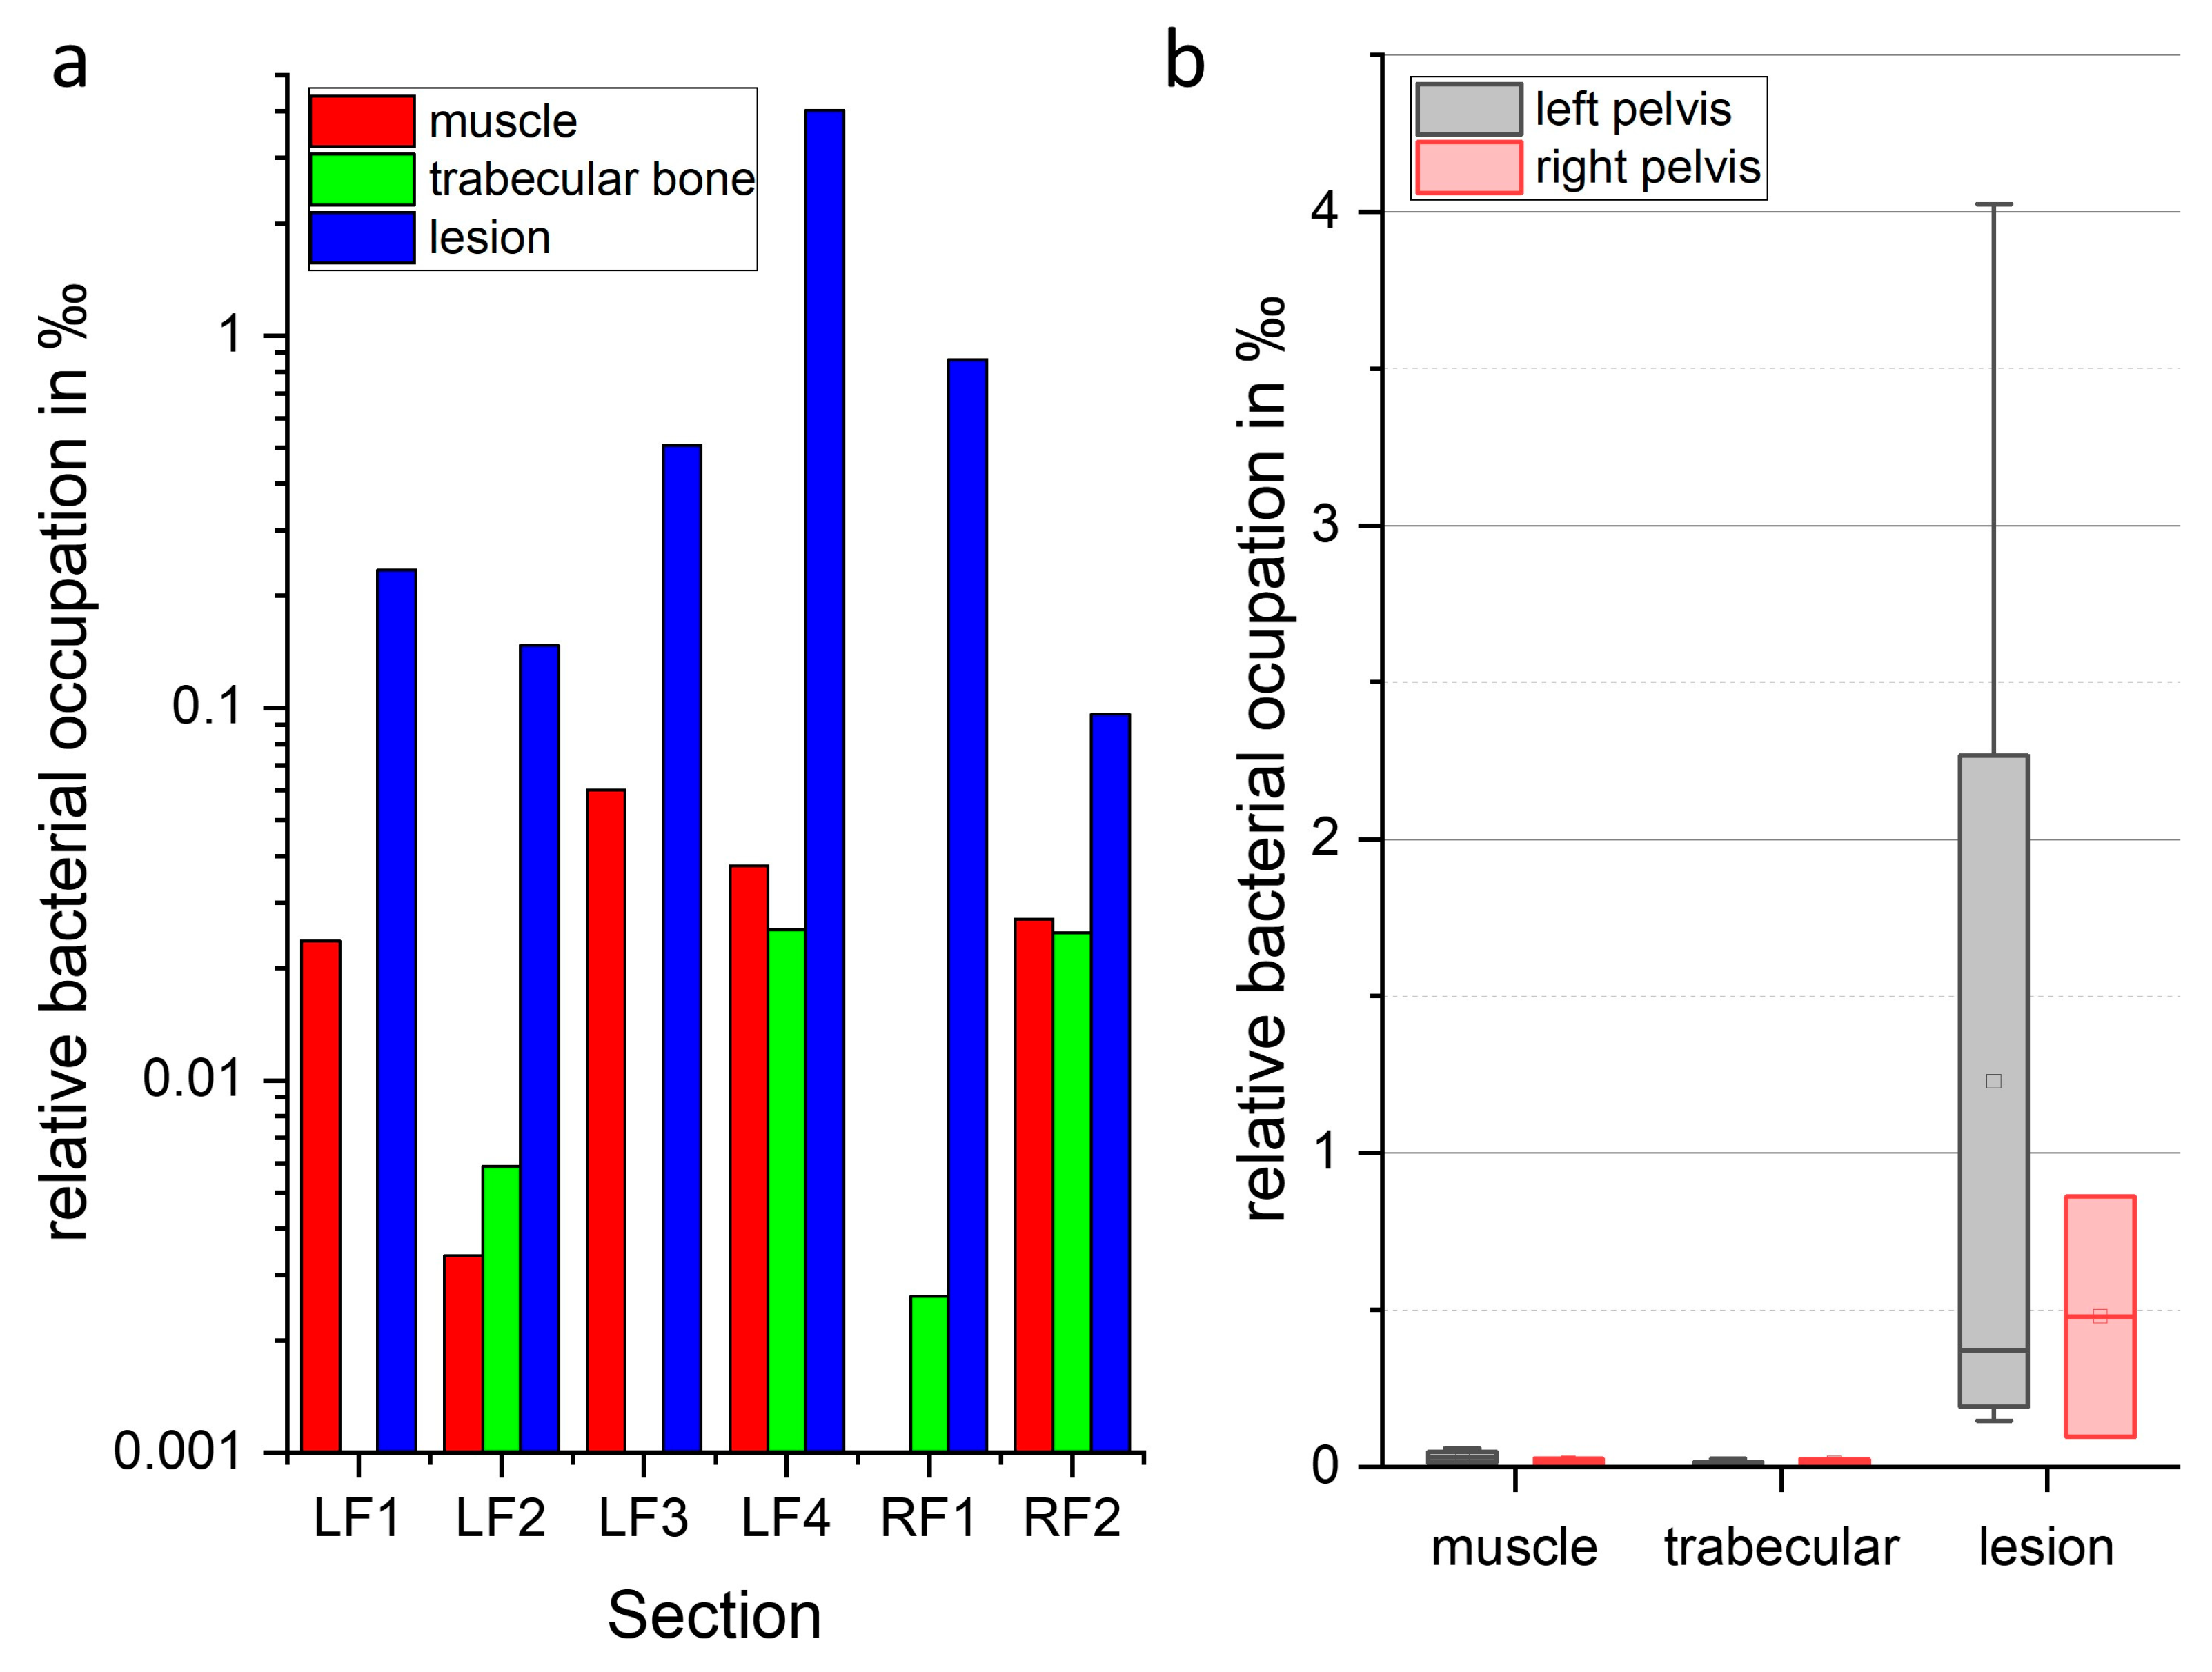
2.5. Localization and Quantification of S. aureus Using Fluorescence Imaging and Gram Staining
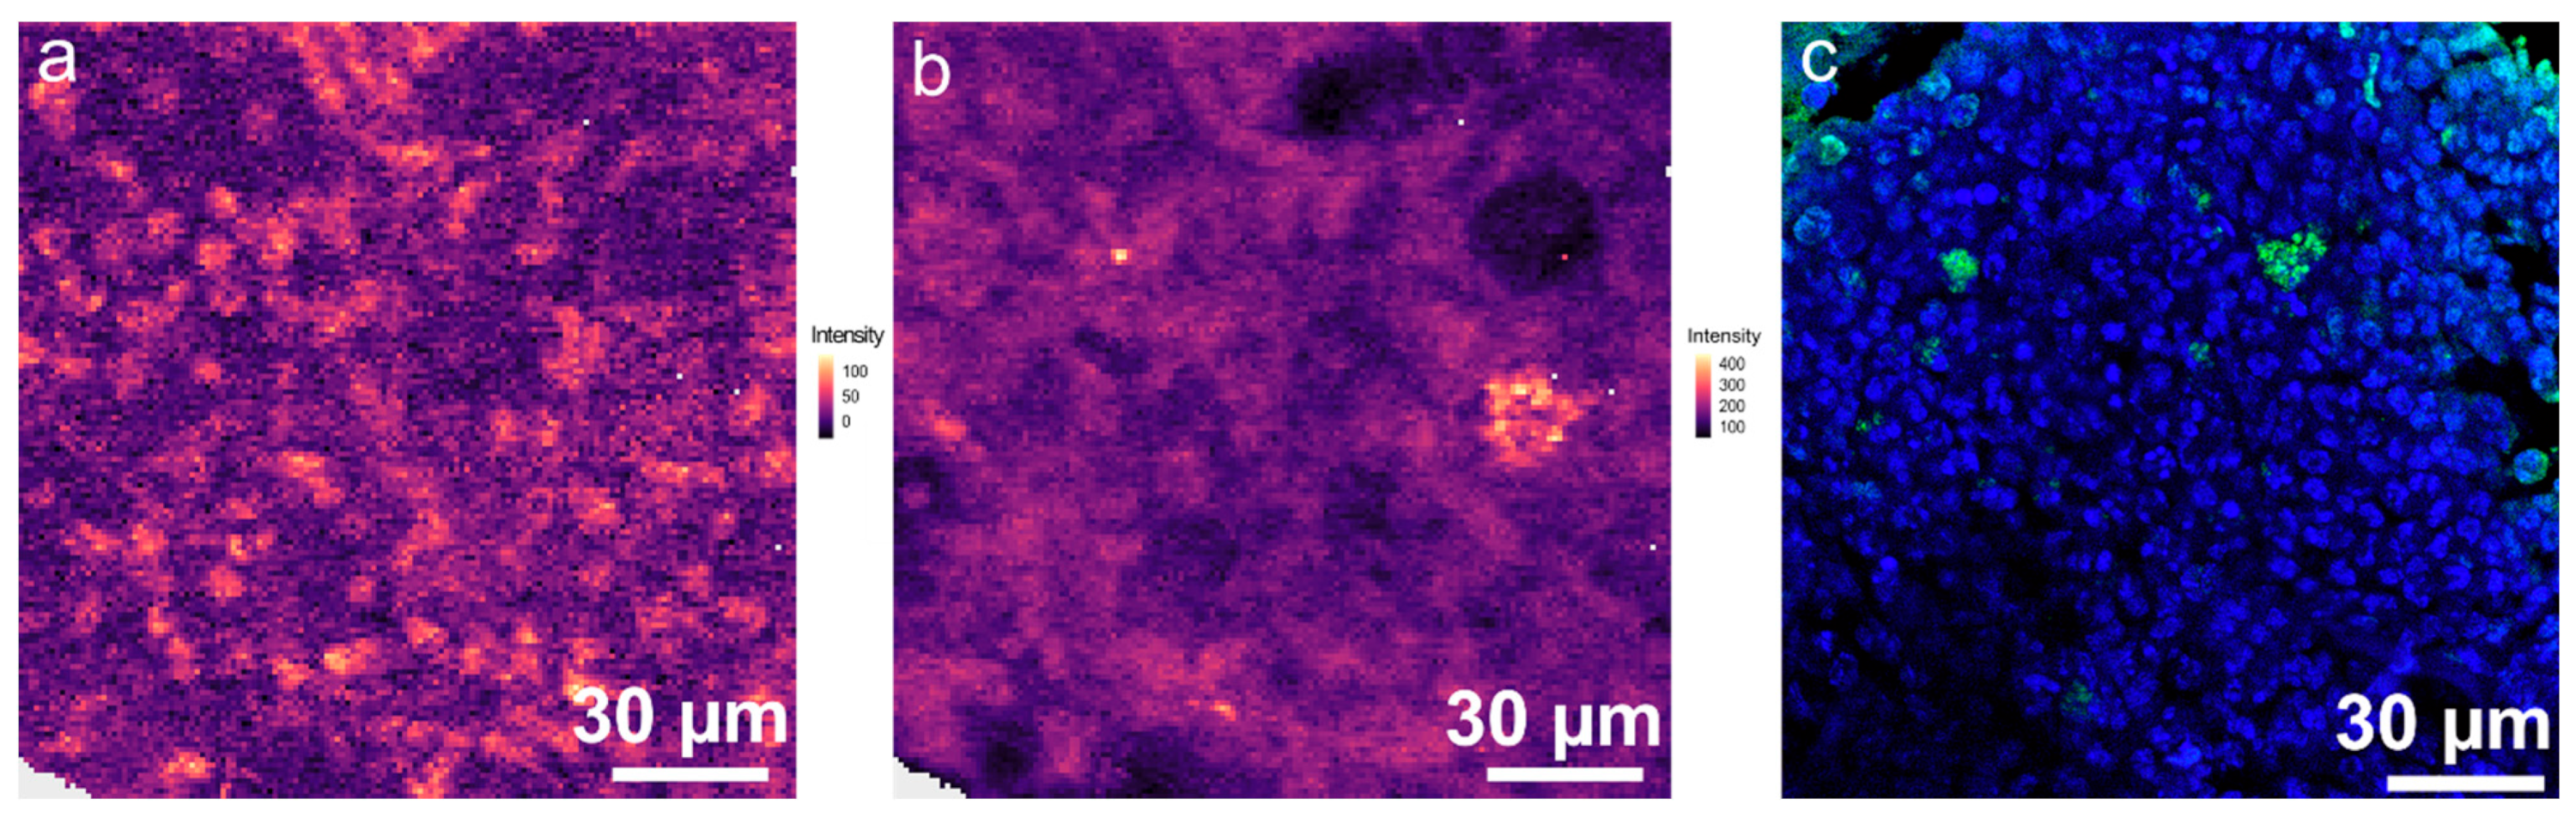
2.6. Biochemical Analysis Using Raman Imaging
3. Materials and Methods
3.1. Hematogenous Osteomyelitis Mouse Model
3.2. Two-Dimensional X-ray Image Acquisition
3.3. Bone Tissue Preparation and Sectioning
3.4. Histological Staining
3.5. Immunofluorescence Labelling/Staining
3.6. Confocal Laser Scanning Microscopy (CLSM), Two-Photon Laser Scanning Microscopy and Second Harmonic Generation (SHG) Microscopy
3.7. Fluorescence Images Analysis
3.8. Raman Spectroscopic Imaging
3.9. Analysis of the Raman Image Scans
3.10. Statistical Analyis
4. Conclusions
Supplementary Materials
Author Contributions
Funding
Institutional Review Board Statement
Informed Consent Statement
Data Availability Statement
Acknowledgments
Conflicts of Interest
References
- Lew, D.P.; Waldvogel, F.A. Osteomyelitis. N. Engl. J. Med. 1997, 336, 999–1007. [Google Scholar] [CrossRef] [PubMed]
- Walter, N.; Baertl, S.; Alt, V.; Rupp, M. What is the burden of osteomyelitis in germany? An analysis of inpatient data from 2008 through 2018. BMC Infect. Dis. 2021, 21, 550. [Google Scholar] [CrossRef] [PubMed]
- Kremers, H.M.; Nwojo, M.E.; Ransom, J.E.; Wood-Wentz, C.M.; Melton, L.J., 3rd; Huddleston, P.M., 3rd. Trends in the epidemiology of osteomyelitis: A population-based study, 1969 to 2009. J. Bone Jt. Surgery. Am. 2015, 97, 837–845. [Google Scholar] [CrossRef] [PubMed] [Green Version]
- Lew, D.P.; Waldvogel, F.A. Osteomyelitis. Lancet 2004, 364, 369–379. [Google Scholar] [CrossRef] [PubMed]
- Schmitt, S.K. Osteomyelitis. Infect. Dis. Clin. N. Am. 2017, 31, 325–338. [Google Scholar] [CrossRef]
- Dudareva, M.; Ferguson, J.; Riley, N.; Stubbs, D.; Atkins, B.; McNally, M. Osteomyelitis of the pelvic bones: A multidisciplinary approach to treatment. J. Bone Jt. Infect. 2017, 2, 184–193. [Google Scholar] [CrossRef] [Green Version]
- Chicco, M.; Singh, P.; Beitverda, Y.; Williams, G.; Hirji, H.; Rao, G.G. Diagnosing pelvic osteomyelitis in patients with pressure ulcers: A systematic review comparing bone histology with alternative diagnostic modalities. J. Bone Jt. Infect. 2020, 6, 21–32. [Google Scholar] [CrossRef]
- Masters, E.A.; Ricciardi, B.F.; Bentley, K.L.d.M.; Moriarty, T.F.; Schwarz, E.M.; Muthukrishnan, G. Skeletal infections: Microbial pathogenesis, immunity and clinical management. Nat. Rev. Microbiol. 2022, 20, 385–400. [Google Scholar] [CrossRef]
- Gimza, B.D.; Cassat, J.E. Mechanisms of antibiotic failure during staphylococcus aureus osteomyelitis. Front. Immunol. 2021, 12, 638085. [Google Scholar] [CrossRef]
- Zoller, S.D.; Hegde, V.; Burke, Z.D.C.; Park, H.Y.; Ishmael, C.R.; Blumstein, G.W.; Sheppard, W.; Hamad, C.; Loftin, A.H.; Johansen, D.O.; et al. Evading the host response: Staphylococcus “hiding” in cortical bone canalicular system causes increased bacterial burden. Bone Res. 2020, 8, 43. [Google Scholar] [CrossRef]
- Masters, E.A.; Muthukrishnan, G.; Ho, L.; Gill, A.L.; de Mesy Bentley, K.L.; Galloway, C.A.; McGrath, J.L.; Awad, H.A.; Gill, S.R.; Schwarz, E.M. Staphylococcus aureus cell wall biosynthesis modulates bone invasion and osteomyelitis pathogenesis. Front. Microbiol. 2021, 12, 723498. [Google Scholar] [CrossRef]
- Urish, K.L.; Cassat, J.E. Staphylococcus aureus osteomyelitis: Bone, bugs, and surgery. Infect. Immun. 2020, 88, e00932-19. [Google Scholar] [CrossRef]
- Kavanagh, N.; Ryan, E.J.; Widaa, A.; Sexton, G.; Fennell, J.; O’Rourke, S.; Cahill, K.C.; Kearney, C.J.; O’Brien, F.J.; Kerrigan, S.W. Staphylococcal osteomyelitis: Disease progression, treatment challenges, and future directions. Clin. Microbiol. Rev. 2018, 31, e00084-17. [Google Scholar] [CrossRef] [Green Version]
- Masters, E.A.; Trombetta, R.P.; de Mesy Bentley, K.L.; Boyce, B.F.; Gill, A.L.; Gill, S.R.; Nishitani, K.; Ishikawa, M.; Morita, Y.; Ito, H.; et al. Evolving concepts in bone infection: Redefining “biofilm”, “acute vs. Chronic osteomyelitis”, “the immune proteome” and “local antibiotic therapy”. Bone Res. 2019, 7, 20. [Google Scholar] [CrossRef] [Green Version]
- Lee, Y.J.; Sadigh, S.; Mankad, K.; Kapse, N.; Rajeswaran, G. The imaging of osteomyelitis. Quant. Imaging Med. Surg. 2016, 6, 184–198. [Google Scholar] [CrossRef] [Green Version]
- Hatzenbuehler, J.; Pulling, T.J. Diagnosis and management of osteomyelitis. Am. Fam. Physician 2011, 84, 1027–1033. [Google Scholar]
- Roux, K.M.; Cobb, L.H.; Seitz, M.A.; Priddy, L.B. Innovations in osteomyelitis research: A review of animal models. Anim. Model. Exp. Med. 2021, 4, 59–70. [Google Scholar] [CrossRef]
- Meroni, G.; Tsikopoulos, A.; Tsikopoulos, K.; Allemanno, F.; Martino, P.A.; Soares Filipe, J.F. A journey into animal models of human osteomyelitis: A review. Microorganisms 2022, 10, 1135. [Google Scholar] [CrossRef]
- Tiemann, A.; Hofmann, G.O.; Krukemeyer, M.G.; Krenn, V.; Langwald, S. Histopathological osteomyelitis evaluation score (hoes)—An innovative approach to histopathological diagnostics and scoring of osteomyelitis. GMS Interdiscip. Plast. Reconstr. Surg. DGPW 2014, 3, Doc08. [Google Scholar]
- de Mesy Bentley, K.L.; Trombetta, R.; Nishitani, K.; Bello-Irizarry, S.N.; Ninomiya, M.; Zhang, L.; Chung, H.L.; McGrath, J.L.; Daiss, J.L.; Awad, H.A.; et al. Evidence of staphylococcus aureus deformation, proliferation, and migration in canaliculi of live cortical bone in murine models of osteomyelitis. J. Bone Miner. Res. 2017, 32, 985–990. [Google Scholar] [CrossRef] [Green Version]
- de Mesy Bentley, K.L.; Galloway, C.A.; Muthukrishnan, G.; Echternacht, S.R.; Masters, E.A.; Zeiter, S.; Schwarz, E.M.; Leckenby, J.I. Emerging electron microscopy and 3d methodologies to interrogate staphylococcus aureus osteomyelitis in murine models. J. Orthop. Res. 2021, 39, 376–388. [Google Scholar] [CrossRef] [PubMed]
- Schmitz, N.; Laverty, S.; Kraus, V.B.; Aigner, T. Basic methods in histopathology of joint tissues. Osteoarthr. Cartil. 2010, 18, S113–S116. [Google Scholar] [CrossRef] [PubMed] [Green Version]
- Elliott, A.D. Confocal microscopy: Principles and modern practices. Curr. Protoc. Cytom. 2020, 92, e68. [Google Scholar] [CrossRef] [PubMed]
- Jermyn, M.; Mok, K.; Mercier, J.; Desroches, J.; Pichette, J.; Saint-Arnaud, K.; Bernstein, L.; Guiot, M.C.; Petrecca, K.; Leblond, F. Intraoperative brain cancer detection with raman spectroscopy in humans. Sci. Transl. Med. 2015, 7, 274ra219. [Google Scholar] [CrossRef]
- Desroches, J.; Jermyn, M.; Pinto, M.; Picot, F.; Tremblay, M.-A.; Obaid, S.; Marple, E.; Urmey, K.; Trudel, D.; Soulez, G.; et al. A new method using raman spectroscopy for in vivo targeted brain cancer tissue biopsy. Sci. Rep. 2018, 8, 1792. [Google Scholar] [CrossRef] [Green Version]
- Morris, M.D.; Mandair, G.S. Raman assessment of bone quality. Clin. Orthop. Relat. Res. 2011, 469, 2160–2169. [Google Scholar] [CrossRef] [Green Version]
- Paschalis, E.P.; Gamsjaeger, S.; Klaushofer, K. Vibrational spectroscopic techniques to assess bone quality. Osteoporos. Int. 2017, 28, 2275–2291. [Google Scholar] [CrossRef]
- Chappard, D.; Baslé, M.F.; Legrand, E.; Audran, M. New laboratory tools in the assessment of bone quality. Osteoporos. Int. 2011, 22, 2225–2240. [Google Scholar] [CrossRef] [Green Version]
- Alunni Cardinali, M.; Morresi, A.; Fioretto, D.; Vivarelli, L.; Dallari, D.; Govoni, M. Brillouin and raman micro-spectroscopy: A tool for micro-mechanical and structural characterization of cortical and trabecular bone tissues. Materials 2021, 14, 6869. [Google Scholar] [CrossRef]
- Khalid, M.; Bora, T.; Ghaithi, A.A.; Thukral, S.; Dutta, J. Raman spectroscopy detects changes in bone mineral quality and collagen cross-linkage in staphylococcus infected human bone. Sci. Rep. 2018, 8, 9417. [Google Scholar] [CrossRef]
- Lee, Y.-R.; Findlay, D.M.; Muratovic, D.; Gill, T.K.; Kuliwaba, J.S. Raman microspectroscopy demonstrates reduced mineralization of subchondral bone marrow lesions in knee osteoarthritis patients. Bone Rep. 2020, 12, 100269. [Google Scholar] [CrossRef]
- Wurm, A.; Kühn, J.; Kugel, K.; Putzer, D.; Arora, R.; Coraça-Huber, D.C.; Zelger, P.; Badzoka, J.; Kappacher, C.; Huck, C.W.; et al. Raman microscopic spectroscopy as a diagnostic tool to detect staphylococcus epidermidis in bone grafts. Spectrochim. Acta Part A Mol. Biomol. Spectrosc. 2022, 280, 121570. [Google Scholar] [CrossRef]
- Castanheira, F.V.S.; Kubes, P. Neutrophils and nets in modulating acute and chronic inflammation. Blood 2019, 133, 2178–2185. [Google Scholar] [CrossRef]
- Brinkmann, V.; Zychlinsky, A. Beneficial suicide: Why neutrophils die to make nets. Nat. Rev. Microbiol. 2007, 5, 577–582. [Google Scholar] [CrossRef]
- Maruyama, M.; Rhee, C.; Utsunomiya, T.; Zhang, N.; Ueno, M.; Yao, Z.; Goodman, S.B. Modulation of the inflammatory response and bone healing. Front. Endocrinol. 2020, 11, 386. [Google Scholar] [CrossRef]
- Hofstee, M.I.; Riool, M.; Gieling, F.; Stenger, V.; Constant, C.; Nehrbass, D.; Zeiter, S.; Richards, R.G.; Zaat, S.A.; Moriarty, T.F. A murine staphylococcus aureus fracture-related infection model characterised by fracture non-union, staphylococcal abscess communities and myeloid-derived suppressor cells. Eur. Cell. Mater. 2021, 41, 774–792. [Google Scholar] [CrossRef]
- Cheng, A.G.; DeDent, A.C.; Schneewind, O.; Missiakas, D. A play in four acts: Staphylococcus aureus abscess formation. Trends Microbiol. 2011, 19, 225–232. [Google Scholar] [CrossRef] [Green Version]
- Cheng, A.G.; Kim, H.K.; Burts, M.L.; Krausz, T.; Schneewind, O.; Missiakas, D.M. Genetic requirements for staphylococcus aureus abscess formation and persistence in host tissues. FASEB J. 2009, 23, 3393–3404. [Google Scholar] [CrossRef] [Green Version]
- Tuchscherr, L.; Pöllath, C.; Siegmund, A.; Deinhardt-Emmer, S.; Hoerr, V.; Svensson, C.M.; Thilo Figge, M.; Monecke, S.; Löffler, B. Clinical S. aureus isolates vary in their virulence to promote adaptation to the host. Toxins 2019, 11, 135. [Google Scholar] [CrossRef] [Green Version]
- Ebert, C.; Tuchscherr, L.; Unger, N.; Pöllath, C.; Gladigau, F.; Popp, J.; Löffler, B.; Neugebauer, U. Correlation of crystal violet biofilm test results of staphylococcus aureus clinical isolates with raman spectroscopic read-out. J. Raman Spectrosc. 2021, 52, 2660–2670. [Google Scholar] [CrossRef]
- Brandt, S.L.; Putnam, N.E.; Cassat, J.E.; Serezani, C.H. Innate immunity to staphylococcus aureus: Evolving paradigms in soft tissue and invasive infections. J. Immunol. 2018, 200, 3871–3880. [Google Scholar] [CrossRef] [PubMed] [Green Version]
- Neugebauer, U.; Schmid, U.; Baumann, K.; Ziebuhr, W.; Kozitskaya, S.; Deckert, V.; Schmitt, M.; Popp, J. Towards a detailed understanding of bacterial metabolism--spectroscopic characterization of staphylococcus epidermidis. ChemPhysChem A Eur. J. Chem. Phys. Phys. Chem. 2007, 8, 124–137. [Google Scholar] [CrossRef] [PubMed]
- Tratwal, J.; Falgayrac, G.; During, A.; Bertheaume, N.; Bataclan, C.; Tavakol, D.N.; Campos, V.; Duponchel, L.; Daley, G.Q.; Penel, G.; et al. Raman microspectroscopy reveals unsaturation heterogeneity at the lipid droplet level and validates an in vitro model of bone marrow adipocyte subtypes. Front. Endocrinol. 2022, 13, 1001210. [Google Scholar] [CrossRef] [PubMed]
- Naumann, M.; Arend, N.; Guliev, R.R.; Kretzer, C.; Rubio, I.; Werz, O.; Neugebauer, U. Label-free characterization of macrophage polarization using raman spectroscopy. Int. J. Mol. Sci. 2023, 24, 824. [Google Scholar] [CrossRef]
- Horst, S.A.; Hoerr, V.; Beineke, A.; Kreis, C.; Tuchscherr, L.; Kalinka, J.; Lehne, S.; Schleicher, I.; Kohler, G.; Fuchs, T.; et al. A novel mouse model of staphylococcus aureus chronic osteomyelitis that closely mimics the human infection: An integrated view of disease pathogenesis. Am. J. Pathol. 2012, 181, 1206–1214. [Google Scholar] [CrossRef] [PubMed]
- Tuchscherr, L.; Geraci, J.; Loffler, B. Staphylococcus aureus regulator sigma b is important to develop chronic infections in hematogenous murine osteomyelitis model. Pathogens 2017, 6, 31. [Google Scholar] [CrossRef] [Green Version]
- Van de Vyver, H.; Bovenkamp, P.R.; Hoerr, V.; Schwegmann, K.; Tuchscherr, L.; Niemann, S.; Kursawe, L.; Grosse, C.; Moter, A.; Hansen, U.; et al. A novel mouse model of staphylococcus aureus vascular graft infection: Noninvasive imaging of biofilm development in vivo. Am. J. Pathol. 2017, 187, 268–279. [Google Scholar] [CrossRef] [Green Version]
- Cicchi, R.; Vogler, N.; Kapsokalyvas, D.; Dietzek, B.; Popp, J.; Pavone, F.S. From molecular structure to tissue architecture: Collagen organization probed by shg microscopy. J. Biophotonics 2013, 6, 129–142. [Google Scholar] [CrossRef]
- Schindelin, J.; Arganda-Carreras, I.; Frise, E.; Kaynig, V.; Longair, M.; Pietzsch, T.; Preibisch, S.; Rueden, C.; Saalfeld, S.; Schmid, B.; et al. Fiji: An open-source platform for biological-image analysis. Nat. Methods 2012, 9, 676–682. [Google Scholar] [CrossRef] [Green Version]
- Preibisch, S.; Saalfeld, S.; Tomancak, P. Globally optimal stitching of tiled 3d microscopic image acquisitions. Bioinformatics 2009, 25, 1463–1465. [Google Scholar] [CrossRef] [Green Version]
- Mandal, S.; Silva, L.B.; Tannert, A.; Neugebauer, U. Findaureus: An open-source application for locating staphylococcus aureus in fluorescence-labeled infected bone tissue slices. publication in preparation.
- Wickham, H. Ggplot2: Elegant Graphics for Data Analysis; Springer: New York, NY, USA, 2016. [Google Scholar]
- Beleites, C.; Sergo, V. Hyperspec: A Package to Handle Hyperspectral Data Sets in r, 0.99-20201127. 2020. Available online: http://hyperspec.r-forge.r-project.org (accessed on 30 May 2023).
- Wickham, H.; Francois, R.; Henry, L.; Müller, K. Dyplr: A Grammar of Data Manipulation. R Package Version 1.0.10. 2022. Available online: https://CRAN.R-project.org/package=dplyr (accessed on 30 May 2023).
- Bengtsson, H. Matrixstats: Functions That Apply to Rows and Columns of Matrices (And to Vectors): R Package Version 0.63.0, R Package Version 0.63.0. 2022. Available online: https://CRAN.R-project.org/package=matrixStats (accessed on 30 May 2023).
- Belov, A.; McManus, C.; Beleites, C.; Hanson, B.; Fuller, S. Unmixr: Hyperspectral Unmixing Methods, R Package Version 0.2.339. 2016. Available online: https://gitlab.com/chemometrics/unmixR (accessed on 30 May 2023).
- Ryabchykov, O.; Bocklitz, T.; Ramoji, A.; Neugebauer, U.; Foerster, M.; Kroegel, C.; Bauer, M.; Kiehntopf, M.; Popp, J. Automatization of spike correction in raman spectra of biological samples. Chemom. Intell. Lab. Syst. 2016, 155, 1–6. [Google Scholar] [CrossRef]
- Ryan, C.G.; Clayton, E.; Griffin, W.L.; Sie, S.H.; Cousens, D.R. Snip, a statistics-sensitive background treatment for the quantitative analysis of pixe spectra in geoscience applications. Nucl. Instrum. Methods Phys. Res. Sect. B Beam Interact. Mater. At. 1988, 34, 396–402. [Google Scholar] [CrossRef]
- Winter, M. N-findr: An Algorithm for fast Autonomous Spectral end-Member Determination in Hyperspectral Data. In Proceedings of the SPIE’s International Symposium on Optical Science, Engineering, and Instrumentation, Denver, CO, USA, 18–23 July 1999; Volume 3753. [Google Scholar]


Disclaimer/Publisher’s Note: The statements, opinions and data contained in all publications are solely those of the individual author(s) and contributor(s) and not of MDPI and/or the editor(s). MDPI and/or the editor(s) disclaim responsibility for any injury to people or property resulting from any ideas, methods, instructions or products referred to in the content. |
© 2023 by the authors. Licensee MDPI, Basel, Switzerland. This article is an open access article distributed under the terms and conditions of the Creative Commons Attribution (CC BY) license (https://creativecommons.org/licenses/by/4.0/).
Share and Cite
Mandal, S.; Tannert, A.; Ebert, C.; Guliev, R.R.; Ozegowski, Y.; Carvalho, L.; Wildemann, B.; Eiserloh, S.; Coldewey, S.M.; Löffler, B.; et al. Insights into S. aureus-Induced Bone Deformation in a Mouse Model of Chronic Osteomyelitis Using Fluorescence and Raman Imaging. Int. J. Mol. Sci. 2023, 24, 9762. https://0-doi-org.brum.beds.ac.uk/10.3390/ijms24119762
Mandal S, Tannert A, Ebert C, Guliev RR, Ozegowski Y, Carvalho L, Wildemann B, Eiserloh S, Coldewey SM, Löffler B, et al. Insights into S. aureus-Induced Bone Deformation in a Mouse Model of Chronic Osteomyelitis Using Fluorescence and Raman Imaging. International Journal of Molecular Sciences. 2023; 24(11):9762. https://0-doi-org.brum.beds.ac.uk/10.3390/ijms24119762
Chicago/Turabian StyleMandal, Shibarjun, Astrid Tannert, Christina Ebert, Rustam R. Guliev, Yvonne Ozegowski, Lina Carvalho, Britt Wildemann, Simone Eiserloh, Sina M. Coldewey, Bettina Löffler, and et al. 2023. "Insights into S. aureus-Induced Bone Deformation in a Mouse Model of Chronic Osteomyelitis Using Fluorescence and Raman Imaging" International Journal of Molecular Sciences 24, no. 11: 9762. https://0-doi-org.brum.beds.ac.uk/10.3390/ijms24119762