
Characterisation of GFAP-Expressing Glial Cells in the Dorsal Root Ganglion after Spared Nerve Injury
 , , and
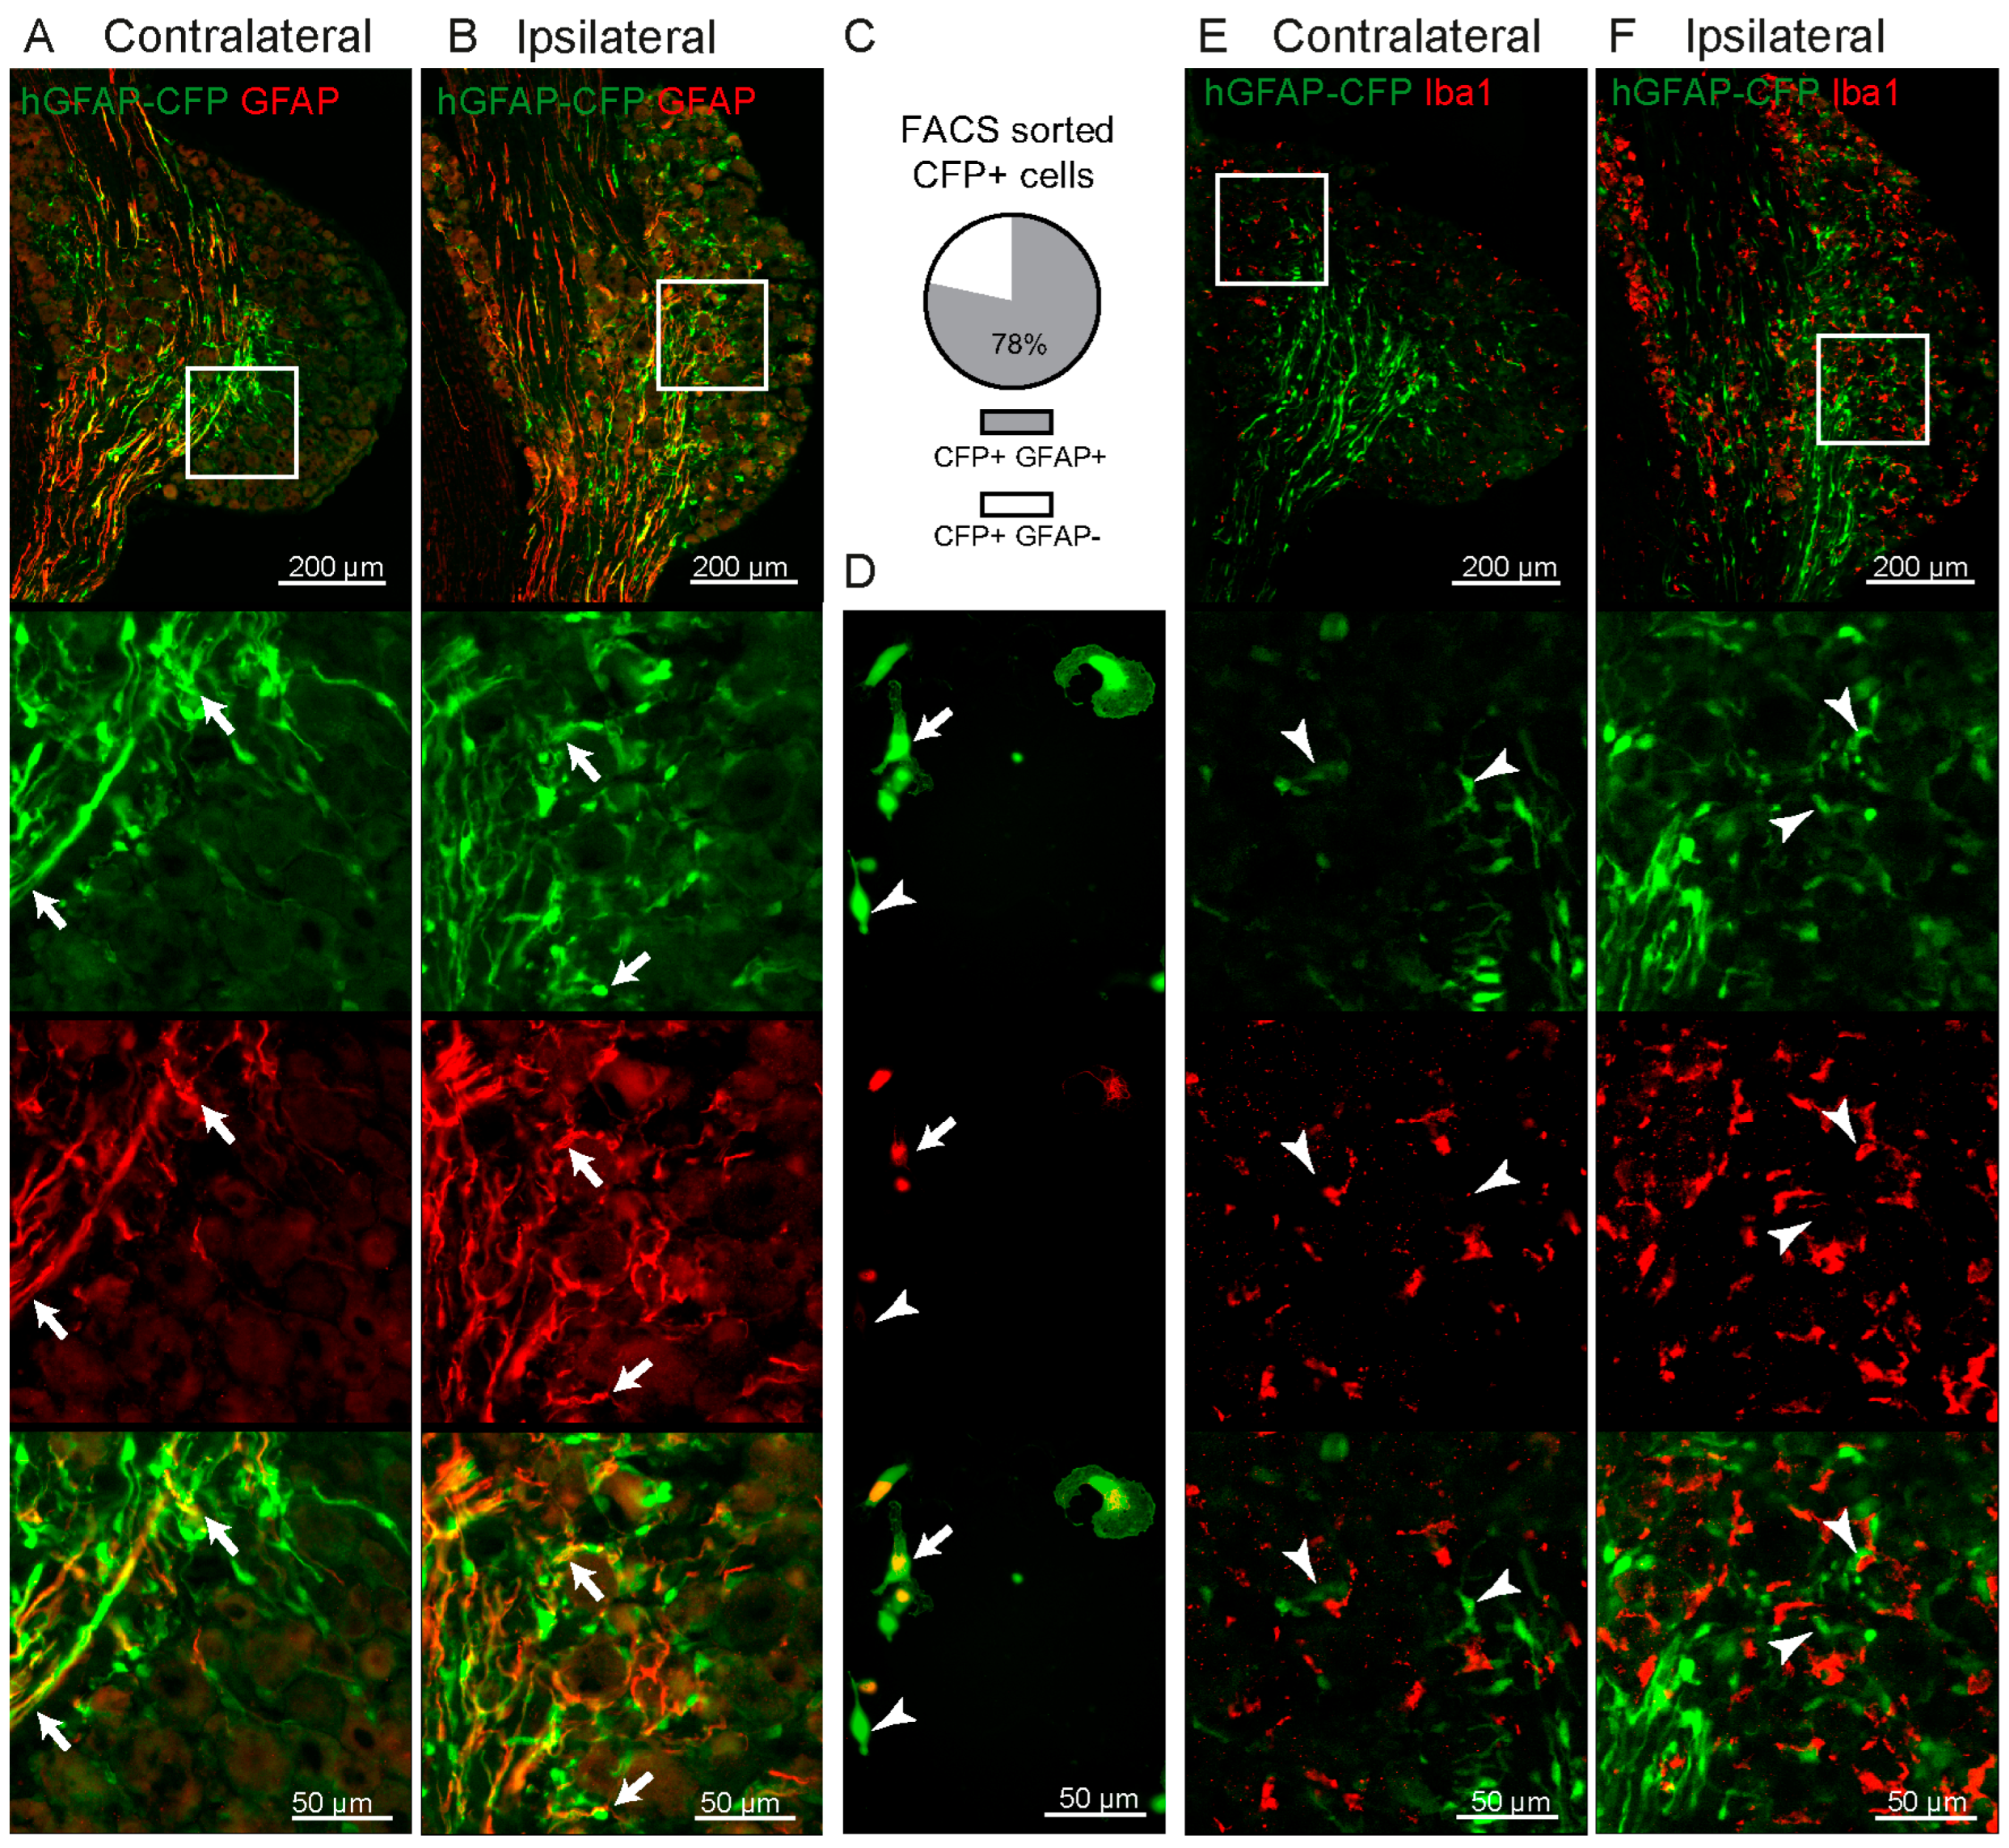
Abstract
:1. Introduction
2. Results
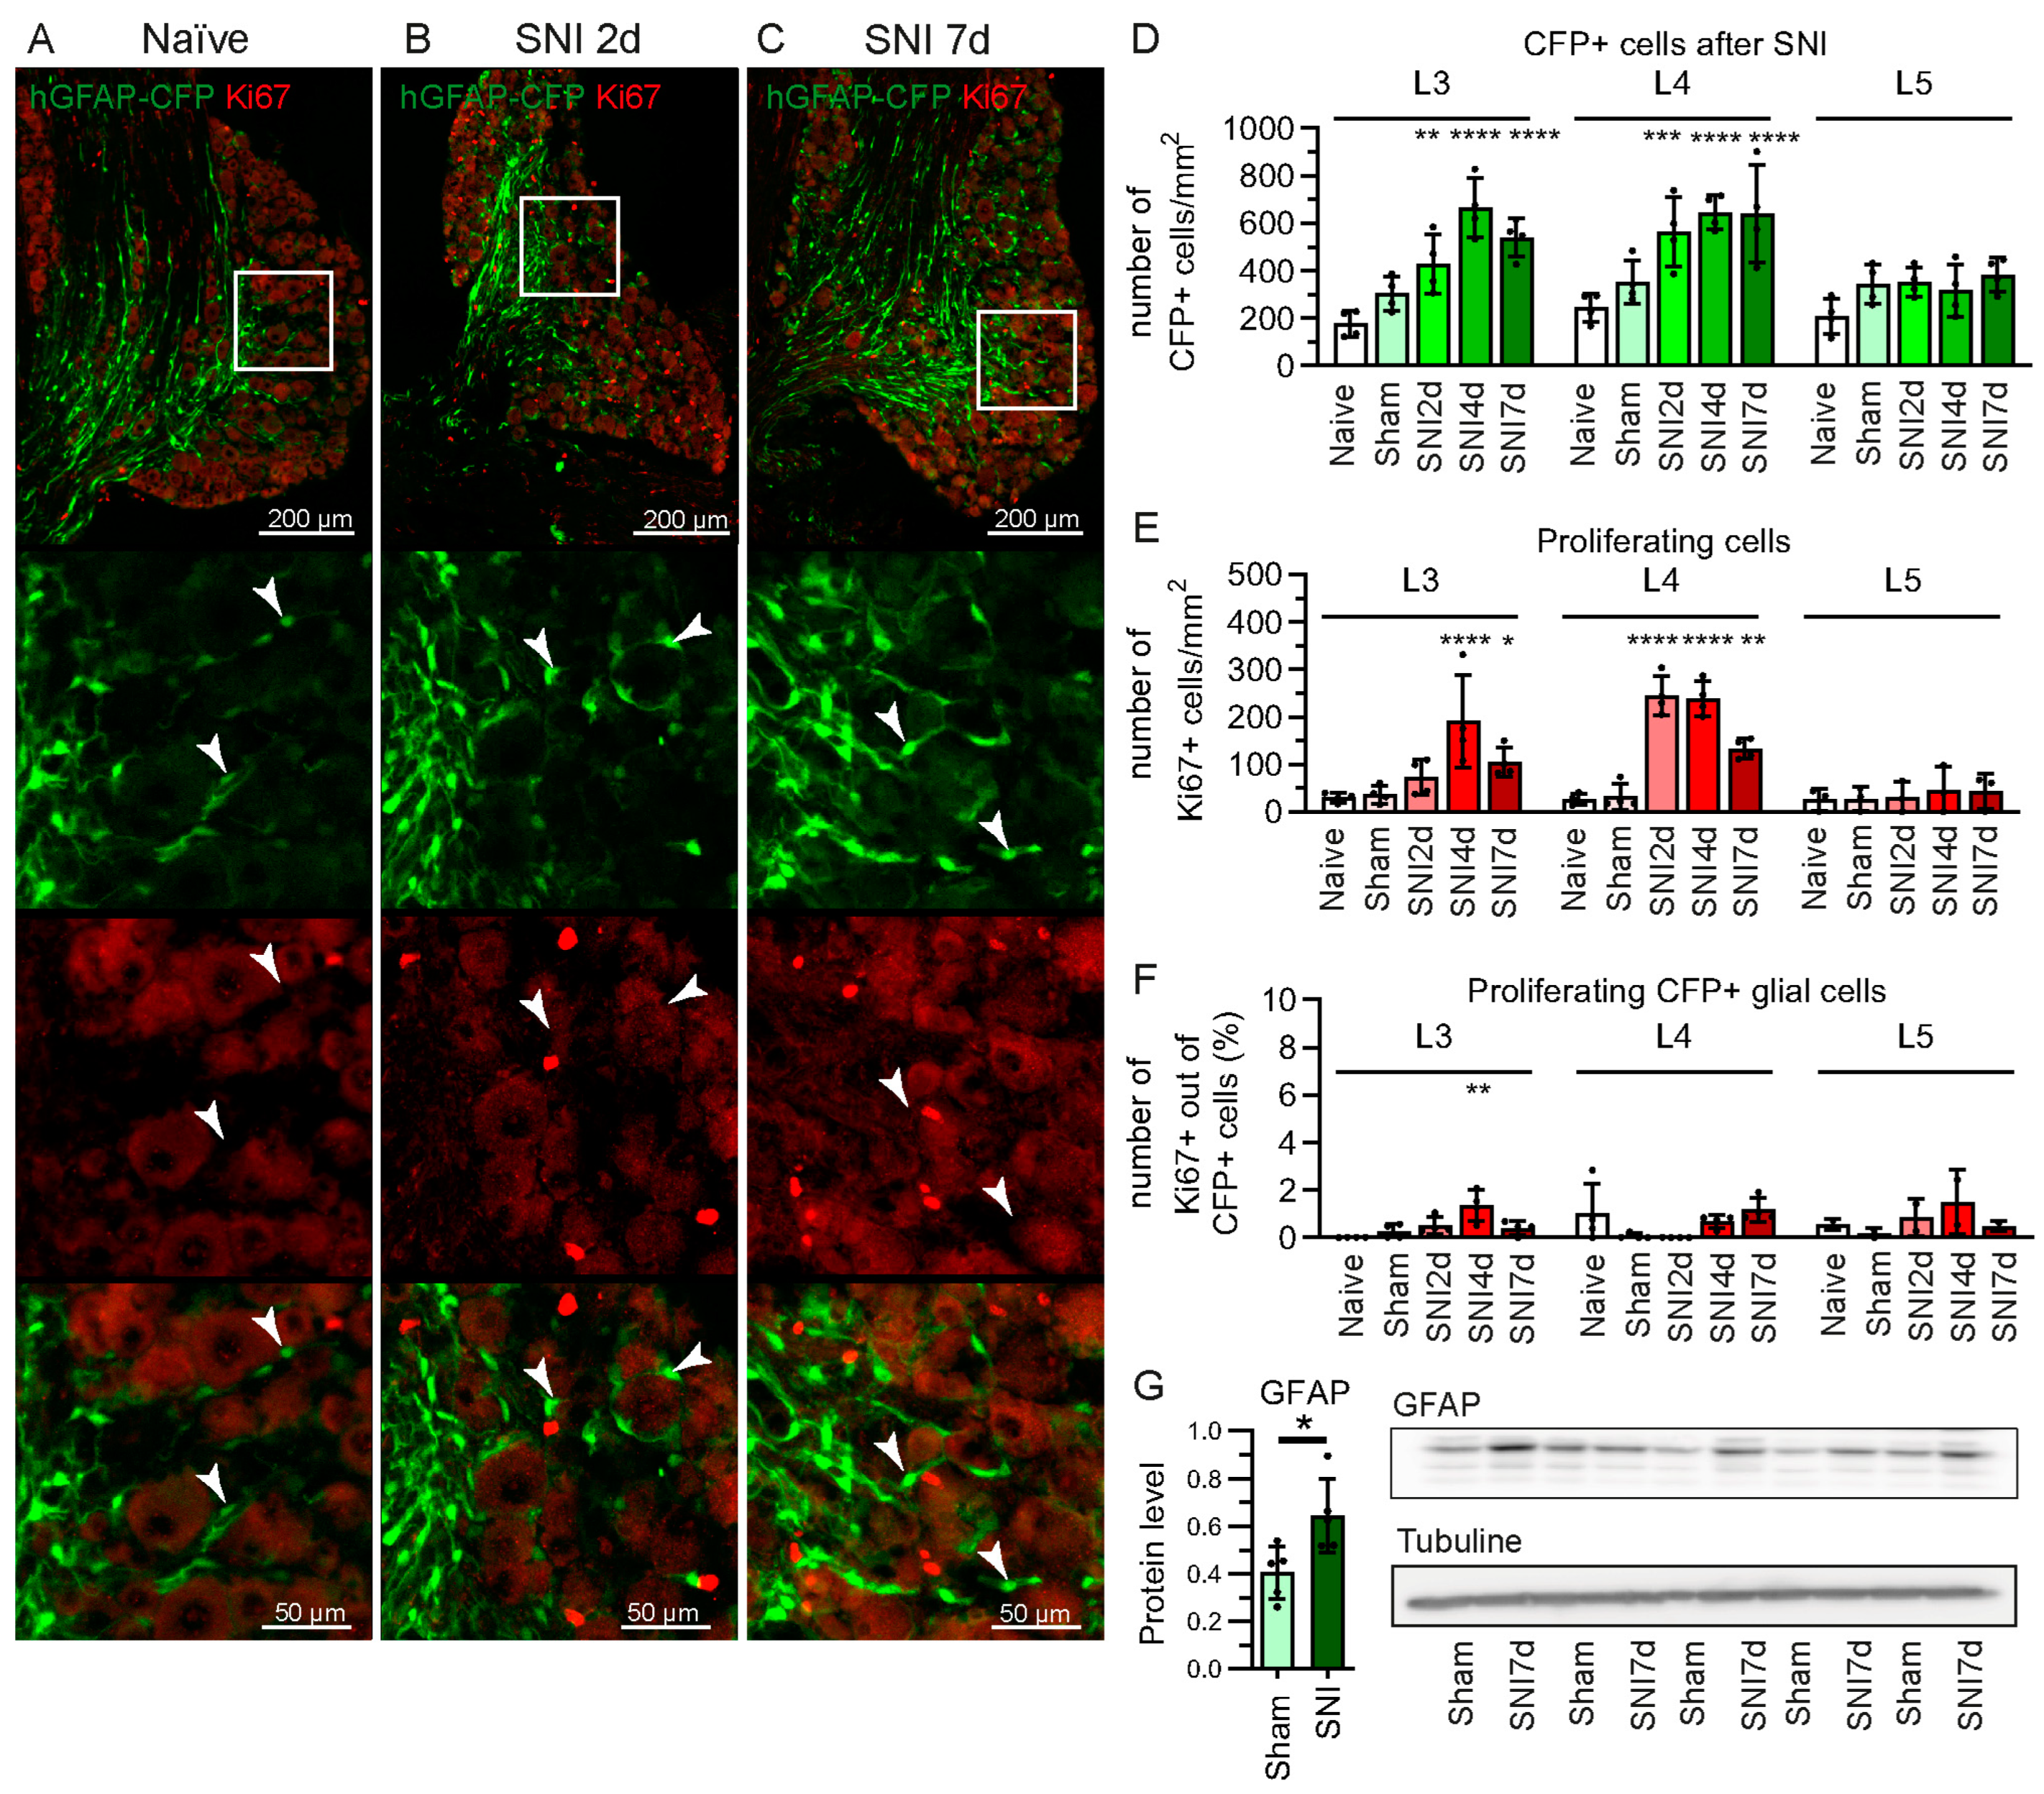
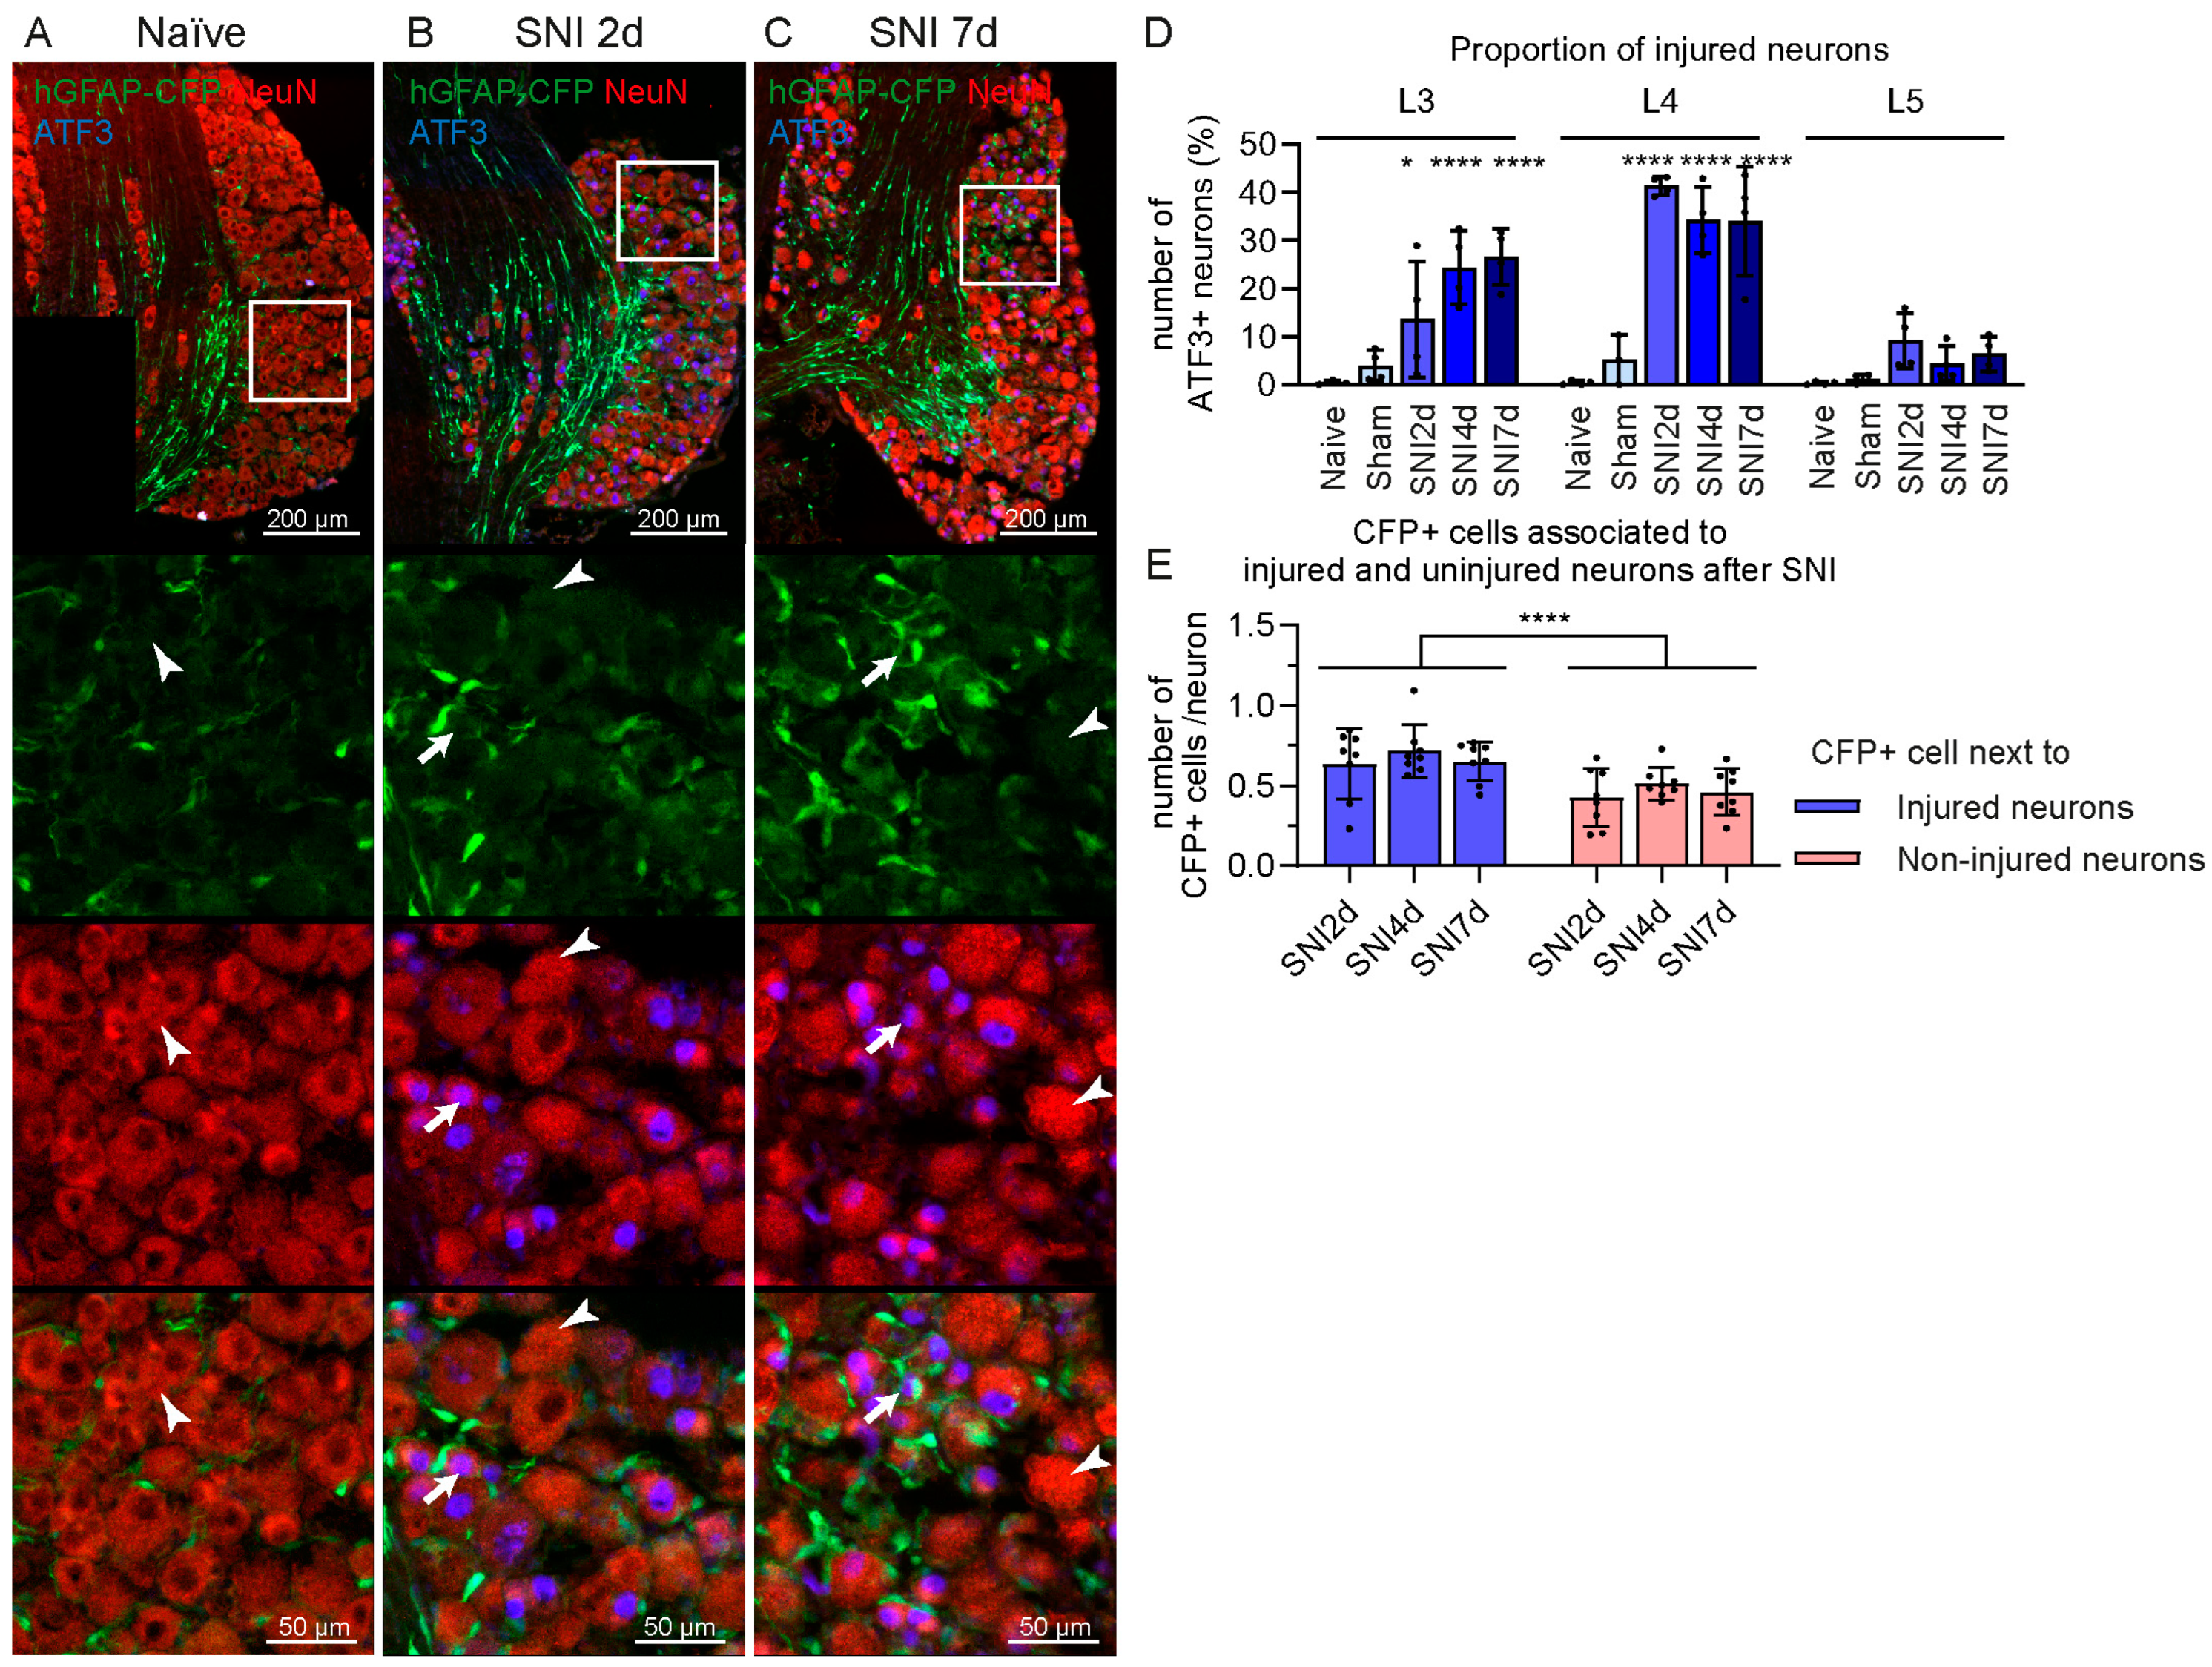
2.1. Increase in GFAP-Expressing Cells in the DRG after Spared Nerve Injury (SNI) without Proliferation
2.2. Some GFAP+ Glial Cells Are a Subpopulation of Satellite Glial Cells
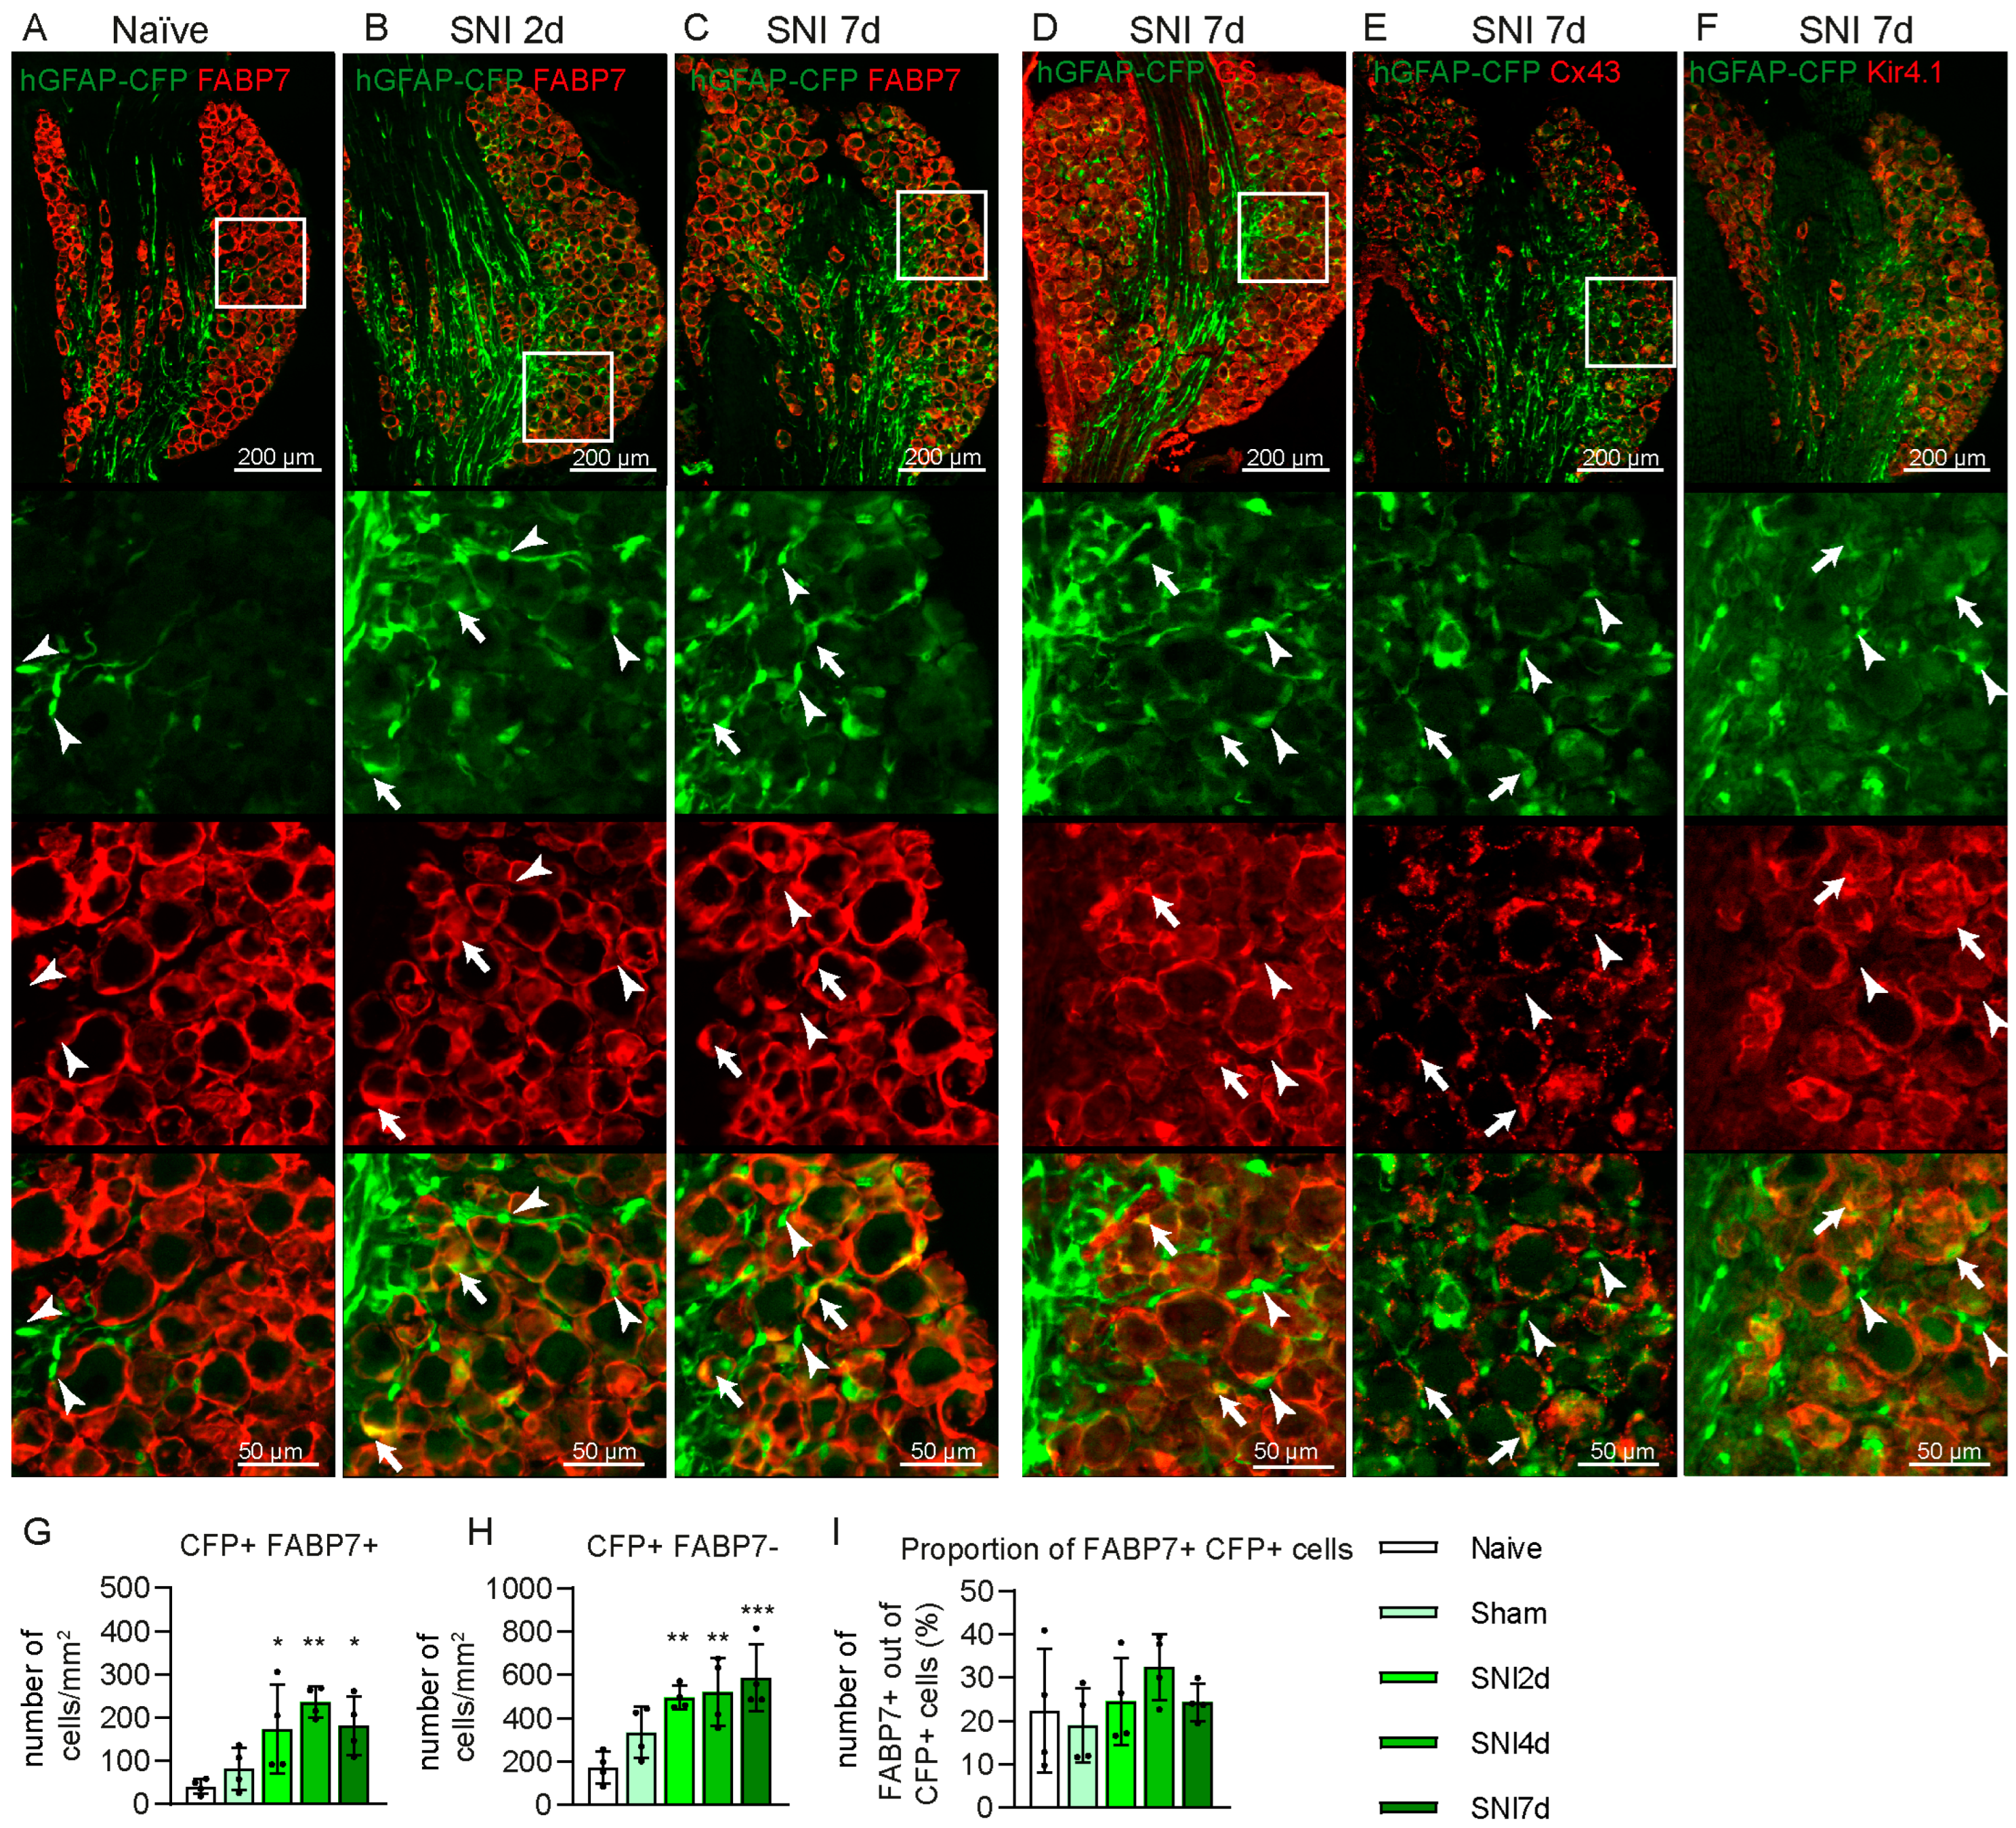
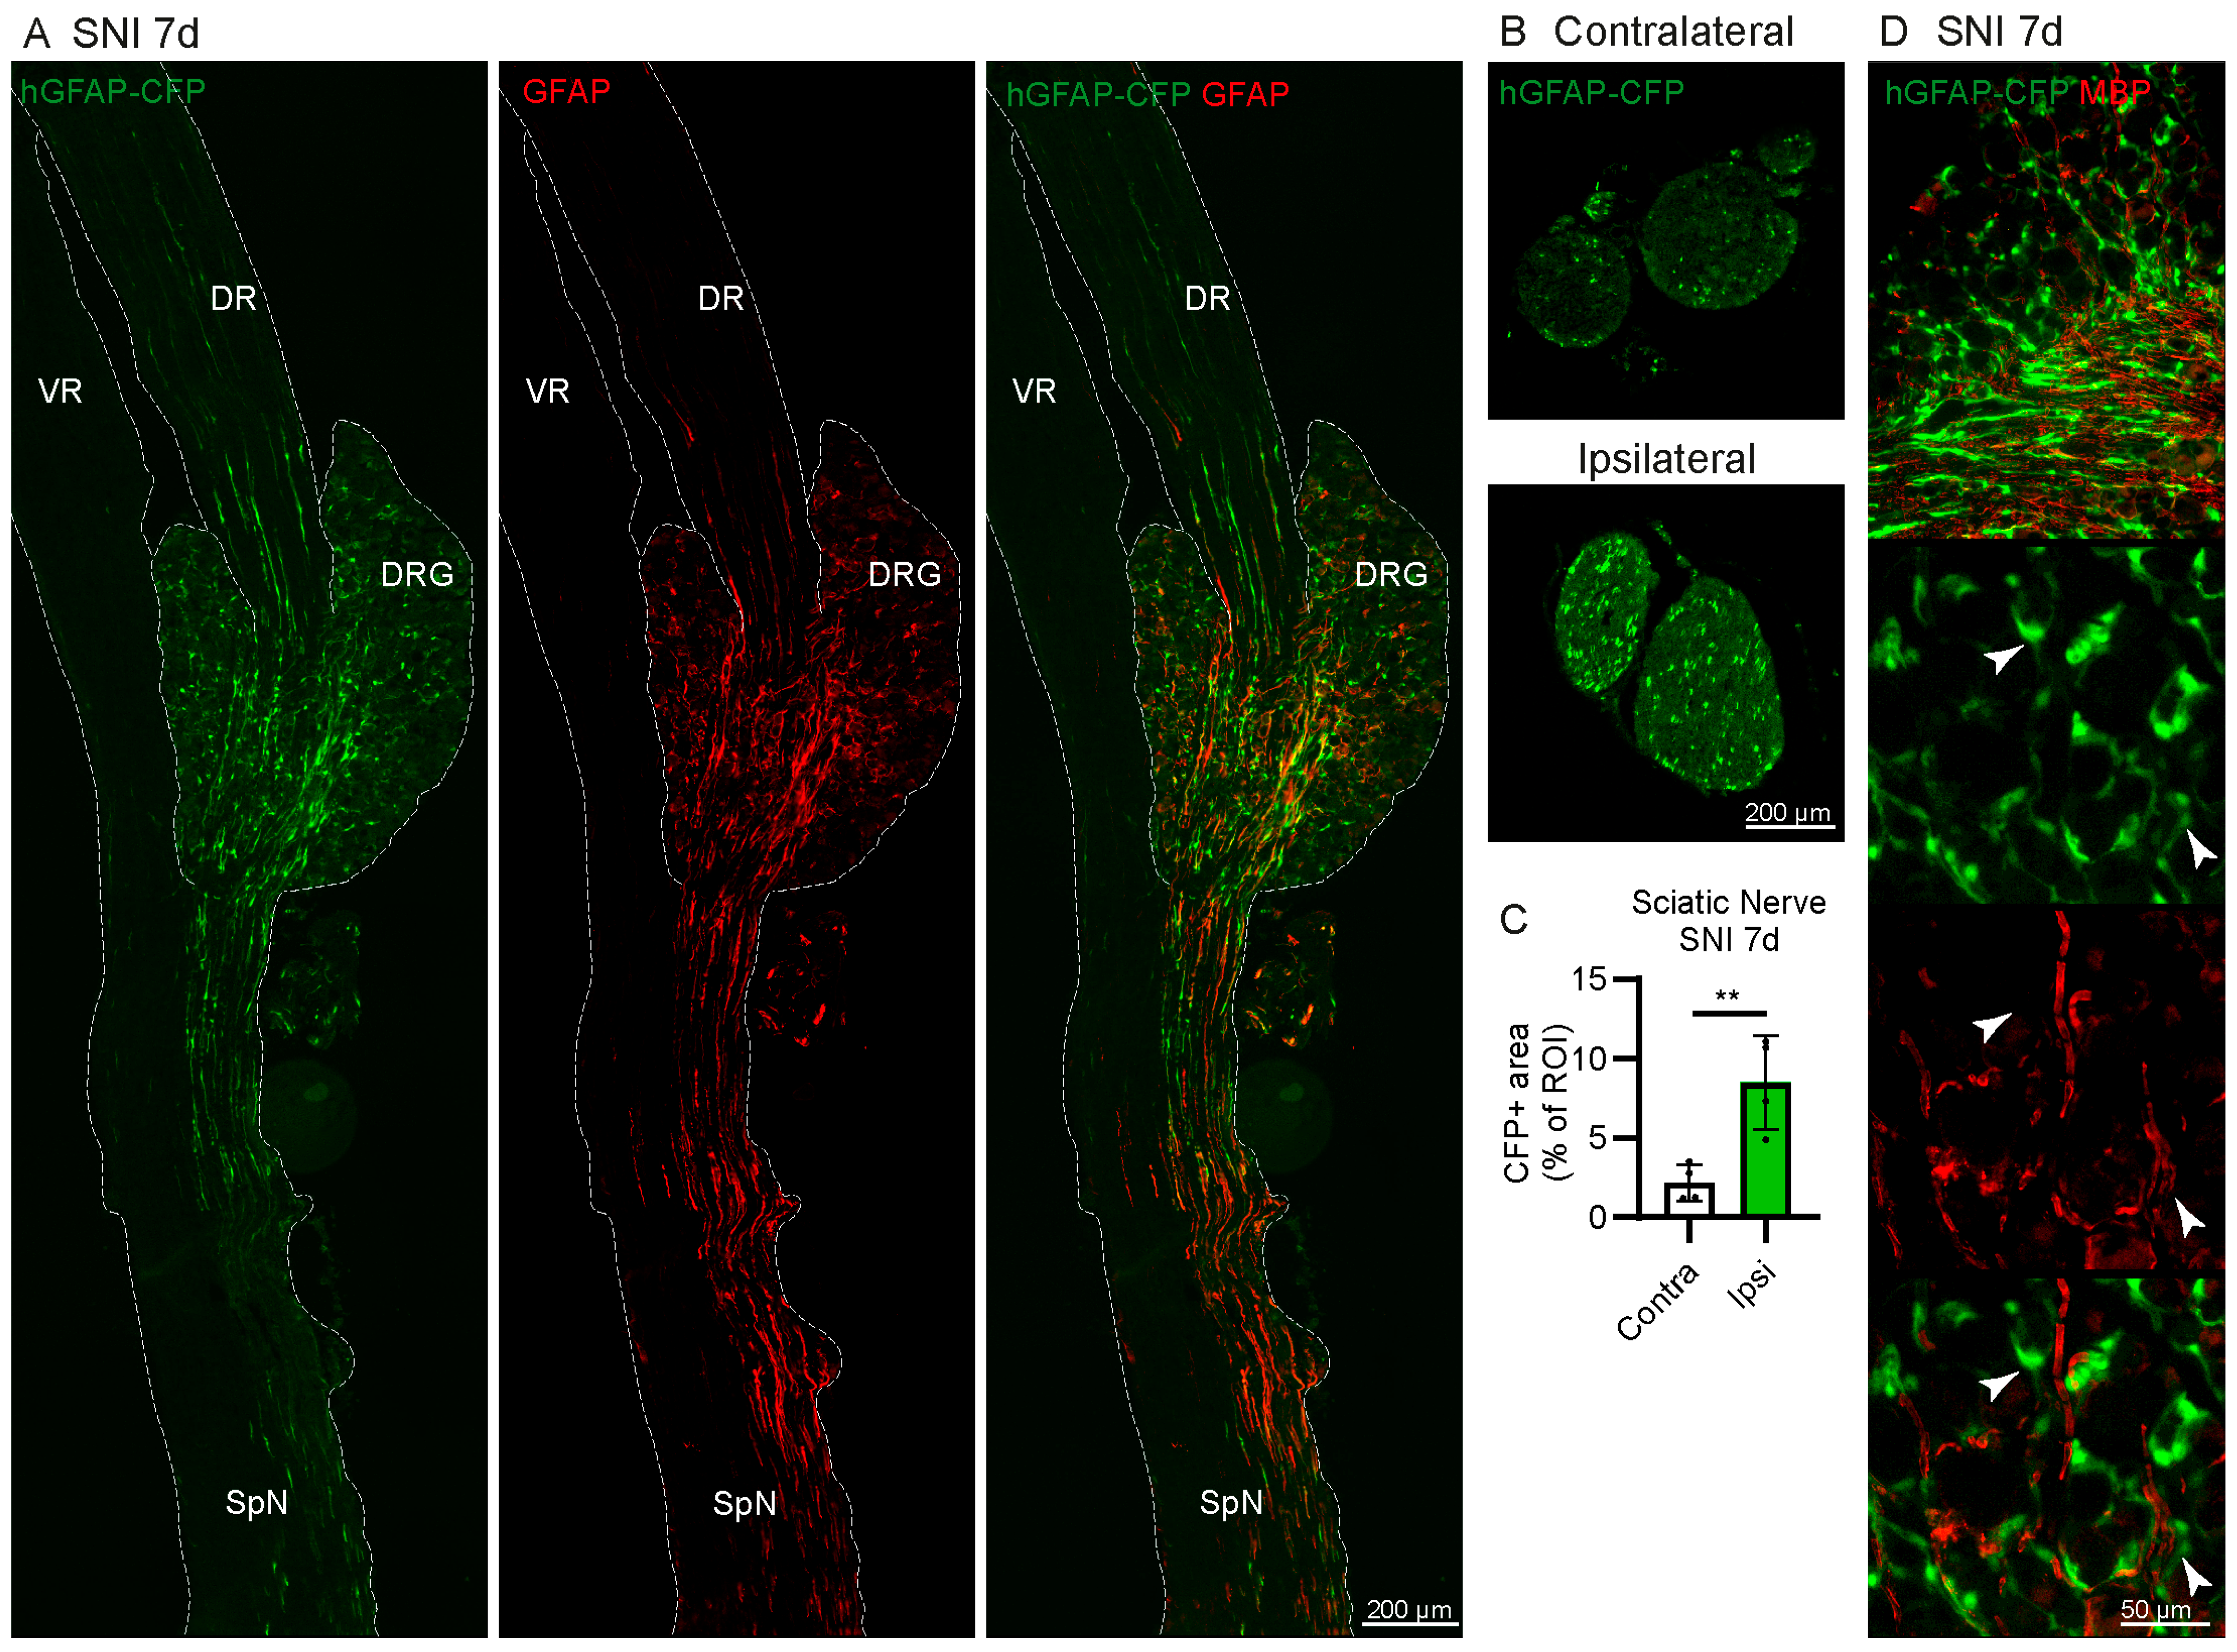
2.3. Some CFP+ Cells Are Non-Myelinating Schwann Cells
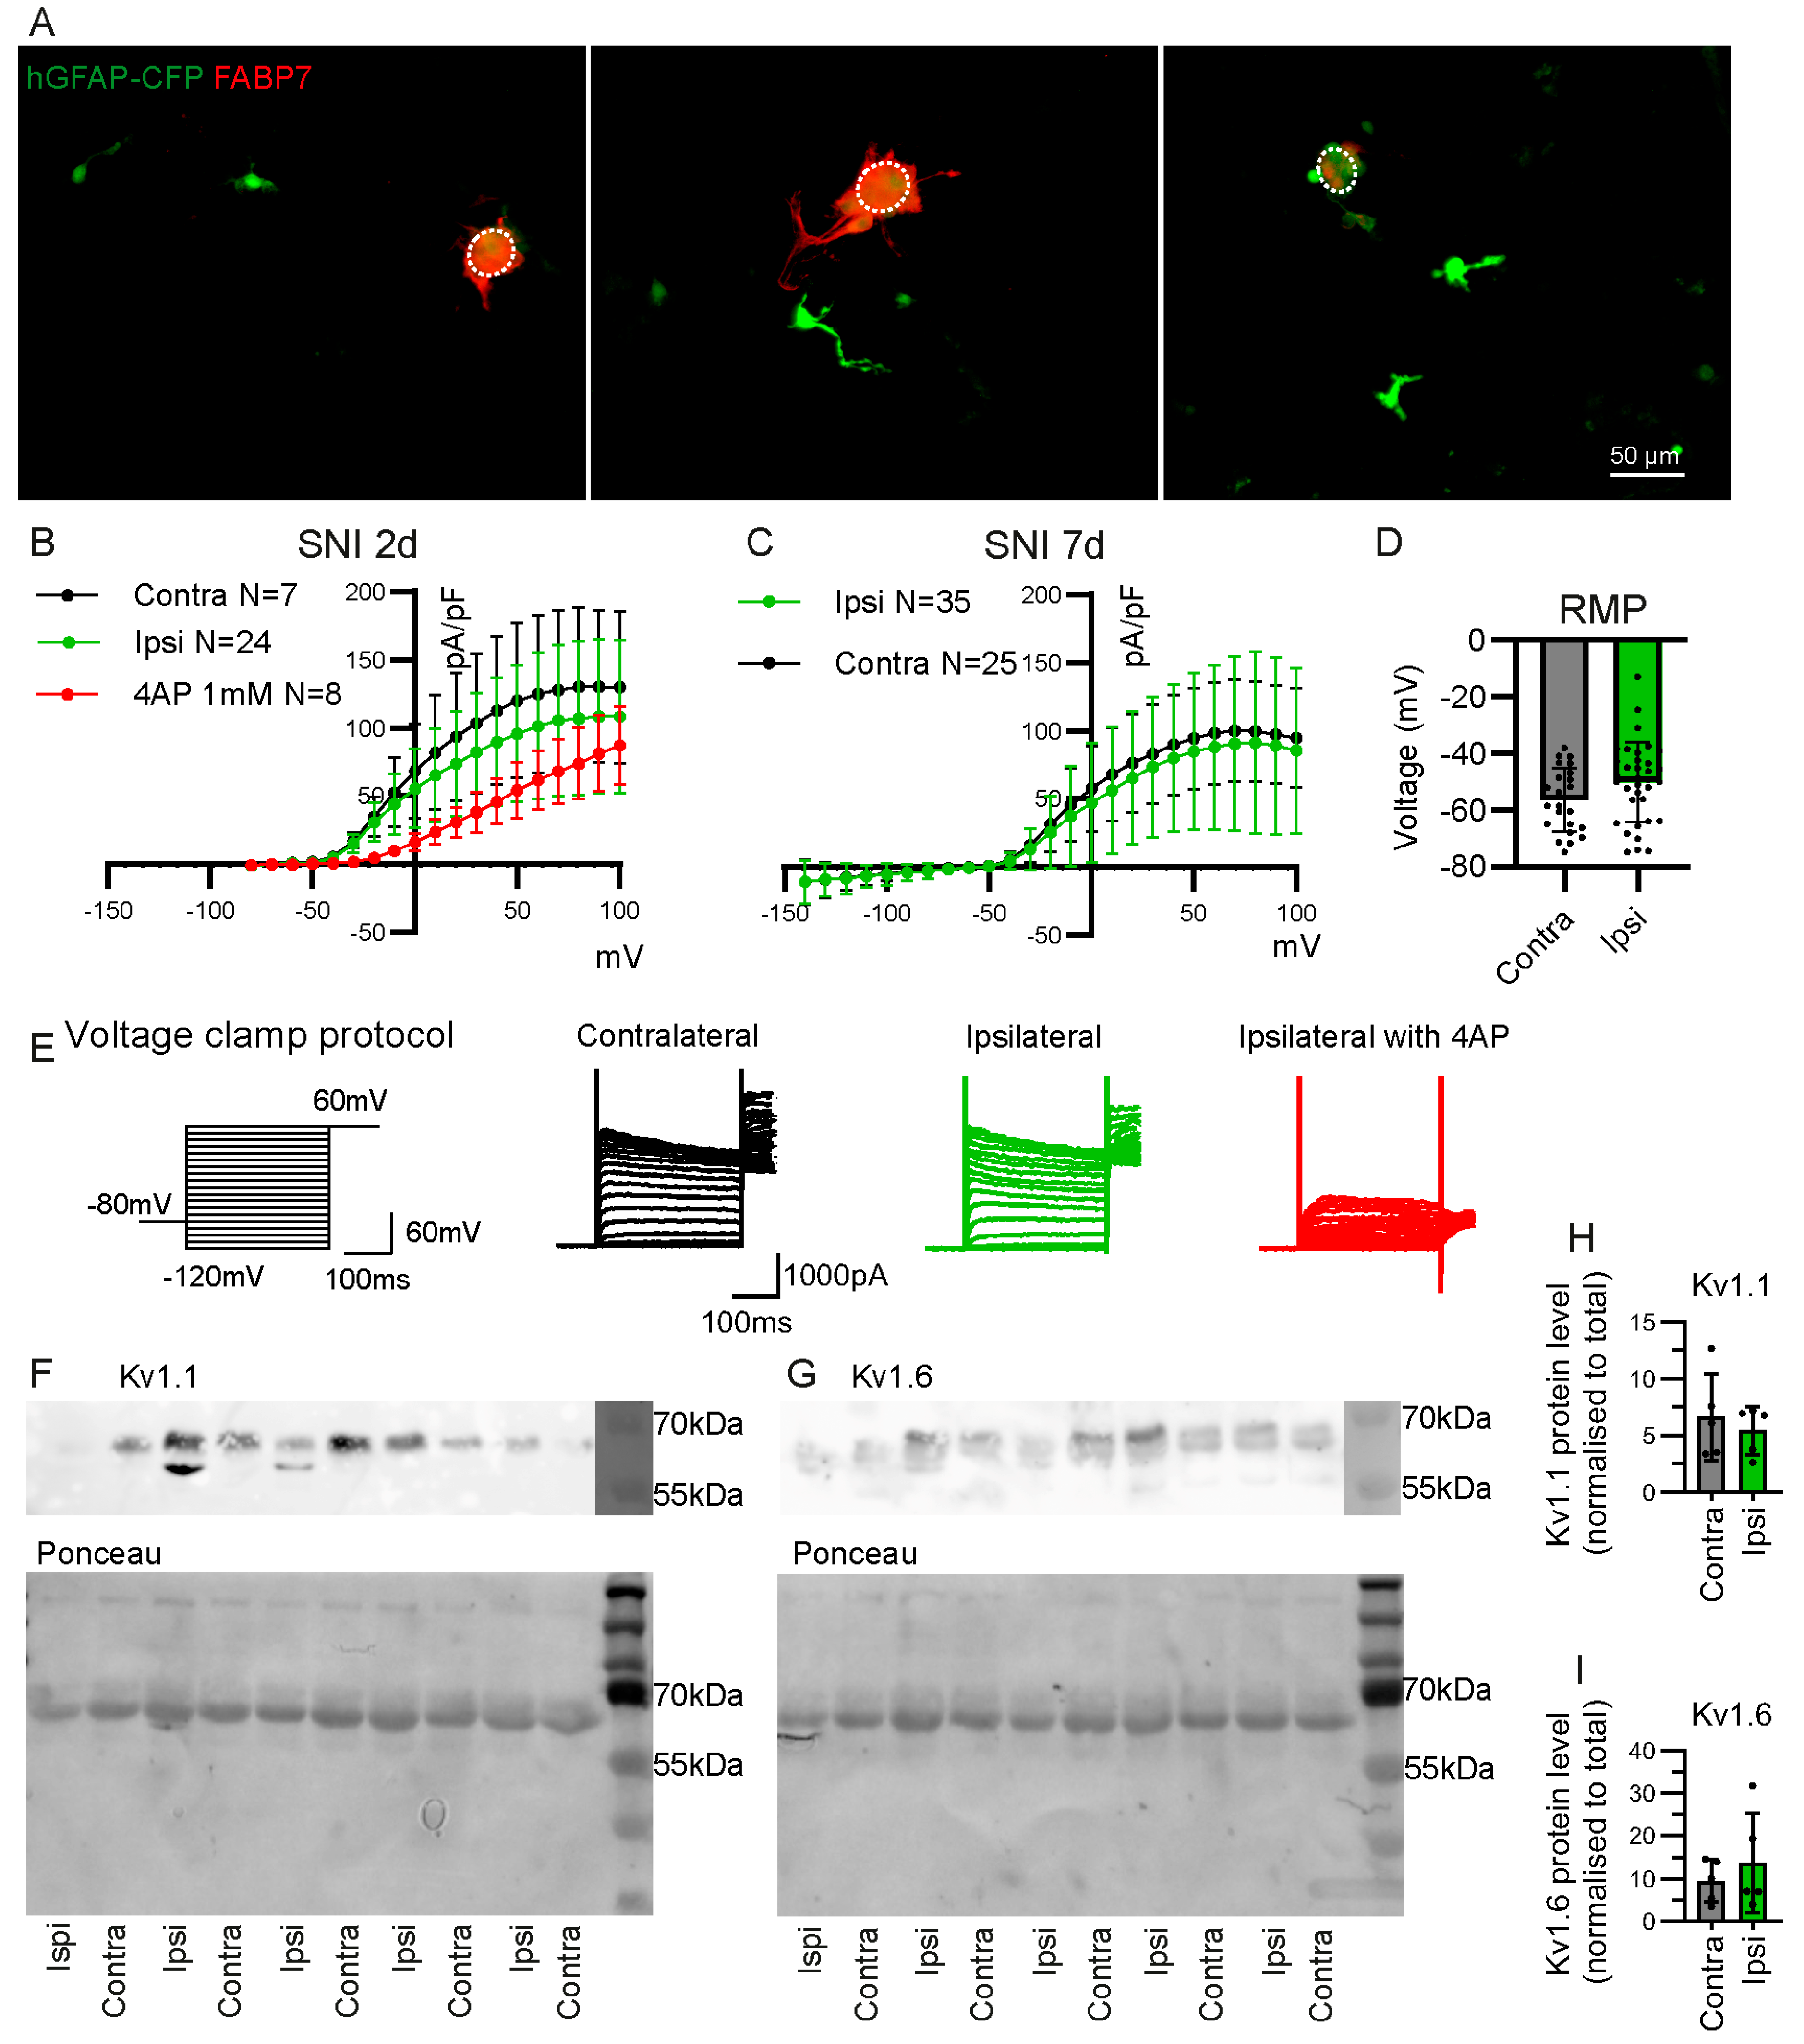
2.4. Electrophysiological Properties of CFP+ FABP7− Cells
3. Discussion
4. Materials and Methods
4.1. Animals
4.2. Dissociation and FACS
4.3. Western Blot
4.4. Immunofluorescence
4.5. Whole-Cell Patch Clamp
4.6. Statistics
4.7. Study Approval
5. Conclusions
Supplementary Materials
Author Contributions
Funding
Institutional Review Board Statement
Informed Consent Statement
Data Availability Statement
Acknowledgments
Conflicts of Interest
Abbreviations
| 4AP | 4-Aminopyridine |
| ATF3 | activating transcription factor 3 |
| ATP | adenosine triphosphate |
| CFP | cyan fluorescent protein |
| CNS | central nervous systems |
| Cx | connexin |
| DMEM | Dulbecco’s Modified Eagle Medium |
| DR | dorsal root |
| DRG | dorsal root ganglion |
| FABP7 | fatty acid binding protein 7 |
| FACS | fluorescence-activated cell sorting |
| FBS | foetal bovine serum |
| GFAP | glial fibrillary acidic protein |
| GS | glutamine synthetase |
| HBSS | Hanks’ Balanced Salt Solution |
| Kir | inward rectifying potassium channels |
| Kv | voltage-gated potassium channels |
| L1CAM | L1 cell adhesion molecule |
| MBP | myelin basic protein |
| MPZ | myelin protein zero |
| NCMAP | non-compact myelin associated protein |
| NGS | normal goat serum |
| NHS | normal horse serum |
| nmSC | non-myelinating Schwann cell |
| NP | non-peptidergic |
| PBS | phosphate-buffered saline |
| PEP1 | peptidergic |
| PFA | paraformaldehyde |
| PNS | peripheral nervous system |
| RMP | resting membrane potential |
| ROI | region of interest |
| SGC | satellite glial cell |
| SNI | spared nerve injury |
| SpN | spinal nerve |
| VR | ventral root |
References
- Suter, M.R.; Wen, Y.R.; Decosterd, I.; Ji, R.R. Do glial cells control pain? Neuron Glia Biol. 2007, 3, 255–268. [Google Scholar] [CrossRef] [PubMed]
- Ji, R.R.; Berta, T.; Nedergaard, M. Glia and pain: Is chronic pain a gliopathy? Pain 2013, 154 (Suppl. S1), S10–S28. [Google Scholar] [CrossRef]
- Ji, R.R.; Chamessian, A.; Zhang, Y.Q. Pain regulation by non-neuronal cells and inflammation. Science 2016, 354, 572–577. [Google Scholar] [CrossRef] [PubMed]
- Koike, T.; Tanaka, S.; Hirahara, Y.; Oe, S.; Kurokawa, K.; Maeda, M.; Suga, M.; Kataoka, Y.; Yamada, H. Morphological characteristics of p75 neurotrophin receptor-positive cells define a new type of glial cell in the rat dorsal root ganglia. J. Comp. Neurol. 2019, 527, 2047–2060. [Google Scholar] [CrossRef] [PubMed]
- Mohr, K.M.; Pallesen, L.T.; Richner, M.; Vaegter, C.B. Discrepancy in the Usage of GFAP as a Marker of Satellite Glial Cell Reactivity. Biomedicines 2021, 9, 1022. [Google Scholar] [CrossRef]
- Jager, S.E.; Pallesen, L.T.; Richner, M.; Harley, P.; Hore, Z.; McMahon, S.; Denk, F.; Vaegter, C.B. Changes in the transcriptional fingerprint of satellite glial cells following peripheral nerve injury. Glia 2020, 68, 1375–1395. [Google Scholar] [CrossRef]
- Lu, J.; Wang, D.; Xu, J.; Zhang, H.; Yu, W. New Insights on the Role of Satellite Glial Cells. Stem Cell Rev. Rep. 2023, 19, 358–367. [Google Scholar] [CrossRef]
- Chu, Y.; Jia, S.; Xu, K.; Liu, Q.; Mai, L.; Liu, J.; Fan, W.; Huang, F. Single-cell transcriptomic profile of satellite glial cells in trigeminal ganglion. Front. Mol. Neurosci. 2023, 16, 1117065. [Google Scholar] [CrossRef]
- Jessen, K.R.; Mirsky, R. The origin and development of glial cells in peripheral nerves. Nat. Rev. Neurosci. 2005, 6, 671–682. [Google Scholar] [CrossRef]
- Reed, C.B.; Feltri, M.L.; Wilson, E.R. Peripheral glia diversity. J. Anat. 2022, 241, 1219–1234. [Google Scholar] [CrossRef]
- Jessen, K.R.; Mirsky, R. The Success and Failure of the Schwann Cell Response to Nerve Injury. Front. Cell Neurosci. 2019, 13, 33. [Google Scholar] [CrossRef] [PubMed]
- Zhang, L.; Xie, R.; Yang, J.; Zhao, Y.; Qi, C.; Bian, G.; Wang, M.; Shan, J.; Wang, C.; Wang, D.; et al. Chronic pain induces nociceptive neurogenesis in dorsal root ganglia from Sox2-positive satellite cells. Glia 2019, 67, 1062–1075. [Google Scholar] [CrossRef] [PubMed]
- Avraham, O.; Deng, P.Y.; Jones, S.; Kuruvilla, R.; Semenkovich, C.F.; Klyachko, V.A.; Cavalli, V. Satellite glial cells promote regenerative growth in sensory neurons. Nat. Commun. 2020, 11, 4891. [Google Scholar] [CrossRef] [PubMed]
- Mapps, A.A.; Thomsen, M.B.; Boehm, E.; Zhao, H.; Hattar, S.; Kuruvilla, R. Diversity of satellite glia in sympathetic and sensory ganglia. Cell Rep. 2022, 38, 110328. [Google Scholar] [CrossRef]
- Suazo, I.; Vega, J.A.; Garcia-Mesa, Y.; Garcia-Piqueras, J.; Garcia-Suarez, O.; Cobo, T. The Lamellar Cells of Vertebrate Meissner and Pacinian Corpuscles: Development, Characterization, and Functions. Front. Neurosci. 2022, 16, 790130. [Google Scholar] [CrossRef]
- Zhang, H.; Mei, X.; Zhang, P.; Ma, C.; White, F.A.; Donnelly, D.F.; Lamotte, R.H. Altered functional properties of satellite glial cells in compressed spinal ganglia. Glia 2009, 57, 1588–1599. [Google Scholar] [CrossRef]
- Ledda, M.; Blum, E.; De Palo, S.; Hanani, M. Augmentation in gap junction-mediated cell coupling in dorsal root ganglia following sciatic nerve neuritis in the mouse. Neuroscience 2009, 164, 1538–1545. [Google Scholar] [CrossRef]
- Pannese, E. The structure of the perineuronal sheath of satellite glial cells (SGCs) in sensory ganglia. Neuron Glia Biol. 2010, 6, 3–10. [Google Scholar] [CrossRef]
- Spray, D.C.; Iglesias, R.; Shraer, N.; Suadicani, S.O.; Belzer, V.; Hanstein, R.; Hanani, M. Gap junction mediated signaling between satellite glia and neurons in trigeminal ganglia. Glia 2019, 67, 791–801. [Google Scholar] [CrossRef]
- Renthal, W.; Tochitsky, I.; Yang, L.; Cheng, Y.C.; Li, E.; Kawaguchi, R.; Geschwind, D.H.; Woolf, C.J. Transcriptional Reprogramming of Distinct Peripheral Sensory Neuron Subtypes after Axonal Injury. Neuron 2020, 108, 128–144.e129. [Google Scholar] [CrossRef]
- Tang, X.; Schmidt, T.M.; Perez-Leighton, C.E.; Kofuji, P. Inwardly rectifying potassium channel Kir4.1 is responsible for the native inward potassium conductance of satellite glial cells in sensory ganglia. Neuroscience 2010, 166, 397–407. [Google Scholar] [CrossRef] [PubMed]
- Vit, J.P.; Ohara, P.T.; Bhargava, A.; Kelley, K.; Jasmin, L. Silencing the Kir4.1 potassium channel subunit in satellite glial cells of the rat trigeminal ganglion results in pain-like behavior in the absence of nerve injury. J. Neurosci. Off. J. Soc. Neurosci. 2008, 28, 4161–4171. [Google Scholar] [CrossRef] [PubMed]
- Takeda, M.; Takahashi, M.; Nasu, M.; Matsumoto, S. Peripheral inflammation suppresses inward rectifying potassium currents of satellite glial cells in the trigeminal ganglia. Pain 2011, 152, 2147–2156. [Google Scholar] [CrossRef]
- Leo, M.; Schmitt, L.I.; Kutritz, A.; Kleinschnitz, C.; Hagenacker, T. Cisplatin-induced activation and functional modulation of satellite glial cells lead to cytokine-mediated modulation of sensory neuron excitability. Exp. Neurol. 2021, 341, 113695. [Google Scholar] [CrossRef] [PubMed]
- Hanani, M.; Spray, D.C. Emerging importance of satellite glia in nervous system function and dysfunction. Nat. Rev. Neurosci. 2020, 21, 485–498. [Google Scholar] [CrossRef]
- McGinnis, A.; Ji, R.R. The Similar and Distinct Roles of Satellite Glial Cells and Spinal Astrocytes in Neuropathic Pain. Cells 2023, 12, 965. [Google Scholar] [CrossRef]
- Hanani, M.; Verkhratsky, A. Satellite Glial Cells and Astrocytes, a Comparative Review. Neurochem. Res. 2021, 46, 2525–2537. [Google Scholar] [CrossRef]
- Rabah, Y.; Rubino, B.; Moukarzel, E.; Agulhon, C. Characterization of transgenic mouse lines for selectively targeting satellite glial cells and macrophages in dorsal root ganglia. PLoS ONE 2020, 15, e0229475. [Google Scholar] [CrossRef]
- Jager, S.E.; Goodwin, G.; Chisholm, K.I.; Denk, F. In vivo calcium imaging shows that satellite glial cells have increased activity in painful states. bioRxiv 2023. [Google Scholar] [CrossRef]
- Gazerani, P. Satellite Glial Cells in Pain Research: A Targeted Viewpoint of Potential and Future Directions. Front. Pain Res. 2021, 2, 646068. [Google Scholar] [CrossRef]
- Hirrlinger, P.G.; Scheller, A.; Braun, C.; Quintela-Schneider, M.; Fuss, B.; Hirrlinger, J.; Kirchhoff, F. Expression of reef coral fluorescent proteins in the central nervous system of transgenic mice. Mol. Cell Neurosci. 2005, 30, 291–303. [Google Scholar] [CrossRef] [PubMed]
- Zehnder, T.; Petrelli, F.; Romanos, J.; De Oliveira Figueiredo, E.C.; Lewis, T.L., Jr.; Deglon, N.; Polleux, F.; Santello, M.; Bezzi, P. Mitochondrial biogenesis in developing astrocytes regulates astrocyte maturation and synapse formation. Cell Rep. 2021, 35, 108952. [Google Scholar] [CrossRef] [PubMed]
- Yang, Z.; Wang, K.K. Glial fibrillary acidic protein: From intermediate filament assembly and gliosis to neurobiomarker. Trends Neurosci. 2015, 38, 364–374. [Google Scholar] [CrossRef]
- Scholzen, T.; Gerdes, J. The Ki-67 protein: From the known and the unknown. J. Cell Physiol. 2000, 182, 311–322. [Google Scholar] [CrossRef]
- Biscoe, T.J.; Nickels, S.M.; Stirling, C.A. Numbers and sizes of nerve fibres in mouse spinal roots. Q. J. Exp. Physiol. 1982, 67, 473–494. [Google Scholar] [CrossRef]
- Avraham, O.; Chamessian, A.; Feng, R.; Yang, L.; Halevi, A.E.; Moore, A.M.; Gereau, R.W.T.; Cavalli, V. Profiling the molecular signature of satellite glial cells at the single cell level reveals high similarities between rodents and humans. Pain 2022, 163, 2348–2364. [Google Scholar] [CrossRef]
- Sengul, G.; Watson, C. Spinal Cord. In The Mouse Nervous System; Watson, C., Paxinos, G., Puelles, L., Eds.; Academic Press: San Diego, CA, USA, 2012; pp. 424–458. [Google Scholar]
- Obata, K.; Katsura, H.; Sakurai, J.; Kobayashi, K.; Yamanaka, H.; Dai, Y.; Fukuoka, T.; Noguchi, K. Suppression of the p75 neurotrophin receptor in uninjured sensory neurons reduces neuropathic pain after nerve injury. J. Neurosci. 2006, 26, 11974–11986. [Google Scholar] [CrossRef]
- Zhou, X.F.; Deng, Y.S.; Chie, E.; Xue, Q.; Zhong, J.H.; McLachlan, E.M.; Rush, R.A.; Xian, C.J. Satellite-cell-derived nerve growth factor and neurotrophin-3 are involved in noradrenergic sprouting in the dorsal root ganglia following peripheral nerve injury in the rat. Eur. J. Neurosci. 1999, 11, 1711–1722. [Google Scholar] [CrossRef]
- Zhou, X.F.; Rush, R.A.; McLachlan, E.M. Differential expression of the p75 nerve growth factor receptor in glia and neurons of the rat dorsal root ganglia after peripheral nerve transection. J. Neurosci. 1996, 16, 2901–2911. [Google Scholar] [CrossRef]
- Chen, B.; Banton, M.C.; Singh, L.; Parkinson, D.B.; Dun, X.P. Single Cell Transcriptome Data Analysis Defines the Heterogeneity of Peripheral Nerve Cells in Homeostasis and Regeneration. Front. Cell Neurosci. 2021, 15, 624826. [Google Scholar] [CrossRef]
- Usoskin, D.; Furlan, A.; Islam, S.; Abdo, H.; Lonnerberg, P.; Lou, D.; Hjerling-Leffler, J.; Haeggstrom, J.; Kharchenko, O.; Kharchenko, P.V.; et al. Unbiased classification of sensory neuron types by large-scale single-cell RNA sequencing. Nat. Neurosci. 2015, 18, 145–153. [Google Scholar] [CrossRef] [PubMed]
- Al-Sheikh, U.; Kang, L. Kir2.1 channel: Macrophage plasticity in tumor microenvironment. Cell Metab. 2022, 34, 1613–1615. [Google Scholar] [CrossRef] [PubMed]
- Baker, M.D. Electrophysiology of mammalian Schwann cells. Prog. Biophys. Mol. Biol. 2002, 78, 83–103. [Google Scholar] [CrossRef]
- Procacci, N.M.; Hastings, R.L.; Aziz, A.A.; Christiansen, N.M.; Zhao, J.; DeAngeli, C.; LeBlanc, N.; Notterpek, L.; Valdez, G.; Gould, T.W. Kir4.1 is specifically expressed and active in non-myelinating Schwann cells. Glia 2023, 71, 926–944. [Google Scholar] [CrossRef] [PubMed]
- Konishi, T. Activity-dependent regulation of inwardly rectifying potassium currents in non-myelinating Schwann cells in mice. J. Physiol. 1994, 474, 193–202. [Google Scholar] [CrossRef] [PubMed]
- Hanani, M. How Is Peripheral Injury Signaled to Satellite Glial Cells in Sensory Ganglia? Cells 2022, 11, 512. [Google Scholar] [CrossRef] [PubMed]
- Feldman-Goriachnik, R.; Hanani, M. How do neurons in sensory ganglia communicate with satellite glial cells? Brain Res. 2021, 1760, 147384. [Google Scholar] [CrossRef]
- Donegan, M.; Kernisant, M.; Cua, C.; Jasmin, L.; Ohara, P.T. Satellite glial cell proliferation in the trigeminal ganglia after chronic constriction injury of the infraorbital nerve. Glia 2013, 61, 2000–2008. [Google Scholar] [CrossRef]
- Krishnan, A.; Bhavanam, S.; Zochodne, D. An Intimate Role for Adult Dorsal Root Ganglia Resident Cycling Cells in the Generation of Local Macrophages and Satellite Glial Cells. J. Neuropathol. Exp. Neurol. 2018, 77, 929–941. [Google Scholar] [CrossRef]
- Jessen, K.R.; Mirsky, R.; Lloyd, A.C. Schwann Cells: Development and Role in Nerve Repair. Cold Spring Harb. Perspect. Biol. 2015, 7, a020487. [Google Scholar] [CrossRef]
- Jessen, K.R.; Mirsky, R. The repair Schwann cell and its function in regenerating nerves. J. Physiol. 2016, 594, 3521–3531. [Google Scholar] [CrossRef] [PubMed]
- Tricaud, N.; Park, H.T. Wallerian demyelination: Chronicle of a cellular cataclysm. Cell Mol. Life Sci. 2017, 74, 4049–4057. [Google Scholar] [CrossRef] [PubMed]
- Jessen, K.R.; Arthur-Farraj, P. Repair Schwann cell update: Adaptive reprogramming, EMT, and stemness in regenerating nerves. Glia 2019, 67, 421–437. [Google Scholar] [CrossRef] [PubMed]
- Wei, Z.; Fei, Y.; Su, W.; Chen, G. Emerging Role of Schwann Cells in Neuropathic Pain: Receptors, Glial Mediators and Myelination. Front. Cell Neurosci. 2019, 13, 116. [Google Scholar] [CrossRef] [PubMed]
- Pertin, M.; Gosselin, R.D.; Decosterd, I. The spared nerve injury model of neuropathic pain. Methods Mol. Biol. 2012, 851, 205–212. [Google Scholar] [CrossRef]
- Decosterd, I.; Woolf, C.J. Spared nerve injury: An animal model of persistent peripheral neuropathic pain. Pain 2000, 87, 149–158. [Google Scholar] [CrossRef]
- Schindelin, J.; Arganda-Carreras, I.; Frise, E.; Kaynig, V.; Longair, M.; Pietzsch, T.; Preibisch, S.; Rueden, C.; Saalfeld, S.; Schmid, B.; et al. Fiji: An open-source platform for biological-image analysis. Nat. Methods 2012, 9, 676–682. [Google Scholar] [CrossRef]
- Zimmermann, M. Ethical guidelines for investigations of experimental pain in conscious animals. Pain 1983, 16, 109–110. [Google Scholar] [CrossRef]


Disclaimer/Publisher’s Note: The statements, opinions and data contained in all publications are solely those of the individual author(s) and contributor(s) and not of MDPI and/or the editor(s). MDPI and/or the editor(s) disclaim responsibility for any injury to people or property resulting from any ideas, methods, instructions or products referred to in the content. |
© 2023 by the authors. Licensee MDPI, Basel, Switzerland. This article is an open access article distributed under the terms and conditions of the Creative Commons Attribution (CC BY) license (https://creativecommons.org/licenses/by/4.0/).
Share and Cite
Konnova, E.A.; Deftu, A.-F.; Chu Sin Chung, P.; Pertin, M.; Kirschmann, G.; Decosterd, I.; Suter, M.R. Characterisation of GFAP-Expressing Glial Cells in the Dorsal Root Ganglion after Spared Nerve Injury. Int. J. Mol. Sci. 2023, 24, 15559. https://0-doi-org.brum.beds.ac.uk/10.3390/ijms242115559
Konnova EA, Deftu A-F, Chu Sin Chung P, Pertin M, Kirschmann G, Decosterd I, Suter MR. Characterisation of GFAP-Expressing Glial Cells in the Dorsal Root Ganglion after Spared Nerve Injury. International Journal of Molecular Sciences. 2023; 24(21):15559. https://0-doi-org.brum.beds.ac.uk/10.3390/ijms242115559
Chicago/Turabian StyleKonnova, Elena A., Alexandru-Florian Deftu, Paul Chu Sin Chung, Marie Pertin, Guylène Kirschmann, Isabelle Decosterd, and Marc R. Suter. 2023. "Characterisation of GFAP-Expressing Glial Cells in the Dorsal Root Ganglion after Spared Nerve Injury" International Journal of Molecular Sciences 24, no. 21: 15559. https://0-doi-org.brum.beds.ac.uk/10.3390/ijms242115559