
CBL/CAP Is Essential for Mitochondria Respiration Complex I Assembly and Bioenergetics Efficiency in Muscle Cells

 , ,
, ,  ,
,  and
and 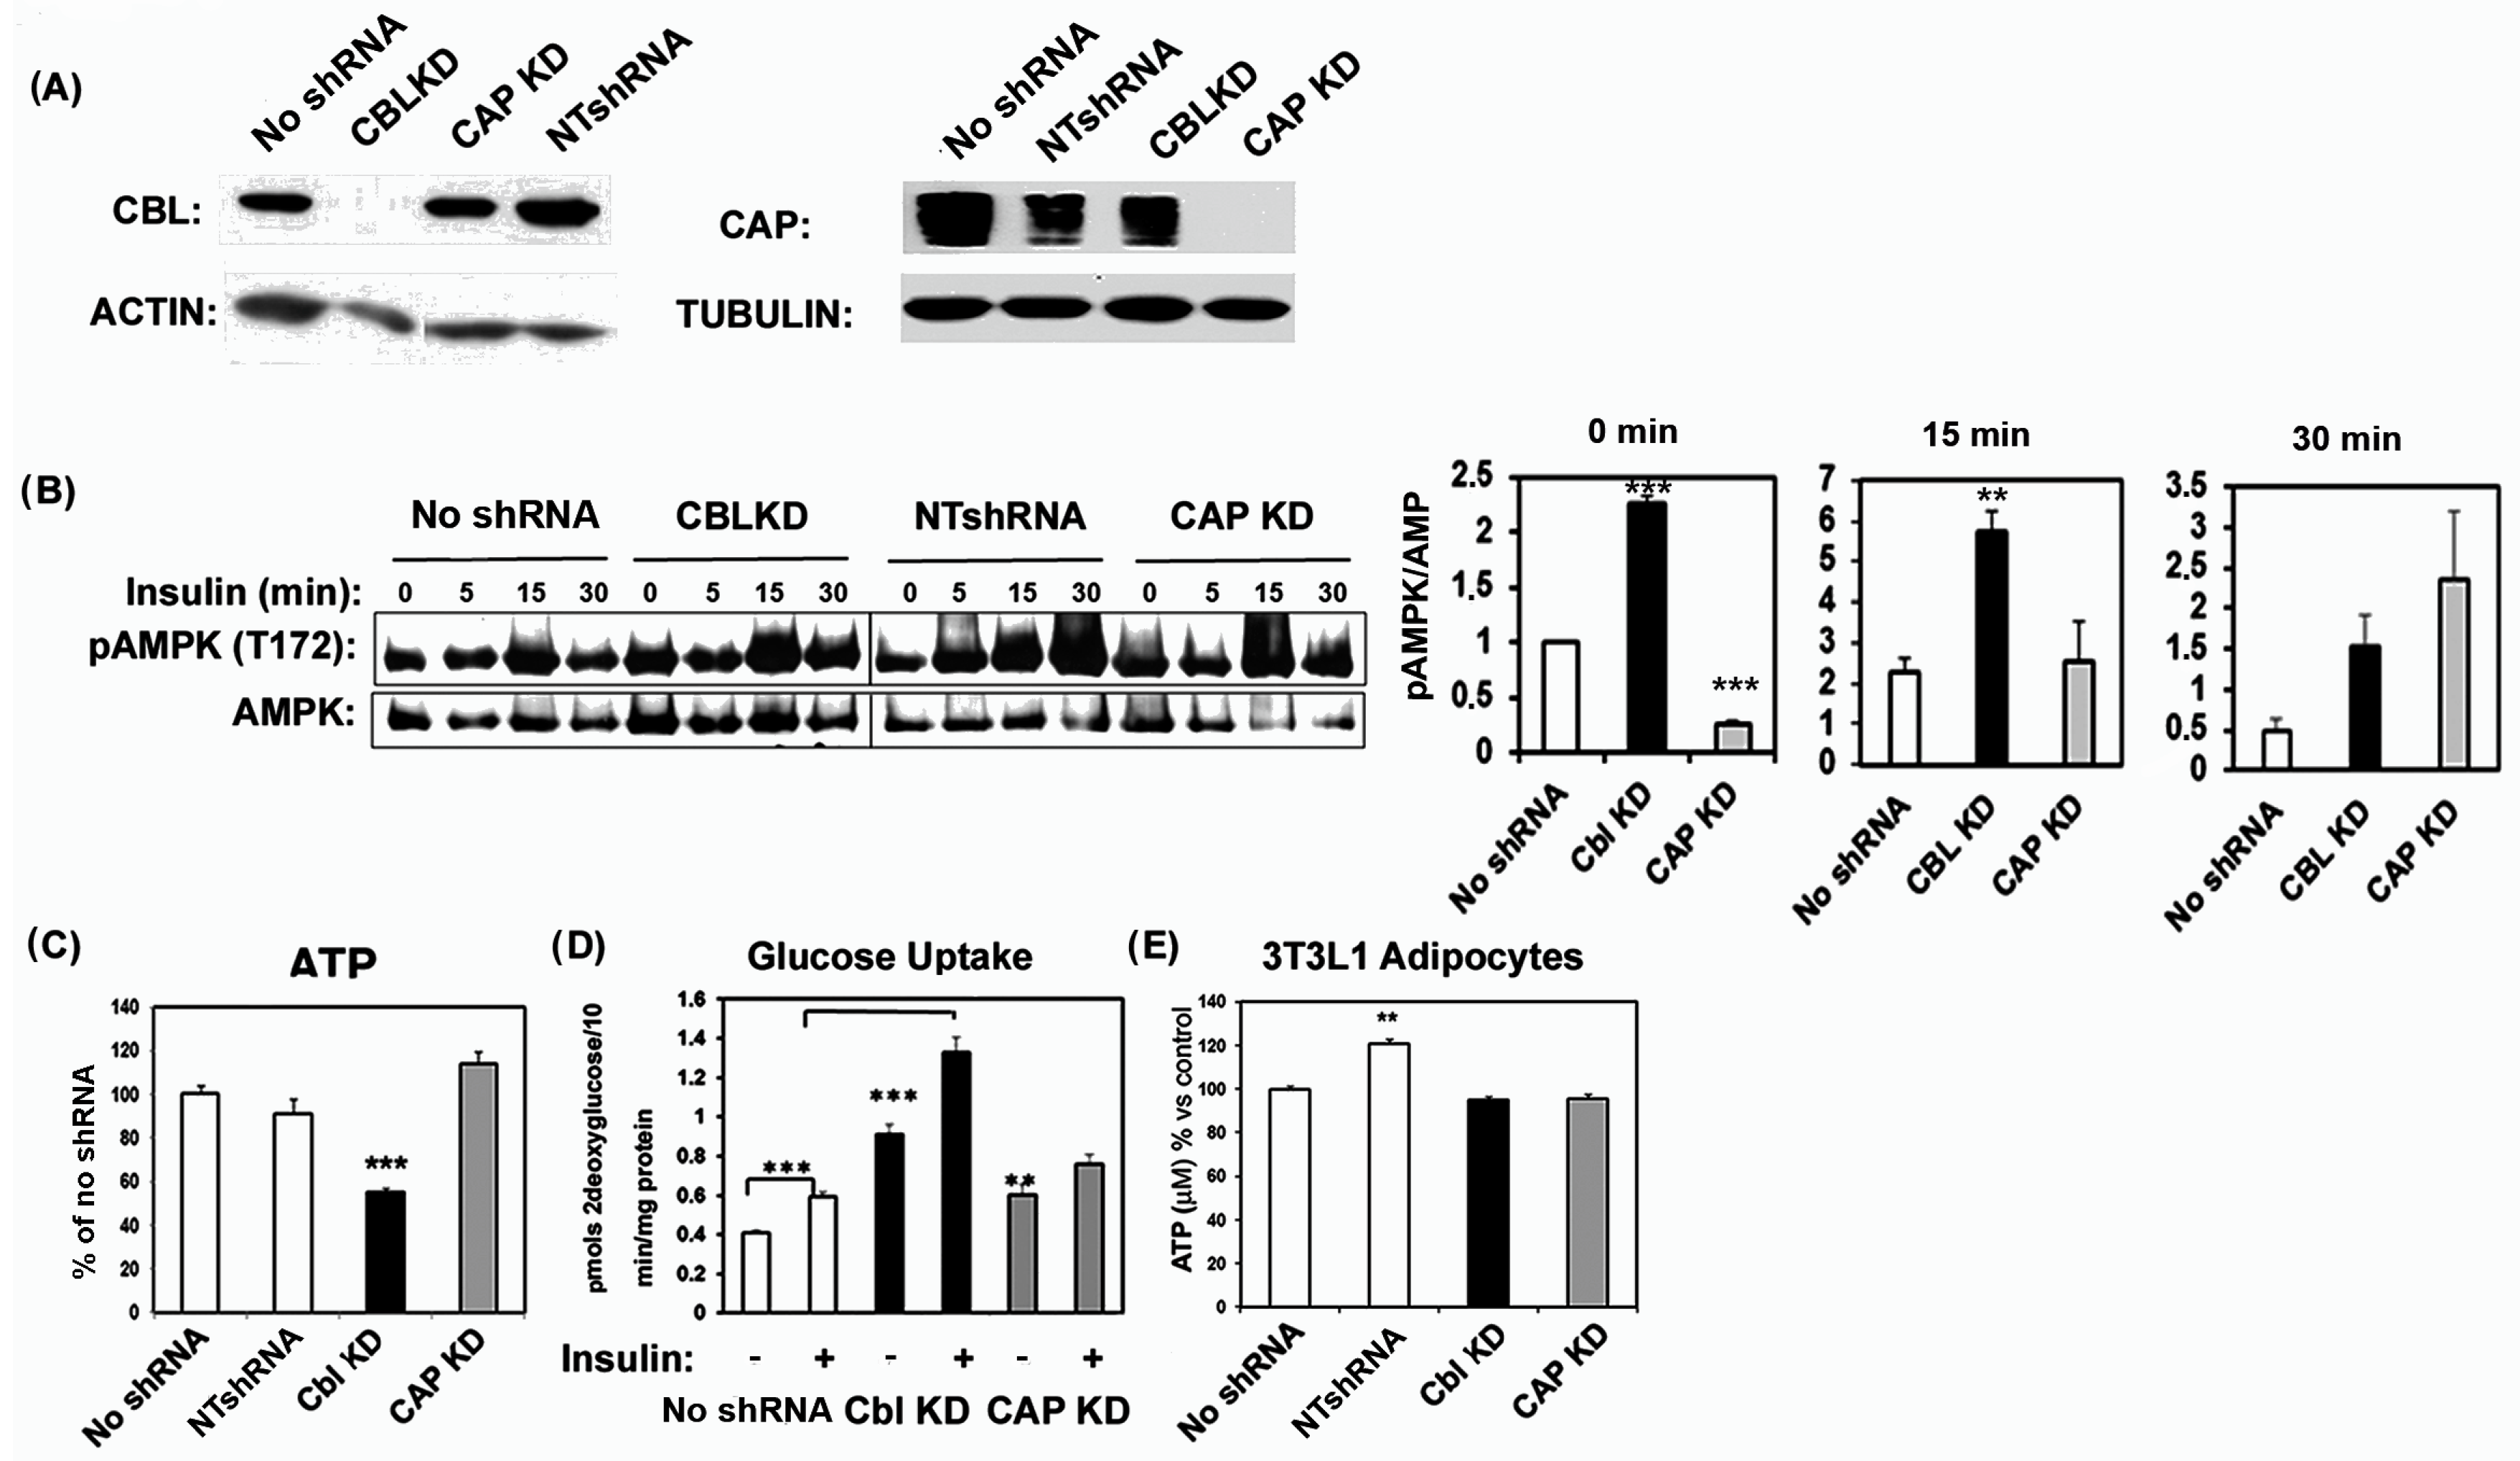
Abstract
:1. Introduction
2. Results
2.1. Cbl Depletion in Myocytes Decreases ATP Levels and Enhances AMPK Activity, Glucose Transport, and Mitochondrial Mass
2.2. CBL- and CAP-Depleted Myocytes Show Alterations in Mitochondrial Respiration
2.3. Reduced Mitochondrial Respiratory CI Expression and Respirasome Assembly in CBL Cells
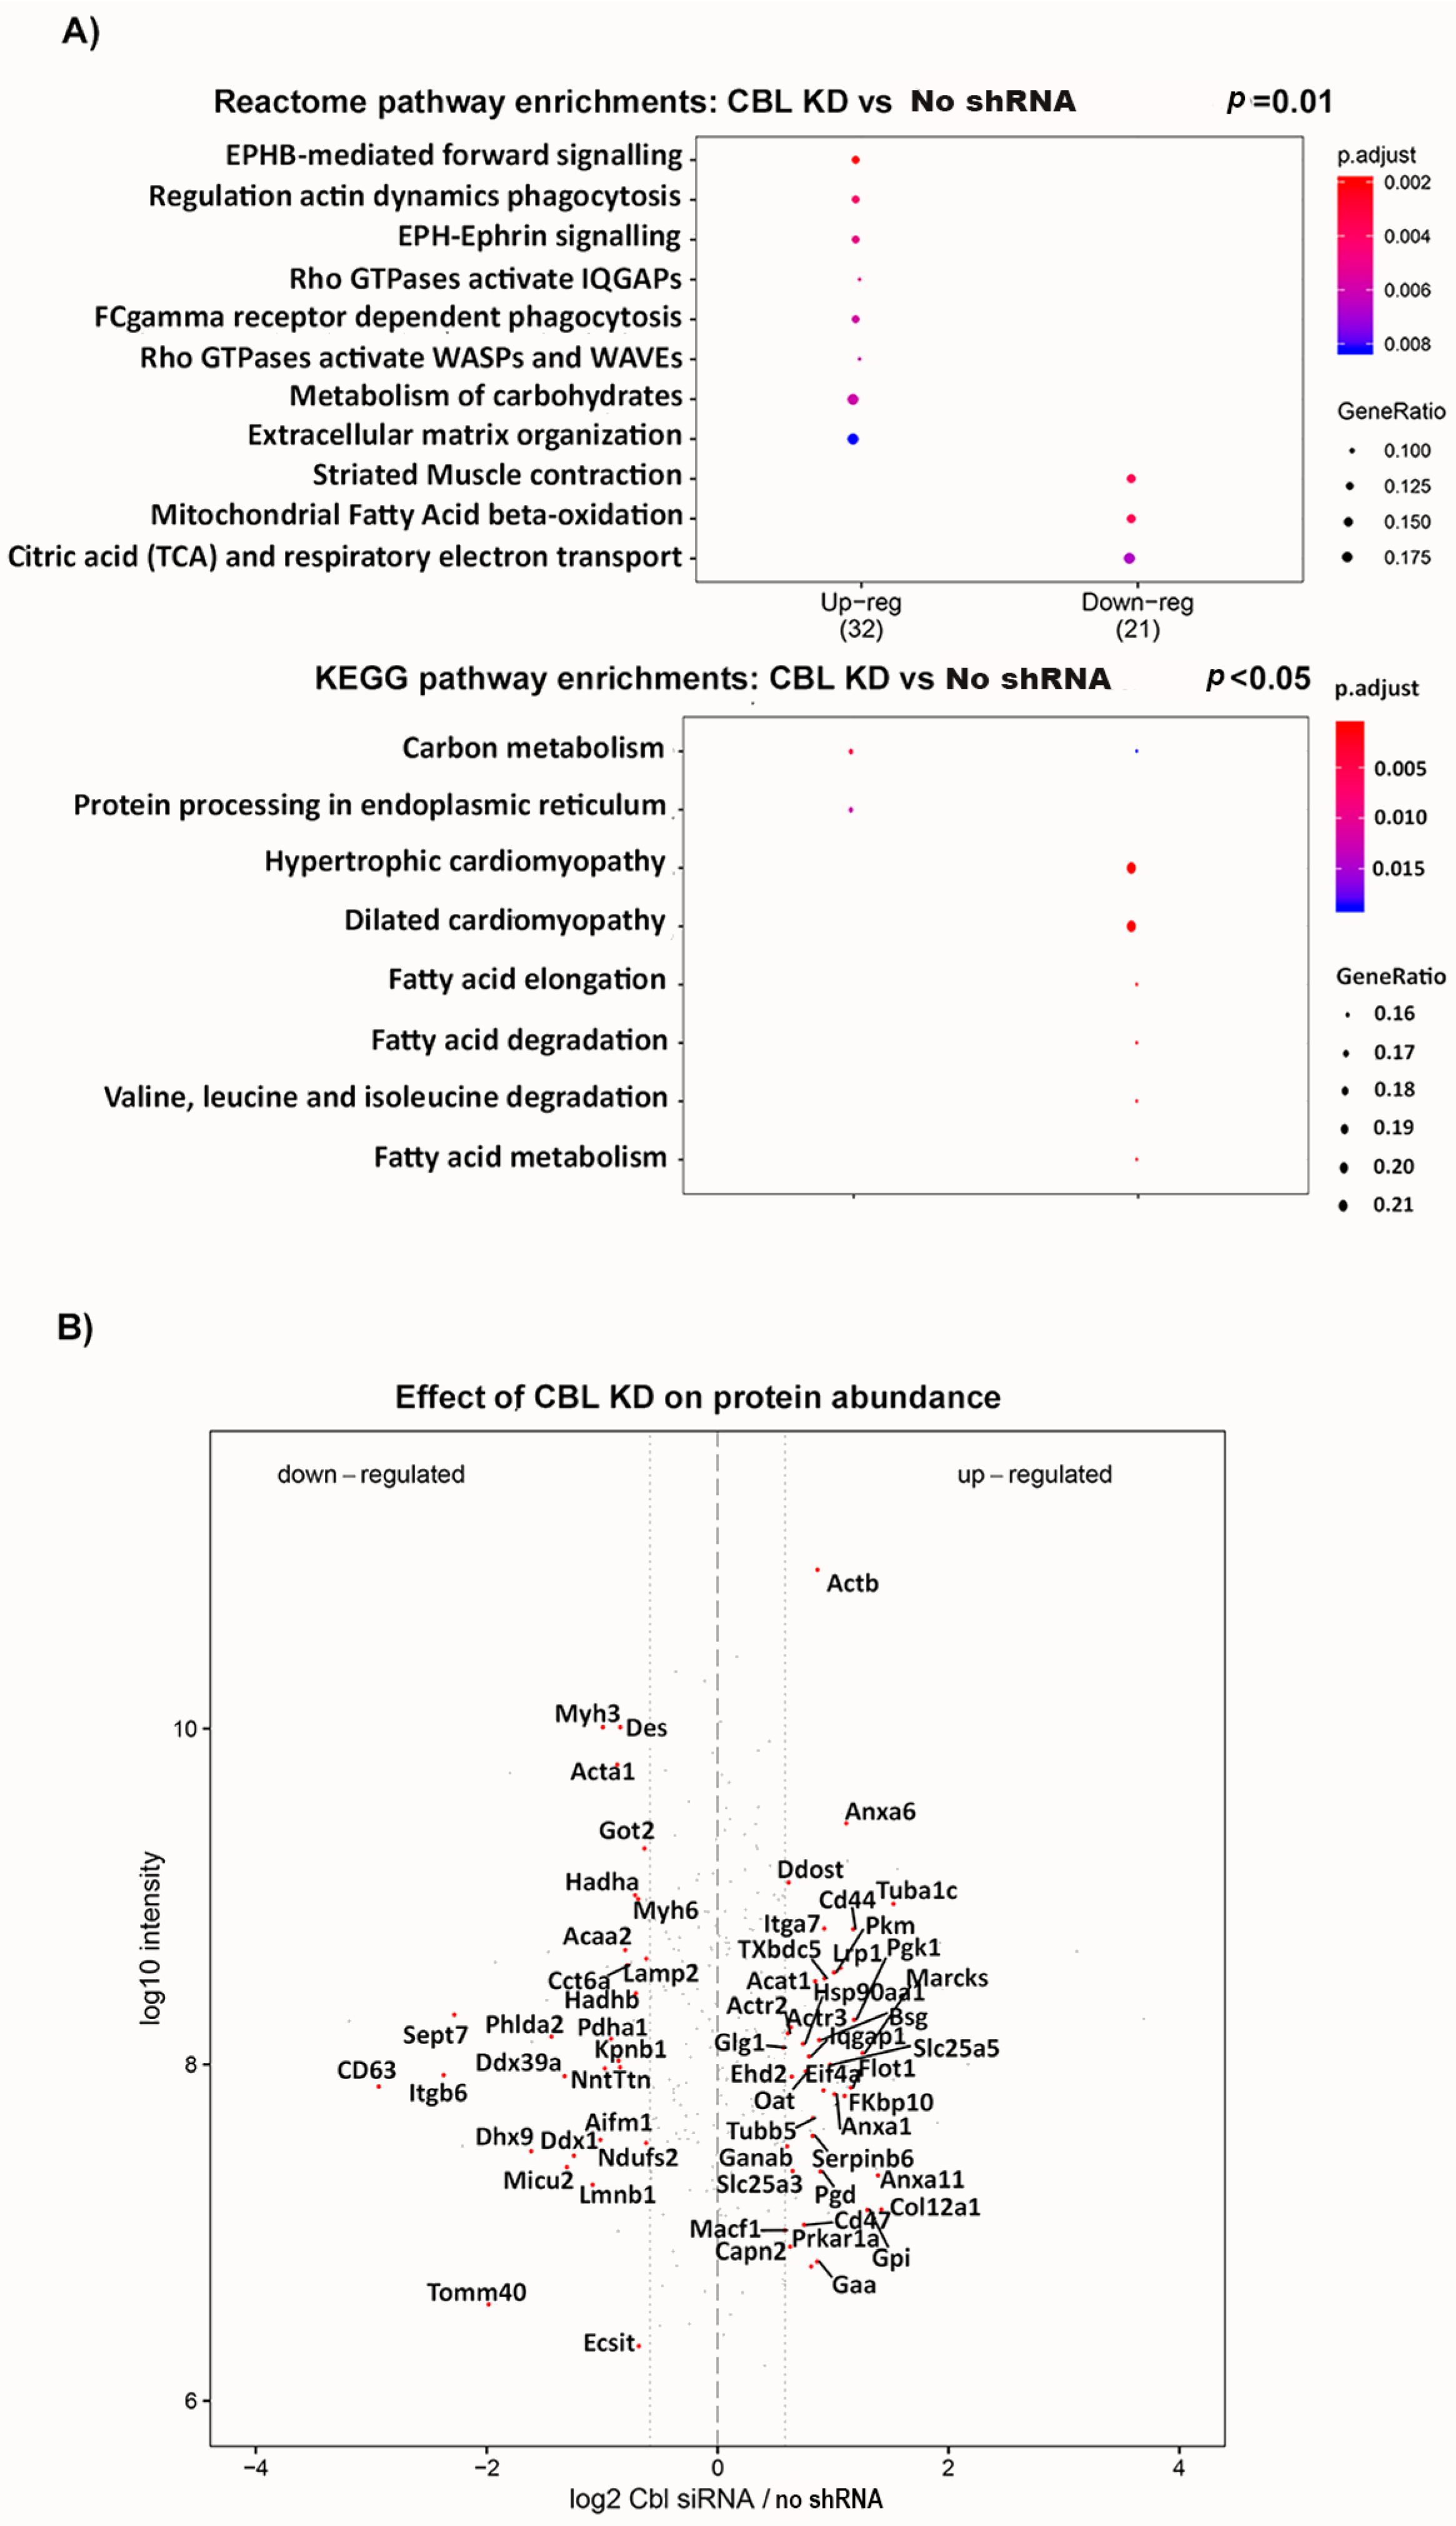
2.4. Cbl KD Cells Have Reduced Levels of Proteins Involved in CI Biogenesis and Fatty Acid Degradation, and Increased Levels of Glycolytic Enzymes
2.5. CBL- and CAP-KD Cells Have Reduced Expression of Genes Involved in Fatty Acyl-CoA Import into Mitochondria
3. Discussion
4. Materials and Methods
4.1. Materials and Antibodies
4.2. Cell Culture and Knockdowns
4.3. Cell Lysates and Western Blotting
4.4. mRNA Extraction and qPCR
4.5. Mitochondrial Mass
4.6. Mitochondrial Isolation
4.7. Cellular ATP Content
4.8. Reactive Oxygen Species
4.9. Oxygen Consumption (OCR) and Extracellular Acidification Rate (ECAR)
4.10. Acyl-CoA Synthase Activity
4.11. Activity of Mitochondrial Respiratory Complexes
4.12. Blue Native Gel Electrophoresis
4.13. Proteome Analysis
4.14. Statistical Analysis
Supplementary Materials
Author Contributions
Funding
Conflicts of Interest
Abbreviations
References
- Mercader, J.M.; Puiggros, M.; Segrè, A.V.; Planet, E.; Sorianello, E.; Sebastian, D.; Rodriguez-Cuenca, S.; Ribas, V.; Bonàs-Guarch, S.; Draghici, S.; et al. Identification of novel type 2 diabetes candidate genes involved in the crosstalk between the mitochondrial and the insulin signaling systems. PLoS Genet. 2012, 8, e1003046. [Google Scholar]
- Mikula, M.; Dzwonek, A.; Hennig, E.; Ostrowski, J. Increased mitochondrial gene expression during L6 cell myogenesis is accelerated by insulin. Int. J. Biochem. Cell. Biol. 2005, 37, 1815–1828. [Google Scholar] [CrossRef]
- Franko, A.; von Kleist-Retzow, J.; Böse, M.; Sanchez-Lasheras, C.; Brodesser, S.; Krut, O.; Kunz, W.; Wiedermann, D.; Hoehn, M.; Stöhr, O.; et al. Complete failure of insulin-transmitted signaling, but not obesity-induced insulin resistance, impairs respiratory chain function in muscle. J. Mol. Med. 2012, 90, 1145–1160. [Google Scholar] [PubMed]
- Ratcliffe, L.; Vázquez Villaseñor, I.; Jennings, L.; Heath, P.; Mortiboys, H.; Schwartzentruber, A.; Karyka, E.; Simpson, J.; Ince, P.; Garwood, C.; et al. Loss of IGF1R in Human Astrocytes Alters Complex I Activity and Support for Neurons. Neuroscience 2018, 390, 46–59. [Google Scholar] [CrossRef]
- Stump, C.; Short, K.; Bigelow, M.; Schimke, J.; Nair, K. Effect of insulin on human skeletal muscle mitochondrial ATP production, protein synthesis, and mRNA transcripts. Proc. Natl. Acad. Sci. USA 2003, 100, 7996–8001. [Google Scholar] [CrossRef]
- Karakelides, H.; Asmann, Y.W.; Bigelow, M.L.; Short, K.R.; Dhatariya, K.; Coenen-Schimke, J.; Kahl, J.; Mukhopadhyay, D.; Nair, K.S. Effect of Insulin Deprivation on Muscle Mitochondrial ATP Production and Gene Transcript Levels in Type 1 Diabetic Subjects. Diabetes 2007, 56, 2683–2689. [Google Scholar]
- Zabielski, P.; Lanza, I.; Gopala, S.; Heppelmann, C.; Bergen, H.; Dasar, S.; Nair, K. Altered Skeletal Muscle Mitochondrial Proteome As the Basis of Disruption of Mitochondrial Function in Diabetic Mice. Diabetes 2016, 65, 561–573. [Google Scholar] [CrossRef]
- Patti, M.E.; Butte, A.J.; Crunkhorn, S.; Cusi, K.; Berria, R.; Kashyap, S.; Miyazaki, Y.; Kohane, I.; Costello, M.; Saccone, R.; et al. Coordinated reduction of genes of oxidative metabolism in humans with insulin resistance and diabetes: Potential role of PGC1 and NRF1. Proc. Natl. Acad. Sci. USA 2003, 100, 8466–8471. [Google Scholar]
- Heilbronn, L.K.; Gan, S.K.; Turner, N.; Campbell, L.V.; Chisholm, D.J. Markers of mitochondrial biogenesis and metabolism are lower in overweight and obese insulin-resistant subjects. J. Clin. Endocrinol. Metab. 2007, 92, 1467–1473. [Google Scholar] [CrossRef]
- Mootha, V.K.; Lindgren, C.M.; Eriksson, K.F.; Subramanian, A.; Sihag, S.; Lehar, J.; Puigserver, P.; Carlsson, E.; Ridderstrale, M.; Laurila, E.; et al. PGC-1alpha-responsive genes involved in oxidative phosphorylation are coordinately downregulated in human diabetes. Nat. Genet. 2003, 34, 267–273. [Google Scholar]
- Morino, K.; Petersen, K.F.; Dufour, S.; Befroy, D.; Frattini, J.; Shatzkes, N.; Neschen, S.; White, M.F.; Bilz, S.; Sono, S.; et al. Reduced mitochondrial density and increased IRS-1 serine phosphorylation in muscle of insulin-resistant offspring of type 2 diabetic parents. J. Clin. Investig. 2005, 115, 3587–3593. [Google Scholar] [PubMed]
- Hwang, H.; Bowen, B.; Lefort, N.; Flynn, C.; De Filippis, E.; Roberts, C.; Smoke, C.; Meyer, C.; Højlund, K.; Yi, Z.; et al. Proteomics Analysis of Human Skeletal Muscle Reveals Novel Abnormalities in Obesity and Type 2 Diabetes. Diabetes 2010, 59, 33–42. [Google Scholar] [PubMed]
- Ritov, V.; Gnaiger, E.; Schjerling, P.; Skovbro, M.; Kraunsoe, R.; Dela, F. Deficiency of subsarcolemmal mitochondria in obesity and type 2 diabetes. Diabetes 2005, 54, 8–14. [Google Scholar] [PubMed]
- Kelley, D.E.; He, J.; Menshikova, E.V.; Ritov, V.B. Dysfunction of mitochondria in human skeletal muscle in type 2 diabetes. Diabetes 2002, 51, 2944–2950. [Google Scholar]
- Befroy, D.; Petersen, K.; Dufour, S.; Mason, G.; de Graaf, R.; Rothman, D.; Shulman, G.I. Impaired mitochondrial substrate oxidation in muscle of insulin-resistant offspring of type 2 diabetic patients. Diabetes 2007, 56, 1376–1381. [Google Scholar] [CrossRef] [Green Version]
- Petersen, K.F.; Dufour, S.; Befroy, D.; Garcia, R.; Shulman, G.I. Impaired mitochondrial activity in the insulin-resistant offspring of patients with type 2 diabetes. N. Engl. J. Med. 2004, 350, 664–671. [Google Scholar] [CrossRef]
- Schrauwen-Hinderling, V.B.; Kooi, M.E.; Hesselink, M.K.; Jeneson, J.A.; Backes, W.H.; van Echteld, C.J.; van Engelshoven, J.M.; Mensink, M.; Schrauwen, P. Impaired in vivo mitochondrial function but similar intramyocellular lipid content in patients with type 2 diabetes mellitus and BMI-matched control subjects. Diabetologia 2007, 50, 113–120. [Google Scholar]
- Phielix, E.; Schrauwen-Hinderling, V.; Mensink, M.; Lenaers, E.; Meex, R.; Hoeks, J.; Eline Kooi, M.; Moonen-Kornips, E.; Sels, J.P.; Hesselink, M.K.; et al. Lower Intrinsic ADP-Stimulated Mitochondrial Respiration Underlies In Vivo Mitochondrial Dysfunction in Muscle of Male Type 2 Diabetic Patients. Diabetes 2008, 57, 2943–2949. [Google Scholar] [CrossRef]
- Minet, A.; Gaster, M. ATP synthesis is impaired in isolated mitochondria from myotubes established from type 2 diabetic subjects. Biochem. Biophys. Res. Commun. 2010, 402, 70–74. [Google Scholar] [CrossRef]
- Boushel, R.; Gnaiger, E.; Schjerling, P.; Skovbro, M.; Kraunsøe, R.R.; Dela, F. Patients with type 2 diabetes have normal mitochondrial function in skeletal muscle. Diabetologia 2007, 50, 790–796. [Google Scholar]
- Frederiksen, C.; Højlund, K.; Hansen, L.; Oakeley, E.; Hemmings, B.; Abdallah, B.; Brusgaard, K.; Beck-Nielsen, H.; Gaster, M. Transcriptional profiling of myotubes from patients with type 2 diabetes: No evidence for a primary defect in oxidative phosphorylation genes. Diabetologia 2008, 51, 2068–2077. [Google Scholar] [PubMed]
- Gupte, A.; Mora, S. Activation of the Cbl insulin signaling pathway in cardiac muscle; dysregulation in obesity and diabetes. Biochem. Biophys. Res. Commun. 2006, 342, 751–757. [Google Scholar] [CrossRef]
- Lin, W.H.; Huang, C.J.; Liu, M.W.; Chang, H.M.; Chen, Y.J.; Tai, T.Y.; Chuang, L.M. Cloning, mapping, and characterization of the human sorbin and SH3 domain containing 1 (SORBS1) gene: A protein associated with c-Abl during insulin signaling in the hepatoma cell line Hep3B. Genomics 2001, 74, 12–20. [Google Scholar] [CrossRef] [PubMed]
- Ribon, V.; Printen, J.A.; Hoffman, N.G.; Kay, B.K.; Saltiel, A.R. A novel, multifuntional c-Cbl binding protein in insulin receptor signaling in 3T3-L1 adipocytes. Mol. Cell Biol. 1998, 18, 872–879. [Google Scholar] [PubMed]
- Chiang, S.; Baumann, C.; Kanzaki, M.; Thurmond, D.; Watson, R.; Neudauer, C.; Macara, I.; Pessin, J.; Saltiel, A. Insulin-stimulated GLUT4 translocation requires the CAP-dependent activation of TC10. Nature 2001, 410, 944–948. [Google Scholar] [PubMed]
- Chang, T.; Wang, W.; Hsiung, C.; He, C.-T.; Lin, M.; Sheu, W.; Chang, Y.-C.; Quertermous, T.; Chen, Y.I.; Rotter, J.; et al. Genetic variation of SORBS1 gene is associated with glucose homeostasis and age at onset of diabetes: A SAPPHIRe Cohort Study. Sci. Rep. 2018, 8, 10574. [Google Scholar] [CrossRef]
- Molero, J.C.; Jensen, T.E.; Withers, P.C.; Couzens, M.; Herzog, H.; Thien, C.B.; Langdon, W.Y.; Walder, K.; Murphy, M.A.; Bowtell, D.D.; et al. c-Cbl-deficient mice have reduced adiposity, higher energy expenditure, and improved peripheral insulin action. J. Clin. Investig. 2004, 114, 1326–1333. [Google Scholar] [CrossRef] [Green Version]
- Molero, J.C.; Turner, N.; Thien, C.B.; Langdon, W.Y.; James, D.E.; Cooney, G.J. Genetic ablation of the c-Cbl ubiquitin ligase domain results in increased energy expenditure and improved insulin action. Diabetes 2006, 55, 3411–3417. [Google Scholar]
- Wredenberg, A.; Westerblad, H.; Larsson, N. Increased mitochondrial mass in mitochondrial myopathy mice. Proc. Natl. Acad. Sci. USA 2002, 99, 15066–15071. [Google Scholar] [CrossRef]
- Lobo-Jarne, T.; Ugalde, C. Respiratory chain supercomplexes: Structures, function and biogenesis. Semin. Cell. Dev. Biol. 2018, 76, 179–190. [Google Scholar] [CrossRef]
- Milenkovic, D.; Blaza, J.; Larsson, N.; Hirst, J. The Enigma of the Respiratory Chain Supercomplexes. Cell Metab. 2017, 25, 765–776. [Google Scholar] [CrossRef]
- Wang, Y.; Mohsen, A.-W.; Mihalik, S.J.; Goetzman, E.S.; Vockley, J. Evidence for Physical Association of Mitochondrial Fatty Acid Oxidation and Oxidative Phosphorylation Complexes. J. Biol. Chem. 2010, 285, 29834–29841. [Google Scholar] [CrossRef] [PubMed]
- Ameen, G.; Mora, S. Cbl downregulation increases RBP4 expression in adipocytes of female mice. J. Endocrinol. 2018, 236, 29–41. [Google Scholar] [PubMed]
- Hardie, D.; Ross, F.A.; Hawley, S.A. AMPK:a nutrient and energy sensor that maintains energy homeostasis. Nat. Rev. 2012, 13, 251–262. [Google Scholar] [CrossRef]
- Morán, M.; Rivera, H.; Sánchez-Aragó, M.; Blázquez, A.; Merinero, B.; Ugalde, C.; Arenas, J.; Cuezva, J.; Martín, M. Mitochondrial bioenergetics and dynamics interplay in complex I-deficient fibroblasts. Biochim. Biophys. Acta. 2010, 1802, 443–453. [Google Scholar] [CrossRef]
- Stroud, D.; Surgenor, E.; Formosa, L.; Reljic, B.; Frazier, A.; Dibley, M.; Osellame, L.; Stait, T.; Beilharz, T.; Thorburn, D.; et al. Accessory subunits are integral for assembly and function of human mitochondrial complex I. Nature 2016, 538, 123–126. [Google Scholar] [CrossRef]
- Tuppen, H.; Hogan, V.; He, L.; Blakely, E.; Worgan, L.; Al-Dosary, M.; Saretzki, G.; Alston, C.; Morris, A.; Clarke, M.; et al. The p.M292T NDUFS2 mutation causes complex I-deficient Leigh syndrome in multiple families. Brain 2010, 133, 2952–2963. [Google Scholar] [CrossRef]
- Lapuente-Brun, E.; Moreno-Loshuertos, R.; Acin-Perez, R.; Latorre-Pellicer, A.; Colás, C.; Balsa, E.; Perales-Clemente, E.; Quirós, P.; Calvo, E.; Rodríguez-Hernández, M.; et al. Supercomplex assembly determines electron flux in the mitochondrialelectron transport chain. Science 2013, 340, 1567–1570. [Google Scholar]
- Lenaz, G.; Genova, M. Structure and organization of mitochondrial respiratory complexes: A new understanding of an old subject. Antioxid. Redox Signal. 2010, 12, 961–1008. [Google Scholar]
- Ikeda, K.; Shiba, S.; Horie-Inoue, K.; Shimokata, K.; Inoue, S. A stabilizing factor for mitochondrial respiratory supercomplex assembly regulates energy metabolism in muscle. Nat. Commun. 2013, 4, 2147. [Google Scholar]
- Chen, Y.; Taylor, E.; Dephoure, N.; Heo, J.; Tonhato, A.; Papandreou, I.; Nath, N.; Denko, N.; Gygi, S.; Rutter, J. Identification of a protein mediating respiratory supercomplex stability. Cell Metab. 2012, 15, 348–360. [Google Scholar] [PubMed] [Green Version]
- Mogensen, M.; Sahlin, K.; Fernstrom, M.; Fernström, M.; Glintborg, D.; Vind, B.; Beck-Nielsen, H.; Højlund, K. Mitochondrial respiration is decreased in skeletal muscle of patients with type 2 diabetes. Diabetes 2007, 56, 1592–1599. [Google Scholar] [PubMed]
- Ritov, V.; Menshikova, E.; Azuma, K.; Wood, R.; Toledo, F.; Goodpaster, B.; Ruderman, N.; Kelley, D. A Deficiency of electron transport chain in human skeletal muscle mitochondria in type 2 diabetes mellitus and obesity. Am. J. Physiol. Endocrinol. Metab. 2010, 298, E49–E58. [Google Scholar] [PubMed]
- Antoun, G.; McMurray, F.; Thrush, A.; Patten, D.; Peixoto, A.; Slack, R.; McPherson, R.; Dent, R.; Harper, M. Impaired mitochondrial oxidative phosphorylation and supercomplex assembly in rectus abdominis muscle of diabetic obese individuals. Diabetologia 2015, 58, 2861–2866. [Google Scholar] [PubMed]
- Grevengoed, T.; Martin, S.; Katunga, L.; Cooper, D.; Anderson, E.; Murphy, R.; Coleman, R. Acyl-CoA synthetase 1 deficiency alters cardiolipin species and impairs mitochondrial function. J. Lipid Res. 2015, 56, 1572–1582. [Google Scholar] [CrossRef]
- Fry, M.; Green, D.E. Cardiolipin requirement for electron transfer in complex I and III of the mitochondrial respiratory chain. J. Biol. Chem. 1981, 256, 1874–1880. [Google Scholar] [CrossRef]
- Yang, C.; Aye, C.; Li, X.; Diaz-Ramos, A.; Zorzano, A.; Mora, S. Mitochondrial dysfunction in insulin resistance: Differential contributions of chronic insulin and saturated fatty acid exposure in muscle cells. Biosci. Rep. 2012, 32, 465–478. [Google Scholar] [CrossRef]
- Koekemoer, T.; Downing, T.; Oelofsen, W. An alternative PCR assay for quantifying mitochondrial DNA in crude preparations. Nucleic Acids Res. 1998, 26, 2829–2830. [Google Scholar]
- Fischer, J.; Ruitenbeek, W.; Berden, J.; Frans Trijbels, J.; Veerkamp, J.; Stadhouders, A.; Sengers, R.; Janssen, A.J. Differential investigation of the capacity of succinate oxidation in human skeletal muscle. Cltnw Chim. Am. 1985, 153, 23–36. [Google Scholar] [CrossRef]
- Barrientos, A.; Fontanesi, F.; Diaz, F. Evaluation of the Mitochondrial Respiratory chain and Oxidative Phosphorylation system using polarography and spectrophotometric enzyme assays. Curr. Protoc. Hum. Genet. 2009, 63, 19.3.1–19.3.14. [Google Scholar] [CrossRef]
- Timón-Gómez, A.; Pérez-Pérez, R.; Nyvltova, E.; Ugalde, C.; Fontanesi, F.; Barrientos, A. Protocol for the Analysis of Yeast and Human Mitochondrial Respiratory Chain Complexes and Supercomplexes by Blue Native Electrophoresis. STAR Protoc. 2020, 1, 100089. [Google Scholar] [CrossRef] [PubMed]
- Moreno-Lastres, D.; Fontanesi, F.; García-Consuegra, I.; Martín, M.; Arenas, J.; Barrientos, A.; Ugalde, C. Mitochondrial complex I plays an essential role in human respirasome assembly. Cell Metab. 2012, 15, 324–335. [Google Scholar] [PubMed] [Green Version]
- Kohl, S.; Klein, M.; Hochrein, J.; Oefner, P.; Spang, R.; Groemwald, W. State-of-the-art normalization methods improve NMR-based metabolomic analysis. Metabolomics 2012, 8, 146–160. [Google Scholar] [PubMed]
- Xia, J.; Wishart, D.S. Using MetaboAnalyst 3.0 for Comprehensive Metabolomics Data Analysis. Curr. Protoc. Bioinform. 2016, 55, 14.10.1–14.10.91. [Google Scholar]
- Chong, J.; Soufan, O.; Li, C.; Caraus, I.; Li, S.; Bourque, G.; Wishart, D.S.; Xia, J. MetaboAnalyst 4.0: Towards more transparent and integrative metabolomics analysis. Nucl. Acids Res. 2018, 46, W486–W494. [Google Scholar] [CrossRef]
- Chong, J.; Xia, J. MetaboAnalystR: An R package for flexible and reproducible analysis of metabolomics data. Bioinformatics 2018, 27, 4313–4314. [Google Scholar] [CrossRef] [Green Version]


Disclaimer/Publisher’s Note: The statements, opinions and data contained in all publications are solely those of the individual author(s) and contributor(s) and not of MDPI and/or the editor(s). MDPI and/or the editor(s) disclaim responsibility for any injury to people or property resulting from any ideas, methods, instructions or products referred to in the content. |
© 2023 by the authors. Licensee MDPI, Basel, Switzerland. This article is an open access article distributed under the terms and conditions of the Creative Commons Attribution (CC BY) license (https://creativecommons.org/licenses/by/4.0/).
Share and Cite
Aye, C.-C.; Hammond, D.E.; Rodriguez-Cuenca, S.; Doherty, M.K.; Whitfield, P.D.; Phelan, M.M.; Yang, C.; Perez-Perez, R.; Li, X.; Diaz-Ramos, A.; et al. CBL/CAP Is Essential for Mitochondria Respiration Complex I Assembly and Bioenergetics Efficiency in Muscle Cells. Int. J. Mol. Sci. 2023, 24, 3399. https://0-doi-org.brum.beds.ac.uk/10.3390/ijms24043399
Aye C-C, Hammond DE, Rodriguez-Cuenca S, Doherty MK, Whitfield PD, Phelan MM, Yang C, Perez-Perez R, Li X, Diaz-Ramos A, et al. CBL/CAP Is Essential for Mitochondria Respiration Complex I Assembly and Bioenergetics Efficiency in Muscle Cells. International Journal of Molecular Sciences. 2023; 24(4):3399. https://0-doi-org.brum.beds.ac.uk/10.3390/ijms24043399
Chicago/Turabian StyleAye, Cho-Cho, Dean E. Hammond, Sergio Rodriguez-Cuenca, Mary K. Doherty, Phillip D. Whitfield, Marie M. Phelan, Chenjing Yang, Rafael Perez-Perez, Xiaoxin Li, Angels Diaz-Ramos, and et al. 2023. "CBL/CAP Is Essential for Mitochondria Respiration Complex I Assembly and Bioenergetics Efficiency in Muscle Cells" International Journal of Molecular Sciences 24, no. 4: 3399. https://0-doi-org.brum.beds.ac.uk/10.3390/ijms24043399