Article

Diversity Patterns of Different Life Forms of Plants along an Elevational Gradient in Crete, Greece

by
Maria Lazarina
1,*,
Athanasios Charalampopoulos
1,
Maria Psaralexi
1,
Nikos Krigas
2,
Danai-Eleni Michailidou
1,
Athanasios S. Kallimanis
1 and
Stefanos P. Sgardelis
1
1
Department of Ecology, School of Biology, Aristotle University, GR-54124 Thessaloniki, Greece
2
Institute of Plant Breeding & Genetic Resources, Hellenic Agricultural Organization Demeter, GR-57001 Thermi-Thessaloniki, Greece
*
Author to whom correspondence should be addressed.
Submission received: 11 October 2019 / Revised: 16 October 2019 / Accepted: 17 October 2019 / Published: 19 October 2019
(This article belongs to the Section Plant Diversity)

Abstract

:
Elevational gradients provide a unique opportunity to explore species responses to changing environmental conditions. Here, we focus on an elevational gradient in Crete, a climate-vulnerable Mediterranean plant biodiversity hotspot and explore the diversity patterns and underlying mechanisms of different plant life forms. We found that the significant differences in life forms’ elevational and environmental ranges are reflected in α- diversity (species richness at local scale), γ-diversity (species richness at regional scale) and β-diversity (variation in species composition). The α- and γ-diversity decreased with elevation, while β-diversity followed a hump-shaped relationship, with the peak varying between life forms. However, β-deviation (deviation from null expectations) varied significantly with elevation but was life formindependent. This suggests that species composition is shaped by the size of the available species pool which depends on life form, but also by other deterministic or stochastic processes that act in a similar way for different life forms. The strength of these processes varies with elevation, with hotter–drier conditions and increased human activities filtering species composition at lowlands and large-scale processes determining the species pool size overriding local ecological processes at higher elevations.

1. Introduction

Islands occupy only 5.3% of Earth’s surface but contribute disproportionally to global biodiversity, for example they contribute 17% of plant species [1,2]. These isolated ecosystems have inspired the classical theory of island biogeography which predicts that islands are in a dynamic equilibrium [3]. Their species richness is determined by the balance between extinction and immigration rates which depend on the size of the island and the distance from mainland, that is, isolation. Larger islands that got isolated earlier are expected to have greater species richness and endemism [3]. Since then, multiple studies have documented that multiple factors (e.g., habitat diversity, elevation) affect the species richness of islands, highlighting the role of environmental conditions in driving species diversity patterns within islands [4,5,6].
The gradual change of environmental conditions across elevational gradients such as, temperature, precipitation, soil, area, and human land uses [7,8] provide the unique opportunity to explore how species distributions respond to environmental changes, and more crucially to human-induced changes [9]. Species responses are mediated by their traits reflecting behavior, physiology and morphology, such as life-history traits and survival strategies [10]. The responses of individual species might vary widely, but species sharing properties might share responses [11]. Therefore, by exploring the responses of groups of species might allow generalizations that will provide useful inputs for biodiversity conservation [12]. Plant life forms are related to life-history traits and are linked to species responses to climate and disturbances [13,14]. Annual plant species seem to thrive in the edges of environmental gradients, and in highly disturbed habitats or in the early stages of post-disturbance succession, while perennials and woody species seem to dominate in less disturbed habitats and in latter stages of post-disturbance succession [15,16]. Specific life forms may suffer range contractions or shifts under future climate change scenarios [17]. Chiarucci, et al. [18] highlighted that land-use change, that is, the shift from agriculture to tourism, changed the species richness of different life forms, but did not affect the observed proportion of functional types in a Mediterranean archipelago. Therefore, the life-form approach can be used to map forthcoming changes in the ecosystem structure [17,19,20,21].
Diversity patterns of life forms across elevational gradients and the multiple intercorrelated environmental gradients can reveal part of the complex puzzle of how species adapt and thus respond to climate change. The way diversity changes along elevational gradients has long been known and explored by ecologists and biogeographers, while it has been described as general and inherently linked to the species–area relationship [22]. There has been a considerable amount of research on the elevational gradient of species richness across taxonomic groups and regions [23,24]. Species richness has been shown to follow hump-shaped relationship with elevation peaking at middle elevations [23,25], or monotonic decreasing relationship [23], with the shape of the relationship linked to the extent of the elevational gradient studied [26]. Species richness—elevation relationship may differ among life forms in various types of ecosystems [27,28,29,30,31]. However, little is known about how β-diversity, that is, the variation in the identities of species among sites [32], of different life forms varies along elevational gradients, with evidence supporting that the relationship differs among life forms [33,34]. Beta-diversity is considered to decrease with elevation [35,36,37,38], but the relationship can be of another type such as positive [39] or hump-shaped peaking at intermediate, lower or higher elevations [40,41,42]. Patterns of β-diversity can be driven by the size of the available species pool [35], deterministic processes, that is, niche-based processes such as environmental filtering and species sorting [43] and bioclimatic variables [44], or stochastic processes such as dispersal limitation [45,46]. These processes are not mutually exclusive, and the species composition is usually the result of their interplay [47,48,49,50].
In the present study, we explore the diversity patterns of plant life forms along an elevational gradient in a Mediterranean plant diversity hotspot Crete, Greece. Given that life form trait is linked to plant responses to environmental conditions, we compare the elevational, environmental, and geographical ranges of species, and we explore how species richness at local (α-diversity) and regional scale (γ-diversity) varies along an elevational gradient. Specific life forms are expected to be related to particular parts of the elevational, environmental and anthropogenic gradient in this Mediterranean island. Annual plants are the dominant life form in Mediterranean ecosystems due to xeric climate and the long human presence [51]. Therefore, climate will drive diversity patterns of different life forms, with annuals thriving in lowlands and their contribution to species richness decreasing towards higher elevations due to harsher environmental conditions (Hypothesis 1). However, is species richness variation along the elevation gradient increasing, decreasing, unimodal or of another form? Then, we explore how variation in species composition (β-diversity) varies along the elevational gradient by life form. The β-diversity patterns could be driven by differences in the size of the available species pool size [35], which will vary among life forms, resulting in life form dependent relationship between β-diversity and elevation. However, once we standardize for the size of the species pool, the effect of life form will diminish, indicating that other—deterministic and stochastic processes—also contribute to β-diversity (Hypothesis 2).

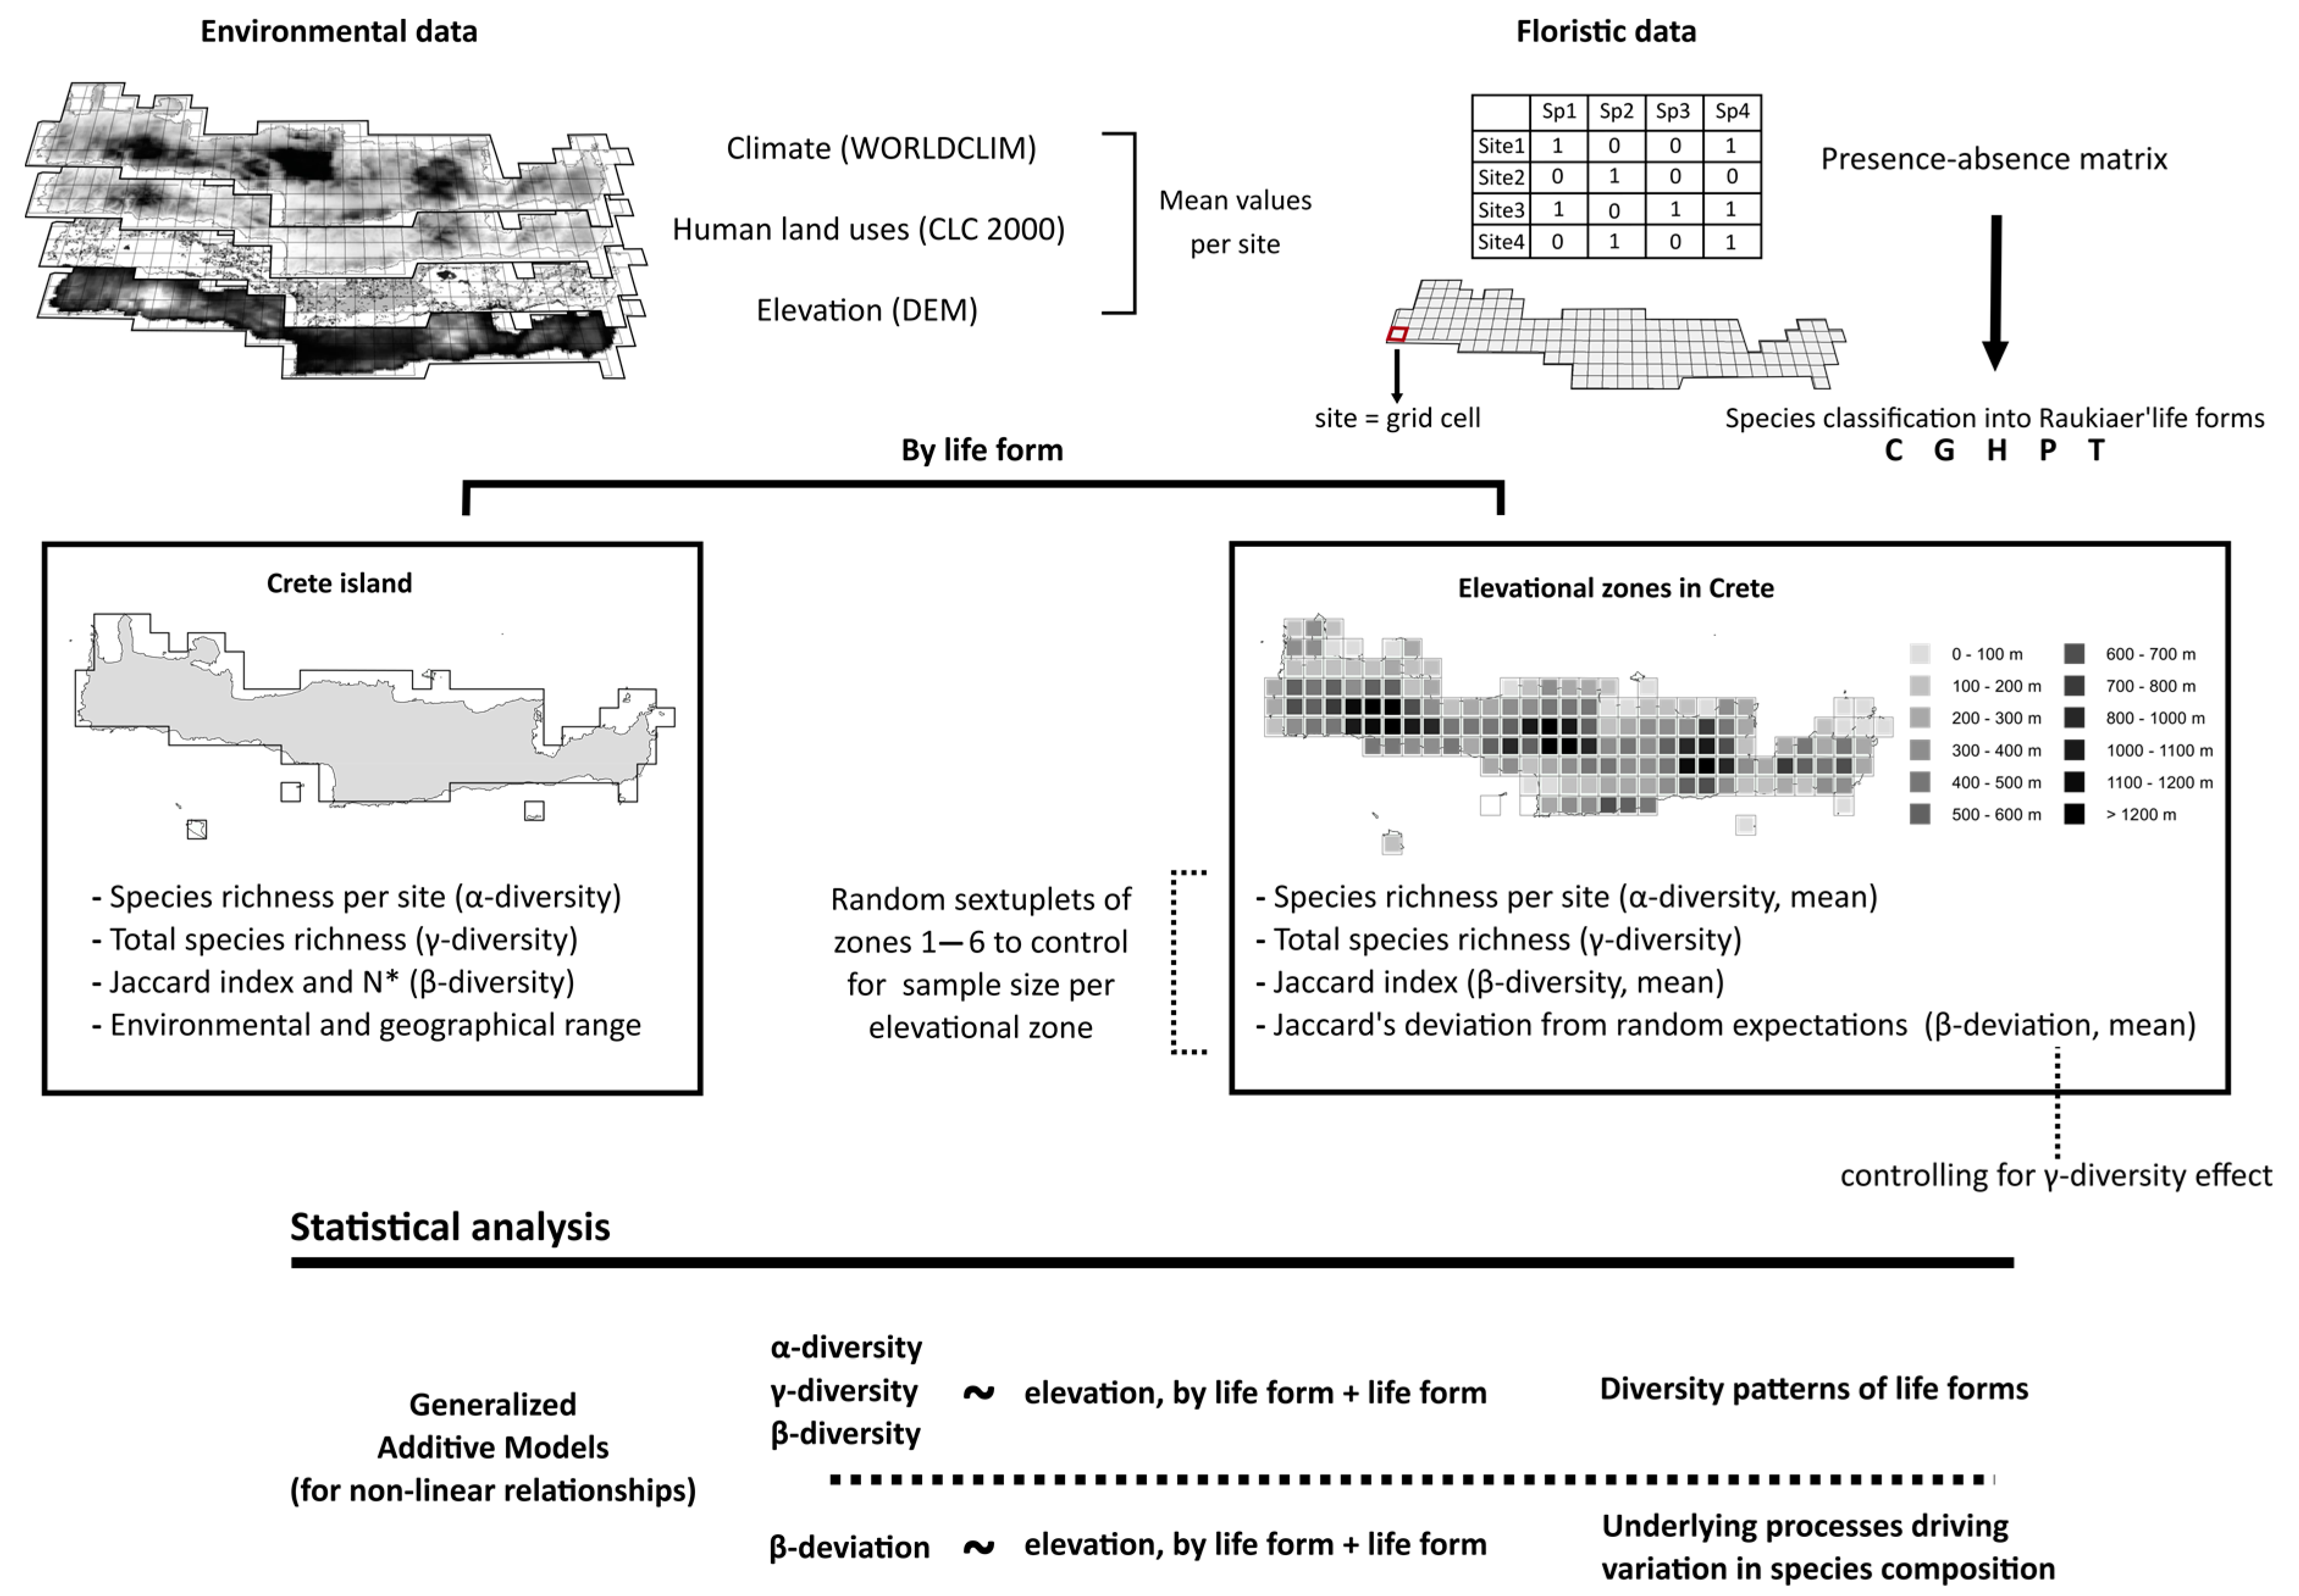
2. Materials and Methods

2.1. Study Area

The island of Crete, Greece, with an area of 8265 km2, is located in the eastern part of the Mediterranean region (Supplementary Material—Figure S1) and is characterized by a complex landscape. Three mountain massifs, Lefka Ori (2452 m), Psiloritis (2456 m), and Dikti (2148 m) loom in the western, central and eastern part of the island, respectively. The climate is typical Mediterranean with long hot and dry summers and mild winters, presenting strong differences between the western (more humid) and the eastern (more arid) part of the island. The island has a rich flora with 10% of the species being endemic, that is 171 species and subspecies [52], making it an important plant endemism and richness hotspot for the Mediterranean region [53] and global plant diversity center [54].

2.2. Floristic Data

The distribution maps of Cretan vascular plant species were obtained from the “Flora of the Cretan area: annotated checklist and atlas” of Turland et al. [52]. The atlas comprised of 160 grid cells (grid cell size: 8.25 × 8.25 km) which hereafter we refer to as sites. We used floristic data at the species level, and therefore 1536 species were included in the subsequent analyses. Among them, 1487 species were native, with 158 species being endemic to Crete, and 49 species were alien. In our study, we did not account for patterns between endemic species of Crete and widely distributed species, since the latter (non-endemics) have smaller elevational ranges in Crete [55] in comparison to geographically more restricted species such as the local Cretan endemics or the sub-endemics occurring in Crete and neighboring areas such as Karpathos-Kasos islands, Aegean Archipelago or Peloponnese. Raunkiaer’s [56] classification system of plant life forms is based on the position of perennating buds in relation to soil surface reflecting adaptations to protect their renewing buds. The species were classified into life forms following Raunkiaer’s framework [56]: hydrophytes (A: plant shoot system entirely or partly under water), chamaephytes (C: buds within 0.25 m above the soil surface protected by snow or plant’s parts), geophytes or cryptophytes (G: belowground buds as rhizomes or bulbs), hemicryptophytes (H: buds at or near to soil surface), phanerophytes (P: buds above the soil surface on aerial shoots), and therophytes (T: annual plants surviving the unfavorable season as seeds). Hydrophytes were excluded from the analyses due to the low number of species and the uneven distribution of them across the elevational gradient (18 species occurring in 22 sites).

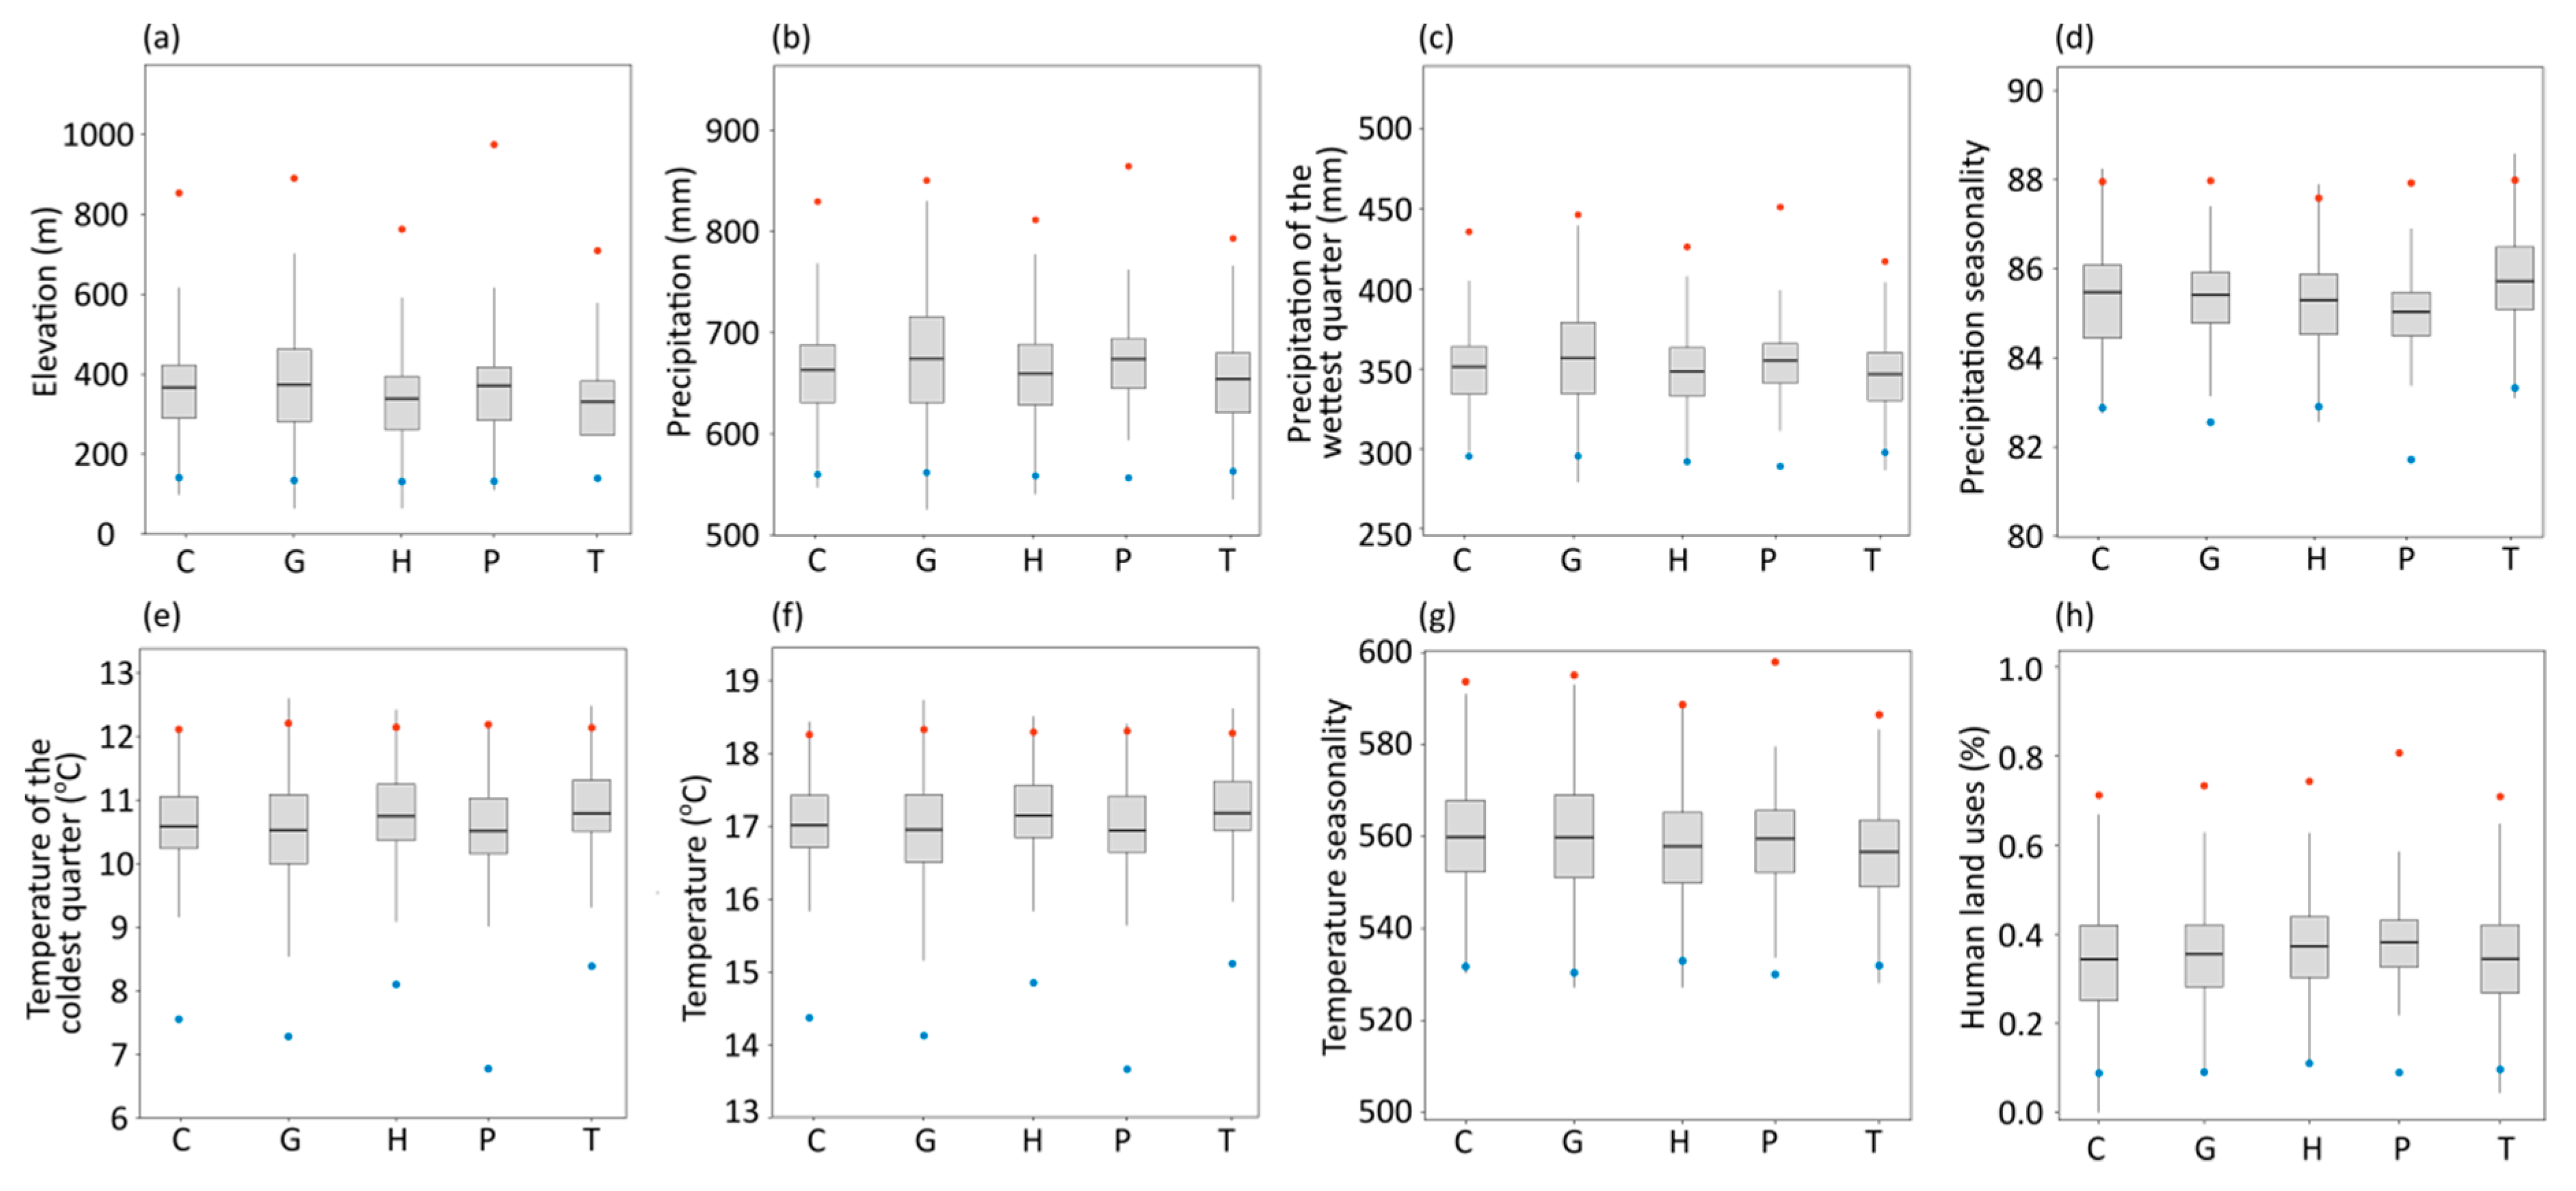
2.3. Elevation and Environmental Variables

A digital surface model produced in the framework of the Reference Data Access (RDA) Action of the EU GMES/Copernicus program (Copernicus Land Monitoring Services, 2018) was used to obtain elevation data. We applied zonal statistics to calculate the mean elevation per site (grid cell). Note that, due to the size of the grain, each site included variation in elevation, and given that we calculated mean values, the maximum observed elevation in our data, that is, 1614.01 m, was smaller than the one in Crete. We downloaded bioclimatic variables from WorldClim [57]. Then, we estimated mean values of each bioclimatic variable per site by aggregating grid cell values from the high-resolution WorldClim dataset (30 arc-seconds, ~1 km) using zonal statistics in ArcGIS 10.3. Furthermore, the CORINE Land Cover 2000 database (Copernicus Land Monitoring Services, 2018) was used to calculate the percentage of human land uses. The percentage was estimated as the proportion of the sum of the area with artificial surfaces, arable land, permanent crops, pastures, and heterogeneous agricultural areas to the total terrestrial area of the site. The calculations were performed using ArcGIS 10.3 (ArcGIS® software by ESRI Inc., Redlands, CA, USA).

2.4. Statistical Analysis
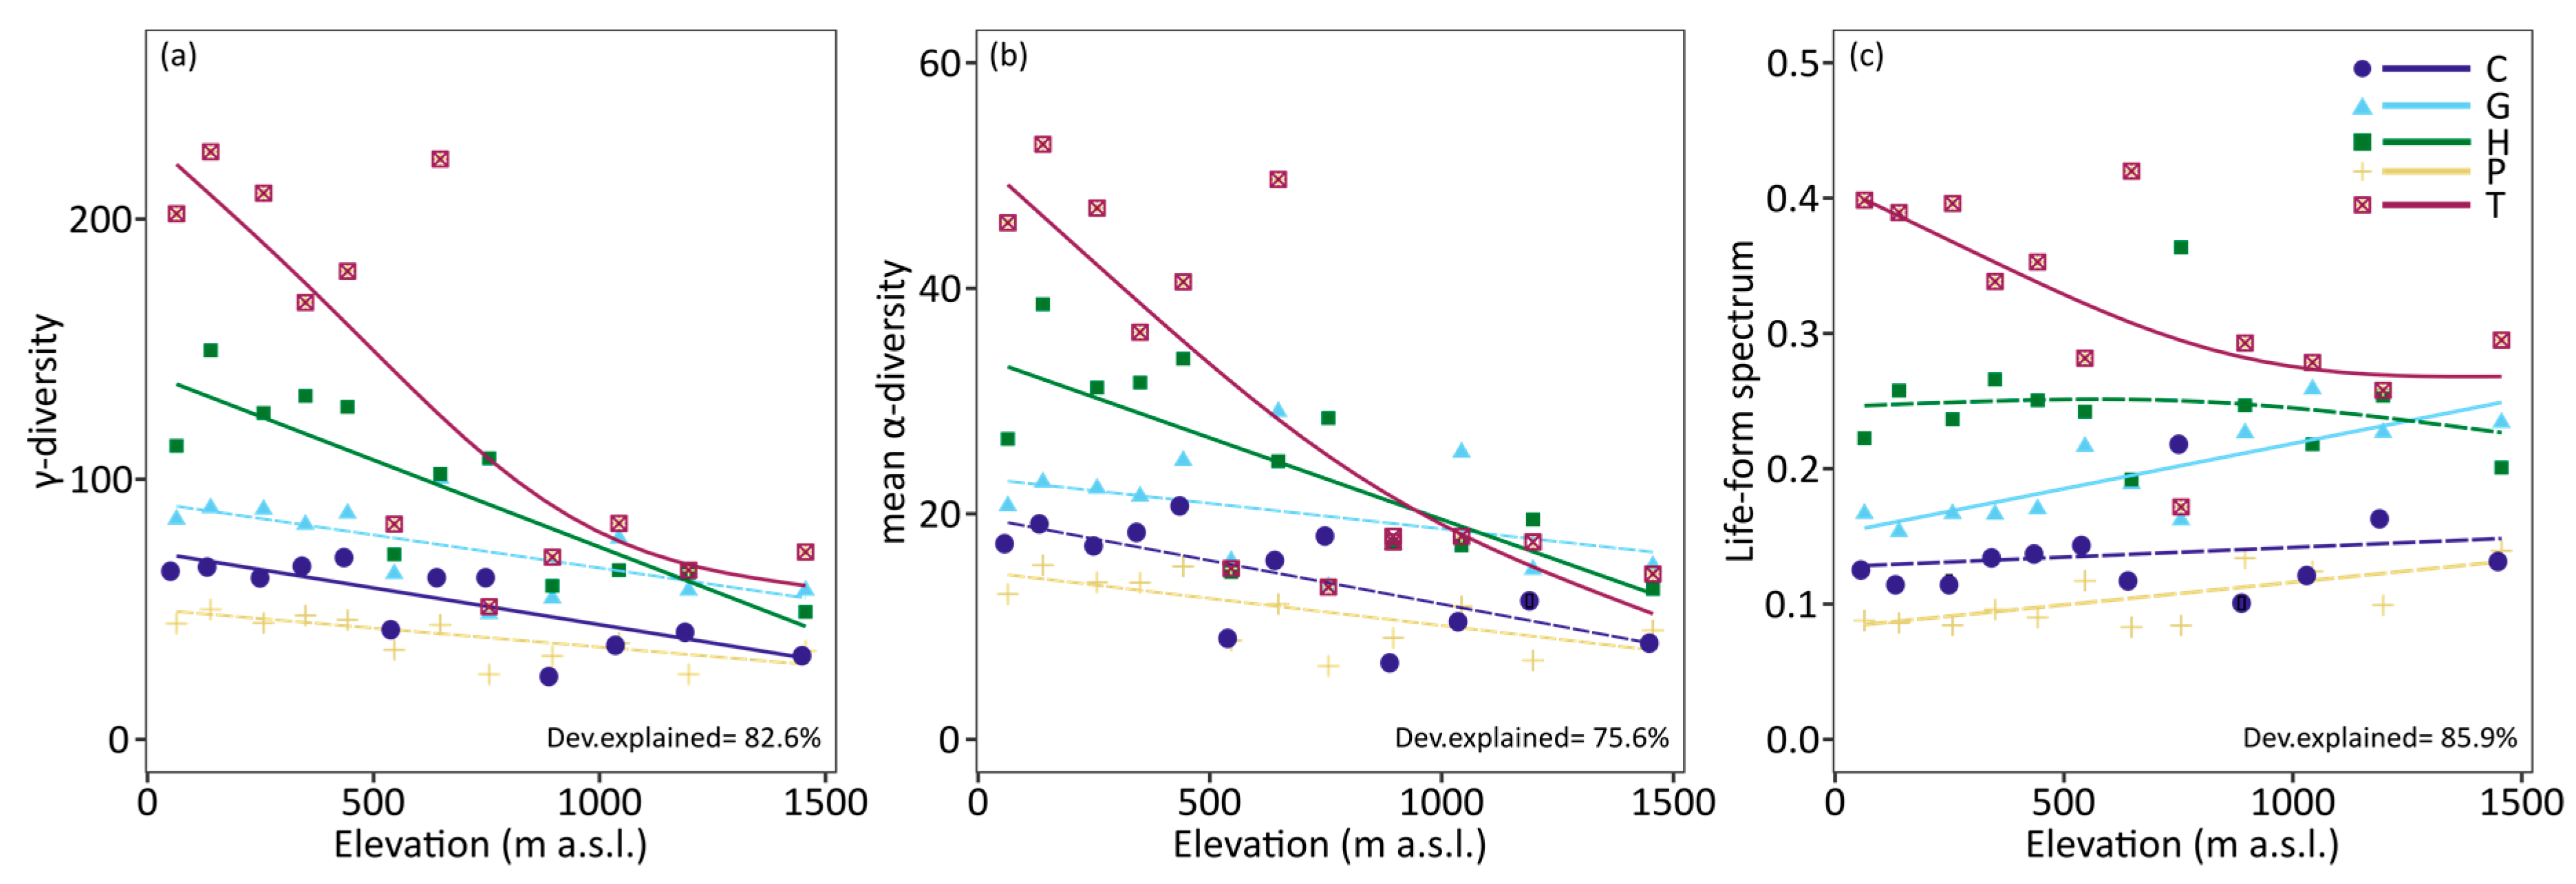
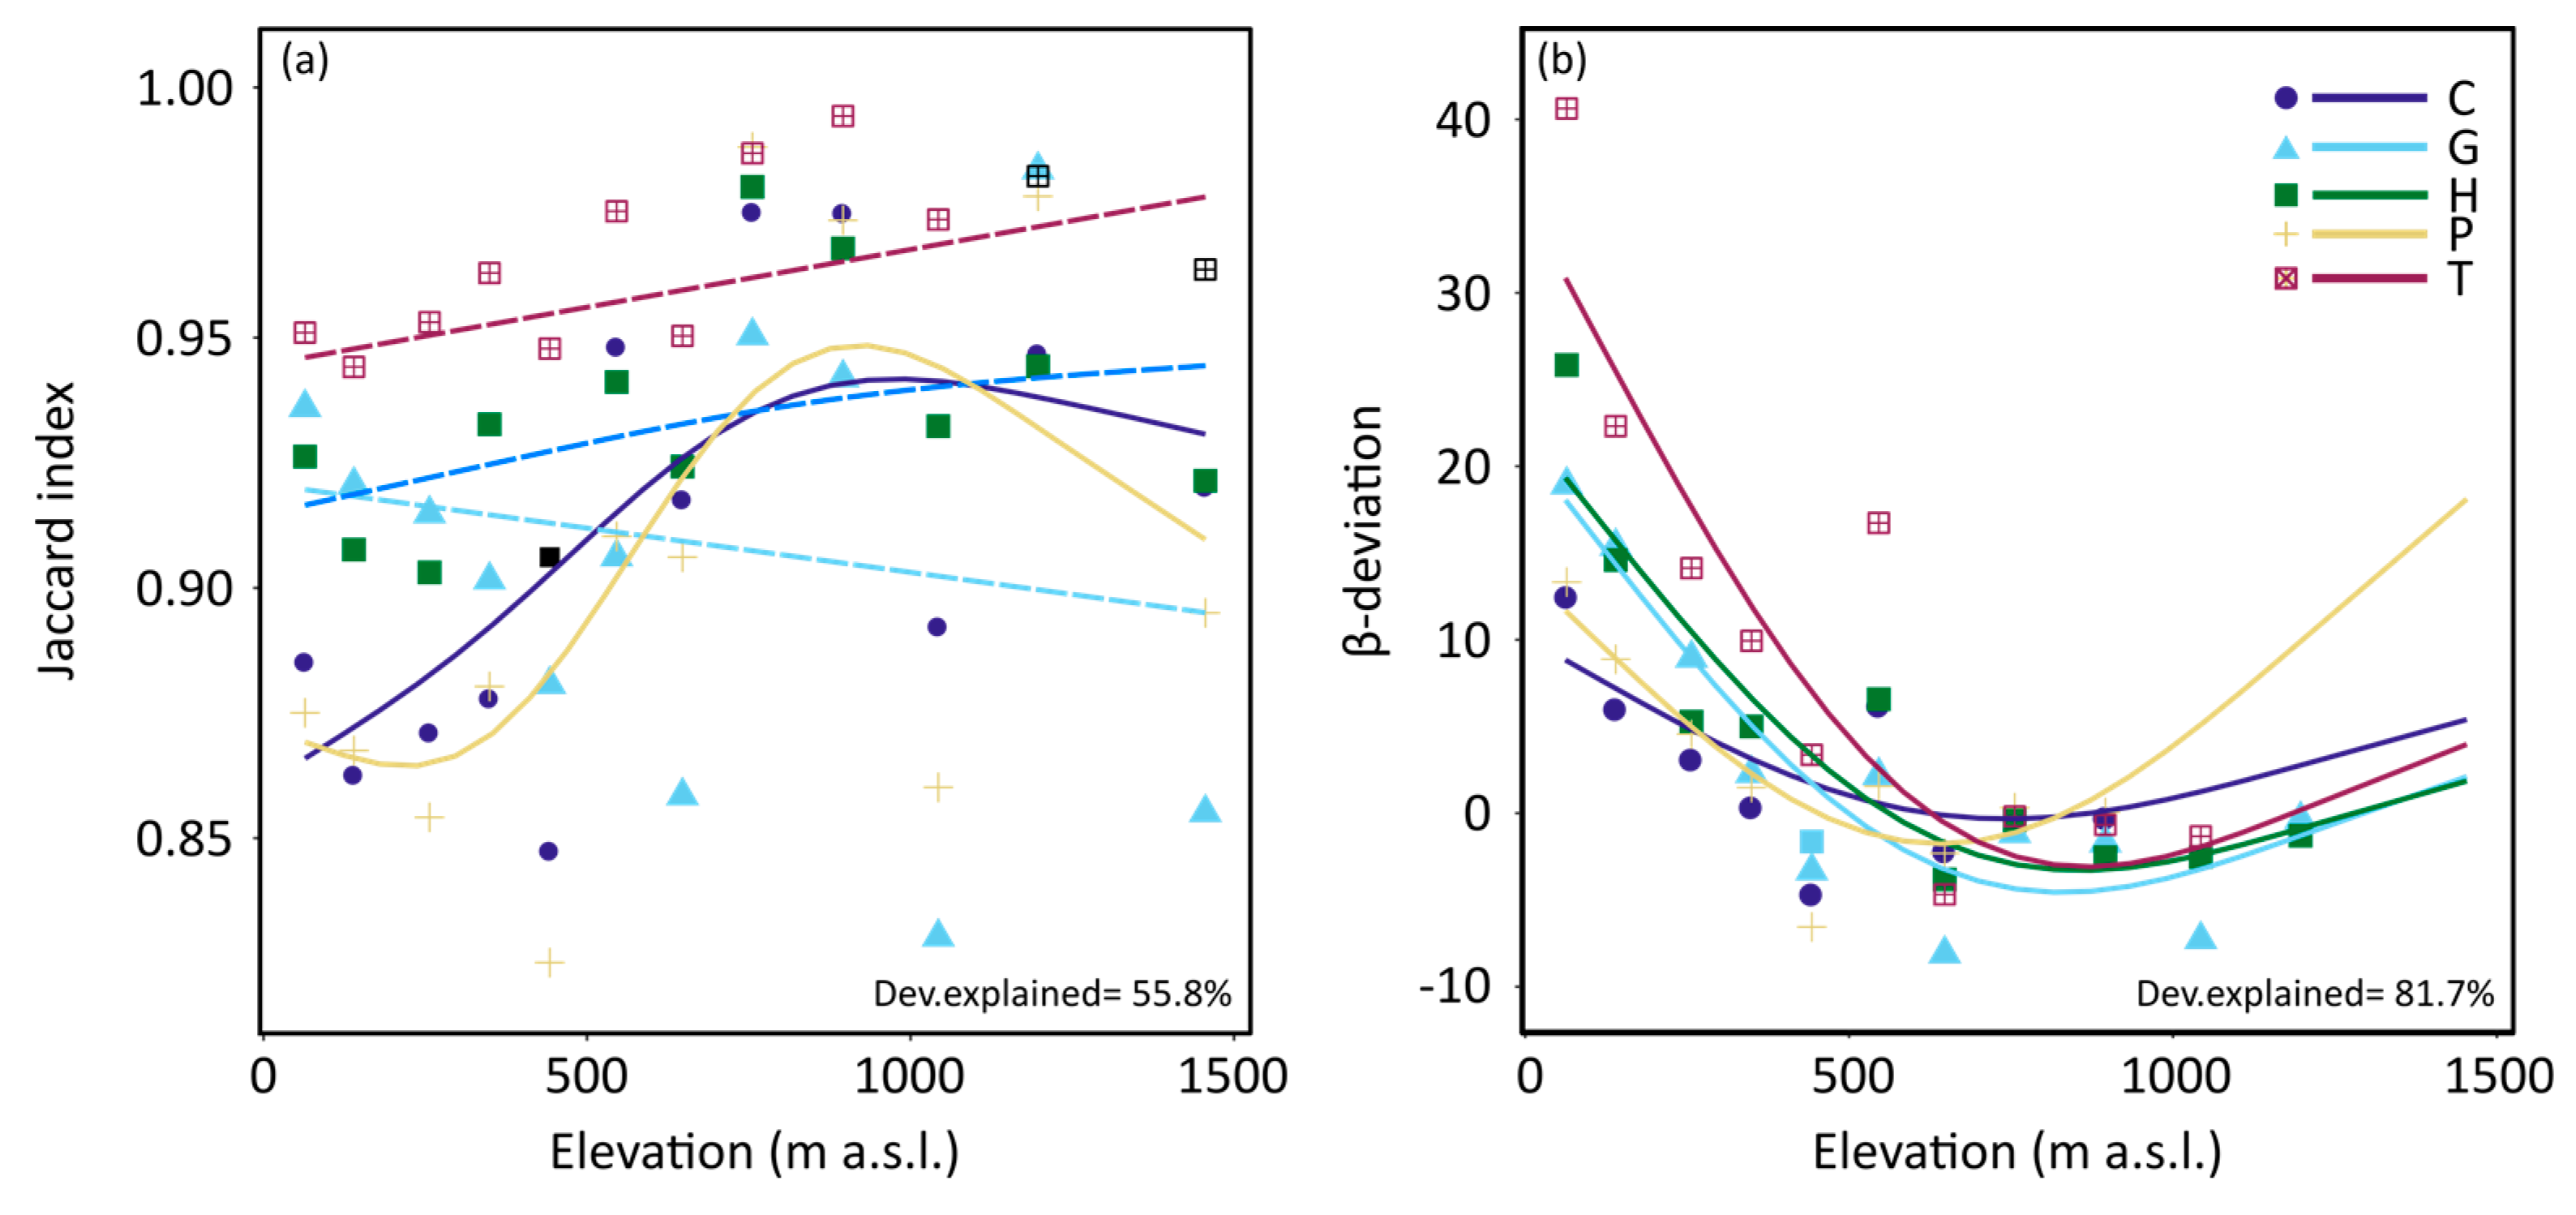
We investigated whether species of different life forms exhibit different elevational, environmental, and species’ distribution (geographical) ranges. We calculated the ranges of bioclimatic variables quantifying average (mean annual temperature and precipitation) and extreme (temperature of the coldest quarter and precipitation of the wettest quarter) conditions and variability (temperature and precipitation seasonality) for each life form. Temperature seasonality was estimated as the standard deviation of temperature among months and precipitation seasonality was estimated as the coefficient of variation of precipitation across months. Furthermore, we calculated and the ranges of the percentage of human land-uses. Specifically, for each species, we estimated the mean values of the elevation and environmental variables of the sites where the different species occur, the upper and lower bound, and range (upper minus lower value). Species’ distributions were quantified by the geographical range (number of occupied cells), and we also estimated the percentage of singletons and doubletons, that is, species with one or two occurrences. Differences among life forms were tested using permutational one-way Analysis of Variance (ANOVA) with function aovp of the lmPerm package [58], followed by Tukey HSD post-hoc tests in the case of significant differences.
We estimated γ-diversity, mean α-diversity, and β-diversity for each life form for the island of Crete. Gamma diversity and mean α-diversity were quantified as total species richness of the island and mean species richness per site using all the available sites (160 sites), respectively. Beta diversity was quantified by the widely used presence/absence pairwise Jaccard index, thus allowing comparison among regions and studies, with the package vegan [59] and the N* index [60]. For each life form, we estimated the Jaccard index for all pairwise combinations of sites by the formula 1 − a a + b + c , where a   is the species common in both sites, b the species present in the first site and c the species present only in the second site. Then, we estimated the mean Jaccard index for Crete as the mean of all pairwise compositional dissimilarity values. The N* index is mathematically independent of α-diversity and reflects the heterogeneity of species composition, and the variation in species occupancies among samples. The index is defined as the average sampling effort, that is, the number of sites, at which the total number of shared species occurrences became equal to species richness. The index was estimated for the island of Crete as the intersection point between the line y = (ā/2)n and S(n), where ā is the mean α-diversity, n the number of sites and S(n) the average species accumulation curve, using the functions provided in Lazarina, Sgardeli, Kallimanis and Sgardelis [60].
We defined 12 elevational zones across Crete so that each zone represents approximately the same elevational range (Supplementary Material—Table S1), with the exception of the 800–1000 m zone and the above 1200 m where due to lack of samples, a larger elevational range was included. Due to the variation in the number of sites that each elevational zone included (Supplementary Material—Table S1), we formed 1000 sub-sets (permutations) by selecting six of the available sites of the six first elevational zones and estimated life form-spectrum, γ-diversity, mean α-diversity and β-diversity. For the remaining elevational zones we used all the available sites to estimate the diversity indices. Specifically, the life-form spectrum was estimated as the proportion of species richness per life form and elevational zone. Next, we estimated γ-diversity and mean α-diversity as the total species richness and mean species richness of sites included in each elevational zone, and constructed species accumulation curves per elevational zone and life form. Beta diversity was quantified by the mean Jaccard index for each elevational zone and life form, that is, the mean pairwise compositional dissimilarity of sites of each elevational zone. As β-diversity can be driven by differences in species pool [35], we estimated the deviation of observed β-diversity from null expectations (β-deviations; observed minus expected value divided by the expected values’ standard deviation). To this end, we generated null communities (500 random matrices) using the proportional–proportional algorithm (PP-algorithm, [61]) which creates null presence–absence species matrices by resampling the original matrix proportional to observed row (number of species occurrences) and column (α-diversity) totals, but keeping constant average row and column totals. Note that for the elevational zones, for which sub-sets of six samples were used, we averaged the diversity indices estimated by the permutations.
Prior to analysis, cross-correlations (Pearson correlation coefficient, r) indicated strong multicollinearity among elevation and bioclimatic variables and percentage of human land uses (r > 0.78 and p < 0.005 in all pairwise comparisons). Given the multicollinearity, we tested only for the effect of elevation (mean value within each elevational zone) and life form on different facets of diversity. Figure S2 of the Supplementary Material summarizes the relationship between elevation and bioclimatic variables and the percentage of human land uses along the elevational gradient.
Given that the relationship between elevation and facets of diversity may be non-linear, we used Generalized Additive Models (GAMs, [62]) to explore the diversity patterns of different life forms along the elevational gradient without making assumptions about the functional form of the modeled relationships. Elevation entered the model as smooth predictor with the default penalized thin plate regression splines setting number of knots equal to five, and the relationship was modeled by life form. Life form entered the model as a random factor variable with five levels, which are chamaephytes, geophytes, hemicryptophytes, phanerophytes, and therophytes. We used Poisson error distribution and log link function for the analysis of γ-diversity (count data) and Gaussian error distribution for all the other diversity metrics that are continuous quantitative variables. The analyses were performed using the mgcv R package [63]. Finally, we explored how the proportion of each life form varies with elevation and also, the relationship between elevation and temperature- and precipitation-related variables and percentage of human land uses using GAMs (Gaussian error distribution and identity link function). All analyses were performed using R version 3.1.0 [64]. Figure 1 provides an illustration diagram of the statistical analysis we performed to explore the diversity patterns of different life forms and underlying processes governing them.

3. Results

Out of the 1518 vascular plant species included in the analyses, 176 species were chamaephytes, 227 geophytes, 379 hemicryptophytes, 100 phanerophytes, and 636 therophytes (Table 1). In terms of mean α-diversity, therophytes and phanerophytes were the richer and poorer groups, respectively (Table 1, Supplementary Material—Figure S1). Different life forms showed significantly different elevational ranges, with the temperature setting the upper limit and precipitation the lower limit of occurrence. Phanerophytes exhibited the wider and therophytes the narrower range on average (Table 1), primarily due to significantly different mean and upper elevation of occurrence (Supplementary Material—Table S2). Figure 2 depicts the elevational and environmental ranges of different life forms. Differences in elevational range were consistent with differences in environmental ranges of different life forms. We found that life forms differed significantly in the temperature (mean and minimum value), precipitation (mean and maximum value), and percentage of human land uses (mean and maximum value) of sites of occurrence (Figure 2, Supplementary Material—Table S2). Therophytes and geophytes exhibited the most prominent different environmental ranges, with therophytes occurring in sites with significantly higher temperature (mean and maximum), while geophytes occurred in sites with significantly higher precipitation. Therophytes and phanerophytes exhibited the highest and the lowest β-diversity, respectively, across the study area (Table 1). Phanerophytes, the species-poorer group (lower mean α-diversity and γ-diversity), were on average significantly more widespread with only a few of them being singletons or doubletons (Table 1). Therefore, this life form exhibited lower β-diversity than other life forms. The highest β-diversity was observed for therophytes, the species-richer group, with the smaller mean geographical range and the highest percentage of singletons and doubletons.
There was a strong elevational gradient of temperature and precipitation related variables, and the percentage of human land uses (Supplementary Material—Figure S2). Specifically, temperature (mean annual and of the coldest quarter) and precipitation seasonality decreased approximately linearly with increasing elevation, while precipitation (mean annual and of the wettest quarter) and temperature seasonality increased linearly (deviance explained > 70% in all cases). The relationship between elevation and the percentage of human land uses was hump-shaped, with the percentage of human land uses peaking at the 300–400 m elevational zone (deviance explained = 55.7%).
Therophyte γ-diversity was higher than γ-diversity of other life forms almost in all the elevational zones (Figure 3a, Supplementary Material—Table S3). The constructed species accumulation curves highlighted the differences in γ-diversity (Supplementary Material—Figure S4). This was also the case for the mean α-diversity. Only geophytes demonstrated slightly higher mean α-diversity at the maximal elevational zone (Supplementary Material—Table S3). Gamma diversity depended significantly on life form (p < 0.001) and decreased significantly and approximately linearly with increasing elevation for chamaephytes, hemicryptophytes, and therophytes (deviance explained = 82.6%, Figure 3a). Therophytes exhibited the steepest decrease with elevation. Alpha diversity was significantly different among life forms (p < 0.001), but only hemicryptophyte and therophyte α-diversity decreased significantly (p < 0.001) and linearly with elevation (deviance explained = 75.6%, Figure 3b). The proportion of geophytes significantly increased monotonically with elevation, while that of therophytes decreased (Figure 3c). Chamaephytes and phanerophytes tended to increase with increasing elevation, but the relationships were not significant.
All life forms exhibited high values of β-diversity quantified by the Jaccard index across all the elevational zones. The model predicting β-diversity as a function of life form and elevation explained 55.8% of the deviance in β-diversity. Beta-diversity was significantly affected by life form, and the relationship between β-diversity and elevation was significant for chamaephytes and phanerophytes (elevation by life forms: chamaephytes p = 0.03, phanerophytes p = 0.02). Specifically, the Jaccard index increased up to mid-elevations (i.e., 800–1000 m) for both chamaephytes and phanerophytes and then decreased (Figure 4a). After accounting for the species pool effect, the effect of elevation on β-deviation (calculated as the observed–expected value divided by the expected values’ standard deviation) persisted, but life form had no significant effect. Note that at two maximal elevational zones, β-deviation could not be estimated, due to the low number of species. Beta-deviation decreased up to 800 m with increasing elevation and then slightly increased approaching zero up to 1000 m for almost all life forms.

4. Discussion

The insular character, the variety of environmental conditions and the complex landscape of Crete have given rise to the rich Cretan flora with numerous endemic species. The island plant species richness is driven by factors like area and isolation as predicted by the theory of the island biogeography [3]. However, abiotic factors such as elevation as a proxy for habitat heterogeneity and elevation-driven ecological isolation contribute to species richness [5,65]. Furthermore, abiotic conditions (e.g., elevation and climate) select through environmental filtering plant species with traits that allow them to persist and co-exist [66]. As a result, associations between key plant traits and environmental conditions emerge [67]. In this study, using Raunkiaer’s life form classification that describes life strategies associated with plants’ ability to survive in specific environmental conditions, we found that the species richness (α-and γ-diversity), and also variation in species composition (β-diversity) varies with life form along an elevational gradient in Crete.
The relationship between γ-diversity and elevation was negative for all life forms as has been previously reported for other regions and type of ecosystems [23,38,68]. The lower species richness observed at higher elevational zones may be partly due to the area effect, as area decreases with increasing elevation due to conical shape of mountains [69], and therefore according to species-area relationship, the species richness also decreases [22]. Furthermore, the higher species richness in lowlands of Crete may be attributed to the long-standing human activities since ancient times which are mainly confined to lowland areas and the proportionally increased dispersal of synanthropistic species (both native and aliens) favored by them. Our results are fully consistent with Trigas, Panitsa and Tsiftsis [55] findings that total species richness decreased with elevation, and only single island endemic species richness followed a unimodal relationship with elevation, peaking at 1500 m. The pattern is related to the geodynamic evolution of Crete, indicating that a true mountain flora was never extant on Crete [55], thus the islands’ flora is mainly comprised of lowland species able to withstand the harsh mountain environmental conditions and resulting in colonization of the newly formed (in geological terms) Cretan mountains.
The shape of the relationship between γ-diversity and elevation was consistent among life forms, but the relationship was significant only for chamaephytes, hemicryptophytes, and therophytes. However, the slopes varied among these life forms, reflecting different elevational and environmental ranges of species aggregated in life forms [56,70]. Therophytes due to their ability to withstand the thermo-xeric climate of this Mediterranean hotspot, were the species richer group regionally (γ-diversity) and locally (α-diversity) in the whole island of Crete (accounting for 42% of the flora) and along its elevational gradient, as has been previously reported for Aegean islands [71]. However, therophytes decreased more sharply with elevation, suggesting that many species of this life form cannot tolerate the climate shifts along the elevational gradient, that is, decreasing temperature and increasing precipitation. Therophytes tended to occur in sites with the warmer and drier conditions [56,70], accompanied by higher degree of precipitation seasonality [70] at island’s lowlands. Furthermore, the therophyte life form is linked to disturbances in Mediterranean ecosystems [33], and lowlands of the island are more disturbed by human activities, although this was not reflected in the percentage of human land uses of therophyte’s occurrence sites. Fewer and fewer species of these life forms could be found, both regionally and locally, with increasing elevation. However, hemicryptophytes, the second species richer group, decreased less sharply with increasing elevation than therophytes. It seems that the position of their buds close to soil surface offers them some protection from the less benign environmental conditions prevailing at higher elevations [72]. Hemicryptophytes have better odds of survival at low and intermediate elevations where the lengthened growth period allows for lateral growth [73]. Chamaephytes start far behind in terms of species richness, but decreased less sharply with elevation, while we did not detect a significant pattern in α-diversity. This life form seems to cope better with mountainous environmental conditions than the aforementioned life forms. It is possible that due to their short and compact size, chamaephytes can use the heat that accumulates close in the soil better [69], which enables them to complete their life cycle successfully even in the short growing periods observed at high elevations [74,75]. Phanerophytes, the species-poorer group, tended to occur in wider ranges (environmental and elevational) than other life forms and contributed slightly more to total species richness at the maximal elevational zone, possibly due to their preference for colder and wetter conditions, and also for less disturbed conditions [76]. Their ranges combined with their low proportion (did not exceed 15% in all the elevational zones) perhaps explain the lack of significant relationships between elevation and either γ-diversity or α-diversity. Here, we did not detect a significant pattern in geophyte species richness (both γ- and α-diversity), but their proportion in the species richness increased significantly along the elevational gradient, thus along the precipitation gradient. Geophytes are common in Mediterranean-type ecosystems favored by the high degree of precipitation seasonality. Procheş, et al. [77] and Danin and Orshan [78] found that geophytes increased along a precipitation gradient in a Mediterranean ecosystem. With the proportion of geophytes increasing and of therophytes decreasing with increasing elevation, the acute differences in species richness observed at lowlands are dampened. Therefore, our initial hypothesis that climate drives diversity patterns of different life forms, with therophytes thriving in lowlands and its contribution to species richness decreasing towards higher elevations was confirmed.
All life forms exhibited high variation in species composition, that is, high species turnover. This is in accordance with the higher slopes reported for island species-area relationship predicted by the theory of island biogeography [6]. Beta diversity as was predicted by our first hypothesis varied with respect to life form. Therophytes with many species occurring in one or two sites had the higher β-diversity at all the elevational zones. However, low variation in β-diversity among the different zones explains the non-significant relationship of therophyte β-diversity with elevation, and this may apply also to hemicryptophytes. The elevation had a significant effect on chamaephyte and phanerophyte β-diversity, peaking at 800–1000 m elevational zone. The pattern is congruent with the reported hump-shaped relationships with the peak at mid-elevations for plants [79,80,81] and other taxonomic groups [40,82]. It is possible that beyond this elevational zone, certain species belonging to chamaephyte and phanerophyte life forms with specific traits that allow them to cope with more stressful conditions tend to co-occur, resulting in lower β-diversity than lower elevations. Kazakis, Ghosn, Vogiatzakis and Papanastasis [79] found that the relationship between β-diversity of vascular plant diversity of Lefka Ori massif in Crete and elevation was hump-shaped peaking at the 1664–1965 m elevational zone, that is the transition zones from montane to sub-alpine and alpine zones. After accounting for the effect of the species pool size on β-diversity, elevation had a significant effect on β-deviation, but the life form effect diminished as was predicted by our formulated hypothesis. Thus, the same assembly processes drive species composition and its variation of all life forms. Beta-diversity was higher than null expectations up to approximately 300–400 m elevation suggesting that species distributions are more aggregated than randomly expected at the lowlands. A possible explanation could be a stronger effect of environmental filtering at the lowlands due to hotter and drier conditions. Furthermore, the pattern may be associated with increased human activity at the lowlands. The effect of human activities on β-diversity is complex, including urbanization and socioeconomic factors [83,84]. Spatially-heterogeneous (patchy) human land uses can increase habitat heterogeneity, and thus β-diversity [85]. Beyond this elevational threshold, β-diversity is close to null expectations, suggesting that differences in γ-diversity drive variations in species composition of all life forms. Therefore, the observed patterns imply that the strength of local community assembly mechanisms decreases with elevation [36,37], and large-scale processes override local ecological processes at higher elevations. Sabatini, Jiménez-Alfaro, Burrascano, Lora and Chytrý [37] observed higher than expected β-diversity up at approximately 600 m elevation, for vascular plant diversity in Czech temperate forests. The authors proposed as possible explanations the wider habitat heterogeneity, area, and landscape heterogeneity of lowlands, mechanisms related to higher productivity, and an extension of Rapoport-Rescue hypothesis. Here, we observed positive values at lower elevations, and perhaps, this could be a region-specific difference that is, temperate vs. Mediterranean regions or/and ecosystem-specific difference that is mainland vs. island. Therefore, further research from different ecosystems across regions is needed to tease out the underlying mechanisms shaping variation in species composition of different life forms along elevational gradients. All in all, the species composition of different life forms is the result of the combined effects of large-scale processes [35] dependent on life forms through the size of the regional species pool (e.g., adaptation, speciation, and extinction), and of deterministic or stochastic processes (e.g., environmental filtering and disturbances due to human activities) acting in a similar way for different life forms.

Supplementary Materials

The following are available online at https://0-www-mdpi-com.brum.beds.ac.uk/1424-2818/11/10/200/s1, Table S1: Mean elevation (elevational range) and sites of the 12 elevational zones in the study area of Crete, Greece, Table S2: Elevational and environmental ranges of species of different life forms in the whole island of Crete, Greece, Table S3: Diversity indices of life forms of the 12 elevational zones in the study area of Crete, Greece, Table S4: Summary statistics of Generalized Additive Models predicting γ-diversity, mean α-diversity, β-diversity and β-deviation along an elevational gradient in Crete, Figure S1: Map of the study area, Figure S2: The elevational gradient of bioclimatic variables and the percentage of human land uses across the 12 elevational zones in Crete, Greece, Figure S3: Species accumulation curves of different life forms in the 12 formulated elevational zones in Crete, Greece.

Author Contributions

M.L. and S.P.S. conceived and designed the study; M.P. and D.-E.M. contributed to the data preparation; M.L. performed the statistical analysis; M.L., A.C., M.P., N.K., D.-E.M., A.S.K. and S.P.S. contributed to the results interpretation and to the writing—review of the manuscript.

Funding

State Scholarships Foundation: MIS 5001552.

Acknowledgments

This research is co-financed by Greece and the European Union (European Social Fund- ESF) through the Operational Programme «Human Resources Development, Education and Lifelong Learning» in the context of the project “Reinforcement of Postdoctoral Researchers” (MIS-5001552), implemented by the State Scholarships Foundation (IKΥ).

Conflicts of Interest

The authors declare no conflict of interest.

References

  1. Tershy, B.R.; Shen, K.-W.; Newton, K.M.; Holmes, N.D.; Croll, D.A. The importance of islands for the protection of biological and linguistic diversity. Bioscience 2015, 65, 592–597. [Google Scholar] [CrossRef]
  2. Whittaker, R.J.; Fernández-Palacios, J.M.; Matthews, T.J.; Borregaard, M.K.; Triantis, K.A. Island biogeography: Taking the long view of nature’s laboratories. Science 2017, 357, eaam8326. [Google Scholar] [CrossRef] [PubMed]
  3. MacArthur, R.H.; Wilson, E.O. An equilibrium theory of insular zoogeography. Evolution 1963, 17, 373–387. [Google Scholar] [CrossRef]
  4. Hortal, J.; Triantis, K.A.; Meiri, S.; Thébault, E.; Sfenthourakis, S. Island species richness increases with habitat diversity. Am. Nat. 2009, 174, E205–E217. [Google Scholar] [CrossRef]
  5. Kallimanis, A.; Bergmeier, E.; Panitsa, M.; Georghiou, K.; Delipetrou, P.; Dimopoulos, P. Biogeographical determinants for total and endemic species richness in a continental archipelago. Biodivers. Conserv. 2010, 19, 1225–1235. [Google Scholar] [CrossRef]
  6. Triantis, K.A.; Guilhaumon, F.; Whittaker, R.J. The island species–area relationship: Biology and statistics. J. Biogeogr. 2012, 39, 215–231. [Google Scholar] [CrossRef]
  7. Whittaker, R.H. Gradient analysis of vegetation. Biol. Rev. 1967, 42, 207–264. [Google Scholar] [CrossRef]
  8. Körner, C. The use of ‘altitude’in ecological research. Trends Ecol. Evol. 2007, 22, 569–574. [Google Scholar] [CrossRef]
  9. Sundqvist, M.K.; Sanders, N.J.; Wardle, D.A. Community and ecosystem responses to elevational gradients: Processes, mechanisms, and insights for global change. Annu. Rev. Ecol. Evol. Syst. 2013, 44, 261–280. [Google Scholar] [CrossRef]
  10. McGill, B.J.; Enquist, B.J.; Weiher, E.; Westoby, M. Rebuilding community ecology from functional traits. Trends Ecol. Evol. 2006, 21, 178–185. [Google Scholar] [CrossRef]
  11. Thuiller, W.; Lavorel, S.; Araújo, M.B. Niche properties and geographical extent as predictors of species sensitivity to climate change. Glob. Ecol. Biogeogr. 2005, 14, 347–357. [Google Scholar] [CrossRef]
  12. Newbold, T.; Scharlemann, J.P.; Butchart, S.H.; Şekercioğlu, Ç.H.; Alkemade, R.; Booth, H.; Purves, D.W. Ecological traits affect the response of tropical forest bird species to land-use intensity. Proc. R. Soc. B Biol. Sci. 2013, 280, 20122131. [Google Scholar] [CrossRef] [PubMed] [Green Version]
  13. Cornelissen, J.; Lavorel, S.; Garnier, E.; Diaz, S.; Buchmann, N.; Gurvich, D.; Reich, P.B.; Ter Steege, H.; Morgan, H.; Van Der Heijden, M. A handbook of protocols for standardised and easy measurement of plant functional traits worldwide. Aust. J. Bot. 2003, 51, 335–380. [Google Scholar] [CrossRef] [Green Version]
  14. Klimes, L. Life-forms and clonality of vascular plants along an altitudinal gradient in E Ladakh (NW Himalayas). Basic Appl. Ecol. 2003, 4, 317–328. [Google Scholar] [CrossRef] [Green Version]
  15. Castro, H.; Lehsten, V.; Lavorel, S.; Freitas, H. Functional response traits in relation to land use change in the Montado. Agric. Ecosyst. Environ. 2010, 137, 183–191. [Google Scholar] [CrossRef]
  16. Boulangeat, I.; Lavergne, S.; Van Es, J.; Garraud, L.; Thuiller, W. Niche breadth, rarity and ecological characteristics within a regional flora spanning large environmental gradients. J. Biogeogr. 2012, 39, 204–214. [Google Scholar] [CrossRef]
  17. Broennimann, O.; Vittoz, P.; Moser, D.; Guisan, A. Rarity types among plant species with high conservation priority in Switzerland. Bot. Helv. 2005, 115, 95–108. [Google Scholar] [CrossRef] [Green Version]
  18. Chiarucci, A.; Fattorini, S.; Foggi, B.; Landi, S.; Lazzaro, L.; Podani, J.; Simberloff, D. Plant recording across two centuries reveals dramatic changes in species diversity of a Mediterranean archipelago. Sci. Rep. 2017, 7, 5415. [Google Scholar] [CrossRef]
  19. Ebeling, A.; Pompe, S.; Baade, J.; Eisenhauer, N.; Hillebrand, H.; Proulx, R.; Roscher, C.; Schmid, B.; Wirth, C.; Weisser, W.W. A trait-based experimental approach to understand the mechanisms underlying biodiversity–ecosystem functioning relationships. Basic Appl. Ecol. 2014, 15, 229–240. [Google Scholar] [CrossRef]
  20. De Bello, F.; Lepš, J.; Sebastià, M.T. Variations in species and functional plant diversity along climatic and grazing gradients. Ecography 2006, 29, 801–810. [Google Scholar] [CrossRef]
  21. Marini, L.; Battisti, A.; Bona, E.; Federici, G.; Martini, F.; Pautasso, M.; Hulme, P.E. Alien and native plant life-forms respond differently to human and climate pressures. Glob. Ecol. Biogeogr. 2012, 21, 534–544. [Google Scholar] [CrossRef]
  22. Lomolino, M.V. Elevation gradients of species-density: Historical and prospective views. Glob. Ecol. Biogeogr. 2001, 10, 3–13. [Google Scholar] [CrossRef]
  23. Rahbek, C. The role of spatial scale and the perception of large-scale species-richness patterns. Ecol. Lett. 2005, 8, 224–239. [Google Scholar] [CrossRef]
  24. Rahbek, C. The elevational gradient of species richness: A uniform pattern? Ecography 1995, 18, 200–205. [Google Scholar] [CrossRef]
  25. McCain, C.M.; Grytnes, J.A. Elevational gradients in species richness. In Encyclopedia of Life Sciences; Wiley: Chichester, UK, 2010. [Google Scholar]
  26. Nogués-Bravo, D.; Araújo, M.; Romdal, T.; Rahbek, C. Scale effects and human impact on the elevational species richness gradients. Nature 2008, 453, 216. [Google Scholar] [CrossRef]
  27. Wang, G.; Zhou, G.; Yang, L.; Li, Z. Distribution, species diversity and life-form spectra of plant communities along an altitudinal gradient in the northern slopes of Qilianshan Mountains, Gansu, China. Plant Ecol. 2003, 165, 169–181. [Google Scholar] [CrossRef]
  28. Bhattarai, K.R.; Vetaas, O.R. Variation in plant species richness of different life forms along a subtropical elevation gradient in the Himalayas, east Nepal. Glob. Ecol. Biogeogr. 2003, 12, 327–340. [Google Scholar] [CrossRef]
  29. Watkins Jr, J.E.; Cardelús, C.; Colwell, R.K.; Moran, R.C. Species richness and distribution of ferns along an elevational gradient in Costa Rica. Am. J. Bot. 2006, 93, 73–83. [Google Scholar] [CrossRef]
  30. Desalegn, W.; Beierkuhnlein, C. Plant species and growth form richness along altitudinal gradients in the southwest Ethiopian highlands. J. Veg. Sci. 2010, 21, 617–626. [Google Scholar] [CrossRef]
  31. Sharma, N.; Behera, M.D.; Das, A.P.; Panda, R.M. Plant richness pattern in an elevation gradient in the Eastern Himalaya. Biodivers. Conserv. 2019, 28, 1–20. [Google Scholar] [CrossRef]
  32. Anderson, M.J.; Crist, T.O.; Chase, J.M.; Vellend, M.; Inouye, B.D.; Freestone, A.L.; Sanders, N.J.; Cornell, H.V.; Comita, L.S.; Davies, K.F. Navigating the multiple meanings of β diversity: A roadmap for the practicing ecologist. Ecol. Lett. 2011, 14, 19–28. [Google Scholar] [CrossRef] [PubMed]
  33. Panitsa, M.; Tzanoudakis, D.; Sfenthourakis, S. Turnover of plants on small islets of the eastern Aegean Sea within two decades. J. Biogeogr. 2008, 35, 1049–1061. [Google Scholar] [CrossRef]
  34. Sang, W. Plant diversity patterns and their relationships with soil and climatic factors along an altitudinal gradient in the middle Tianshan Mountain area, Xinjiang, China. Ecol. Res. 2009, 24, 303–314. [Google Scholar] [CrossRef]
  35. Kraft, N.J.; Comita, L.S.; Chase, J.M.; Sanders, N.J.; Swenson, N.G.; Crist, T.O.; Stegen, J.C.; Vellend, M.; Boyle, B.; Anderson, M.J. Disentangling the drivers of β diversity along latitudinal and elevational gradients. Science 2011, 333, 1755–1758. [Google Scholar] [CrossRef] [PubMed]
  36. Tello, J.S.; Myers, J.A.; Macía, M.J.; Fuentes, A.F.; Cayola, L.; Arellano, G.; Loza, M.I.; Torrez, V.; Cornejo, M.; Miranda, T.B. Elevational gradients in β-diversity reflect variation in the strength of local community assembly mechanisms across spatial scales. PLoS ONE 2015, 10, e0121458. [Google Scholar] [CrossRef] [PubMed]
  37. Sabatini, F.M.; Jiménez-Alfaro, B.; Burrascano, S.; Lora, A.; Chytrý, M. Beta-diversity of central European forests decreases along an elevational gradient due to the variation in local community assembly processes. Ecography 2018, 41, 1038–1048. [Google Scholar] [CrossRef]
  38. Hoffmann, S.; Schmitt, T.M.; Chiarucci, A.; Irl, S.D.; Rocchini, D.; Vetaas, O.R.; Tanase, M.A.; Mermoz, S.; Bouvet, A.; Beierkuhnlein, C. Remote sensing of β-diversity: Evidence from plant communities in a semi-natural system. Appl. Veg. Sci. 2019, 22, 13–26. [Google Scholar] [CrossRef]
  39. Tang, Z.; Fang, J.; Chi, X.; Feng, J.; Liu, Y.; Shen, Z.; Wang, X.; Wang, Z.; Wu, X.; Zheng, C. Patterns of plant beta-diversity along elevational and latitudinal gradients in mountain forests of China. Ecography 2012, 35, 1083–1091. [Google Scholar] [CrossRef]
  40. Mena, J.L.; Vázquez-Domínguez, E. Species turnover on elevational gradients in small rodents. Glob. Ecol. Biogeogr. 2005, 14, 539–547. [Google Scholar] [CrossRef]
  41. Ah-Peng, C.; Wilding, N.; Kluge, J.; Descamps-Julien, B.; Bardat, J.; Chuah-Petiot, M.; Strasberg, D.; Hedderson, T.A. Bryophyte diversity and range size distribution along two altitudinal gradients: Continent vs. island. Acta Oecologica 2012, 42, 58–65. [Google Scholar] [CrossRef]
  42. Henriques, D.S.; Borges, P.A.; Ah-Peng, C.; Gabriel, R. Mosses and liverworts show contrasting elevational distribution patterns in an oceanic island (Terceira, Azores): The influence of climate and space. J. Bryol. 2016, 38, 183–194. [Google Scholar] [CrossRef]
  43. Chase, J.M.; Leibold, M.A. Ecological Niches: Linking Classical and Contemporary Approaches; University of Chicago Press: Chicago, IL, USA, 2003. [Google Scholar]
  44. Guerin, G.R.; Andersen, A.N.; Rossetto, M.; van Leeuwen, S.; Byrne, M.; Sparrow, B.; Rodrigo, M.; Lowe, A.J. Consistent sorting but contrasting transition zones in plant communities along bioclimatic gradients. Acta Oecologica 2019, 95, 74–85. [Google Scholar] [CrossRef]
  45. Hubbell, S.P. The Unified Neutral Theory of Biodiversity and Biogeography (MPB-32); Princeton University Press: Princeton, NJ, USA, 2001. [Google Scholar]
  46. Chase, J.M.; Myers, J.A. Disentangling the importance of ecological niches from stochastic processes across scales. Philos. Trans. R. Soc. B Biol. Sci. 2011, 366, 2351–2363. [Google Scholar] [CrossRef] [PubMed] [Green Version]
  47. Chase, J.M. Drought mediates the importance of stochastic community assembly. Proc. Natl. Acad. Sci. USA 2007, 104, 17430–17434. [Google Scholar] [CrossRef] [PubMed] [Green Version]
  48. Legendre, P.; Mi, X.; Ren, H.; Ma, K.; Yu, M.; Sun, I.F.; He, F. Partitioning beta diversity in a subtropical broad-leaved forest of China. Ecology 2009, 90, 663–674. [Google Scholar] [CrossRef]
  49. Stegen, J.C.; Freestone, A.L.; Crist, T.O.; Anderson, M.J.; Chase, J.M.; Comita, L.S.; Cornell, H.V.; Davies, K.F.; Harrison, S.P.; Hurlbert, A.H.; et al. Stochastic and deterministic drivers of spatial and temporal turnover in breeding bird communities. Glob. Ecol. Biogeogr. 2013, 22, 202–212. [Google Scholar] [CrossRef]
  50. Heino, J.; Melo, A.S.; Bini, L.M.; Altermatt, F.; Al-Shami, S.A.; Angeler, D.G.; Bonada, N.; Brand, C.; Callisto, M.; Cottenie, K. A comparative analysis reveals weak relationships between ecological factors and beta diversity of stream insect metacommunities at two spatial levels. Ecol. Evol. 2015, 5, 1235–1248. [Google Scholar] [CrossRef] [Green Version]
  51. Madon, O.; Médail, F. The ecological significance of annuals on a Mediterranean grassland (Mt Ventoux, France). Plant Ecol. 1997, 129, 189–199. [Google Scholar] [CrossRef]
  52. Turland, N.J.; Chilton, L.; Press, J.R. Flora of the Cretan Area: Annotated Checklist and Atlas; HMSO: London, UK, 1993. [Google Scholar]
  53. Médail, F.; Quézel, P. Biodiversity hotspots in the Mediterranean Basin: Setting global conservation priorities. Conserv. Biol. 1999, 13, 1510–1513. [Google Scholar] [CrossRef]
  54. Davis, S.; Heywood, V.; Hamilton, A. Centres of plant diversity. Nat. Hist. 1994, 111, 1. [Google Scholar]
  55. Trigas, P.; Panitsa, M.; Tsiftsis, S. Elevational gradient of vascular plant species richness and endemism in Crete–the effect of post-isolation mountain uplift on a continental island system. PLoS ONE 2013, 8, e59425. [Google Scholar] [CrossRef] [PubMed]
  56. Raunkiaer, C. The Life Forms of Plants and Statistical Plant Geography; Oxford University Press: Oxford, UK, 1934. [Google Scholar]
  57. Hijmans, R.J.; Cameron, S.E.; Parra, J.L.; Jones, P.G.; Jarvis, A. Very high resolution interpolated climate surfaces for global land areas. Int. J. Climatol. A J. R. Meteorol. Soc. 2005, 25, 1965–1978. [Google Scholar] [CrossRef]
  58. Wheeler, B.; Torchiano, M. lmPerm: Permutation Tests for Linear Models. R package version 1.1-2. 2010. Available online: http://CRAN.R-project.org/package=lmPerm (accessed on 25 August 2013).
  59. Oksanen, J.; Blanchet, F.G.; Kindt, R.; Legendre, P.; Minchin, P.R.; O’hara, R.; Simpson, G.L.; Solymos, P.; Stevens, M.H.H.; Wagner, H. Package ‘vegan’. Commun. Ecol. PackageVersion 2013, 2, 1–295. [Google Scholar]
  60. Lazarina, M.; Sgardeli, V.; Kallimanis, A.S.; Sgardelis, S.P. An effort-based index of beta diversity. Methods Ecol. Evol. 2013, 4, 217–225. [Google Scholar] [CrossRef]
  61. Ulrich, W.; Gotelli, N.J. A null model algorithm for presence–absence matrices based on proportional resampling. Ecol. Model. 2012, 244, 20–27. [Google Scholar] [CrossRef]
  62. Hastie, T.J. Generalized additive models. In Statistical Models in S; Routledge: Abingdon, UK, 2017; pp. 249–307. [Google Scholar]
  63. Wood, S.N. mgcv: GAMs and generalized ridge regression for R. R News 2001, 1, 20–25. [Google Scholar]
  64. RC Team. R: A Language and Environment for Statistical Computing; R Foundation for Statistical Computing: Vienna, Austria, 2013. [Google Scholar]
  65. Steinbauer, M.J.; Irl, S.D.; Beierkuhnlein, C. Elevation-driven ecological isolation promotes diversification on Mediterranean islands. Acta Oecologica 2013, 47, 52–56. [Google Scholar] [CrossRef]
  66. Keddy, P.A. Assembly and response rules: Two goals for predictive community ecology. J. Veg. Sci. 1992, 3, 157–164. [Google Scholar] [CrossRef]
  67. Diaz, S.; Cabido, M.; Casanoves, F. Plant functional traits and environmental filters at a regional scale. J. Veg. Sci. 1998, 9, 113–122. [Google Scholar] [CrossRef]
  68. Irl, S.D.; Schweiger, A.H.; Hoffmann, S.; Beierkuhnlein, C.; Hartmann, H.; Pickel, T.; Jentsch, A. Spatiotemporal dynamics of plant diversity and endemism during primary succession on an oceanic-volcanic island. J. Veg. Sci. 2019, 30, 587–598. [Google Scholar] [CrossRef]
  69. Körner, C. Alpine plant life. In Functional Plant Ecology of High Mountain Ecosystems; with 47 tables; Springer Science & Business Media: Berlin, Germany, 2003. [Google Scholar]
  70. Blumler, M.A. What is the ‘True’Mediterranean-type vegetation? In Geographical Changes in Vegetation and Plant Functional Types; Springer: Cham, Switzerland, 2018; pp. 117–139. [Google Scholar]
  71. Arianoutsou, M.; Delipetrou, P.; Celesti-Grapow, L.; Basnou, C.; Bazos, I.; Kokkoris, Y.; Blasi, C.; Vilà, M. Comparing naturalized alien plants and recipient habitats across an east–west gradient in the Mediterranean Basin. J. Biogeogr. 2010, 37, 1811–1823. [Google Scholar] [CrossRef]
  72. Carlsson, B.A.; Karlsson, P.S.; Svensson, B.M. Alpine and subalpine vegetation. Acta Phytogeogr. Suec. 1999, 84, 75–90. [Google Scholar]
  73. Herben, T.; Krahulec, F.; Hadincová, V.; Kováf Ova, M. Small-scale spatial dynamics of plant species in a grassland community over six years. J. Veg. Sci. 1993, 4, 171–178. [Google Scholar] [CrossRef]
  74. Pellissier, L.; Fournier, B.; Guisan, A.; Vittoz, P. Plant traits co-vary with altitude in grasslands and forests in the European Alps. Plant Ecol. 2010, 211, 351–365. [Google Scholar] [CrossRef] [Green Version]
  75. Vogiatzakis, I.; Griffiths, G.H.; Mannion, A.M. Environmental factors and vegetation composition, Lefka Ori massif, Crete, S. Aegean. Glob. Ecol. Biogeogr. 2003, 12, 131–146. [Google Scholar] [CrossRef]
  76. Debussche, M.; Escarré, J.; Lepart, J.; Houssard, C.; Lavorel, S. Changes in Mediterranean plant succession: Old-fields revisited. J. Veg. Sci. 1996, 7, 519–526. [Google Scholar] [CrossRef]
  77. Procheş, Ş.; Cowling, R.M.; Goldblatt, P.; Manning, J.C.; Snijman, D.A. An overview of the Cape geophytes. Biol. J. Linn. Soc. 2006, 87, 27–43. [Google Scholar] [CrossRef] [Green Version]
  78. Danin, A.; Orshan, G. The distribution of Raunkiaer life forms in Israel in relation to the environment. J. Veg. Sci. 1990, 1, 41–48. [Google Scholar] [CrossRef]
  79. Kazakis, G.; Ghosn, D.; Vogiatzakis, I.; Papanastasis, V. Vascular plant diversity and climate change in the alpine zone of the Lefka Ori, Crete. Biodivers. Conserv. 2007, 16, 1603–1615. [Google Scholar] [CrossRef]
  80. Sánchez-González, A.; López-Mata, L. Plant species richness and diversity along an altitudinal gradient in the Sierra Nevada, Mexico. Divers. Distrib. 2005, 11, 567–575. [Google Scholar] [CrossRef]
  81. Descombes, P.; Vittoz, P.; Guisan, A.; Pellissier, L. Uneven rate of plant turnover along elevation in grasslands. Alp. Bot. 2017, 127, 53–63. [Google Scholar] [CrossRef]
  82. McCain, C.M.; Beck, J. Species turnover in vertebrate communities along elevational gradients is idiosyncratic and unrelated to species richness. Glob. Ecol. Biogeogr. 2016, 25, 299–310. [Google Scholar] [CrossRef]
  83. La Sorte, F.A.; McKinney, M.L.; Pyšek, P.; Klotz, S.; Rapson, G.; Celesti-Grapow, L.; Thompson, K. Distance decay of similarity among European urban floras: The impact of anthropogenic activities on β diversity. Glob. Ecol. Biogeogr. 2008, 17, 363–371. [Google Scholar] [CrossRef]
  84. La Sorte, F.A.; McKinney, M.L.; Pyšek, P. Compositional similarity among urban floras within and across continents: Biogeographical consequences of human-mediated biotic interchange. Glob. Chang. Biol. 2007, 13, 913–921. [Google Scholar] [CrossRef]
  85. Socolar, J.B.; Gilroy, J.J.; Kunin, W.E.; Edwards, D.P. How should beta-diversity inform biodiversity conservation? Trends Ecol. Evol. 2016, 31, 67–80. [Google Scholar] [CrossRef]
Figure 1. Illustration diagram of the statistical analysis we performed to explore the diversity patterns of different life forms. Life form abbreviations: C = chamaephytes, G = geophytes, H = hemicryptophytes, P = phanerophytes, T = therophytes. Other abbreviations: CLC2000 = CORINE Land Cover 2000 database, DEM = Digital Elevation Model.
Diversity 11 00200 g001
Figure 2. Boxplots of elevational (a) and environmental ranges (bh) of different life forms in the island of Crete. The horizontal line denotes the mean values, the box indicates the first and third quartiles, and the red and blue points the maximum and minimum values, respectively. Life forms abbreviations: C = chamaephytes, G = geophytes, H = hemicryptophytes, P = phanerophytes, T = therophytes.
Diversity 11 00200 g002
Figure 3. The relationship between elevation and (a) γ-diversity, and (b) mean α-diversity of different life forms, and (c) life form-spectrum and deviance explained of the formulated Generalized Additive Model (summary statistics of the models are presented in Supplementary Material—Table S4) across the 12 elevational zones. Points represent observed values and lines the predicted values by Generalized Additive Models predicting γ-diversity and mean α-diversity as function of elevation (smooth term) by life form and life form. Significant relationships are indicated by solid lines. Life forms abbreviations: C = chamaephytes, G = geophytes, H = hemicryptophytes, P = phanerophytes, T = therophytes.
Diversity 11 00200 g003
Figure 4. The relationship between elevation and Jaccard index of dissimilarity (a) and its deviation from random expectations (b) and deviance explained of the formulated Generalized Additive Models (summary statistics of the models are presented in Supplementary Material—Table S4) for different life forms across the formulated elevational zones. Points represent observed values and lines the predicted values by Generalized Additive Models predicting β-diversity and β-deviations as function of elevation (smooth term) by life form and life form. Significant relationships are indicated by solid lines. Life forms abbreviations: C = chamaephytes, G = geophytes, H = hemicryptophytes, P = phanerophytes, T = therophytes.
Diversity 11 00200 g004
Table 1. Species distribution related variables and diversity indices of species of different life forms. Different letters (a, b, c, d) indicate significant differences between life forms, according to permutational one-way ANOVA.
ChamaephytesGeophytesHemicryptophytesPhanerophytesTherophytes
Species Distribution Related Variables
geographical range0.09 ± 0.11 a0.05 ± 0.04 b0.02 ± 0.01 c0.13 ± 0.14 d0.01 ± 0.00 c
% Single- & doubletons0.240.230.200.160.25
Diversity Indices
γ-diversity176 (12%) *227 (15%) *379 (25%) *100 (7%) *636 (42%) *
mean α-diversity16.53 ± 12.99 ab21.38 ± 17.14 a28.99 ± 26.97 c13.05 ± 10.88 d38.21 ± 44.88 bc
Ν* index 9.5310.2512.657.5417.54
Jaccard index0.89 ± 0.110.91 ± 0.100.92 ± 0.090.88 ± 0.130.96 ± 0.06
* percentage of total species richness.

