Variability of A Subterranean Prey-Predator Community in Space and Time


1
Dipartimento Scienze della Terra dell’Ambiente e della Vita—DISTAV, Università degli Studi di Genova, 16132 Genova, Italy
2
Gruppo Speleologico “A. Issel”, Villa Comunale ex Borsino c.p. 21, 16012 BUSALLA (GE), Italy
*
Author to whom correspondence should be addressed.
Diversity 2020, 12(1), 17; https://0-doi-org.brum.beds.ac.uk/10.3390/d12010017
Submission received: 18 December 2019
/
Revised: 24 December 2019
/
Accepted: 27 December 2019
/
Published: 31 December 2019
(This article belongs to the Special Issue The Ecological Role of Salamanders as Predators and Prey)
Abstract
:Subterranean habitats are characterized by buffered climatic conditions in comparison to contiguous surface environments and, in general, subterranean biological communities are considered to be relatively constant. However, although several studies have described the seasonal variation of subterranean communities, few analyzed their variability over successive years. The present research was conducted inside an artificial cave during seven successive summers, from 2013 to 2019. The parietal faunal community was sampled at regular intervals from outside to 21 m deep inside the cave. The community top predator is the cave salamander Speleomantes strinatii, while invertebrates, mainly adult flies, make up the rest of the faunal assemblage. Our findings indicate that the taxonomic composition and the spatial distribution of this community remained relatively constant over the seven-year study period, supporting previous findings. However, different environmental factors were shaping the distribution of predators and prey along the cave. Invertebrates were mainly affected by the illuminance, while salamanders were influenced by both illuminance and distance from the cave’s entrance. The inter-annual spatial distribution of the salamander population was highly repeatable and age specific, confirming a gradual shift towards the deeper parts of the cave with an increasing age. In general, the spatial distribution along the cave of this prey-predator system remained relatively constant during the seven-year study, suggesting that strong selective constraints were in action, even in this relatively recent subterranean ecosystem.
1. Introduction
Subterranean habitats are simplified ecosystems characterized by reduced climatic fluctuations in comparison to those occurring in the surrounding surface habitats [1,2,3]. In subterranean habitats, air temperature and relative humidity display buffered seasonal variations. Solar radiation is completely absent in deep areas, yet still present but dimmed in the twilight ecotone zone [4,5,6]. In addition, subterranean environments are often energy limited in the sense that, in absence of primary producers, the main organic supply is derived from organisms living in surrounding surface habitats [1]. Therefore, the organic basis of the food chain in subterranean ecosystems is provided by active movements of animals that periodically migrate inside the system during external unfavorable periods or is imported as organic debris by gravity, wind, and rainflow from outside [7,8]. Several studies analyzed the influence of seasonal climatic variations on the abundance and distribution of single or few subterranean populations or species (e.g., references [4,9,10,11,12] or, more in general, on the composition of entire biological communities living in subterranean environments e.g., references [5,13,14,15]. Concerning the long-term composition of biological cave communities, it is generally assumed that those living in subterranean habitats are characterized by low levels of temporal variability [1,16]. This assumption was analyzed in detail by Di Russo et al. [16], who studied the temporal variations of the faunal community living inside the natural cave of Valdemino in central Italy. Di Russo et al. [16] found that the resident cave community, composed exclusively by invertebrates, maintained a relatively constant species composition and displayed a constant spatial distribution over the 20-year study period. However, there are some exceptions to the assumption of low temporal variability of subterranean communities. One convincing example is the cricket guano community studied inside Mammoth Cave in Kentucky (USA) by [17]. This study described the observed changes in species composition over more than two decades. Changes were gradual and apparently not influenced by local factors, such as human disturbance, but apparently were caused by directional effects of unfavorable climatic events on the population of the cave cricket Hadenoecus subterraneus, the key species providing organic supply to the entire subterranean community [17]. Therefore, although the general hypothesis of low temporal variability of subterranean communities is well accepted [2], this hypothesis should be verified on a case-by-case basis. This because, when studying the composition and distribution of subterranean communities, the great heterogeneity in the physical structure and local climate of these habitat has to be taken into consideration. In fact, subterranean habitats are very heterogeneous and may vary in the size, number, and orientation of their connections with the surface, vertical or horizontal development of penetrable spaces, local climatic factors, extension of the twilight zone, and availability of trophic subsidies [8,18,19].
In this paper, we describe variations of the composition and spatial distribution of a biological community sampled inside an artificial cave. The faunal community is composed by a terrestrial top predator, the salamander Speleomantes strinatii (Aellen, 1958), and its invertebrate prey taxa [20]. This community was sampled each year in July with the same methodology to allow a robust among-year comparison. In fact, artificial subterranean habitats constitute interesting ecosystems, because they are relatively young and their age is usually well known. Moreover, these artificial habitats are generally characterized by environmental conditions similar to those of natural caves found in the same geographic area, in particular when the variation of air relative humidity, air temperature and direct solar radiation are considered [21].
The aim of this study was two-fold: (i) to assess the changes in the biological community over seven consecutive summers and to validate the hypothesis of low inter-annual variability of biological communities, and (ii) to evaluate which environmental factors were shaping the different ecological groups composing the community and whether the spatial distribution of the top predator, the cave salamander, and of its invertebrate prey was influenced by similar or contrasting environmental factors.
2. Materials and Methods
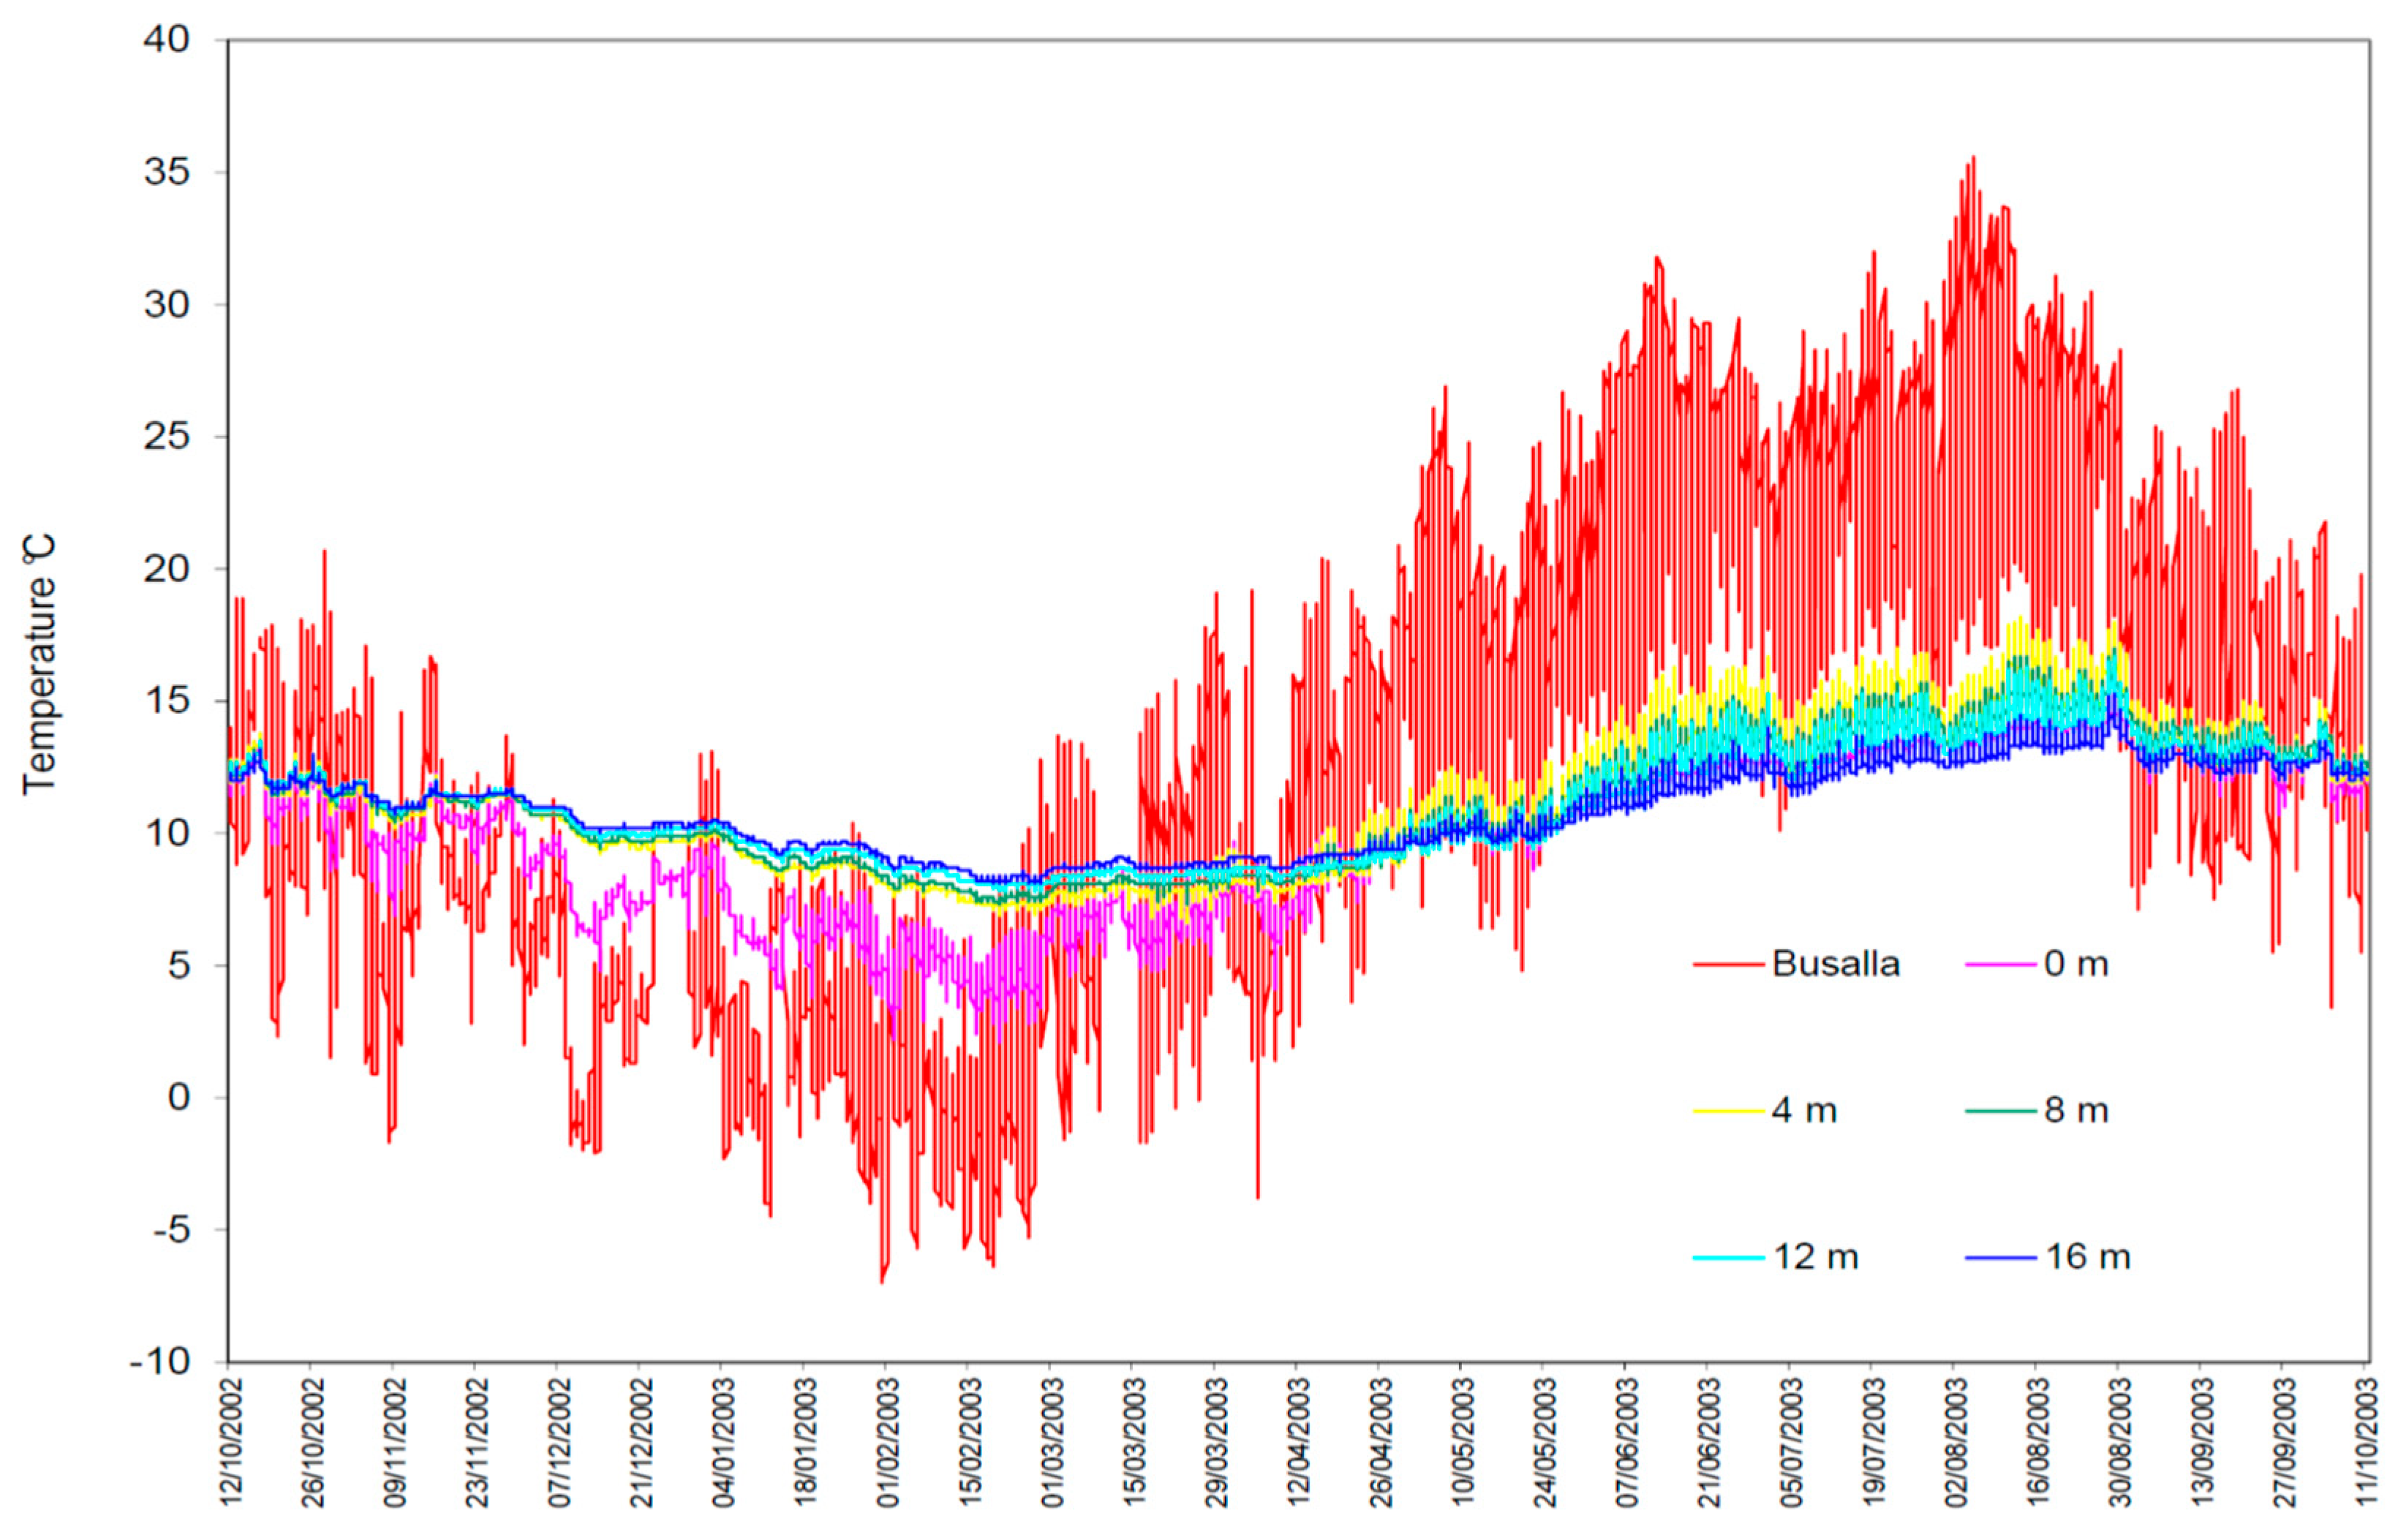
The study site is situated at 369 m a.s.l. in the municipality of Savignone (Province of Genova, Region of Liguria, Italy). This artificial cave is a U-shaped tunnel that develops horizontally for about 40 m. The site was excavated in a geological substratum composed by thin layers of siltstone and claystone, attributed to a late Cretaceous period known as Campanian [22]. This cave was excavated to be used as an air-raid shelter during World War II (i.e., in the period 1941–1943) and originally had two large entrances [20,23], but one of them collapsed soon after the shelter construction. Since 1987, the only cave entrance left was closed by an iron gate and the tunnel’s walls were equipped with a permanent grid with a 1 × 1 m mesh, to allow studying the salamander population that lives in the cave [24]. This underground laboratory is managed by the Speleological Group “A. Issel” and is named “Biospeleological Station of San Bartolomeo”. The seasonal temperature variations recorded inside the cave display similar patterns in comparison to those occurring in natural caves with only a single large entrance [21,25]. In this particular case, air temperatures measured over 12 consecutive months in different parts of the study cave showed a similar, but much more buffered pattern of variation, in comparison to those recorded outside at the nearest meteorological station (Figure 1). In fact, the coefficient of variation (CV) of the air temperature at the cave entrance was already halved (CV = 0.29) and more than fourfold lower at 16 m deep inside (CV = 0.15), when compared with the corresponding temperature variation (CV = 0.67) measured at the surface [23] (Table 1).
In this study, three environmental parameters characterizing the different parts of the cave were quantified. The variation in solar radiation along the cave was measured in Lux (LUX) with a Unittic photometer at midday in July 2015. The linear distance from entrance (DISTANCE) was recorded in meters through a permanent grid with a 1 × 1 m mesh as reported by reference [20]. The complexity of cave walls (COMPLEXITY) was expressed in cm, by summing the linear distance attained by a 1 m string pressed vertically on the left and right cave walls at about 1.5 m of height [4,15]. These measures were then subtracted from 200, the maximum value obtained if both cave walls were completely smooth (i.e., low complexity). In this way a low substrate complexity will score 0, while increasing complexity gradually will score increasing larger values (Supplementary Materials Table S1).
The study of the salamander population abundance and distribution is part of a long-term research that began in 1996 and is still ongoing [26,27]. The data used in this study are those obtained from 2013 to 2019. Absolute population abundance was estimated, every year in July, by a three-occasion temporary removal experiment in which samples were obtained every other day [26,28]. Salamanders were caught by hand on the cave walls, measured to the nearest millimeter (snout-vent length, SVL) and caged inside terraria until the end of the sampling. All animals were returned unharmed to their cave section at the end of the annual removal experiment. Abundance was estimated using model Mbh in CAPTURE software [29]. Individuals possessing a swollen mental gland were identified as adult males [30], while individuals larger than 57 mm in SVL were considered adult females [31]. Each year, the SVL polymodal distribution of the immature portion of the population was decomposed by the use of FiSAT software [32]. Juveniles aged one or two (thereafter “juveniles”) were pooled and separated from sub-adults (i.e., large salamanders in their third year, but not yet sexually mature) by taking into account yearly cohort distributions [28]. The relative abundance of juveniles, subadults, females, and males that were caught by hand in the cave section corresponding to each adhesive entomological trap (see below) was obtained by summing the individuals removed over the three sampling occasions. These numbers represented almost a complete census, because during this study, salamander capture probabilities were relatively high, being 0.54 on average (see Results and Supplementary Materials Table S2).
Each year, during the first day of the salamander removal, nine adhesive traps were positioned outside, at the entrance and at 3, 6, 9, 12, 15, 18, and 21 m inside the cave. Each trap was a transparent acetate sheet (21 × 30 cm) coated on one side with entomological glue, hanging from the cave vault. At the end of the salamander removal, all traps were retrieved and permanently conserved between transparent plastic sheets. Subsequently, trapped invertebrates were identified and counted in the laboratory under a dissecting microscope. The use of adhesive trap is possibly selective towards flying insects as dipterans. However, this technique was used because salamanders living in the study cave feed prevalently upon this type of prey, that constitutes about 70% of the total prey items ingested [20].
The variations of the entire biological community were analyzed by a two-way permutation multivariate analysis of variance (PERMANOVA) based on square root transformed data, Bray-Curtis dissimilarity, and 9999 permutations, by using PAST software [33]. To obtain a balanced design the traps located outside, at the entrance and at 3 m inside the cave were considered replicates of the light/twilight zone (i.e., where light is present or reduced), those at 6, 9, and 12 m were considered replicates of the dark zone (i.e., where light is absent), while traps at 15, 18, and 21 m were considered replicates of the deep zone (i.e., where light is absent and climatic conditions become constant). Thus, “year” and “cave zone” were used as factors, while abundances of invertebrate taxa and of the four salamander groups (i.e., juveniles, subadults, females, and males, Table 2) were the dependent variables.
The relationship between the faunal community and the three environmental variables was assessed by canonical correspondence analysis (CCA), a multivariate analysis specifically designed for the investigation of ecological gradients [34,35]. In particular, CCA selects the linear combinations of environmental variables that maximizes the species’ dispersion and elaborates an ordination diagram, delimited by uncorrelated linear axes, in which species, sites and environmental variables are projected [5,34]. The overall robustness of CCA was calculated by 9999 permutations [35]. In our CCA, the biological community consisted in the four groups of salamanders, while the invertebrates where divided in two categories: dipterans (DI) and all the other taxa (OT) pooled. This procedure was justified because dipterans were numerically predominant in the study site [20] (see also Results).
3. Results
During the study period, the total estimated salamander abundance fluctuated from 98 in 2019 to 126 in both 2013 and 2014 (CV = 0.11). Capture probabilities were rather high, being 0.54 on average (95% confidence interval 0.49–0.60), a value indicating that after three removal samples, about 90% of the entire salamander population was captured and measured each year (Supplementary Materials, Table S2).
A total of 656 invertebrates were caught during this study, with 61% of them trapped outside the cave (Table 2). This trapping location was also characterized by the constant presence of sup-sucking aphids (Homoptera), a group of insects caught inside the cave only when passively transported by wind (Table 2). Flies (Diptera) were the most abundant taxon (N = 508), representing 77% of the total invertebrates and about 65% of invertebrates trapped inside the cave, many of which belonged to the common crane fly Limonia nubeculosa.
The results of the two-way PERMANOVA are reported in Table 3. The interaction between the trapping zone and the sampling year, and the biological community in different years were non-significant (Cave zone * Year: F = -0.65, p = 0.93; Year: F = 0.91, p = 0.13). Conversely, as expected, the faunal composition among the three sampling zones showed a highly significant degree of dissimilarity, confirming that there was a differentiation in the faunal composition along the subterranean habitat (F = 4.73, p = 0.0001). Overall, these findings suggested that there were no relevant variations in the annual composition of the faunal assemblage in the study site, and that the community spatial distribution remained relatively constant along the cave during the seven-year study period.
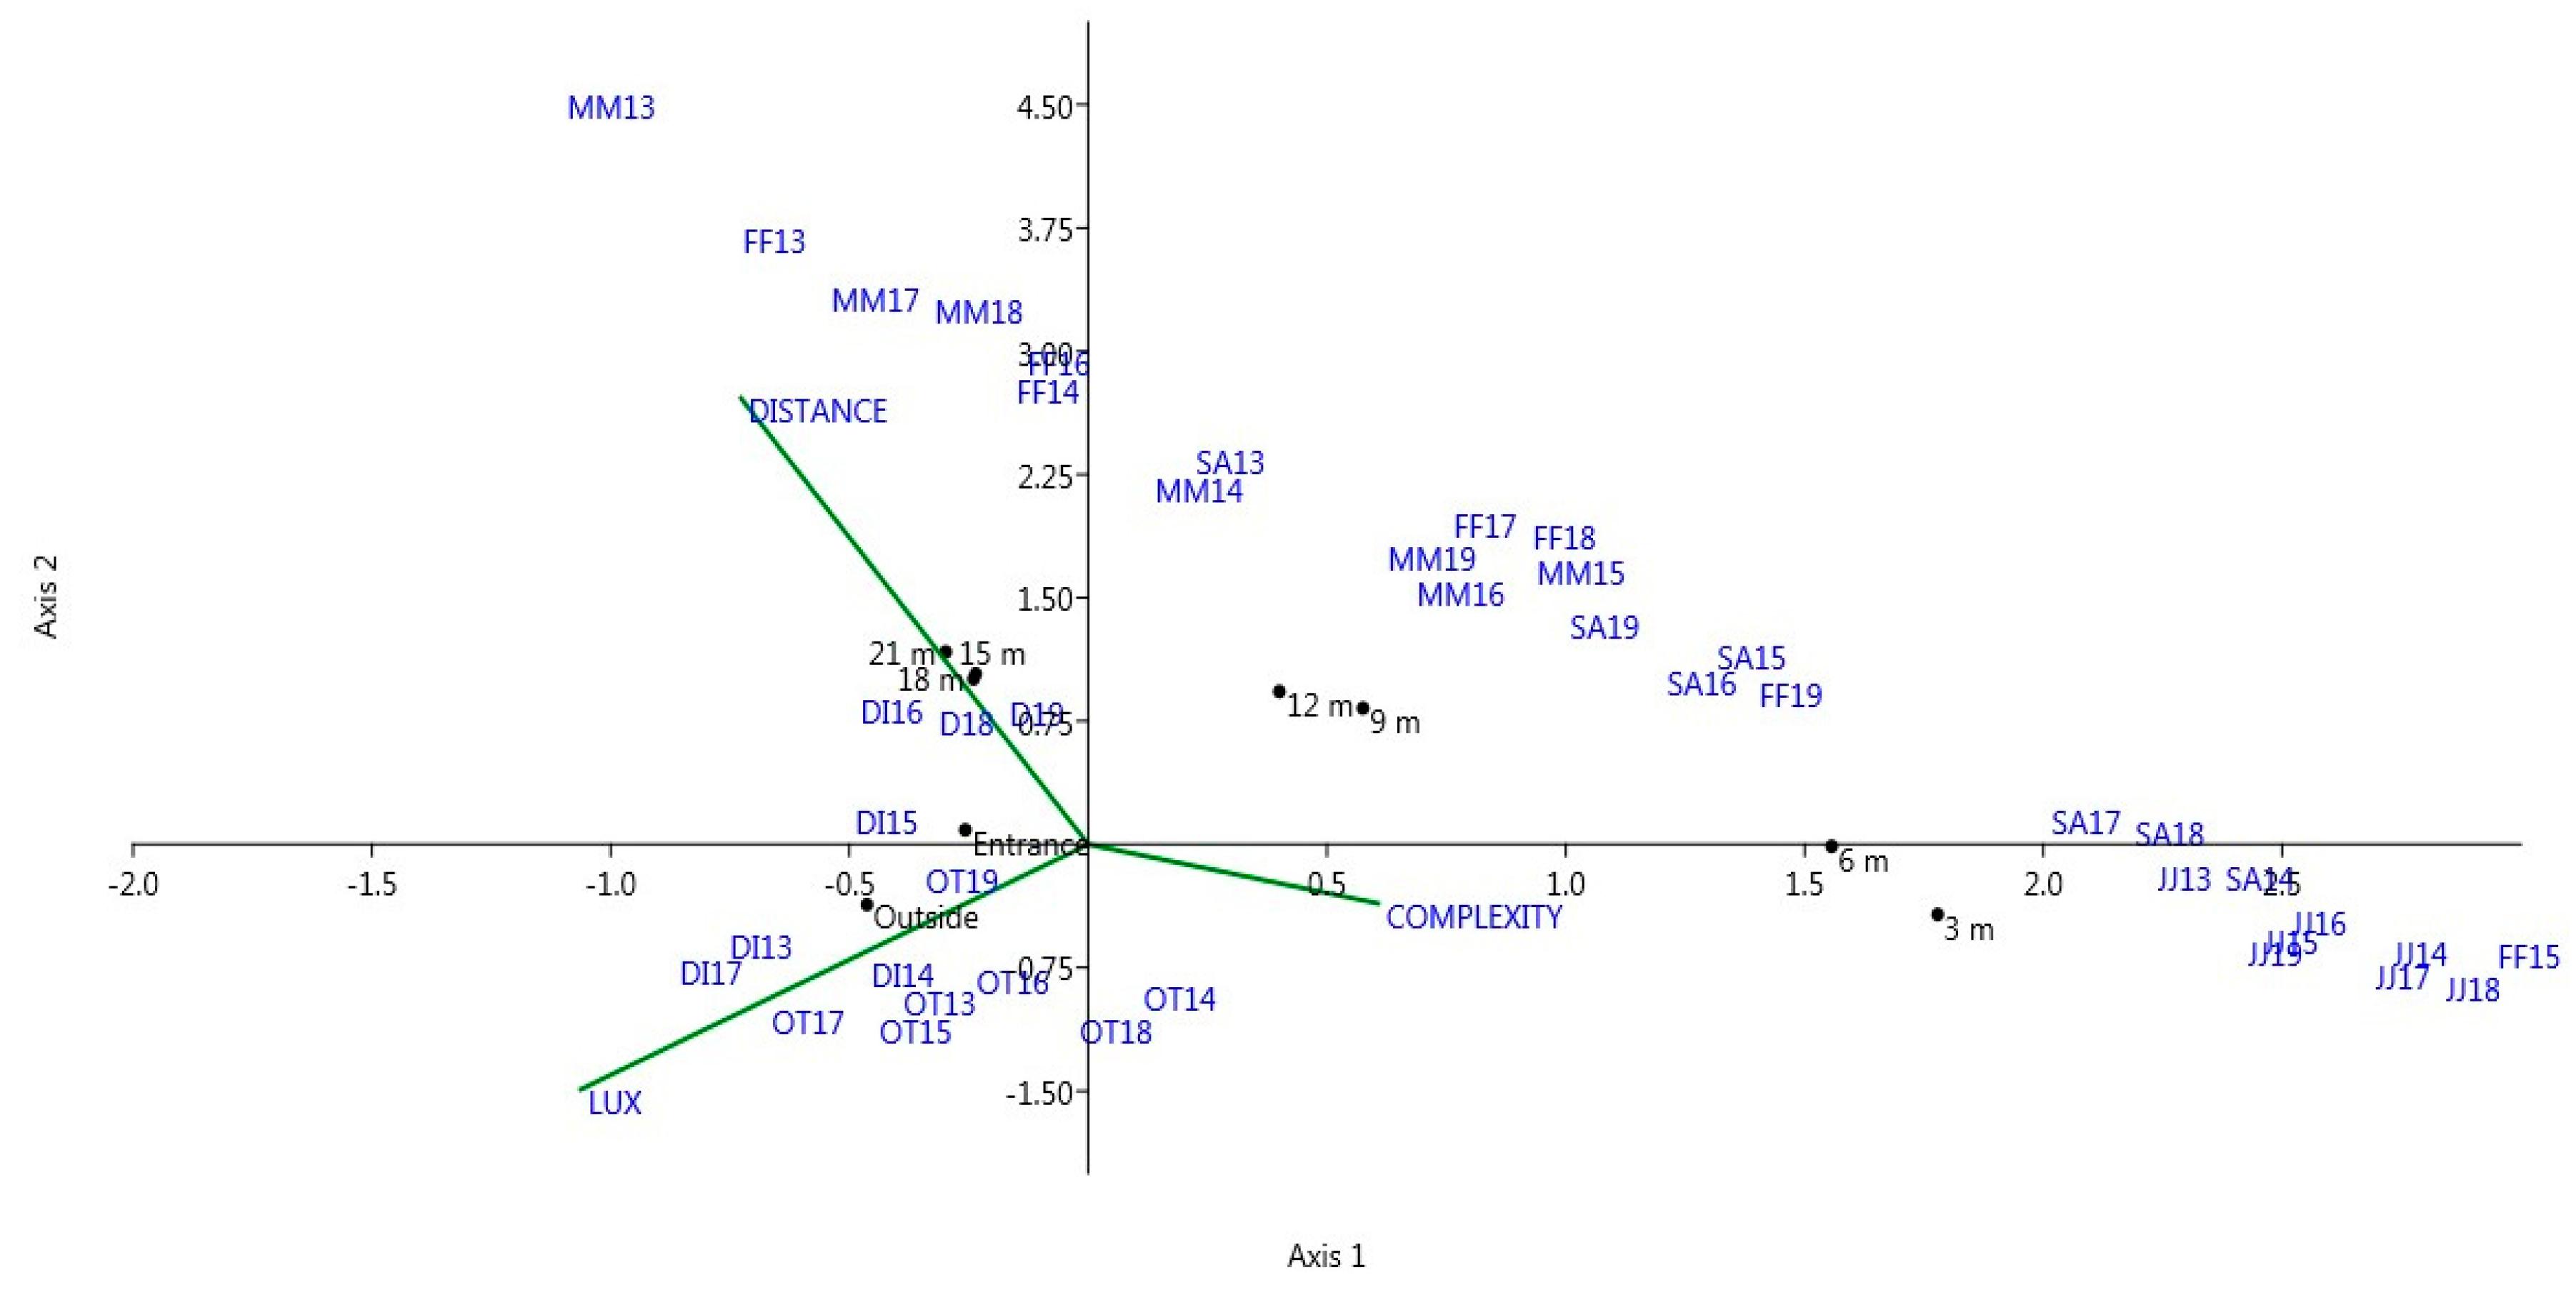
The CCA using the environmental variables and the entire biological community sampled along the subterranean gradient was highly significant (trace = 0.765; p = 0.001; Figure 2). The first two axes explained the entire variance of the system (67% and 33%, respectively), and both were significant (axis 1: eigenvalue = 0.509, p = 0.008; axis 2: eigenvalue = 0.256, p = 0.003).
Dipterans (DI) and the other taxa of invertebrates (OT) were projected in the left lower quadrant of the plot, while salamanders were linearly spread in along the diagram, with juveniles and subadults always projected on the right and females and males in the center and left quadrant (Figure 2). There was a strong repeatability of this pattern among years with only one exception, the position of female salamanders sampled in 2015 (i.e., FF15 in Figure 2), that was associated with juveniles and subadults on the rightmost part of the plot. The distribution of trapping sites on the CCA plot was also noteworthy, because the two more external sites (i.e., Outside and Entrance) were projected in the lower left quadrant in association with all the invertebrate taxa. Conversely, all the others sites were distributed on the right part and the upper part of the CCA plot, apparently associated with the salamanders’ groups. Concerning environmental factors, LUX had the highest load on the first axis, while DISTANCE had the highest load on the second axis (Supplementary materials; Table S3). Finally, the complexity of the cave walls (COMPLEXITY) had apparently a trivial effect on the entire faunal community distribution, because this factor displayed its highest load on the third axis that was non-significant (p = 0.9532; Supplementary materials Table S3).
4. Discussion
According to Mammola and Isaia [36] the number of species found in subterranean habitats, their relative abundance and their ecological interactions are likely to depend on the carrying capacity of the system, i.e., on the amount of energy entering the system from outside. Our study habitat had a recent origin, being only 70 years old, and its physical structure was relatively simple, possessing only one large entrance and being horizontal. Furthermore, the entire ecological community was constituted by non-specialized (or “troglophile” sensu [37]) forest or soil animals that colonize opportunistically newly created subterranean habitats in search of new ecological opportunities, to avoid unfavorable climatic conditions, or to reduce competition and predation [38,39,40]. Our study showed a general constancy in both composition and distribution along the cave of the entire faunal community, at least during the seven-year period investigated. Therefore, the starting hypothesis of a low inter-annual variability characterizing subterranean biological communities [2,14,16] was corroborated by our multivariate approach. Consequently, our results seem to extend the hypothesis of low temporal variability of subterranean ecosystems to recently-established biological communities colonizing human-made habitats, in particular those characterized by highly buffered climatic conditions. In fact, the PERMANOVA clearly showed that there were no annual changes in the community composition within the three different zones in which the study cave was subdivided, i.e., the twilight, dark, and deep zones. This finding is of particular interest when considering that the transitional twilight zone analyzed in this study was in connection to the exterior environment through a large entrance and therefore, highly subject to abrupt and unpredictable seasonal and even daily climatic variations [6].
Another relevant finding concerns the different influences of the environmental factors on the prey-predator community found in the subterranean habitat. In particular, the spatial distribution of the top predator, the salamander Speleomantes strinatii, seemed influenced by contrasting environmental factors in comparison to its invertebrate prey taxa (see Figure 2). In fact, only illuminance affected the spatial distribution of invertebrates. Conversely, the distribution of cave salamanders was apparently caused by the interaction between illuminance and distance from the entrance. In the study site, these two factors are partially decoupled because light is completely and permanently lacking at a distance of 9 m from the entrance (Supplementary materials, Table S1). Thus, the deeper sections of the cave are homogeneous for this factor and can be differentiated mainly by a decreasing level of environmental variability (Table 1) and possibly by a different level of air humidity. Moreover, while illuminance had a clear positive effect on invertebrate distribution, its effect was opposite on salamanders, even for juveniles that were often abundant near the entrance, but were also found along the study cave in the dark zone up to 12 m were light is completely absent (Table 1). Thus, different ecological conditions were related to the spatial distribution of salamanders of all ages and their invertebrate prey. It is plausible that other environmental non-measured factors, such as air humidity [15,41] and the low climatic variability recorded in the deeper part of the cave, were affecting the observed distribution of salamanders. Other studies have analyzed the spatial distribution of cave salamanders within subterranean habitats in other parts of Italy [15,41,42]. In these studies, however, a different species of salamander (Speleomantes italicus) was studied and, in addition, a different sampling design was performed, as data from several different caves were pooled in statistical analyzes over only one study year. In the study of Lunghi et al. [15], cave salamanders were strictly associated with high relative air humidity and with distance from cave entrance. In another similar study, juvenile salamanders appeared to be strongly associated with invertebrate prey [41]. While our results are in part consistent with those of Lunghi et al. in some cases [15,41], with adult salamanders associated with deep and more stable climatic subterranean sectors, in other cases our findings suggest a somewhat different scenario. In fact, in our study site, invertebrates and salamanders were affected by different environmental factors, and there was no strict association between juvenile salamanders and invertebrates (Figure 2). These findings could be due to the different sampling scheme used, but also to the absence of dipterans in the invertebrate dataset of Lunghi et al. [15]. However, a common conclusion of all studies was that wall roughness had little influence on cave salamander distribution along the entire cave development. Apparently, climatic factors are much more relevant than the physical structure of the cave rock walls in shaping the underground distribution of Italian cave salamanders.
Concerning specifically the cave salamander S. strinatii, its population structure comprised all age groups, and in particular by a large proportion of juveniles (Supplementary materials, Table S2; [26,28]. This demographic structure was observed in all years (Supplementary materials, Table S2), indicating that the population has permanently colonized this artificial habitat and is successfully reproducing there.
In conclusion, the composition and spatial distribution of the entire faunal community living inside the study cave site appeared to be relatively constant over the seven-year study. As already observed by Romero [43,44] and recently reviewed by Mammola [45], subterranean habitats should be considered open rather than closed ecosystems, and they should be analyzed by taking into consideration the physical and biological features of adjacent surface habitats, where several subterranean populations migrate to forage during favorable periods and from where many organisms are constantly entering subterranean habitats to shelter from unfavorable conditions or to reproduce. In the present case, the study cave was recently built and subject to a continuous exchange of troglophile organisms from surrounding surface habitats. Notwithstanding this, a relatively constant biological community was observed, indicating that in this subterranean habitat, strong selective constraints were acting and were stabilizing this recently formed subterranean food web in both space and time.
Supplementary Materials
The following are available online at https://0-www-mdpi-com.brum.beds.ac.uk/1424-2818/12/1/17/s1: Table S1: Physical parameters measured outside and inside the experimental cave; Table S2: Removal statistics of the cave salamander Speleomantes strinatii population living in the “Biospeleological Station of San Bartolomeo”; Table S3: Scores of the Canonical Correspondence Analysis.
Author Contributions
Conceptualization, S.S., F.O. and M.V.P.; Methodology and sampling, S.S., F.O.; Formal analysis, S.S. and A.C.; Data curation, S.S.; Writing—original draft preparation, S.S. and A.C.; Writing—review and editing, S.S., A.C., F.O. and M.V.P. All authors have read and agreed to the published version of the manuscript.
Funding
This research received no external funding.
Acknowledgments
Permits to temporary capture and manipulate the salamanders were provided by the Italian Ministry of Environment (42466/PNM of 2013 and 00004038/PNM of 2019). We thank two anonymous Reviewers and Žiga Fišer for comments that improved a previous version of the manuscript.
Conflicts of Interest
The authors declare no conflict of interest.
References
- Poulson, T.L.; White, W.B. The cave environment. Science 1969, 165, 971–981. [Google Scholar] [CrossRef]
- Culver, D.C. Cave Life; Harvard University Press: Cambridge, MA, USA, 1982. [Google Scholar]
- Smithson, P.A. Inter-relationships between cave and outside air temperatures. Theor. Appl. Climatol. 1991, 44, 65–73. [Google Scholar] [CrossRef]
- Camp, C.D.; Jensen, J.B. Use of twilight zones of caves by plethodontid salamanders. Copeia 2007, 2007, 594–604. [Google Scholar] [CrossRef]
- Tobin, B.W.; Hutchins, B.T.; Schwartz, B.F. Spatial and temporal changes in invertebrate assemblage structure from the entrance to deep-cave zone of a temperate marble cave. Int. J. Speleol. 2013, 42, 203–214. [Google Scholar] [CrossRef] [Green Version]
- Mammola, S.; Isaia, M. Day–night and seasonal variations of a subterranean invertebrate community in the twilight zone. Subterr. Biol. 2018, 27, 31–51. [Google Scholar] [CrossRef]
- Poulson, T.L. Food sources. In Encyclopedia of Caves; Culver, D.C., White, W.B., Eds.; Elsevier Academic Press: Burlington, MA, USA, 2007; pp. 255–264. [Google Scholar]
- Coulver, D.C. Entrances. In Encyclopedia of Caves; Culver, D.C., White, W.B., Eds.; Elsevier Academic Press: Burlington, MA, USA, 2007; pp. 206–208. [Google Scholar]
- Keith, J.H. Seasonal changes in a population of Pseudanophtalmus tenuis (Coleoptera, Carabidae) in Murray Spring Cave, Indiana: A preliminary report. Int. J. Speleol. 1975, 7, 33–44. [Google Scholar] [CrossRef]
- Crouau-Roy, B.; Crouau, Y.; Ferre, C. Dynamic and temporal structure if the troglobitic beetle Speonomus hydrophilus (Coleoptera: Bathysciinae). Ecography 1992, 15, 12–18. [Google Scholar] [CrossRef]
- Camp, C.D.; Wooten, J.A.; Jensen, J.B.; Bartek, D.F. Role of temperature in determining relative abundance in cave twilight zones by two species of lungless salamander (family Plethodontidae). Can. J. Zool. 2014, 92, 119–127. [Google Scholar] [CrossRef]
- Lunghi, E.; Manenti, R.; Ficetola, G.F. Cave features, seasonality and subterranean distribution of non-obligate cave dwellers. PeerJ 2017, 5, e3169. [Google Scholar] [CrossRef]
- Nitzu, E.; Nae, A.; Băncilă, R.; Popa, I.; Giurginca, A.; Plăiaşu, R. Scree habitats: Ecological function, species conservation and spatial-temporal variation in the arthropod community. Syst. Biodivers. 2014, 12, 65–75. [Google Scholar] [CrossRef]
- Pellegrini, T.G.; Ferreira, R.L. Are inner cave communities more stable than entrance communities in Lapa Nova show cave? Subterr. Biol. 2016, 20, 15–37. [Google Scholar] [CrossRef] [Green Version]
- Lunghi, E.; Manenti, R.; Ficetola, G.F. Seasonal variation in microhabitat of salamanders: Environmental variation or shift of habitat selection? PeerJ 2014, 3, e1122. [Google Scholar] [CrossRef] [PubMed] [Green Version]
- Di Russo, C.; Carchini, G.; Rampini, M.; Lucarelli, M.; Sbordoni, V. Long term stability of a terrestrial cave communty. Int. J. Speleol. 1997, 26, 75–88. [Google Scholar] [CrossRef] [Green Version]
- Poulson, T.L.; Lavoie, K.H.; Helf, K. Long-term effects of weather on the cricket (Hadanoecus subterraneus, Orthoptera, Raphidiophoridae) guano community in Mommouth cave National Park. Am. Mid. Nat. 1995, 134, 226–236. [Google Scholar] [CrossRef]
- Badino, G. Cave temperatures and global climatic change. Int. J. Speleol. 2004, 33, 103–114. [Google Scholar] [CrossRef]
- Scheneider, K.; Christman, M.C.; Faga, W.F. The influence of resource subsidies on cave invertebrates: Results from an ecosystem-level manipulation experiment. Ecology 2011, 92, 765–776. [Google Scholar] [CrossRef] [PubMed]
- Salvidio, S.; Lattes, A.; Tavano, M.; Melodia, F.; Pastorino, M. Ecology of a Speleomantes ambrosii population inhabiting an artificial tunnel. Amphib. Reptil. 1994, 15, 35–45. [Google Scholar]
- Isaia, M.; Giachino, P.M.; Sapino, E.; Casale, A.; Badino, G. Conservation value of artificial subterranean systems: A case study in an abandoned mine in Italy. J. Nat. Conserv. 2011, 19, 24–33. [Google Scholar] [CrossRef]
- Istituto Superiore per la Protezione e la Ricerca Ambientale (2005). Carta Geologica d’Italia alla scala 1:50.000. Available online: http://www.isprambiente.gov.it/Media/carg/213_GENOVA/Foglio.html (accessed on 7 December 2019).
- Salvidio, S.; Oneto, F.; Ottonello, D.; Pastorino, M.V. Monitoraggio a lungo termine del geotritone Speleomantes strinatii nella Stazione Biospeleologica di San Bartolomeo di Besolagno (GE). In Atti 22° Congresso Nazionale di Speleologia; De Nitto, L., Maurano, F., Parise, M., Eds.; Memorie dell’Istituto Italiano di Speleologia: Bologna, Italy, 2015; Volume II, pp. 29, 422–427. [Google Scholar]
- Pastorino, M.V.; Pedemonte, S. Nuove stazioni di raccolta del geotritone nell’Oltregiogo Genovese. Atti XI Congresso Nazionale di Speleologia 1974, 2, 81–82. [Google Scholar]
- Ravbar, N.; Kosutnik, J. Variations of karst underground air temperature induced by various factors (Cave of Županova jama, Central Slovenia). Theor. Appl. Climatol. 2014, 116, 327–341. [Google Scholar] [CrossRef]
- Lindström, L.; Reeve, R.; Salvidio, S. Bayesian salamanders: Analysing the demography of an underground population of the European plethodontid Speleomantes strinatii with state-space modelling. BMC Ecol. 2010, 10, 4. [Google Scholar] [CrossRef] [PubMed] [Green Version]
- Salvidio, S.; Oneto, F.; Ottonello, D.; Pastorino, M.V. Lagged influence of North Atlantic Oscillation on population dynamics of a Mediterranean terrestrial salamander. Inter. J. Biomet. 2016, 60, 475–480. [Google Scholar] [CrossRef] [PubMed] [Green Version]
- Salvidio, S.; Pastorino, M.V. Spatial segregation in the European plethodontid salamander Speleomantes strinatii in relation to age and sex. Amphib. Reptil. 2002, 23, 505–510. [Google Scholar]
- White, G.C.; Anderson, D.R.; Burnham, K.P.; Otis, D.L. Capture-Recapture Removal Methods for Sampling Closed Populations; Los Alamos National Laboratory 8787 NERP: Los Alamos, NM, USA, 1982; pp. 1–235. [Google Scholar]
- Lanza, B. Speleomantes strinatii (Aellen, 1958). In Fauna d’Italia. 42, Amphibia; Lanza, B., Andreone, F., Bologna, M.A., Corti, C., Razzetti, E., Eds.; Edizioni Calderini: Bologna, Italy, 2007; pp. 152–156. [Google Scholar]
- Salvidio, S. Life history of the European plethodontid salamander Speleomantes ambrosii. Herpetol. J. 1993, 3, 55–59. [Google Scholar]
- Gayanilo, F.C., Jr.; Sparre, P.; Pauly, D. The FAO-ICLARM Stock Assessment Tools (FiSAT) User’s Guide; Food and Agricolture Organisation of the United Nations: Rome, Italy, 1996; pp. 1–126. [Google Scholar]
- Hammer, Ø.; Harper, D.A.T.; Ryan, P.D. PAST: Paleontological statistics software package for education and data analysis. Palaeontol. Electron. 2001, 4, 9. Available online: http://palaeo-electronica.org/2001_1/past/issue1_01.htm (accessed on 21 October 2019).
- ter Braak, C.J.F.; Verdonschot, F.M. Canonical correspondence analysis and related multivariate methods in aquatic ecology. Aquat. Sci. 1995, 57, 255–289. [Google Scholar] [CrossRef]
- Legendre, P.; Legendre, L. Numerical Ecology, 2nd ed.; Elsevier Science: Amsterdam, The Netherlands, 1998; pp. 612–616. [Google Scholar]
- Mammola, S.; Isaia, M. Cave communities and species interactions. In Cave Ecology; Ecological Studies 235; Moldovan, O.T., Kováč, L., Halse, S., Eds.; Springer Nature: Cham, Switzerland, 2018; pp. 255–267. [Google Scholar]
- Sket, B. Can we agree on an ecological classification of subterranean animals? J. Nat. Hist. 2008, 42, 1549–1563. [Google Scholar] [CrossRef]
- Bellés, X. Survival, opportunism and convenience in the processes of cave colonization by terrestrial faunas. Oecol. Aquat. 1991, 10, 325–335. [Google Scholar]
- Culver, D.C.; Pipan, T. Shallow Subterranean Habitats: Ecology, Evolution, and Conservation; Oxford University Press: Oxford, UK, 2014; pp. 188–199. [Google Scholar]
- Salvidio, S.; Palumbi, G.; Romano, A.; Costa, A. Safe caves and dangerous forests? Predation risk may contribute to salamander colonization of subterranean habitats. Sci. Nat. 2017, 104, 20. [Google Scholar] [CrossRef]
- Lunghi, E.; Manenti, R.; Ficetola, G.F. Do cave features affect underground habitat exploitation by non-troglobite species? Acta Oecol. 2014, 55, 29–35. [Google Scholar] [CrossRef]
- Ficetola, G.F.; Pennati, R.; Manenti, R. Spatial segregation among age classes in cave salamanders: Habitat selection or social interactions? Popul. Ecol. 2013, 55, 217–226. [Google Scholar] [CrossRef]
- Romero, A. Cave Biology: Life in Darkness; Cambridge University Press: Cambridge, UK, 2009; pp. 1–291. [Google Scholar]
- Romero, A. Caves as biological spaces. Polymath 2012, 2, 1–15. [Google Scholar]
- Mammola, S. Finding answers in the dark: Caves as models in ecology fifty years after Poulson and White. Ecography 2019, 42, 1331–1351. [Google Scholar] [CrossRef] [Green Version]
Figure 1.
Air temperatures recorded inside and outside the “Biospeleological Station of San Bartolomeo”. Busalla refers to the meteo-station of Busalla (Province of Genova). The recording period was October 12, 2002 – October 11, 2003. The data-loggers used were Hanna Instruments HI 140. 0 m = cave entrance; 4, 8, 12, and 16 are meters from the cave entrance.

Figure 2.
Canonical correspondence ordination diagram of the faunal community sampled from 2013 to 2019 in the Biospeleological Station of San Bartolomeo. DI = dipterans, FF = female salamanders, JJ = juvenile salamanders, MM = male salamanders, OT = other invertebrate taxa, SA = subadult salamanders. The number following the symbols indicate the year of sampling. COMPLEXITY is the wall heterogeneity, DISTANCE is the linear distance from the entrance and LUX is the illuminance.


Table 1.
Number of temperature records, minimum, maximum, mean, standard deviation and coefficient of variation of the annual temperatures recorded outside and inside the study site of the “Biospeleological Station of San Bartolomeo”, from October 2002 to October 2003. Table modified from reference [23].
| Busalla Meteo-Station | Biospelological Station of Besolagno | |||||
|---|---|---|---|---|---|---|
| 0 m from entrance | 4 m from entrance | 8 m from entrance | 12 m from entrance | 16 m from entrance | ||
| T record number | 7306 | 7600 | 7600 | 7600 | 7600 | 7600 |
| T minimum (°C) | −7.0 | 2.1 | 6.6 | 7.3 | 7.8 | 8.1 |
| T maximum (°C) | 35.6 | 15.3 | 18.2 | 17.0 | 16.7 | 15.3 |
| T mean (°C) | 12.6 | 10.0 | 11.3 | 11.2 | 11.1 | 10.9 |
| Standard deviation | 8.9 | 2.9 | 2.7 | 2.4 | 2.1 | 1.7 |
| Coefficient of variation | 68.4 | 29.4 | 24.3 | 21.6 | 18.9 | 15.1 |
Table 2.
Faunal community sampled outside, at the entrance and at different distances inside the “Biospeleological Station of San Bartolomeo”. The category “Undetermined insects” was not used in multivariate analyses.
Table 2.
Faunal community sampled outside, at the entrance and at different distances inside the “Biospeleological Station of San Bartolomeo”. The category “Undetermined insects” was not used in multivariate analyses.
| Outside | Entrance | 3 m | 6 m | 9 m | 12 m | 15 m | 18 m | 21 m | |
|---|---|---|---|---|---|---|---|---|---|
| Year 2013 | |||||||||
| Diptera | 62 | 5 | 1 | 0 | 0 | 2 | 0 | 1 | 1 |
| Acarina | 1 | 0 | 0 | 0 | 0 | 0 | 0 | 0 | 0 |
| Hymenoptera | 1 | 0 | 0 | 0 | 0 | 0 | 0 | 0 | 0 |
| Coleoptera | 7 | 0 | 0 | 0 | 0 | 0 | 0 | 0 | 0 |
| Homoptera | 9 | 0 | 0 | 0 | 0 | 0 | 0 | 0 | 0 |
| Araneida | 1 | 0 | 0 | 0 | 0 | 0 | 0 | 0 | 0 |
| Undetermined insects | 5 | 1 | 1 | 1 | 1 | 0 | 0 | 0 | 0 |
| Salamander males | 0 | 0 | 0 | 0 | 0 | 0 | 0 | 0 | 2 |
| Salamander females | 0 | 0 | 0 | 0 | 0 | 1 | 0 | 1 | 1 |
| Salamander subadults | 0 | 0 | 0 | 0 | 1 | 1 | 1 | 0 | 0 |
| Salamander juveniles | 0 | 0 | 5 | 2 | 2 | 1 | 0 | 0 | 0 |
| Year 2014 | |||||||||
| Diptera | 31 | 3 | 0 | 2 | 0 | 1 | 0 | 0 | 1 |
| Acarina | 0 | 1 | 0 | 0 | 0 | 0 | 0 | 0 | 0 |
| Hymenoptera | 3 | 0 | 0 | 0 | 0 | 0 | 0 | 0 | 0 |
| Coleoptera | 3 | 0 | 0 | 0 | 0 | 0 | 0 | 0 | 0 |
| Homoptera | 3 | 0 | 0 | 0 | 0 | 0 | 0 | 0 | 0 |
| Araneida | 0 | 0 | 0 | 0 | 0 | 0 | 0 | 0 | 0 |
| Undetermined insects | 1 | 0 | 1 | 2 | 0 | 0 | 0 | 0 | 0 |
| Salamander males | 0 | 0 | 0 | 1 | 0 | 4 | 1 | 0 | 0 |
| Salamander females | 0 | 0 | 0 | 0 | 0 | 1 | 1 | 0 | 0 |
| Salamander subadults | 0 | 0 | 1 | 1 | 1 | 0 | 0 | 0 | 0 |
| Salamander juveniles | 0 | 0 | 7 | 12 | 0 | 1 | 0 | 0 | 0 |
| Year 2015 | |||||||||
| Diptera | 30 | 1 | 2 | 3 | 0 | 2 | 3 | 5 | 2 |
| Acarina | 0 | 0 | 0 | 0 | 0 | 0 | 0 | 0 | 0 |
| Hymenoptera | 1 | 0 | 0 | 0 | 0 | 0 | 0 | 0 | 0 |
| Coleoptera | 4 | 0 | 0 | 0 | 0 | 0 | 0 | 0 | 0 |
| Homoptera | 1 | 0 | 0 | 0 | 0 | 0 | 0 | 0 | 0 |
| Araneida | 2 | 0 | 0 | 0 | 0 | 0 | 0 | 0 | 0 |
| Undetermined insects | 2 | 0 | 0 | 1 | 0 | 0 | 0 | 0 | 0 |
| Salamander males | 0 | 0 | 1 | 2 | 2 | 1 | 0 | 2 | 1 |
| Salamander females | 0 | 0 | 0 | 1 | 0 | 0 | 0 | 0 | 0 |
| Salamander subadults | 0 | 0 | 0 | 2 | 4 | 1 | 0 | 1 | 0 |
| Salamander juveniles | 0 | 0 | 6 | 2 | 0 | 1 | 0 | 0 | 0 |
| Year 2016 | |||||||||
| Diptera | 41 | 10 | 2 | 2 | 4 | 3 | 8 | 10 | 9 |
| Acarina | 0 | 0 | 1 | 0 | 0 | 0 | 0 | 0 | 0 |
| Hymenoptera | 1 | 0 | 0 | 0 | 0 | 0 | 0 | 0 | 0 |
| Coleoptera | 6 | 0 | 0 | 0 | 0 | 0 | 0 | 0 | 0 |
| Homoptera | 3 | 0 | 0 | 0 | 0 | 0 | 0 | 0 | 0 |
| Araneida | 0 | 1 | 0 | 0 | 0 | 0 | 0 | 0 | 0 |
| Undetermined insects | 0 | 0 | 1 | 0 | 0 | 0 | 0 | 0 | 0 |
| Salamander males | 0 | 0 | 0 | 1 | 0 | 1 | 1 | 0 | 0 |
| Salamander females | 0 | 0 | 0 | 0 | 0 | 0 | 1 | 0 | 0 |
| Salamander subadults | 0 | 0 | 0 | 1 | 0 | 1 | 0 | 0 | 0 |
| Salamander juveniles | 0 | 0 | 4 | 4 | 0 | 1 | 0 | 0 | 0 |
| Year 2017 | |||||||||
| Diptera | 64 | 2 | 0 | 0 | 1 | 1 | 1 | 1 | 1 |
| Acarina | 0 | 0 | 0 | 0 | 0 | 0 | 0 | 0 | 0 |
| Hymenoptera | 1 | 0 | 0 | 0 | 0 | 0 | 0 | 0 | 0 |
| Coleoptera | 8 | 0 | 0 | 0 | 0 | 0 | 0 | 0 | 0 |
| Homoptera | 32 | 2 | 0 | 0 | 0 | 0 | 0 | 0 | 0 |
| Araneida | 1 | 0 | 0 | 0 | 0 | 0 | 0 | 0 | 0 |
| Undetermined insects | 1 | 0 | 0 | 0 | 1 | 0 | 0 | 0 | 0 |
| Salamander males | 0 | 0 | 0 | 0 | 1 | 0 | 1 | 2 | 1 |
| Salamander females | 0 | 0 | 0 | 1 | 0 | 0 | 0 | 0 | 1 |
| Salamander subadults | 0 | 0 | 0 | 1 | 1 | 0 | 0 | 0 | 0 |
| Salamander juveniles | 0 | 0 | 4 | 3 | 0 | 0 | 0 | 0 | 0 |
| Year 2018 | |||||||||
| Diptera | 40 | 3 | 7 | 2 | 2 | 20 | 21 | 25 | 44 |
| Acarina | 0 | 0 | 0 | 0 | 0 | 0 | 0 | 0 | 0 |
| Hymenoptera | 0 | 0 | 0 | 0 | 0 | 0 | 0 | 0 | 0 |
| Coleoptera | 1 | 0 | 0 | 0 | 0 | 0 | 0 | 0 | 0 |
| Homoptera | 7 | 0 | 1 | 0 | 0 | 0 | 0 | 0 | 0 |
| Araneida | 3 | 0 | 1 | 0 | 0 | 0 | 0 | 0 | 0 |
| Undetermined insects | 0 | 0 | 1 | 0 | 0 | 0 | 0 | 0 | 0 |
| Salamander males | 0 | 0 | 0 | 3 | 1 | 1 | 1 | 0 | 0 |
| Salamander females | 0 | 0 | 0 | 0 | 0 | 0 | 0 | 1 | 0 |
| Salamander subadults | 0 | 0 | 0 | 3 | 0 | 0 | 0 | 0 | 0 |
| Salamander juveniles | 0 | 0 | 1 | 4 | 2 | 0 | 0 | 0 | 0 |
| Year 2019 | |||||||||
| Diptera | 11 | 1 | 0 | 1 | 3 | 3 | 4 | 3 | 0 |
| Acarina | 0 | 0 | 0 | 0 | 0 | 0 | 0 | 0 | 0 |
| Hymenoptera | 2 | 0 | 0 | 0 | 0 | 0 | 0 | 0 | 0 |
| Coleoptera | 3 | 0 | 0 | 0 | 0 | 0 | 1 | 0 | 0 |
| Homoptera | 9 | 1 | 0 | 0 | 0 | 0 | 0 | 0 | 0 |
| Araneida | 0 | 0 | 1 | 0 | 0 | 0 | 0 | 1 | 0 |
| Undetermined insects | 1 | 0 | 0 | 1 | 0 | 0 | 1 | 0 | 1 |
| Salamander males | 0 | 0 | 0 | 0 | 1 | 0 | 1 | 2 | 1 |
| Salamander females | 0 | 0 | 0 | 1 | 0 | 0 | 0 | 0 | 1 |
| Salamander subadults | 0 | 0 | 0 | 1 | 1 | 0 | 0 | 0 | 0 |
| Salamander juveniles | 0 | 0 | 4 | 3 | 0 | 0 | 0 | 0 | 0 |
Table 3.
Results of the two-way PERMANOVA (9999 permutations) comparing the temporal and spatial variation of the faunal community sampled along the Biospeleological Station of San Bartolomeo from 2013 to 2019.
Table 3.
Results of the two-way PERMANOVA (9999 permutations) comparing the temporal and spatial variation of the faunal community sampled along the Biospeleological Station of San Bartolomeo from 2013 to 2019.
| Sum of Squares | df | Mean Square | F | p | |
|---|---|---|---|---|---|
| Year | 1.7389 | 6 | 0.2898 | 0.9060 | 0.1336 |
| Cave zone | 3.0232 | 2 | 1.5116 | 4.7254 | 0.0001 |
| Year * Cave zone | −2.4987 | 12 | −0.2082 | −0.6509 | 0.9338 |
| Residual | 13.115 | 41 | 0.3199 | ||
| Total | 15.379 | 61 |
© 2019 by the authors. Licensee MDPI, Basel, Switzerland. This article is an open access article distributed under the terms and conditions of the Creative Commons Attribution (CC BY) license (http://creativecommons.org/licenses/by/4.0/).
Share and Cite
MDPI and ACS Style
Salvidio, S.; Costa, A.; Oneto, F.; Pastorino, M.V. Variability of A Subterranean Prey-Predator Community in Space and Time. Diversity 2020, 12, 17. https://0-doi-org.brum.beds.ac.uk/10.3390/d12010017
AMA Style
Salvidio S, Costa A, Oneto F, Pastorino MV. Variability of A Subterranean Prey-Predator Community in Space and Time. Diversity. 2020; 12(1):17. https://0-doi-org.brum.beds.ac.uk/10.3390/d12010017
Chicago/Turabian StyleSalvidio, Sebastiano, Andrea Costa, Fabrizio Oneto, and Mauro Valerio Pastorino. 2020. "Variability of A Subterranean Prey-Predator Community in Space and Time" Diversity 12, no. 1: 17. https://0-doi-org.brum.beds.ac.uk/10.3390/d12010017
Note that from the first issue of 2016, this journal uses article numbers instead of page numbers. See further details here.