Hydroxymethylfurfural Affects Caged Honey Bees (Apis mellifera carnica)


1
Faculty of Agriculture and Life Sciences, University of Maribor, Pivola 10, 2311 Hoče, Slovenia
2
USDA-ARS Thad Cochran Southern Horticultural Laboratory, Poplarville, MS 39470, USA
*
Author to whom correspondence should be addressed.
Diversity 2020, 12(1), 18; https://0-doi-org.brum.beds.ac.uk/10.3390/d12010018
Submission received: 28 November 2019
/
Revised: 23 December 2019
/
Accepted: 28 December 2019
/
Published: 31 December 2019
(This article belongs to the Special Issue Monitoring of Honey Bee Colony Losses)
Abstract
:A high concentration of hydroxymethylfurfural (HMF) (e.g., 15 mg HMF per kg honey) indicates quality deterioration for a wide range of foods. In honey bee colonies, HMF in stored honey can negatively affect bee health and survival. Therefore, in the laboratory, we experimentally determined the effects of HMF on the longevity and midgut integrity of worker Apis mellifera carnica by feeding bees standard diets containing five concentrations of HMF (100, 500, 1000, and 1500 ppm). Simultaneously, we also examined HMF’s effect on Nosema ceranae spore counts within infected honey bees. We performed an immunohistochemical analysis of the honey bee midgut to determine possible changes at the cellular level. No correlation was established between HMF concentration and N. ceranae spore counts. Negative effects of HMF on bees were not observed in the first 15 days of exposure. However, after 15 to 30 days of exposure, HMF caused midgut cells to die and an increased mortality of honey bee workers across treatment groups.
1. Introduction
Honey is a highly concentrated mixture of mainly two dissolved sugars, fructose and glucose, plus at least 22 other composite sugars [1] and 70 other compounds including proteins, vitamins, minerals, organic acids, aromatic compounds, and various derivatives of chlorophyil [2]. Many more honey components may remain undiscovered. Therefore, identifying potential fraudulent honeys by component analyses may be difficult unless specific breakdown products (metabolites) can be identified such as substances like hydroxymethylfurfural, or 5-hydroxymethyl-2-furaldehyde (C6H6O3) (HMF). HMF can be selectively produced from keto-hexose—notably from D-fructose [3] and other acidic media containing dissolved monosaccharides [4]. Normally, HMF is present in honey in trace amounts [5]. The rate of HMF formation in foods depends on environmental temperature, the type of sugar, pH, and the concentration of divalent cations in the medium [6,7]. Excessive heating or inappropriate storage conditions can increase HMF levels, which are recognized as a marker of quality deterioration for a wide range of foods containing carbohydrates [8]. Inappropriate heat processing of honey affects honey fermentation and reduces honey quality [9]. In fresh honey, HMF can occur at concentrations as high as 15 mg HMF/kg, but it normally occurs at levels between 0.06–0.2 mg HMF/kg [5]. For the most part, HMF is naturally present in honey, and at low concentrations (e.g., ~100–500 ppm) it does not reduce honey quality; it could thus be used as an identifier of a honey’s origin and quality. The Codex Alimentarius of the World Health Organization (WHO) and the European Union (EU Directive 110/2001) have defined a maximum HMF quantity level in heat-treated honeys (40 mg HMF/kg) above which honey quality begins to deteriorate. HMF concentration increases above 20 °C. Temperatures inside a hive normally exceed 20 °C (~28–30 °C) and in summer can reach as high as 40 °C or more, when the concentration of HMF can reach 10 mg/kg of honey [10], a level one-third of that known to be harmless to bees (30 mg/kg) [11]. Although these high levels of HMF are considered nontoxic to bees, few studies actually confirm a safe level of HMF in honey bee colonies [12]. Concentrations of HMF <10–15 mg/kg in honey pose little risk to honey bees, but toxic concentrations of HMF seems to induce lethal intestinal tract ulceration [12]. About 150 mg HMF/kg of commercially acid-hydrolyzed inverted sugar syrup can cause 50% bee mortality within 16 days [11]. The HMF concentration in inverted syrup for feeding bees should not exceed 20 mg/kg, as in most honeys [13].
There is no standard limit value of HMF in bee nourishment. Approximately 250 ppm HMF in the honey bee diet is considered toxic [14]. High concentrations of HMF in stored honey could represent a factor in the early death of bees and in the extinction of honey bee colonies [15]. It is therefore important to understand the potential adverse effects of high HMF doses on honey bees. Thus, the objective of this study was to determine the toxic effects and mode of action of HMF on caged bees fed in laboratory assays. We also used an immunohistochemical assay to examine the impact of HMF toxicity on the cellular death of epithelial cells lining the worker midgut.
2. Materials and Methods
2.1. Toxicological Tests
Toxicological tests on the autochthonous Carniolan honey bee Apis mellifera carnica occurred in laboratory conditions. Worker bees were maintained in incubators set at a near-constant 28 °C and at ~ 65% relative humidity (RH), according to normal temperatures outside the brood nest [16,17]. This was to simulate the environment outside the brood nest, where we normally install sugar patties in honey bee colonies.
Plastic ~8 cm (H) × ~12 cm (Dia.) “cake” boxes originally designed to hold up to 100 CDs were repurposed as bee containment units (test chambers) by drilling ~80 circular ventilation holes, each ~2 mm wide, into the top cover. Similar experimental plastic box approaches have been used in previous experiments [18,19,20]. Two additional holes of 12 mm diameter were added as placeholders for plastic feeding tubes, which provided bees with Apifonda sugar candy and water, respectively. Apifonda contains sucrose, glucose syrup, and invert sugar syrup and corresponds to the nutritional value of 0.9 kg crystalline sugar (Südzucker Sugar, Mannheim, Germany). To simulate a colony habitat, each containment unit contained a 4 cm × 5 cm piece of wax foundation. We divided the bees into five groups. Each group of 70 bees was placed into its own individual containment unit. We provided thoroughly homogenized Apifonda as bee nourishment, into which was added HMF (5-hydroxymethyl-2-furaldehyde, Sigma Aldrich) at concentrations of 0 mg HMF/kg candy (control), 100 mg HMF/kg, 500 mg HMF/kg, 1000 mg HMF/kg, and 1500 mg HMF/kg. We took the capped brood from three clinically healthy honey bee colonies a day before starting the experiment and placed combs into the incubator at 34.5 °C and 65% RH. The next day, newly emerged 0–24 h old bees were placed into the containment units. Each HMF-treated group was replicated five times. We recorded the daily food consumption and daily mortality rates of the confined worker bees.
Dead bees exposed to the control and HMF concentrations were counted and numbers were deducted from the initial bee population (n = 70). The survival rate was calculated as 100% minus mortality per control or treatment groups. Data analyses were performed using ANOVA (analysis of variance) in Statgraphic [21]. Mean bee survival rates were compared among the treatment groups with a one-way ANOVA and mean separation was accomplished with Tukey tests.
2.2. Immunohistochemical Analyses
We established 5 groups of 50 bees. Brood combs were obtained from clinically healthy honey bee colonies in the same way as described for the toxicological tests. Newly emerged 0–24 h old bees were placed into the containment units. Bees in the first group received no HMF added to the Apifonda candy. Group 2 received Apifonda containing 100 mg/kg of HMF. Group 3 received Apifonda containing 500 mg/kg of HMF. Group 4 received Apifonda containing 1000 mg/kg of HMF. Group 5 received Apifonda containing 1500 mg /kg of HMF. Three bees from each of these treatment groups were randomly sampled at 5 day intervals: on day 5, 10, 15, and 20. Sampled bees were anesthetized by subjecting them to cold for about 10 min, and their midgut was removed. Midguts were fixed in 10% neutral buffered formalin, dehydrated in ethanol, and embedded in paraffin wax, which was sliced into 5 µm sections that were then de-paraffinized and processed following the instructions provided with the In Situ Cell Death Detection Kit AP’ (ISCDDK) (Roche, Mannheim, Germany). The EnVision System alkaline phosphatase kit (Dako) was used to obtain a red-colored precipitate in the sections treated with the ISCDDK assay reagents. The sections were counterstained with hematoxylin. TUNEL-positive cells possessed red nuclei, which indicate the reaction products of cell death. TUNEL-negative nuclei of healthy, intact cells appeared blue. A control labeling of midgut tissue was accomplished by substituting the deoxynucleotidyl transferase (TdT) enzyme with phosphate-buffered saline (PBS) during the TUNEL reaction. Sections were mounted in Faramount aqueous mounting medium (Dako). Slide contents were analyzed and digitally photo-documented with a bright field light microscope at 400× magnification. We repeated this immunohistochemical experiment twice.
2.3. Semi-Quantitative Analysis of Cell Death
TUNEL-labeled tissue slides were used for the quantification of cell type and cell death using ISCDDK. For each experimental group of bees, approximately 300 total cells from each individual (three bees at different collection times per group) were counted in random fields on different slides. The results were expressed as the proportion of cells with positive staining. To confirm reproducibility, 25% of the slides were chosen randomly and scored twice [22,23].
2.4. Nosema Ceranae Spore Counts
To quantify N. ceranae infection in sampled bees, we temporarily stored dead bees from separate containment units in a freezer. All dead bees in consecutive days from experimental cages were sampled and examined for N. ceranae spores. Nosema spores on adult bees were potentially derived from combs where bees emerged; we assumed that spores were equally distributed between bees. Altogether, 350 bees were examined microscopically for N. cerane spores across all treatment groups. Species determination of N. ceranae in these frozen bee samples was confirmed using multiplex PCR [24]. Spore counts were made using a Bürker hemocytometer and a Zeiss light microscope under phase contrast (Axioskop 2 Plus, Zeiss, Jena, Germany). Spore samples were extracted from a bee’s detached abdomen by grinding the tissue in 1 mL water with a mortar and pestle. A drop (~60 μL) of this homogenous suspension was applied to a hemocytometer and counting was conducted a few minutes later when spores fully settled. The average number of N. ceranae spores was calculated after counting the number of spores in all four outer squares divided by four for each dissected bee.
3. Results
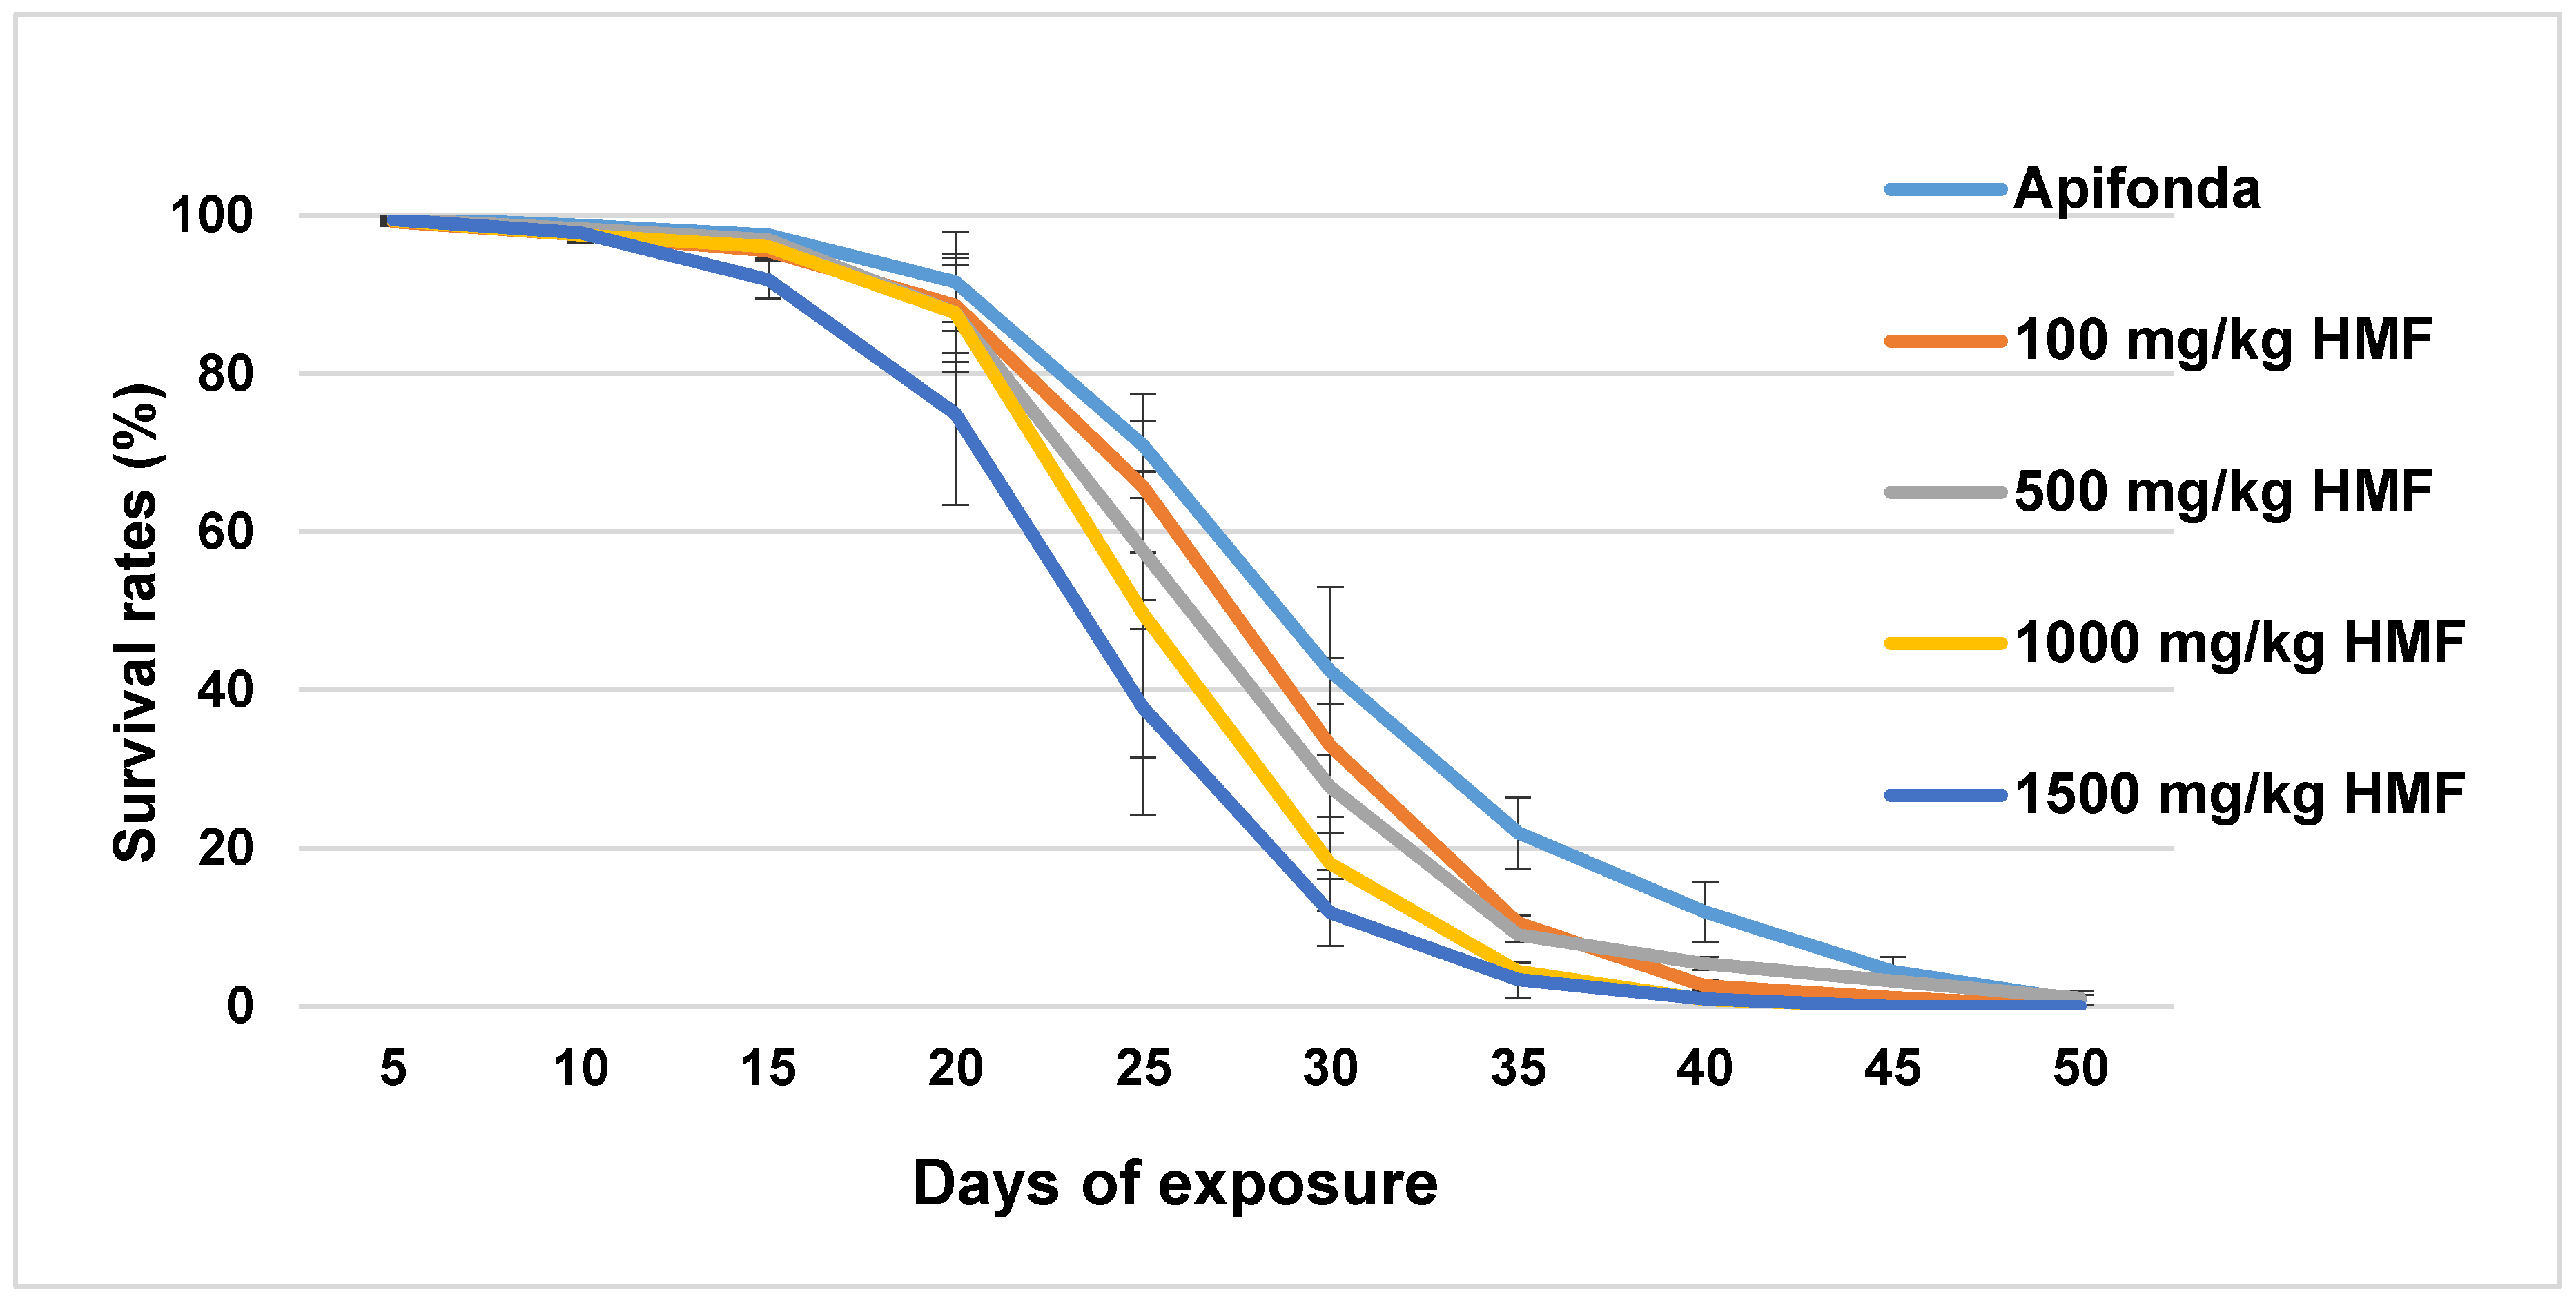
3.1. Longevity of Bees
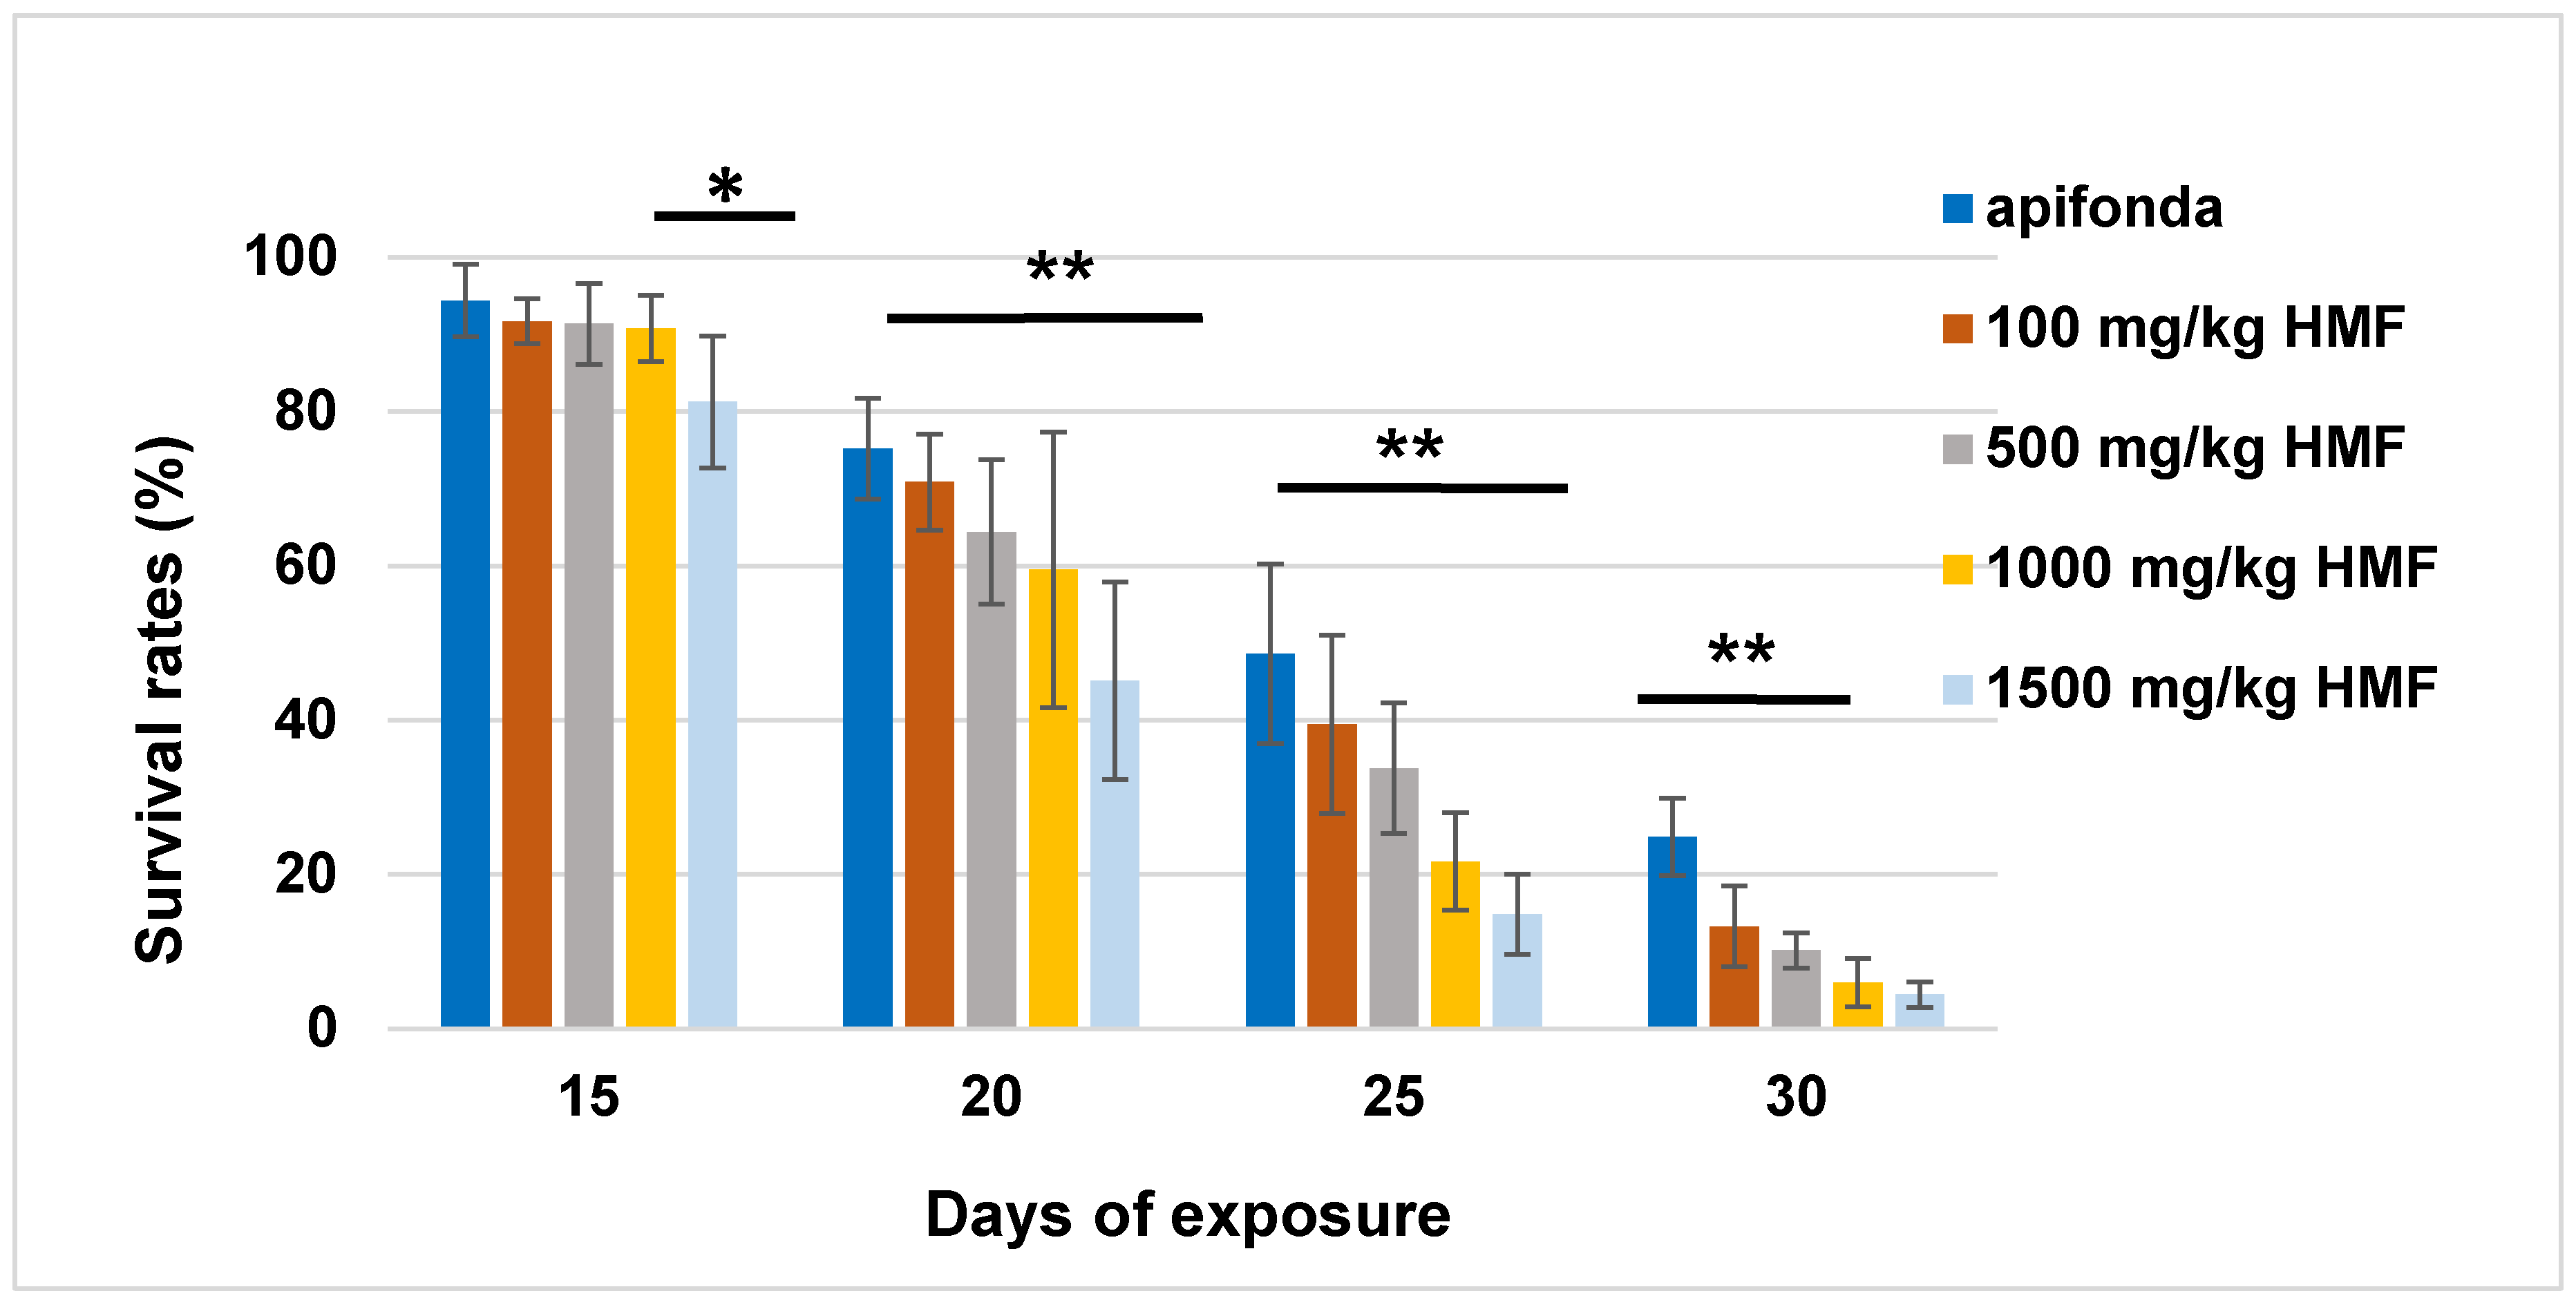
About 90% of caged bees in each treatment group survived the first 15 days (Figure 1). After day 30, less than 30% of bees were left alive in the five treatment groups, which included the Apifonda control. The steepest declines in bee survival occurred between days 15–30 post-treatment (Figure 1). Treatment differences were detected among the five treatment groups (Figure 1; F = 2.968; df = 4; p = 0.028). The longevity of the bees receiving the highest HMF concentration (1500 mg HMF/kg) was reduced when compared with other HMF treatment groups and untreated control bees (Figure 2).
3.2. Nosema Ceranae Spores
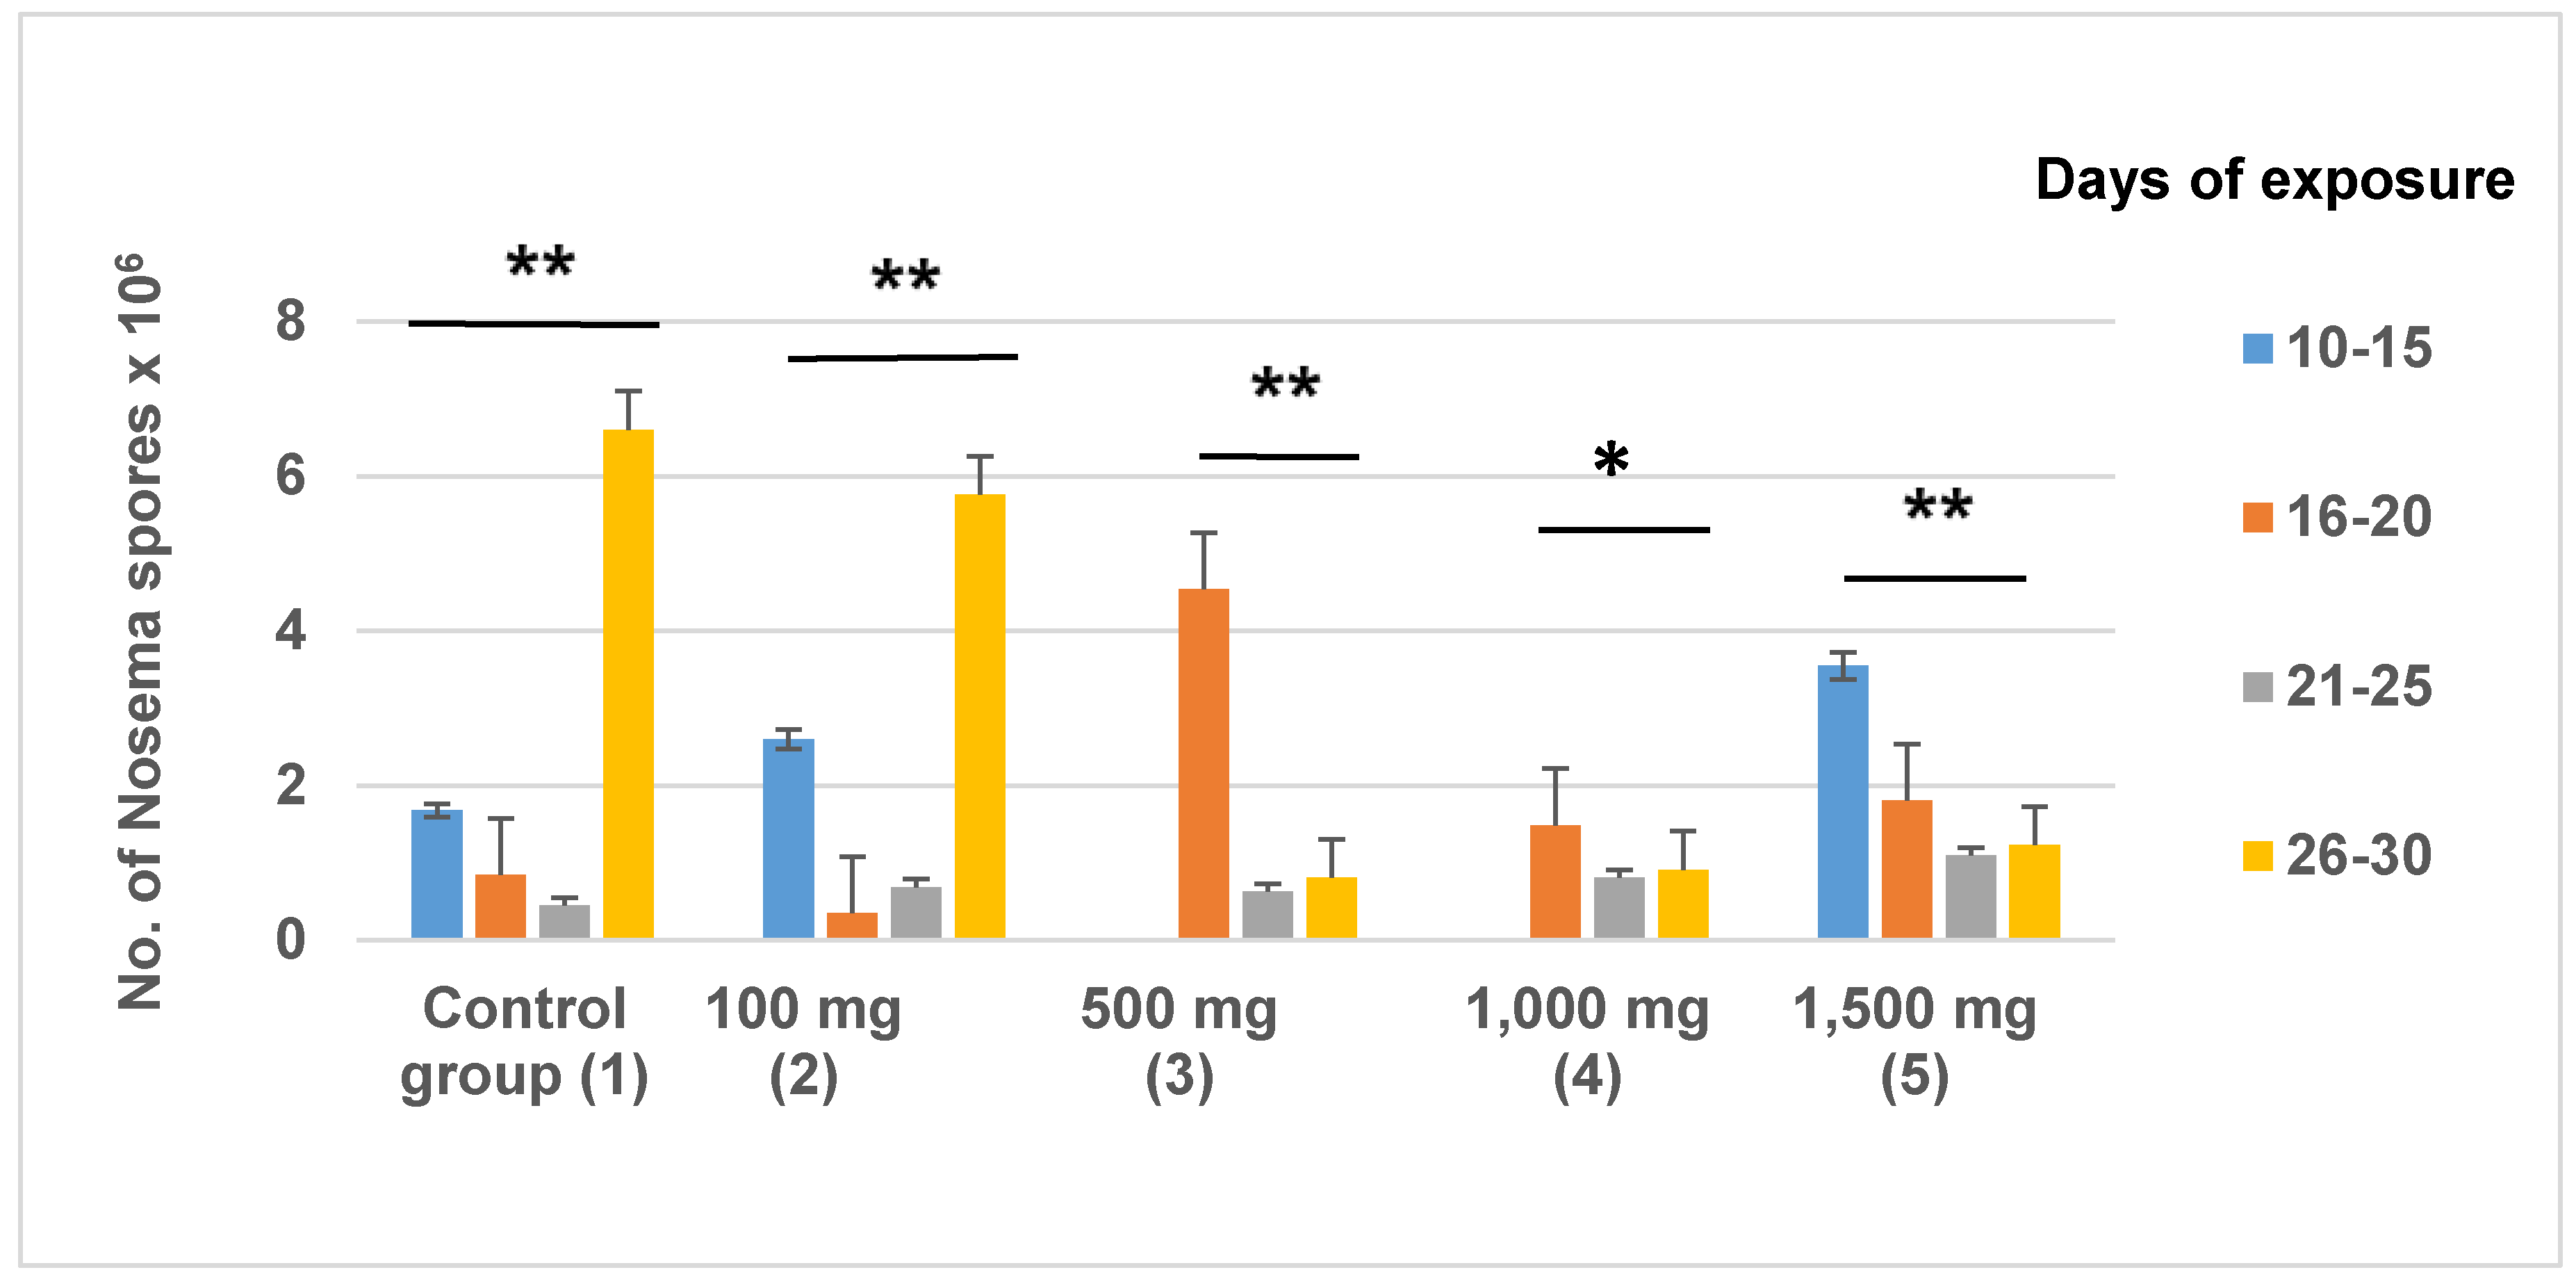
After newly emerged bees were fed on 100 mg/kg HMF for 10 days, Nosema was detected in dead bees at an average density of 2.6 × 10⁶ spores/bee. From day 11 until the end of the experiment, spores were present in variable numbers in each of the treatment groups. The highest number of spores (6.6 × 10⁶) was observed between days 26 and 30 in untreated control bees (Figure 3). From day 21 until the end of experiment, the highest number of spores per individual bee (5.76 × 10⁶) was noted in the group receiving 100 mg/kg of HMF in Apifonda candy. There were no statistically significant differences between the groups in the interval between day 10 and day 20 (F = 0.642; df = 4; p = 0.634). From day 21 until the end of the experiment, there was a statistically significant difference between treatment groups. A high density of Nosema spores (3.55 × 10⁶) was detected in the youngest bees (10–15 days) exposed to 1500 mg/kg of HMF in Apifonda, and a lower N. ceranae spore density was found in bees that died later in the course of the experiment.
3.3. Immunohistochemical Analyses
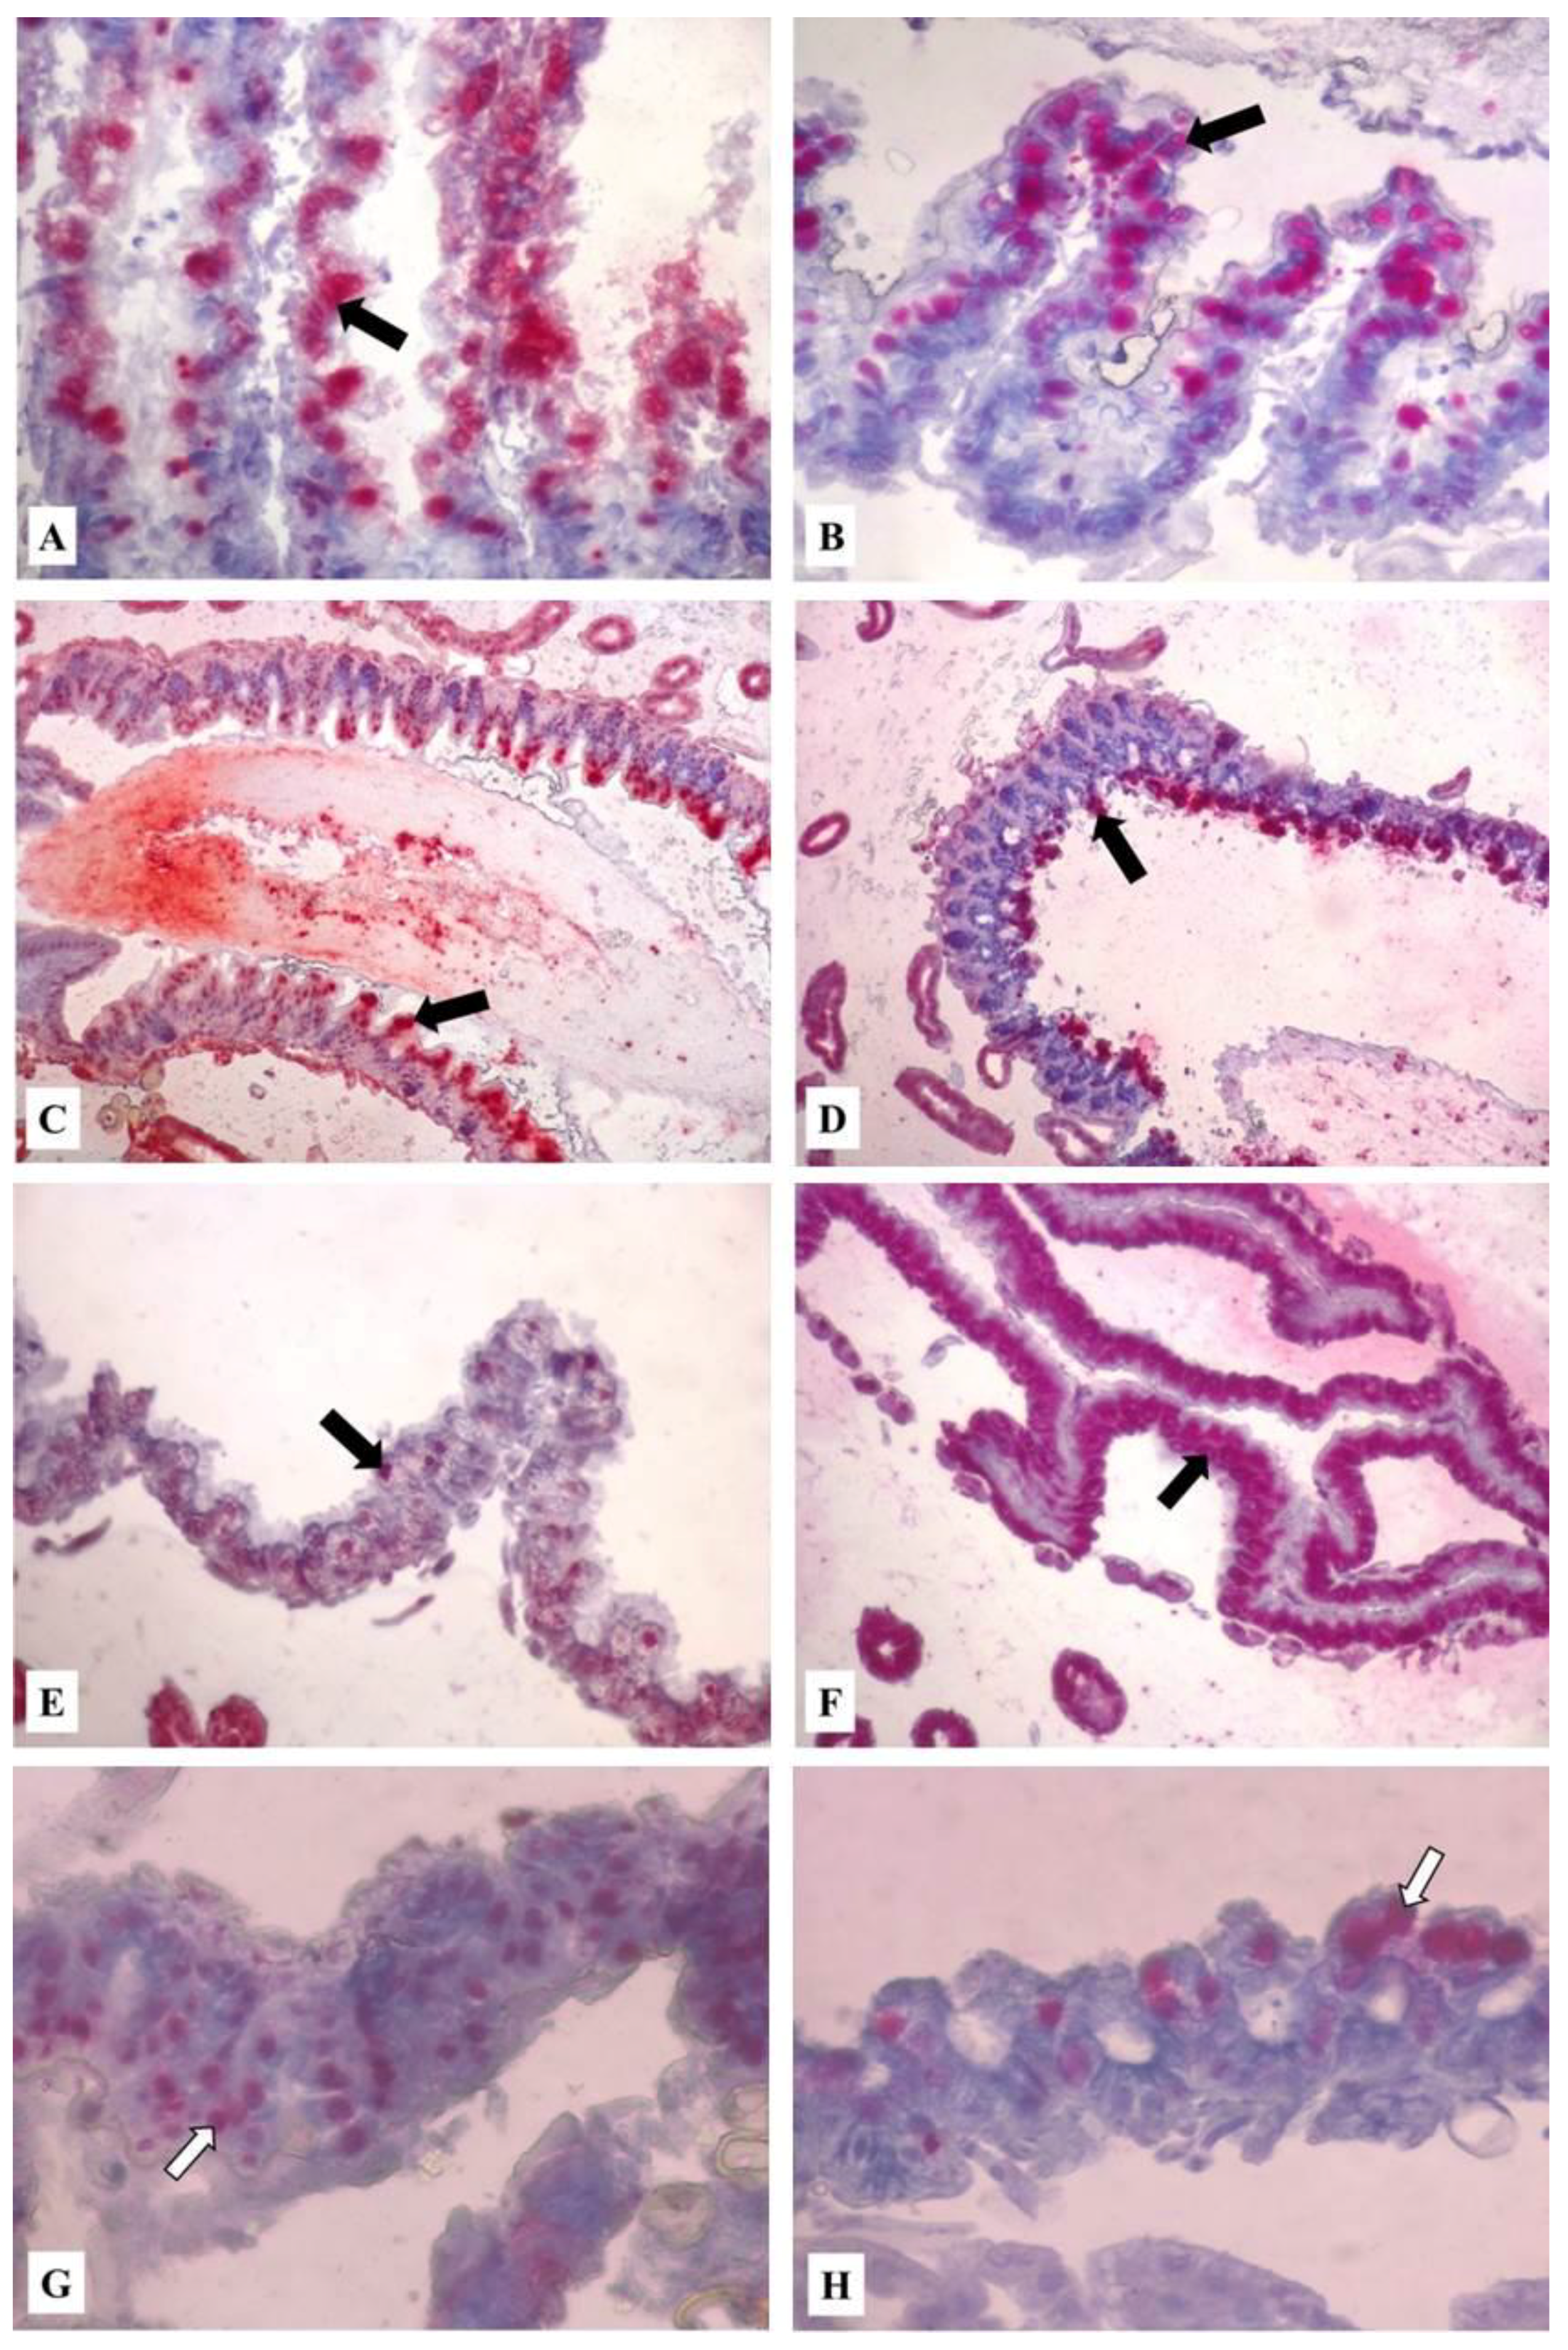
Varieties of apoptotic midgut cell deletions were observed in bees exposed to different HMF concentrations for 10 days. The amount of immunohistochemically positive cells was not dependent on HMF concentration between 5 and 30 days (Figure 4). However, in bees exposed to the lowest dose of HMF, cell death was observed in the epithelium of the midgut (sporadic positive cells) but at a level below that of bees fed higher concentrations of HMF. In contrast, the level of cell death in the midgut epithelium of bees fed with candy containing 500 mg/kg of HMF in Apifonda remained high throughout the bioassay (Table 1).
Notably, the proportion of positive midgut digestive cells in the bees treated with 100 and 500 mg/kg HMF in Apifonda (Figure 4A,B) was much lower than in the groups exposed to 1000 or 1500 mg/kg HMF. In bees exposed to 100 mg/kg of HMF, affected midgut epithelial cells were vacuolated with apical cell fragments released into the lumen (Figure 4A). Similar vacuolization was observed in bees exposed to 500 mg/kg HMF in Apifonda (Figure 4B). Midgut cells with positive red reaction products in the epithelium apical region were also seen in bees fed with candy containing 100 or 1500 mg/kg of HMF for 10 days (Figure 4C,D) and also in bees fed with candy containing 1500 mg/kg of HMF for 15 days (Figure 4F). Midgut epithelial cells were still intact and attached to the basal membrane even at the highest HMF concentration over the course of the experiment. In the control group of untreated bees (without added HMF), sporadic midgut cells with specific red reaction products were found (Figure 3EH). In live bees exposed to any HMF dose for 25 or 30 days, no morphological alterations or increased levels of positive ISCDDK cells were seen (Figure 4G). Bees fed with the two highest HMF concentrations, 1000 or 1500 mg/kg of HMF, and surviving to 25–30 days displayed few midgut cells with positive reaction products, an observation similar to the reaction levels displayed by untreated control bees. Taken together, the highest levels of ISCDDK-positive midgut epithelial cells were found in bees fed with 500, 1000, or 1500 mg/kg of HMF in Apifonda from 15 to 20 days. After that time, there was a notable decrease in the proportion of midgut cells with specific red reaction products. The most persistent and high levels of apoptotic cells throughout the experiment were found in bees fed with 500 mg/kg of HMF. The proportion of apoptotic cells remained high when compared with all treatment groups, including the controls. We did not include Nosema-infested bees in ISCDDK assays in order to exclude the effect of parasites on midgut cell death. The lowest HMF dose effect at the first and second sampling dates (5 and 10 days) was demonstrated by red reaction products in midgut epithelial cells (Figure 4A,C).
4. Discussion
Carniolan honey bees exposed to HMF suffer increased death, especially after feeding on it for 15 to 30 days. Bee survival, therefore, could be improved by reducing worker exposure to HMF in their foodstuffs. In a large-scale experiment, a relatively low concentration of HMF (150 mg/kg) found in acid-hydrolyzed inverted sugar syrup induced 50% bee mortality within 16 days after the start of feeding. Likewise, high-fructose corn syrup, a saccharose replacement for honey bees, containing 150 mg/kg HMF also induces 50% of bee mortality within about 19 days of feeding [14]. An HMF concentration of 30 mg/kg to 48 mg/kg is supposed to be harmless to honey bee workers, whether or not bees are overwintering [11]. The concentration of HMF in winter food stores is lower than that of initial syrups deposited by bees. Perhaps honey bees can safely metabolize or detoxify small quantities of HMF in their stored foods [25]. Except for these small-scale studies, few studies have systematically examined the effect of HMF on bee health and physiology, which is surprising given that concentrations of 7500 ppm HMF (mg/kg) or higher have been reported to cause massive bee kills, i.e., 100% mortality of bee larvae with LC50 for larvae ranging from 2424 ppm to 4280 ppm. Thus, larvae appear far more sensitive to HMF than adult honey bees [26]. Clearly, our results coupled with evidence cited earlier confirm the toxicity of HMF to adult and developing honey bees and the need for its mitigation in commercial bee yards. A deadly chemical interaction may occur when HMF builds up in particular foodstuffs. For instance, sugar syrup or high-fructose corn syrup enhance the acute toxicity of HMF and double rates of honey bee mortality (from 40% in Apifonda controls to 80% in sugar syrups) at a high concentration of around 1500 mg/kg of HMF when compared with its combination with Apifonda candy. The effects of HMF in the first two weeks of feeding are sublethal for bees, but after 14 days, HMF starts to become fatal. More studies are needed to assess the tolerances of honey bees to prolonged oral exposure to HMF.
The mechanism through which HMF sickens or kills honey bees is unknown. We surmise that the midgut is the first bodily tissue exposed to the activity of HMF as well as to other toxins, including pathogens. Midgut epithelial cells are the first line of defense against both pathogens and toxins [27]; [28] and potential dysbiosis together with other disorders can present an important source of energy dysregulation [29] in epithelial midgut cells. Our midgut analysis of worker honey bees demonstrates hypertrophic enlargement of the digestive cells in the first 5 days after HMF treatment. Later, ~10 days post-HMF treatment, numerous affected cells were released into the lumen, as evidenced by observable apoptotic cell death in the apical region of midgut villi. Between the 10th and 15th day of feeding, 1000 mg/kg of HMF and 1500 mg/kg of HMF increased the cell death rate, resulting in the shedding of dead cells from the epithelium into the midgut lumen. In contrast, 500 mg/kg of HMF resulted in low levels of cell death.
Initially, such changes to the apical epithelium and some cell death are adaptive, but uncontrolled epithelial cell losses without adequate regeneration leads to loss in midgut function [30,31]. In a control group where bees received only sugar candy (Apifonda), high proportions of apoptotic columnar cells were found, which indicates a high level of cell turnover. In bees exposed to high doses of HMF, normal apoptosis was followed by morphological changes typical of necrotic deletion. In this study, we found that caged bees were sensitive to the HMF treatment, as observed through changes at the tissue level, and its potential detrimental effect can result in higher bee mortality.
In addition to the differences in the mortality rates induced by HMF treatment, there was accompanying histopathology whereby lesions formed within midgut cells. HMF induced a higher cell death rate in comparison with untreated bees by the 5th, 10th, and 15th day post-treatment. Early and accelerated levels of apoptosis induced by HMF toxicity may serve as a possible defense mechanism in the midgut that impedes HMF from affecting neighboring epithelial cells, a similar mechanism to that employed when cells are infected with pathogenic organisms [32]. The midgut of honey bees also undergoes hypertrophic changes in the first day after treatment and continued to slough dead cells into the lumen. Later, a reduction in apoptotic cell deletion and cell lysis occur along the entire midgut epithelium. Thus, damaged epithelium regenerates as dying cells gradually separate from the basal lamina. The new epithelium might also form just after the complete discharging of the degenerated epithelium, when only regenerative cell groups and remnants of cell membranes are observed [33]. This regenerative process in the midgut may importantly enhance bee survival after prolonged exposure to HMF.
Clearly, HMF has a dosage-dependent cytotoxic effect on honey bee digestion; both sublethal and subclinical changes to the midgut occur at the cellular level before bees eventually die from high doses. Adverse effects of HMF feeding needs study at the colony level because bees may rely on unknown behavioral mechanisms to mitigate the toxic effects of HMF-contaminated food stores on bee and brood survival.
Author Contributions
Conceptualization, A.G. and S.J.; methodology, A.G.; investigation, S.J. and A.G.; data curation, B.S. and A.G., writing—original draft preparation, A.G. and S.J., writing—review and editing, B.S.; supervision, A.G. and B.S. Allauthors have read and agreed to the published version of the manuscript. All authors have read and agreed to the published version of the manuscript.
Funding
This research was funded by the Slovenian Research Agency, Research core funding No. P1-164; Research for improvement of safe food and health.
Acknowledgments
We are grateful for the assistance provided by Mitja Nakrst and Maja Ivana Smodiš Škerl in the experiments. The study was supported and research topics discussed by COLOSS (Prevention of honey bee COlony LOSSes, http://coloss.org/).
Conflicts of Interest
The authors declare no conflict of interest. The funders had no role in the design of the study; in the collection, analyses, or interpretation of data; in the writing of the manuscript, or in the decision to publish the results.
References
- White, J.W., Jr.; Doner, L. Honey Composition and Properties. In Beesource Beekeeping; U.S. Government Printing Office: Washington, DC, USA, 1980; pp. 82–91. [Google Scholar]
- Hermersdörfer, H.J. Lipp: Der Honig. 3. völlig neubearbeitete und erweiterte Auflage. 205 Seiten, 66 Abbildungen, 8 Farbtafeln und 30 Tabellen. Verlag Eugen Ulmer, Stuttgart 1994. Preis: 88,-DM. Food/Nahrung 1995, 39, 540. [Google Scholar]
- Shalumova, T.; Tanski, J.M. 5-(Hy-droxy-meth-yl)furan-2-carbaldehyde. Acta Cryst. Sect. E Struct. Rep. Online 2010, 66, o2266. [Google Scholar] [CrossRef]
- Teixidó, E.; Santos, F.J.; Puignou, L.; Galceran, M.T. Analysis of 5-hydroxymethylfurfural in foods by gas chromatography—Mass spectrometry. J. Chromatogr. A 2006, 1135, 85–90. [Google Scholar] [CrossRef]
- Basumallick, L.; Rohrer, J. Determination of Hydroxymethylfurfural in Honey and Biomass. Thermo Sci. Dionex Appl. Note Update 2001, 10, 6. [Google Scholar]
- Lee, H.S.; Nagy, S. Relative reactivities of sugars in the formation of 5-hydroxymethylfurfural in sugar-catalyst model systems1. J. Food Process. Preserv. 1990, 14, 171–178. [Google Scholar] [CrossRef]
- Gökmen, V.; Açar, Ö.Ç.; Köksel, H.; Acar, J. Effects of dough formula and baking conditions on acrylamide and hydroxymethylfurfural formation in cookies. Food Chem. 2007, 104, 1136–1142. [Google Scholar] [CrossRef]
- Morales, F.J. Hydroxymethylfurfural (HMF) and Related Compounds. In Process-Induced Food Toxicants: Occurrence, Formation, Mitigation, and Health Risks; John Wiley & Sons: Hoboken, NJ, USA, 2008; ISBN 978-0-470-07475-6. [Google Scholar]
- Tosi, E.; Ciappini, M.; Ré, E.; Lucero, H. Honey thermal treatment effects on hydroxymethylfurfural content. Food Chem. 2002, 77, 71–74. [Google Scholar] [CrossRef]
- De Ribeiro, R.O.R.; da Carneiro, C.S.; Mársico, E.T.; Cunha, F.L.; Conte, C.A., Jr.; Mano, S.B. Influence of the time/temperature binomial on the hydroxymethylfurfural content of floral honeys subjected to heat treatment. Ciência Agrotecnologia 2012, 36, 204–209. [Google Scholar] [CrossRef] [Green Version]
- Jachimowicz, T.; Sherbiny, G.E. Zur problematik der verwendung von invertzucker für die bienenfütterung. Apidologie 1975, 6, 121–143. [Google Scholar] [CrossRef] [Green Version]
- Bailey, L. The Effect of Acid-Hydrolysed Sucrose on Honeybees. J. Apic. Res. 1966, 5, 127–136. [Google Scholar] [CrossRef]
- Kammerer, F.X. Aktueller Standder Erkenntnisse über die Fütterung vonBienen mit Zucker. Imkerfreund 1989, 1, 12–14. [Google Scholar]
- LeBlanc, B.W.; Eggleston, G.; Sammataro, D.; Cornett, C.; Dufault, R.; Deeby, T.; Cyr, E. Formation of Hydroxymethylfurfural in Domestic High-Fructose Corn Syrup and Its Toxicity to the Honey Bee (Apis mellifera). J. Agric. Food Chem. 2009, 57, 7369–7376. [Google Scholar] [CrossRef] [PubMed]
- Van der Zee, R.; Pisa, L. Bijensterfte 2009-10 en toxische invertsuikersiroop. NCB Rapp. 2010, 2, 1–15. [Google Scholar]
- Stabentheiner, A.; Kovac, H.; Brodschneider, R. Honeybee Colony Thermoregulation—Regulatory Mechanisms and Contribution of Individuals in Dependence on Age, Location and Thermal Stress. PLoS ONE 2010, 5, e8967. [Google Scholar] [CrossRef] [PubMed]
- Gates, B.N. The Temperature of the Bee Colony; U.S. Department of Agriculture: Washington, DC, USA, 1914.
- Evans, J.D.; Chen, Y.P.; di Prisco, G.; Pettis, J.; Williams, V. Bee cups: Single-use cages for honey bee experiments. J. Apic. Res. 2009, 48, 300–302. [Google Scholar] [CrossRef]
- Gregorc, A.; Alburaki, M.; Werle, C.; Knight, P.R.; Adamczyk, J. Brood removal or queen caging combined with oxalic acid treatment to control varroa mites (Varroa destructor) in honey bee colonies (Apis mellifera). Apidologie 2017, 48, 821–832. [Google Scholar] [CrossRef] [Green Version]
- Gregorc, A.; Sampson, B.; Knight, P.R.; Adamczyk, J. Diet quality affects honey bee (Hymenoptera: Apidae) mortality under laboratory conditions. J. Apic. Res. 2019, 58, 492–493. [Google Scholar] [CrossRef]
- Statistical Graphics Corporation. Statgraphics Version 5: Statistical Graphics System; STSC Inc.: Rockville, MD, USA, 1991; ISBN 978-0-926683-06-8. [Google Scholar]
- Bernet, D.; Schmidt, H.; Meier, W.; Burkhardt-Holm, P.; Wahli, T. Histopathology in fish: Proposal for a protocol to assess aquatic pollution. J. Fish Dis. 1999, 22, 25–34. [Google Scholar] [CrossRef]
- Gregorc, A.; Silva-Zacarin, E.C.M.; Carvalho, S.M.; Kramberger, D.; Teixeira, E.W.; Malaspina, O. Effects of Nosema ceranae and thiametoxam in Apis mellifera: A comparative study in Africanized and Carniolan honey bees. Chemosphere 2016, 147, 328–336. [Google Scholar] [CrossRef] [PubMed] [Green Version]
- Higes, M.; García-Palencia, P.; Martín-Hernández, R.; Meana, A. Experimental infection of Apis mellifera honeybees with Nosema ceranae (Microsporidia). J. Invertebr. Pathol. 2007, 94, 211–217. [Google Scholar] [CrossRef]
- Ceksteryte, V.; Racys, J. The quality of syrups used for bee feeding before winter and their suitability for bee wintering. J. Apic. Sci. 2006, 5, 5–14. [Google Scholar]
- Krainer, S.; Brodschneider, R.; Vollmann, J.; Crailsheim, K.; Riessberger-Gallé, U. Effect of hydroxymethylfurfural (HMF) on mortality of artificially reared honey bee larvae (Apis mellifera carnica). Ecotoxicology 2016, 25, 320–328. [Google Scholar] [CrossRef] [PubMed]
- Okuda, K.; de Almeida, F.; Mortara, R.A.; Krieger, H.; Marinotti, O.; Tania Bijovsky, A. Cell death and regeneration in the midgut of the mosquito, Culex quinquefasciatus. J. Insect Physiol. 2007, 53, 1307–1315. [Google Scholar] [CrossRef] [PubMed]
- Rost-Roszkowska, M.M.; Poprawa, I.; Klag, J.; Migula, P.; Mesjasz-Przybyłowicz, J.; Przybyłowicz, W. Degeneration of the midgut epithelium in Epilachna cf. nylanderi (Insecta, Coccinellidae): Apoptosis, autophagy, and necrosis. Can. J. Zool. 2008, 86, 1179–1188. [Google Scholar]
- Prochazkova, P.; Roubalova, R.; Dvorak, J.; Tlaskalova-Hogenova, H.; Cermakova, M.; Tomasova, P.; Sediva, B.; Kuzma, M.; Bulant, J.; Bilej, M.; et al. Microbiota, Microbial Metabolites, and Barrier Function in A Patient with Anorexia Nervosa after Fecal Microbiota Transplantation. Microorganisms 2019, 7, 338. [Google Scholar] [CrossRef] [Green Version]
- Chaffey, N.; Alberts, B.; Johnson, A.; Lewis, J.; Raff, M.; Roberts, K.; Walter, P. Molecular biology of the cell. 4th edn. Ann. Bot. 2003, 91, 401. [Google Scholar] [CrossRef]
- Hill, C.A.; Pinnock, D.E. Histopathological Effects ofBacillus thuringiensison the Alimentary Canal of the Sheep Louse, Bovicola ovis. J. Invertebr. Pathol. 1998, 72, 9–20. [Google Scholar] [CrossRef]
- James, E.R.; Green, D.R. Infection and the origins of apoptosis. Cell Death Differ. 2002, 9, 355–357. [Google Scholar] [CrossRef]
- Rost-Roszkowska, M.M.; Machida, R.; Fukui, M. The role of cell death in the midgut epithelium in Filientomon takanawanum (Protura). Tissue Cell 2010, 42, 24–31. [Google Scholar] [CrossRef]
Figure 1.
Survival rates of caged bees (expressed in %) are shown in 5 day intervals for each treatment group and the untreated control group (Apifonda). Bars indicate ± SD.
Figure 1.
Survival rates of caged bees (expressed in %) are shown in 5 day intervals for each treatment group and the untreated control group (Apifonda). Bars indicate ± SD.

Figure 2.
The relative number of live caged bees on the 15th, 20th, 25th, and 30th day of the experiment. The figure shows dates with the highest differences of survived bees between treatment groups. Asterisks indicate statistically significant differences between treatment groups. The Tukey test shows a difference at p < 0.05 (*) and at p < 0.01 (**).

Figure 3.
The number of Nosema ceranae spores counted in dissected bees. The average values are expressed in millions of spores per worker bee. HMF quantity is expressed as mg/kg of HMF in Apifonda candy. The control group received only Apifonda candy. Asterisks indicate a statistically significant difference of N. ceranae spore counts inside a treatment group on different sampling dates. The Tukey test shows a difference at p < 0.05 (*) and at p < 0.01 (**).Note that N. ceranae spores were not detected in bees from treatment groups 3 and 4 at the first sampling date. Across all treatment group, 350 bees were examined.

Figure 4.
Midgut of formalin-fixed, paraffin-embedded tissue of worker bees exposed to HMF. Detection of programmed cell death by TUNEL using the In Situ Cell Death Detection Kit. Red azo-dye staining is localized in midgut epithelial cell nuclei (arrows). (A) 100 mg/kg of HMF in Apifonda diet (5 days), magnification 200×; (B) 500 mg/kg of HMF (5 days), magnification 200×; (C) 100 mg/kg of HMF (10 days), magnification 100×; (D) 1500 mg/kg of HMF (10 days), magnification 100×; (E) control group (15 days), magnification 200×. (F) 1000 mg/kg of HMF (15 days), magnification 200×; (G) 500 mg/kg of HMF (20 days), magnification 400×; (H) control group (5 days), magnification 400×. The dosage of HMF was incorporated to 1 kg of Apifonda candy.


Table 1.
Results of the semi-qualitative analyses of midgut cell death using the In Situ Cell Death Detection Kit (ISCDDK) immunohistochemical method. The results represent the percentage of positive cells in midgut tissue treated with ISDDK: (I) individual positive cells; (II) range between 0% and 20% positive cells; (III) range between 21% and 60% positive cells; (IV) range between 61% and 90% positive cells; (x) no samples available. Treatment groups: 1. Untreated control; 2. 100 mg/kg of HMF in Apifonda; 3. 500 mg/kg of HMF in Apifonda; 4. 1000 mg/kg of HMF in Apifonda; 5. 1500 mg/kg of HMF in Apifonda.
| Age of Bees (Days) | Treatment Groups | ||||
|---|---|---|---|---|---|
| 1 (control) | 2 (100 mg HMF) | 3 (500 mg HMF) | 4 (1000 mg HMF) | 5 (1500 mg HMF) | |
| 5 | I | I | I | IV | IV |
| 10 | II | I | IV | III | I |
| 15 | II | III | IV | IV | IV |
| 20 | IV | I | IV | II | III |
| 25 | I | I | IV | III | I |
| 30 | x | x | III | I | I |
© 2019 by the authors. Licensee MDPI, Basel, Switzerland. This article is an open access article distributed under the terms and conditions of the Creative Commons Attribution (CC BY) license (http://creativecommons.org/licenses/by/4.0/).
Share and Cite
MDPI and ACS Style
Gregorc, A.; Jurišić, S.; Sampson, B. Hydroxymethylfurfural Affects Caged Honey Bees (Apis mellifera carnica). Diversity 2020, 12, 18. https://0-doi-org.brum.beds.ac.uk/10.3390/d12010018
AMA Style
Gregorc A, Jurišić S, Sampson B. Hydroxymethylfurfural Affects Caged Honey Bees (Apis mellifera carnica). Diversity. 2020; 12(1):18. https://0-doi-org.brum.beds.ac.uk/10.3390/d12010018
Chicago/Turabian StyleGregorc, Aleš, Snežana Jurišić, and Blair Sampson. 2020. "Hydroxymethylfurfural Affects Caged Honey Bees (Apis mellifera carnica)" Diversity 12, no. 1: 18. https://0-doi-org.brum.beds.ac.uk/10.3390/d12010018
Note that from the first issue of 2016, this journal uses article numbers instead of page numbers. See further details here.