Epilithic Diatom Community Shows a Higher Vulnerability of the River Sava to Pollution during the Winter


Department of Biology, Biotechnical Faculty, University of Ljubljana, Jamnikarjeva 101, SI-1000 Ljubljana, Slovenia
*
Author to whom correspondence should be addressed.
Diversity 2020, 12(12), 465; https://0-doi-org.brum.beds.ac.uk/10.3390/d12120465
Submission received: 12 November 2020
/
Revised: 27 November 2020
/
Accepted: 4 December 2020
/
Published: 5 December 2020
(This article belongs to the Special Issue Taxonomy, Ecology and Biogeography of Diatoms)
Abstract
:The aim of the research was to investigate the influence of environmental factors on the structure of epilithic diatom communities in the Sava River from the source to the state border 220 km downstream. The river had numerous human influences along its course, such as municipal and industrial wastewater, agriculture, hydroelectric power plants, etc. The main objective of the research was to find out the influence of human pressure on the structure of the epilithic diatom community under winter and summer conditions. Winter and summer samples were taken at nine sites. At each sampling site, a set of abiotic factors was measured and another set of environmental parameters was evaluated. The analyses showed that nitrogen and phosphorus concentrations increased downstream. We identified 118 different species of diatoms. The most common taxa were Achnanthidium minutissimum and A. pyrenaicum. Planktonic species Cyclotella meneghiniana was only found in the samples of the lower part of the Sava, which is unusual for the epilithic community. The composition of the epilithic diatom community was significantly influenced by conductivity and water temperature, pH and distance from the source. The similarity between diatom communities closer to the source of the river was higher than between communities from the lower part of the Sava River. The values of the trophic and saprobic indices increased downstream and showed that the pollution of the river with nutrients and organic matter increases with the distance from the source. Both indices were significantly higher in winter and showed a more impaired river ecosystem during the winter.
1. Introduction
Periphyton is the basis for the self-purification of the aquatic ecosystem, which enables the absorption of various substances from the water and thus represents a fundamental component in the food chain [1,2]. Periphyton algae are the main primary producers in most watercourses [3] and provide high-quality food for various groups of vertebrates and invertebrates [4]. Periphytic communities are very sensitive to the deterioration as well as to amelioration of water quality, which affects algae growth [5]. Deterioration of water quality has negative effects on river basins, food webs the diversity of communities, and causes the uncontrolled growth of species, which can become a threat to public health [6]. Periphytic diatoms are important mediators of anthropogenic influences, since the diatoms are the most abundant group in the periphyton, especially in spring and autumn [7]. Their sorption capacity and large surface area represent a great potential for the removal of dissolved pollutants from the water. Moreover, they are builders of the biofilm, as many species are firmly attached to the substrate and have an anchoring function. The epilithic diatom communities are more stable than the epiphytic and epipelic ones due to the stability of their substrate [8,9]. Diatoms are adapted to poor light conditions and turbulent water flow due to the synthesis of silica cell-wall [10]. Due to the combination of relatively narrow ecological tolerances of many species and morphological variability, diatom analysis is a useful tool for assessing ecological status [11], and they are also indicators used to assess natural and human-related characteristics of aquatic ecosystems [12]. Their diversity and different responses to environmental factors have contributed to the fact that many river quality indices are based on diatom data only [13,14].
Watercourses are strongly influenced by their catchment areas and react to physical and ecological processes in the landscape [15]. Vitousek and Reniers [16] and Vallet et al. [17] claim that watercourses allow us to assess the biogeochemical status of the catchment area because they can integrate the response of the catchment. Parr and Mason [18] found that 70% of total nitrogen and 86% of phosphorus in freshwaters are anthropogenic. The uptake of phosphorus and nitrogen accelerates the periphyton growth, changing the structure of the community and the function of the river ecosystem [4]. Nutrient concentrations have a significant influence on the growth of periphyton and the extinction of certain taxa [19]. Dissolved organic matter can serve as food for many diatoms and indirectly as a source of nutrients [20]. At moderately elevated levels of dissolved organic matter, photosynthesis rates are increased due to elevated nutrient concentrations [21]. The source of organic matter depends on the land use in the catchment: tree leaves, flushing from the catchment area and transport of organic matter downstream [22]. Increased amounts of suspended organic matter reduce the penetration of solar radiation into the depths [23] and thus affect primary producers [24].
Phytobentos and periphytic diatoms, respectively, are included in the assessment of the ecological status of water bodies in Water Framework Directive [25], where they are used to assess nutrient and organic pollution [14]. The assessment of water quality can be complicated by changes over time, which are of critical importance, but the factors that influence the temporal occurrence of species are poorly understood. However, the variability of the epilithic diatom community in a torrential river is explained by water temperature, conductivity and altitude [7], while light and temperature indicate seasonality [3]. In addition to environmental factors, spatial factors can also contribute significantly to algae distribution, as well as the aforementioned temporal factors, which we know much less about [6]. Alternative methods for water quality assessment use the functional or morphological characteristics of diatoms instead of taxonomic information [6,14]. Taxa are classified into ecological groups based on different adaptation strategies [6,26]. The classification of benthic diatoms according to sensitivity or tolerance of nutrient concentration is also used for evaluation of water quality.
The Sava River is exposed to many human influences [27], such as municipal and industrial sewage, flushing of farmland, large dams. These influences are reflected to a certain extent in the composition and diversity of the periphyton diatom community. So far, no studies dealing with the epilithic diatom community have been performed on the Sava river, the exceptions are its tributaries in Slovenia (e.g., [7]) or in other countries within the catchment area (e.g., [28]). The aims of this study were to determine how the structure of the epilithic diatom community changes seasonally and longitudinally and which environmental factors have the greatest influence on its diversity and species composition.
We hypothesized that: (a) the differences in species composition of the epilithic diatom community between the sites will be smaller in winter than in summer; (b) the influence of inflowing nutrients and dissolved organic matter on the epilithic diatom community will increase downstream due to the inflow of insufficiently treated wastewater and nutrients from agricultural areas; (c) human pressure in the form of nutrient and organic matter load of Sava River will be higher in winter than in summer, due to the lower activity of primary producers.
2. Materials and Methods
2.1. Study Area
The Sava River is the longest Slovenian river and measures 220 km from the source of Sava Dolinka in Zelenci (Slovenia) to the border with Croatia. The total length of the river from its source to its mouth into the Danube is 946 km and it is its largest right tributary. The Sava flows through three ecoregions: Alpine, Dinaric and Pannonian. It has its source at an altitude of 834 m and leaves Slovenia at the state border at an altitude of 134 m, so the difference in altitude of 700 m is a relatively steep natural gradient. The Sava flows through Croatia and Serbia, where it joins the Danube River. There are various sources of pollution; in addition to the washing away of agricultural land, point sources also have a significant impact. Many tributaries flow into the river, some of which are contaminated with nutrients, organic matter or other pollutants.
The construction of dams and reservoirs for hydropower plants creates completely new living conditions for biota [29]. Below the dams, significant morphological changes occur in the river bed, water regime and sediments [30]. Dams stop the transport of sediments and their accumulation downstream, while erosion processes continue and lead to a deepening of the river bed.
2.2. Sampling Sites
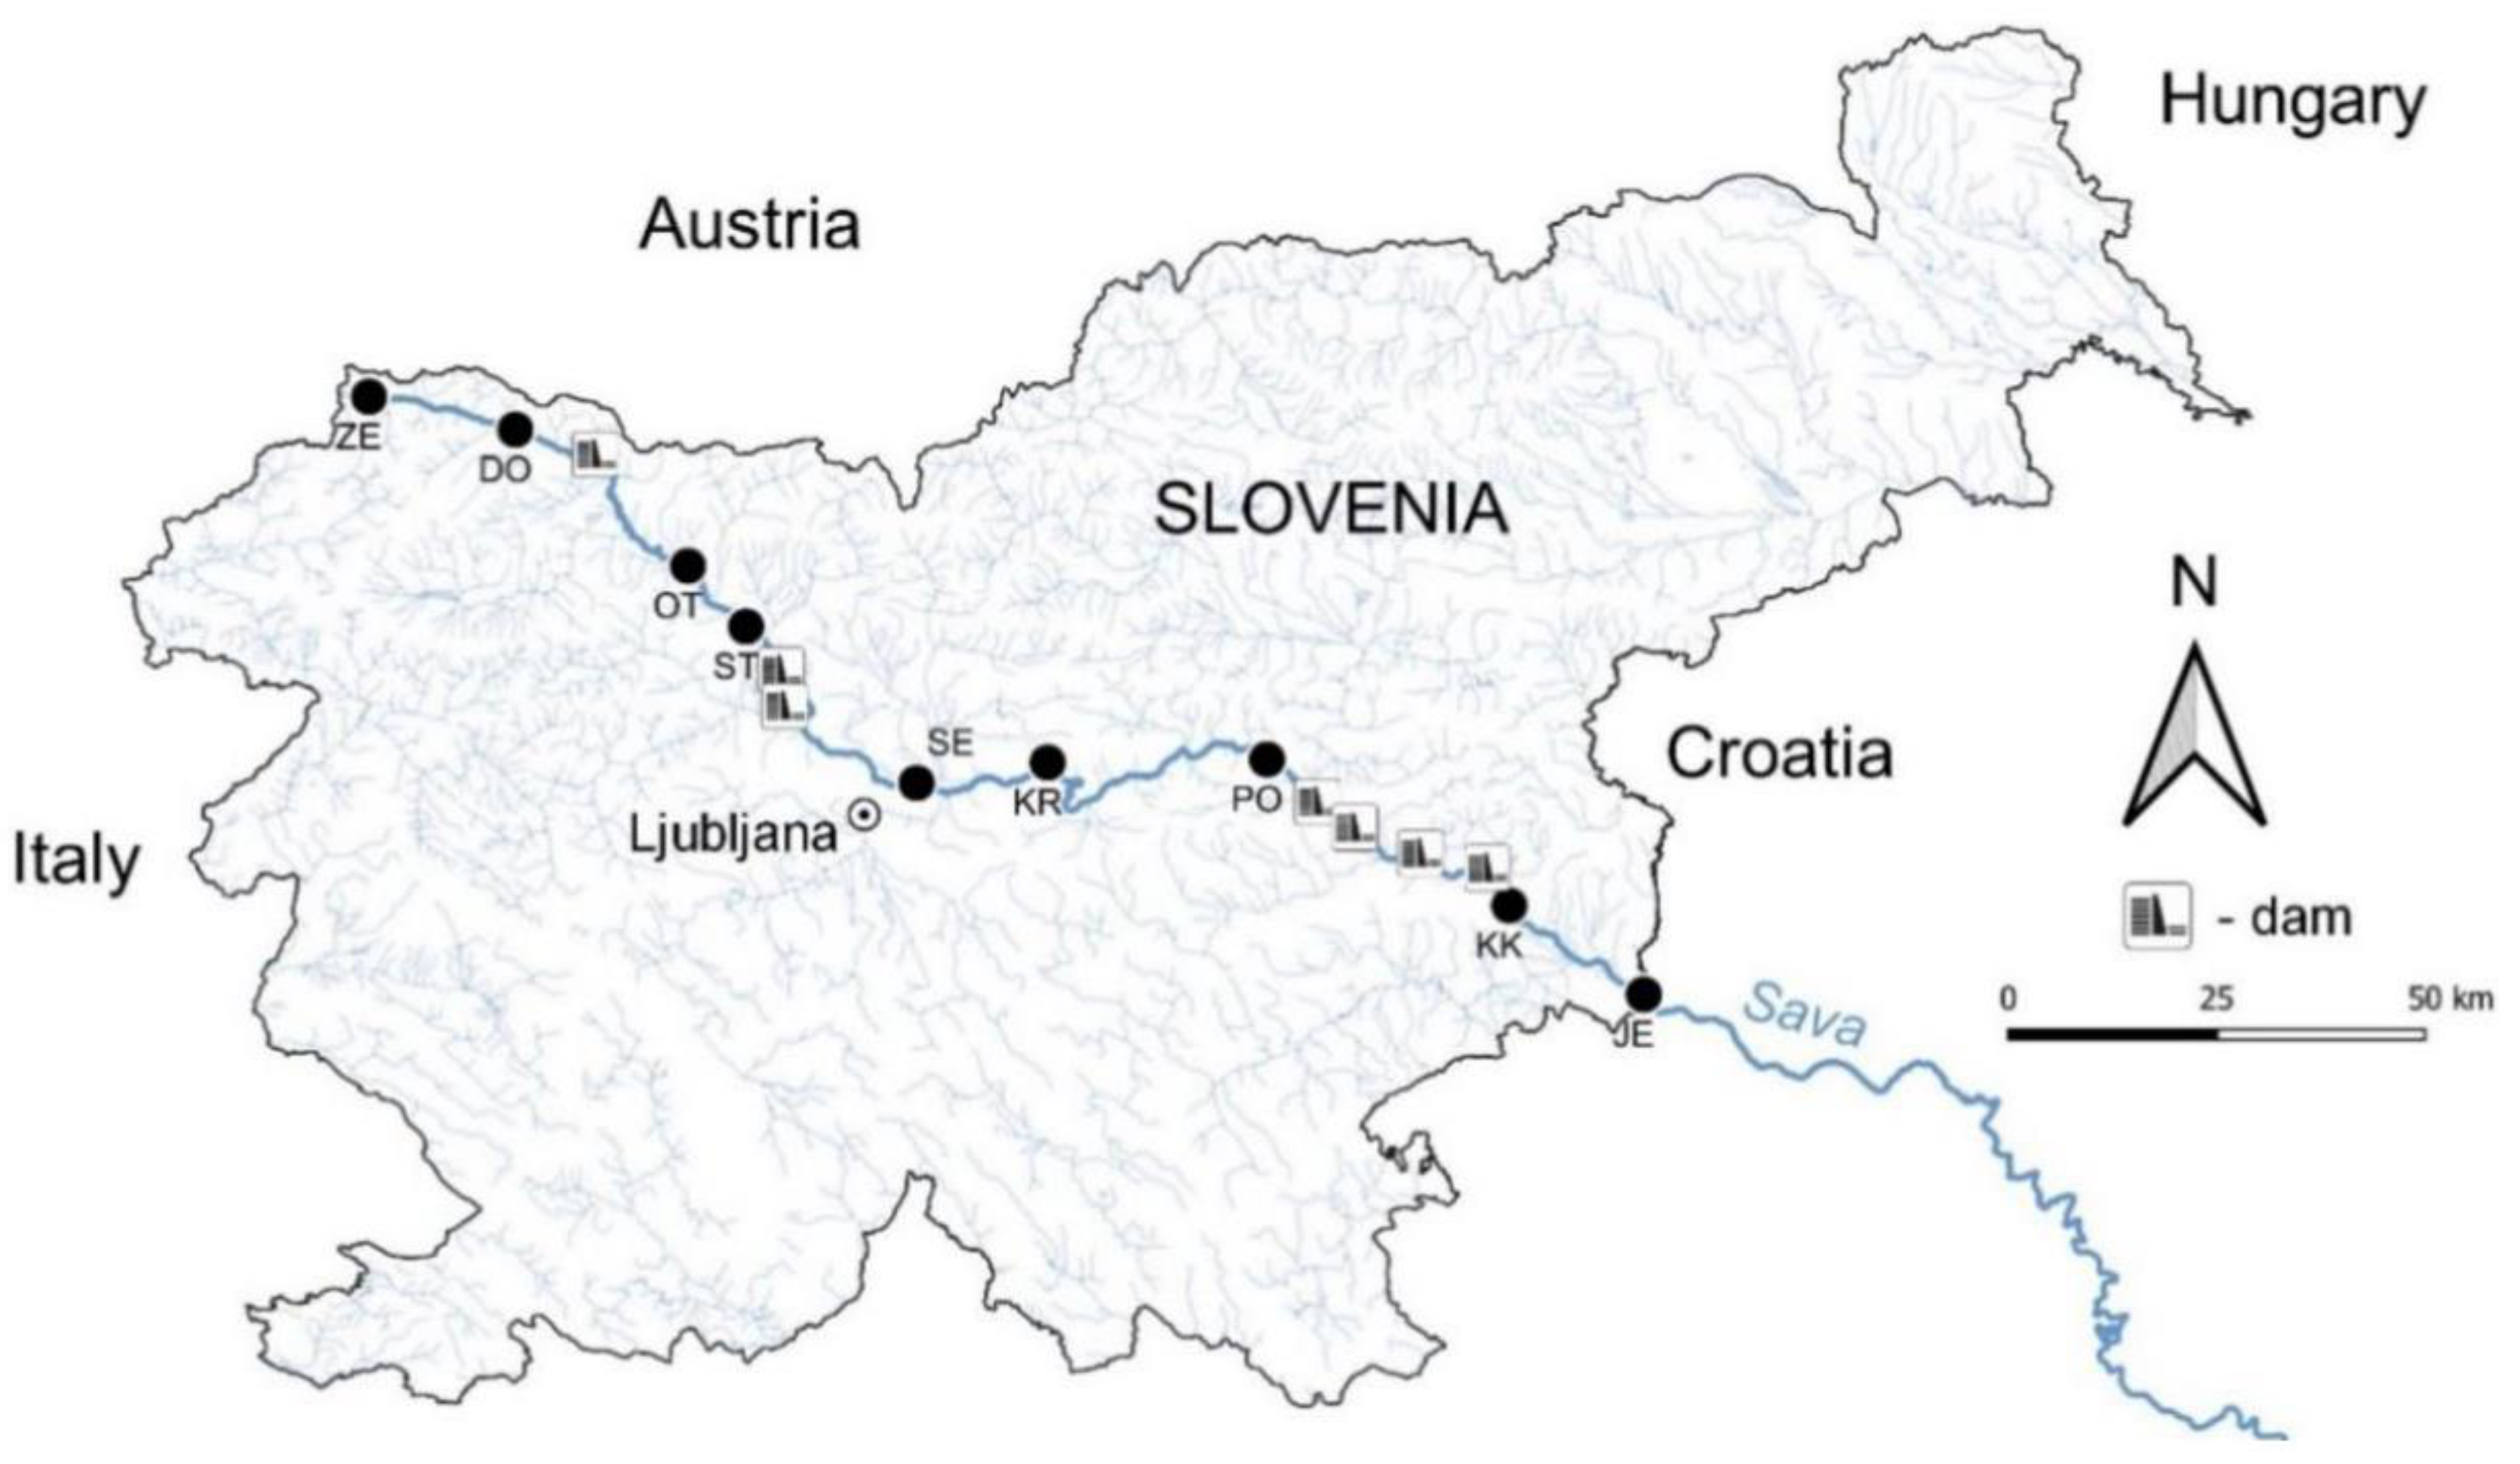
We selected 9 sampling sites (Figure 1) which were sampled twice—in the beginning of March and in the middle of July 2015. We sampled periphyton before the beginning of the growing season and during the summer when the typical summer periphytic communities are already established. At each sampling site, we checked the water level, estimated the proportions of different substrate types, the land use of the catchment area, the shading of the river bed and other factors that can significantly influence the conditions in the river.
The sampling sites Zelenci (ZE), Dovje (DO), Otoče (OT), Struževo (ST) and Šentjakob (SE) are located within the alpine ecoregion or upstream, in the middle part we have the sampling sites Kresnice (KR) and Podkraj (PO), which are part of Dinaric Sava, while the sites Krško (KK) and Jesenice na Dolenjskem (JE) are located in the Pannonian ecoregion. The Sava riverbed is cut into a lithologically heterogeneous base consisting of four petrographic types (according to [31]): triad limestones and dolomites (Zelenci, Dovje, Podkraj); carbonaceous marls and sandstones (Kresnice); conglomerate or older gravel (Otoče, Struževo); pleistocene gravel and other deposits (Šentjakob, Krško, Jesenice) [31].
2.3. Measurements of Abiotic Parameters
The water current velocities were measured with a current velocity sensor (Hydro-Bios, Kiel, Germany) at 60% depth. Water temperature, dissolved oxygen concentration and saturation, conductivity, total dissolved solids (TDS) and pH were measured with a multimeter (Eutech Instruments PCD 650, Singapore). For other analyzes the water was stored and analyzed in the laboratory. HACH Lange cuvette tests determined the concentrations of certain nutrients in the water. The contents of nitrate (LCK 339), ammonium (LCK 304), orthophosphate (LCK 349) and total nitrogen (LCK 138) were analyzed. The final values of the individual parameters in the sample were determined with a spectrophotometer (HACH Lange DR 3900, Dusseldorf, Germany). The total suspended solids content (TSS) and the dry mass were determined by filtration and drying of the samples at 105 °C.
2.4. Periphyton Sampling and Laboratory Analyses
Periphyton samples were collected quantitatively with a stone scraping method using a toothbrush and scalpel. At each sampling site, a section up to 10 m long was investigated, in which 5–7 stones (6–20 cm in size) were collected [32]. We chose stones whose upper surface was fairly parallel to the surface or which were equally exposed to the flow of water and sunlight. Using a 2 × 3 cm (6 cm2) rectangle, we scraped the periphyton with brush and scalpel into a plastic container and fixed the samples with 37% formaldehyde to achieve a ratio of 1:9.
Each sample was homogenized with a magnetic stirrer and 5 mL of the suspension was poured into a glass centrifuge tube. The samples were centrifuged at 4000 rpm for 10 min. The supernatant was removed and 2 mL of 65% HNO3 was added. The sample was heated over the flame until the resulting vapor turned white. The sample was centrifuged again. The supernatant was poured and 2 mL of distilled water was added. Four permanent slides of each sample were prepared using Naphrax® mountant (Brunel Microscopes Ltd, Chippenham, UK).
The slides were examined with the microscope (Olympus CX41 microscope, Tokyo, Japan) at a magnification of 1000×. From each sample, 400 frustules were counted and determined. For the determination of diatom taxa and their nomenclature we followed Hofmann et al. [12] and Krammer and Lange-Bertalot [33,34,35,36].
2.5. Data Analysis
The trophic index (TI) was calculated according to Rott et al. [37]. The saprobic index (SI) was calculated on the basis of the saprobic value, the frequency and the indicator value of the taxon, on the basis of which the river at each sampling section is classified in the appropriate quality class [38].
The influence of specific factors on the composition of the diatom community was tested by redundancy analysis (RDA). The linear gradients in the matrix of taxa were revealed beforehand with detrended correspondence analysis (DCA), where the eigenvalue for the first axis was 0.38, while the gradient length was 2.49 standard deviations. We used forward selection, where 499 permutations were performed in every round to rank the relative importance of explanatory variables and to avoid co-linearity. Statistically significant factors were used for creation of the RDA diagram. These analyses were performed with the program package CANOCO 4.5 [39].
Correlations between SI, TI, ecological types of diatoms and explanatory variables were tested with a Spearman’s rho correlation coefficient. Correlations were calculated with PAST [40]. Differences in characteristics between the seasons were checked with a t-test (MS Excell).
3. Results
3.1. Influence of Environmental Parametres on the Composition of the Diatom Community
The detrended correspondence analysis (DCA) shows that the differences in species composition of the diatom community are greater in winter than in summer (Figure 2), when the stability and similarity of the assemblages along the course is greater. The samples from the KK sampling site are conspicuous in both seasons and were most different from the others. The associations in the samples ZE.w and ZE.s are quite similar, as are the expected positions on the left edge of the group of samples (Figure 2).
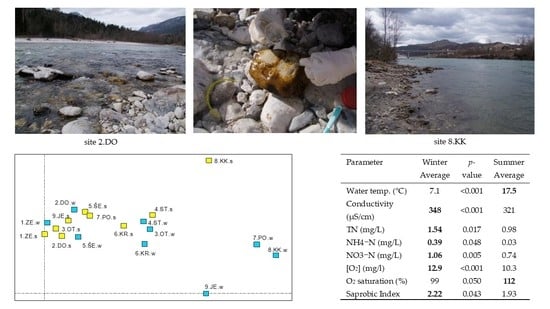
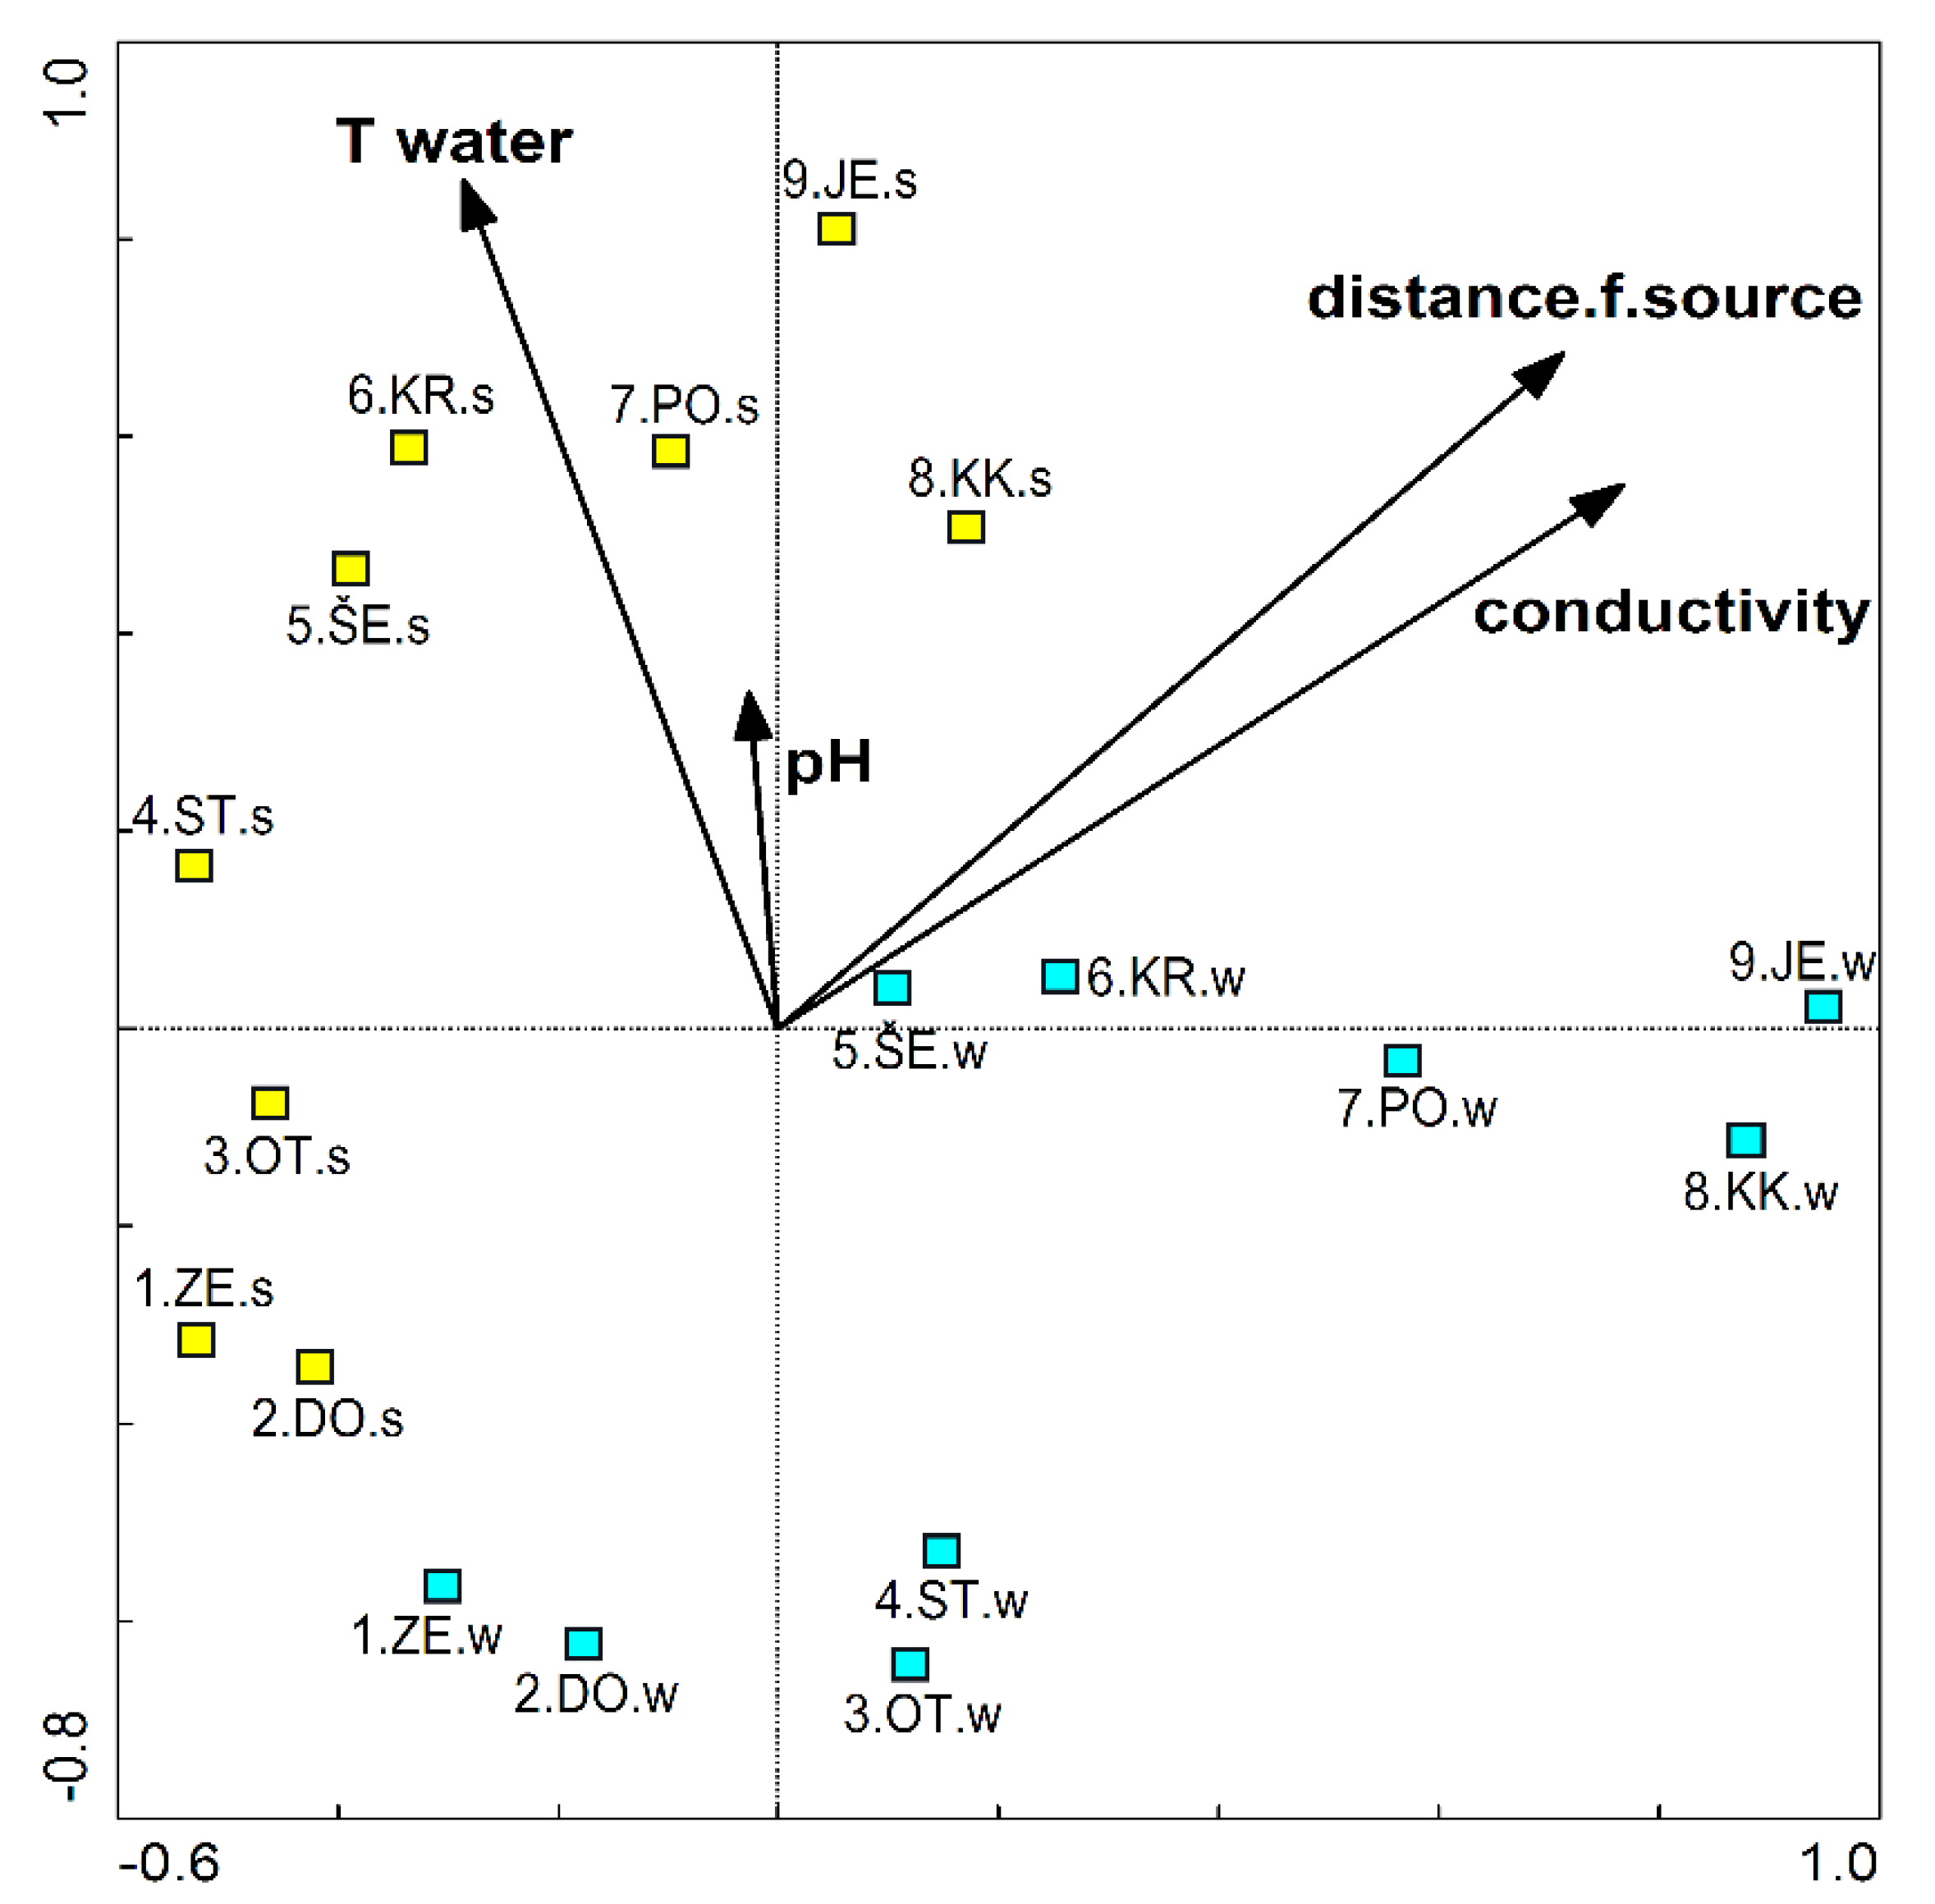
Using RDA analysis, we calculated that factors that statistically significantly explain the taxonomic composition of the epilithic diatom community are conductivity (19% of the total explained variance), water temperature (12%), distance from source (11%) and pH (8%). The assemblages at the sampling sites ZE and DO are relatively similar compared to the other samples (Figure 3). With the distance from the source, the differences between the winter and summer samples from the same sites increase, as do the differences between the samples. The distribution pattern becomes less clear downstream and varies greatly depending on the season, which is influenced by the greater temperature differences in the lower part compared to the upstream part (see Table A1).
3.2. Water Quality along the Course and between the Seasons
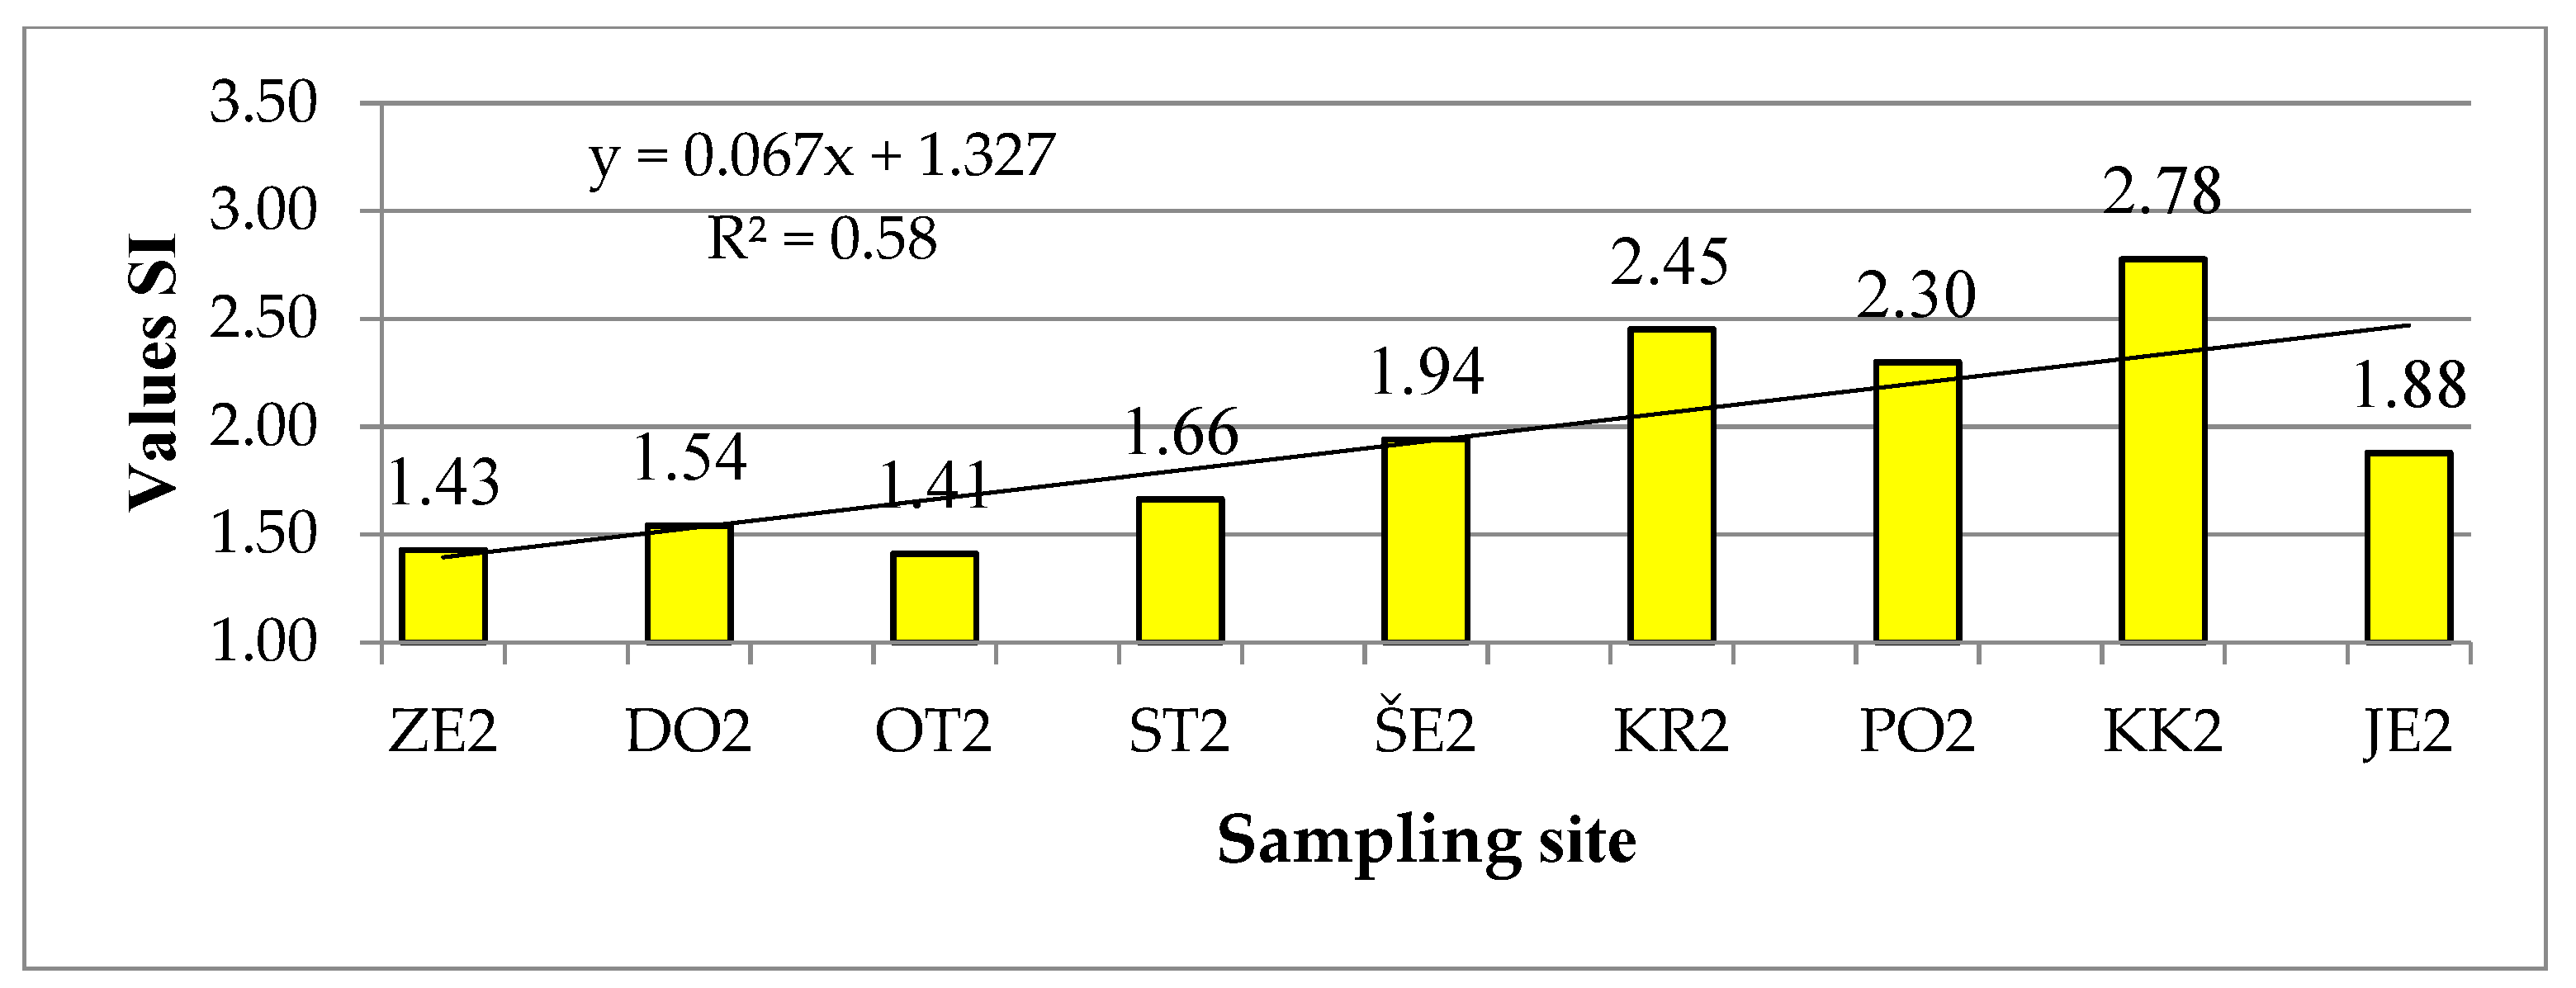
SI values at different locations vary between winter and summer samples (Figure 4 and Figure 5). The smallest differences are found in the sampling site ZE and KR, but especially at OT, PO and JE. The highest value of SI was 3.19 in winter and 2.78 in summer, but in both cases in the site KK. The lowest value of SI (1.35) was calculated for the ZE.w sample.
In general, the values of SI increase downstream and indicate a lower level of organic matter pollution in the upper part of Sava River, while they increase in the middle part and reach the highest values in the KK sampling site, where the value of SI represents a very high level of organic matter pollution. According to the values of SI, the ZE and OT sampling sites can be classified in the 1st quality class or in the oligosaprobic level. The sampling sites DO and ST are oligosaprobic in winter, while in summer they are classified in the β-mesosaprobic level, i.e., 1st–2nd quality class. The samples OT.w, KR.w, KR.s and PO.s indicate a moderate pollution of the watercourse and belong to the β-mesosaprobic level, JE.w to α-mesosaprobic, while in summer the condition improved by one quality class. The PO.w and KK.s samples are also in the α-mesosaprobic level, while the water from the KK.w sample is heavily polluted (α-meso to the polysaprobic level).
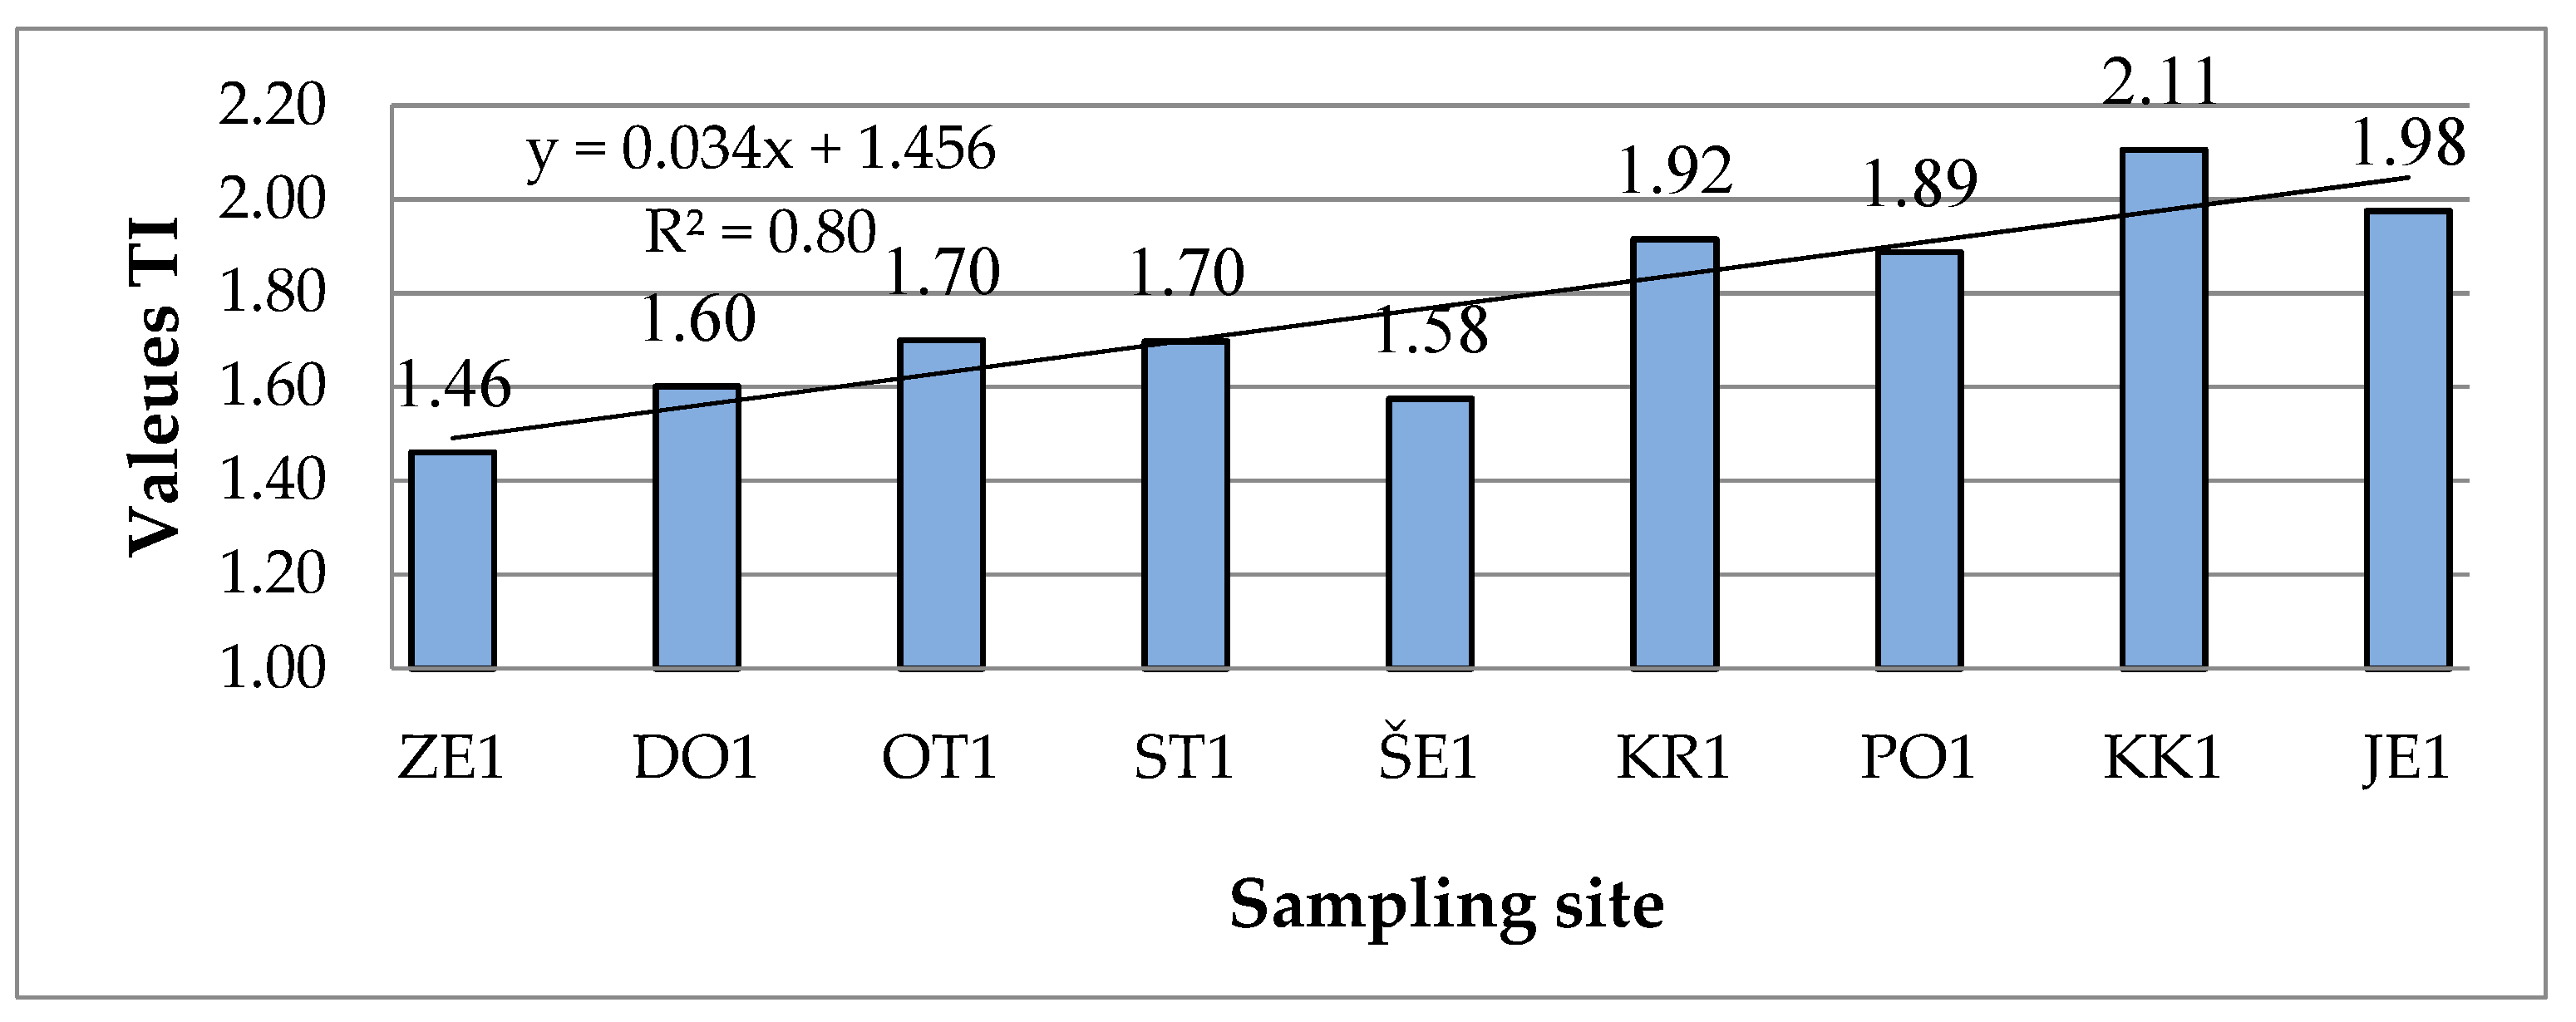
TI values in winter samples range from 1.46 to 2.11 (Figure 6), which characterizes oligo-mesotrophic to meso-eutrophic ecosystem. In the summer samples the differences were smaller (1.5–1.94) and all values belong to the same trophic class. The highest trophic index was calculated in the sample KK.w (meso-eutrophic), and the lowest in the sample ZE.w (oligo-mesotrophic).
In most cases, the values of TI are higher in winter than in the summer samples (Figure 6 and Figure 7). Both the winter and summer values increase downstream, as indicated by the high determinant coefficient (R2 = 0.80) for the winter samples, which means that nutrient inputs to the Sava increase downstream despite increasing discharge. The trend line based on the diagram of the summer samples is flatter (Figure 7) and R2 is only 0.20, indicating that the nutrient load downstream is more or less the same.
In the alpine part, the river is oligo-mesotrophic and in the lower part (from KR downstream), while its status changes to mesotrophic with increasing nutrient input (the effects of the outflows of wastewater treatment-plants Ljubljana and Domžale-Kamnik). According to the results of winter samples, the river is meso-eutrophic in the lower part.
The values of SI and TI are positively correlated with distance from the source, channel width and in-stream parameters such as conductivity, total dissolved solids (TDS) and all measured forms of nitrogen (TN, NH4–N, NO3–N). The values of SI are also positively correlated with the periphyton dry mass and phosphate concentration, but negatively with current velocity (Table 1).
Beside the water temperature, a set of seven measured parameters differed significantly between winter and summer samplings, as well as three indices determined on the base of epilithic diatom communities (Table 2).
3.3. The Structure of the Diatom Community
Table 3 lists taxa with a frequency of at least 10% in the diatom assemblage. The two most dominant taxa in the samples were Achnanthidium minutissimum and A. pyrenaicum, which co-dominated 11 out of 18 samples: ZE.w, ZE.s, DO.w, DO.s, OT.s, ŠE.w, ŠE.s, KR.w, KR.s, PO.s and JE.s. (Table 3). These taxa (A. minutissimum and A. pyrenaicum) account for up to 84% in the epilithic diatom community.
In the samples from ST.s, PO.w, KK.w and KK.s none of these taxa was dominant. In the KK.s summer samples Cyclotella meneghiniana, the planktonic species, is the most dominant, and Navicula reichardtiana is also common. In the winter sample KK.w the dominant species are Surirella minuta and Navicula lanceolata. N. lanceolata also appears in PO.w among the dominant species, with Encyonema minutum among the more common ones. It is still present in the sample OT.w. Both in the sample ST.w and in the sample ST.s Gomphonema tergestinum is dominant.
ST.w contained five co-dominant species with uniform representation: A. minutissimum, A. pyrenaicum, Encyonema minutum, Gomphonema tergestinum and Nitzschia gracilis. Four species dominated in KR.s (A. minutissimum, A. pyrenaicum, Nitzschia fonticola and Mayamaea atomus) and three dominate in OT.w, ST.s and PO.s (see Table 3). Elsewhere, only two species reach values above 10% and all others are present in smaller proportions.
Ecological Groups of Diatoms
Low- and high-profile diatoms are present in all samples (Figure 8). Motile species occur in all samples except OT.s. Planktonic species occur in ZE.s, DO.w, ŠE.s, KR.s, PO.s, KK.s and JE.s. They occur mainly in summer samples, even in KK.s, the dominant ecotype. Most other samples are dominated by low-profile species, except for the sampling site ST where both samples are dominated by high-profile species and PO.w and KK.w where the motile diatoms predominate. The density of mobile and planktonic species increases downstream, but the proportion of high-profile species decreases.
The proportion of low-profile species is negatively correlated with channel width and TDS (Table 1). High-profile species are negatively correlated with water temperature, while proportion and motile species correlate positively with source distance, channel width, conductivity, TDS, water temperature and nutrients like phosphate, NH4–N, NO3–N (Table 1).
4. Discussion
4.1. Influence of Environmental Parametres on the Composition of Epilithic Diatom Community
Conductivity, water temperature, distance from the source and pH had a statistically significant influence on the species composition of the epilithic diatom communities (Figure 3). These results are largely consistent with the results reported by Toman et al. [7]. Cantonati [41] also finds that the species composition of the diatom community is most strongly influenced by pH and conductivity. Soininen [11] reports that conductivity, trophic status, as well as spatial factors have a significant influence on the composition of diatom communities in rivers. Common to all mentioned studies are conductivity and spatial dimension as factors that significantly influence the epilithic diatom community.
In addition to ecological and spatial factors, the composition of diatom communities is also influenced by temporal variables about which we do not know much [6]. In our study, water temperature is a matter of time, since we sampled in winter and summer, and of space, since in summer the water temperature increases significantly with distance from the source, which is a general pattern [42]. This gives the water temperature a complex character. Temperature differences cause differences in the growth rate, biomass and taxonomic composition of algae [43] and differences in ecosystem processes such as organic matter degradation and nutrient uptake [2].
Distance from the source is a spatial factor, but as concentrations of organic matter and nutrients increase downstream, this factor may also include factors arising from human pressure, which is reflected in conductivity.
Although the differences in water temperature were almost five times greater in summer than in winter, we found that there are greater differences between diatom assemblages in winter than in summer (Figure 3). They were also more heterogeneous (with higher Shannon diversity index) in winter than in summer (Table 2). This indicates the strong influence of human activities, which most probably caused these differences.
4.2. Water Quality along the Course and between the Seasons
The dry mass of the periphyton and SI values of the samples increased downstream, indicating an increase in the concentration of dissolved organic matter (DOM). The values of SI were higher in the lower part of Sava River in both seasons studied. Cole and Caraco [44] report that although headwaters through mid-order rivers export large amounts of organic matter to the lower reaches, large rivers may be able to mineralize a large amount of carbon entering from terrestrial ecosystems. Despite this fact, the values of SI were increasing along the Sava River, reflecting the increasing pressure in the form of inputs of degradable organic matter.
A statistically significant negative correlation between SI and the current velocity indicated that the saprobity increased with decreasing current velocity, since lower velocity means also lower metabolic rate in the periphyton and was another reason for the lower self-purification capacity of the river, as the values from SI showed. Therefore, the possible construction of additional dams and reservoirs would negatively influence the self-purification ability of the Sava river.
The river Sava changed from oligosaprobic (1st quality class) in the headwater section to β-mesosaprobic (2nd class) in the middle section and deteriorated in the lower part of the river to α-mesosaprobic or even polysaprobic (3rd to 4th quality class) waterbody during winter according to the values in Sladeček [45]. There was a substantial increase of SI between sites PO and KK (Figure 4 and Figure 5), which reached the maximal values in the latter, although that the distance between them was the biggest (Figure 1). The most possible reason is the regulated part of the river (with four large dams and reservoirs), which has lower ability for self-purification [46]. By contrast, the values of SI and TI dropped in all cases between the sites KK and JE, but there are no impoundments.
TI and SI correlated significantly with nitrogen, conductivity and distance from the source. The Sava River changes along its course from the oligo-mesotrophic environment to the meso-eutrophic environment. In the lower part of the river, the values of TI were higher, as more nutrients from the catchment area entered the watercourse.
The values at the KR site were very high because it is located a few kilometers downstream of two large wastewater treatment-plants with the total capacity of 560,000 population equivalents. Eliasz-Kowalska and Wojtal [47] also report that increased nutrient concentrations are the result of inflowing treated wastewater containing more phosphate and nitrate. Nitrate and ammonium concentrations increased downstream in both seasons, but the increase in the lower part was more pronounced in summer, probably due to their leaching from agricultural land. However, Exner-Kittridge et al. [48] report that the timing of fertilizer application was not found to be significant in relation to the seasonality of nitrogen concentrations and surface water pollution. Bailey and Ahmadi [49] report that upstream concentrations of NO3 have less influence on these concentrations in the lower part during the summer and more in the winter, due to higher water temperatures in the summer.
Differences between Winter and Summer
Seasonal variation in water temperature has a strong influence on respiration rates and thus on the utilization of organic matter [2,50], standing stock of which is inversely related to temperature. In the present study, the values of SI were significantly higher in winter than in summer (p = 0.043) (Table 2). The rates of microbial activity are strongly temperature dependent and the breakdown of organic matter is slower at lower temperature [2]. Higher water temperature and nutrient concentrations lead to favorable conditions for microbial activity [51], which leads to the higher decomposition rate of DOM in the summer and the higher uptake of the released nutrients by bacteria and primary producers. Consequently, the reduced self-purification capacity of the Sava River made it more vulnerable to pollution in winter. Chenier et al. [51] report that the microbial community within the biofilm varies greatly over the year and consequently the response to stress varies with the season. The important role of bacteria in the breakdown of organic matter and their ability to utilize labile DOM from the water is essential. The uptake of human-introduced organic matter by decomposers is often associated with insufficient [O2] and mortality of aquatic organisms [49].
TI values in winter samples (Figure 6) were higher in most sites than in summer (Figure 7). The concentrations of TN, NH4––N and NO3––N, were statistically significantly higher in winter, indicating a higher nutrient load of the river in winter as a consequence of a lower nutrient uptake by vegetation on land and in the riparian zone [16]. As a result, more nutrients are washed into the river. During the summer, most of the discharge is provided by deep aquifers containing low nitrate concentrations, while in winter about half of the discharge contributes to shallow aquifers, containing about 20-times higher nitrogen concentrations [48]. However, seasonal temperatures and vegetation growth rates are not the primary factors for differences in nitrogen concentrations.
During winter sampling, there were smaller temperature changes downstream than in summer. During the winter, significantly more oxygen was dissolved in the water than in summer (Table 2), due to its better solubility at low temperatures [2], but saturation showed the opposite, which was the consequence of higher algae production. Water temperature influences both respiration and the growth and primary production of algae and therefore has a stronger influence on [O2] in summer [49] than in winter. Biggs et al. [52] claim that the production of periphytic algae increases with temperature of the water and the maximum ratio between photosynthesis and respiration could be 3-times higher in summer than in winter.
Cunha de Menezes et al. [53] find a different response during the warmer period, when high primary productivity enables the reaeration of the stream. The majority of the sites have high values of dissolved O2 due to high productivity of the algae and not by the assimilation capacity of organic matter.
The lower conductivity in summer was influenced by increased primary production and nutrient uptake, while in winter the average conductivity values were higher (+27 μS/cm).
4.3. The Structure of the Diatom Community
4.3.1. The Dominance of Taxa
The two most dominant taxa in the samples were Achnanthidium minutissimum and A. pyrenaicum (Table 3), which accounted for up to 84% in the epilithic diatom community. Eliasz-Kowalska and Wojtal [47] consider the dominance of Achnanthidium minutissimum and Encyonopsis microcephala, as indicators of anthropopressure, especially with regard to high nutrient contents.
In the KR.s sample, in addition to A. minutissimum and A. pyrenaicum, the co-dominant species Mayamea atomus, which is one of the most saprobity-tolerant species [54,55] was also found. The KK.s sample was dominated by the planktonic species Cyclotella meneghiniana (Table 3), which is very resistant to organic pollution [56]. Its high proportion (42%) was influenced by high nutrient contents and the reservoirs from which this species came from drift.
In winter samples (OT.w, ST.w, PO.w), Encyonema minutum, which is often found in anthropogenically little disturbed sites [55], was also dominant. The ST samples in both seasons were dominated by Gomphonema tergestinum, which is characteristic for fast flowing waters [55]. The average current velocity was the highest in this site.
At low temperatures and solar radiation, the species of the genus Navicula become dominant [43]. In our case, the species Navicula lanceolata, which is characteristic of polytrophic and α-mesosaprobic habitats [55], was actually the dominant species in winter samples PO and KK occurring with more than 10% in the community (Table 3).
4.3.2. Ecological Groups
The water current velocity influences the thickness of the periphyton and the taxonomic composition of the diatom community [52]. When velocities exceed 10–15 cm/s, the hydrodynamic shear stress begins to affect the structure of the periphyton and the taxonomic composition [59,60]. In the upstream samples, smaller and low-profile species dominated, while in the downstream samples, motile and high-profile species occurred with higher proportions (Figure 8), which is consistent with the longitudinal decrease of current velocities [61]. In our study, no significant correlation was calculated between the ecological types and velocity (Table 1). The lower current velocities mean lower frequency of disturbance, and a lower disturbance frequency results in more high-profile species [62] and motile species. The proportion of motile taxa positively correlated with distance from the source and channel width, as well as with contents of phosphorus, nitrogen and TDS (Table 1). Motile taxa reached the highest proportion in the site KK (Figure 8), which is downstream the chain of four accumulations (Figure 1). Discontinuous release of water from these accumulations and transport of higher contents of suspended solids could explain the high proportion of motile taxa (see [63,64]). On the other hand, low-profile taxa negatively correlated with channel width and TDS. Motile species are more efficient at absorbing substances from the water because they migrate to the upper layers of the periphyton where they have better access to nutrients and light, and because of their faster metabolism [26]. Planktonic species found in the lower Sava River, mainly in summer samples, have drifted out of the reservoirs.
5. Conclusions
The composition of the diatom community was statistically significantly influenced by conductivity, water temperature, distance from the source and pH.
In both seasons, the human pressure on the Sava River increased downstream. With the distance from the source, we recorded the increase of nitrate, ammonium, total nitrogen, conductivity and the values of TI and SI. Consequently, the amount of periphyton dry mass also increased downstream. The Sava River changed along its course from the oligo-mesotrophic to the meso-eutrophic ecosystem. With regard to saprobity, we evaluated the headwater section as oligosaprobic (1st quality class), which changes to β-mesosaprobic (2nd class) in the middle part of the river and deteriorated to an α-mesosaprobic or even polysaprobic (3rd to 4th class) water body in the lower part of the river in winter.
Higher TI values in sites KR than in PO indicate a higher eutrophic potential in the middle part of the Sava than in the lower Sava River, which could indicate a worse situation in the potential/planned reservoirs in the middle part of the Sava River. Additional reservoirs would negatively influence the self-purification ability of the river.
We can conclude that the self-purification ability of the river Sava is significantly lower in winter, which makes the river more vulnerable to human pressures in colder periods, especially in terms of organic pollution. We also strongly advise against the construction of large dams in the middle part of the Sava to prevent the impairment of water quality and loss of numerous species.
Author Contributions
Conceptualization, I.Z.; methodology, I.Z.; software, I.Z.; validation, I.Z. and T.S.; formal analysis, I.Z.; investigation, T.S.; data curation, T.S. and I.Z.; writing—original draft preparation, T.S.; writing—review and editing, I.Z.; visualization, I.Z.; supervision, I.Z. All authors have read and agreed to the published version of the manuscript.
Funding
This work was partly financed by the Slovenian Research Agency, through the programmes P1-0212 “Biology of Plants”, and the applied project L4-9305, co-financed by the Ministry of Agriculture, Forestry and Food, Slovenia.
Acknowledgments
The authors thank to Gorazd Kosi, for help in determination of diatom taxa and to Matej Holcar for creation of Figure 1. Special thanks go to Mateja Germ for her comments that improved the manuscript.
Conflicts of Interest
The authors declare no conflict of interest.
Appendix A

Table A1.
Physical and chemical characteristics of water at sampling sites. All concentrations are in mg per liter.
Table A1.
Physical and chemical characteristics of water at sampling sites. All concentrations are in mg per liter.
| Sample | Max. Velocity (m/s) | T Water (°C) | pH | Conductivity (µS/cm) | [O2] | Sat. with O2 (%) | TDS | PO4–P | TN | NH4–N | NO3–N |
|---|---|---|---|---|---|---|---|---|---|---|---|
| ZE.w | 0.76 | 4.8 | 7.2 | 262 | 10.4 | 83 | 258 | 0.03 | 1.11 | 0.03 | 0.86 |
| ZE.s | 1.20 | 8.1 | 7.1 | 254 | 8.0 | 79 | 250 | 0.00 | 0.79 | 0.02 | 0.31 |
| DO.w | 1.70 | 7.2 | 7.8 | 278 | 12.0 | 98 | 273 | 0.23 | 0.59 | 0.03 | 0.42 |
| DO.s | 1.74 | 10.2 | 7.5 | 263 | 9.9 | 95 | 256 | 0.00 | 0.35 | 0.02 | 0.44 |
| OT.w | 1.33 | 6.5 | 8.0 | 310 | 14.3 | 111 | 304 | 0.00 | 1.12 | 0.03 | 0.72 |
| OT.s | 1.39 | 16.5 | 8.0 | 280 | 10.9 | 117 | 276 | 0.14 | 0.86 | 0.03 | 0.71 |
| ST.w | 1.38 | 6.9 | 8.0 | 327 | 14.7 | 114 | 321 | 0.76 | 0.92 | 0.02 | 0.72 |
| ST.s | 1.53 | 18.3 | 8.0 | 300 | 10.0 | 110 | 297 | 0.01 | 0.84 | 0.03 | 0.55 |
| ŠE.w | 0.93 | 7.9 | 7.5 | 376 | 13.1 | 100 | 356 | 0.01 | 1.46 | 0.04 | 1.26 |
| ŠE.s | 0.37 | 17.2 | 7.6 | 340 | 10.1 | 104 | 329 | 0.00 | 1.09 | 0.04 | 0.81 |
| KR.w | 0.87 | 7.2 | 7.5 | 392 | 13.0 | 98 | 385 | 0.14 | 3.13 | 0.08 | 1.59 |
| KR.s | 0.83 | 18.5 | 7.8 | 363 | 10.7 | 116 | 357 | 0.03 | 1.44 | 0.06 | 1.15 |
| PO.w | 0.94 | 7.2 | 7.5 | 392 | 13.0 | 96 | 385 | 0.01 | 1.41 | 0.08 | 1.16 |
| PO.s | 0.85 | 20.1 | 7.9 | 370 | 11.0 | 123 | 365 | 0.06 | 1.38 | 0.05 | 1.00 |
| KK.w | 0.15 | 8.1 | 7.6 | 391 | 13.0 | 96 | 385 | 0.53 | 1.76 | 0.05 | 1.41 |
| KK.s | 0.04 | 22.3 | 8.1 | 359 | 11.7 | 133 | 354 | 0.01 | 0.72 | 0.02 | 0.73 |
| JE.w | 0.06 | 8.5 | 7.5 | 406 | 13.0 | 99 | 398 | 0.20 | 2.35 | 0.04 | 1.43 |
| JE.s | 0.59 | 26.3 | 8.1 | 363 | 10.7 | 132 | 357 | 0.23 | 1.38 | 0.04 | 0.99 |
References
- Dodds, W.K.; Biggs, B.J.F. Water Velocity Attenuation by Stream Periphyton and Macrophytes in Relation to Growth Form and Architecture. J. N. Am. Benthol. Soc. 2002, 21, 2–15. [Google Scholar] [CrossRef] [Green Version]
- Allan, J.D.; Castillo, M.M. Stream Ecology; Springer: Dordrecht, The Netherlands, 2007; p. 372. [Google Scholar]
- Izagirre, O.; Elosegi, A. Environmental control of seasonal and inter-annual variations of periphytic biomass in a North Iberian stream. Ann. Limnol. Int. J. Limnol. 2005, 41, 35–46. [Google Scholar] [CrossRef]
- Hill, W.R.; Ryon, M.G.; Smith, J.G.; Adams, S.M.; Boston, H.L.; Stewart, A.J. The Role of Periphyton in Mediating the Effects of Pollution in a Stream Ecosystem. Environ. Manag. 2010, 45, 563–576. [Google Scholar] [CrossRef] [PubMed]
- Sabater, S.; Guasch, H.; Ricart, M.; Romaní, A.; Vidal, G.; Klünder, C.; Schmitt-Jansen, M. Monitoring the effect of chemicals on biological communities. The biofilm as an interface. Anal. Bioanal. Chem. 2007, 387, 1425–1434. [Google Scholar] [CrossRef] [PubMed]
- Passy, S.I. Diatom ecological guilds display distinct and predictable behavior along nutrient and disturbance gradients in running waters. Aquat. Bot. 2007, 86, 171–178. [Google Scholar] [CrossRef]
- Toman, J.M.; Grošelj, A.M.; Zelnik, I. The Influence of Selected Factors on the Distribution of Epilithic Diatoms in a Torrential River the Kamniška Bistrica (Slovenia). Acta Bot. Croat. 2014, 73, 447–463. [Google Scholar] [CrossRef] [Green Version]
- Stevenson, R.J. Epilithic and epipelic diatoms in the Sandusky River, with emphasis on species diversity and water pollution. Hydrobiologia 1984, 114, 161–175. [Google Scholar] [CrossRef]
- Soininen, J.; Eloranta, P. Seasonal persistence and stability of diatom communities in rivers: Are there habitat specific differences? Eur. J. Phycol. 2004, 39, 153–160. [Google Scholar] [CrossRef]
- Gamier, J.; Billen, G.; Coste, M. Seasonal succession of diatoms and Chlorophyceae in the drainage network of the Seine River: Observation and modeling. Limnol. Oceanogr. 1995, 40, 750–765. [Google Scholar] [CrossRef]
- Soininen, J. Environmental and spatial control of freshwater diatoms—A review. Diatom Res. 2007, 22, 473–490. [Google Scholar] [CrossRef]
- Hofmann, G.; Werum, M.; Lange-Bertalot, H. Diatomeen im Süßwasser-Benthos von Mitteleuropa: Bestimmungsflora Kieselalgen für die Ökologische Praxis; Koeltz Scientific Books: Königstein, Germany, 2013; p. 908. [Google Scholar]
- Virtanen, L.K.; Köngäs, P.; Aitto-Oja, S.; Soininen, J. Is temporal occurrence of diatoms related to species traits, local abundance, and regional distribution? J. Phycol. 2011, 47, 1445–1453. [Google Scholar] [CrossRef] [PubMed]
- Law, R.J.; Elliott, J.A.; Thackeray, S.J. Do functional or morphological classifications explain stream phytobenthic community assemblages? Diatom Res. 2014, 29, 309–324. [Google Scholar] [CrossRef]
- Hynes, H.B.N. The stream and its valley. SIL Proc. 1922–2010 1975, 19, 1–15. [Google Scholar] [CrossRef]
- Vitousek, P.M.; Reiners, W.A. Ecosystem Succession and Nutrient Retention: A Hypothesis. Bioscience 1975, 25, 376–381. [Google Scholar] [CrossRef]
- Valett, H.M.; Crenshaw, C.L.; Wagner, P.F. Stream nutrient uptake, forest succession, and biogeochemical theory. Ecology 2002, 83, 2888–2901. [Google Scholar] [CrossRef]
- Parr, L.B.; Mason, C.F. Long-term trends in water quality and their impact on macroinvertebrate assemblages in eutrophic lowland rivers. Water Res. 2003, 37, 2969–2979. [Google Scholar] [CrossRef]
- Bouletreau, S.; Garabetian, F.; Sauvage, S.; Sanchez-Perez, J.-M. Assessing the importance of a self-generated detachment process in river biofilm models. Freshw. Biol. 2006, 51, 901–912. [Google Scholar] [CrossRef] [Green Version]
- Tuchman, N.C. The Role of Heterotrophy in Algae. Algal Ecol. 1996, 19, 299–319. [Google Scholar] [CrossRef]
- Frost, P.C.; Elser, J.J. Effects of light and nutrients on the net accumulation and elemental composition of epilithon in boreal lakes. Freshw. Biol. 2002, 47, 173–183. [Google Scholar] [CrossRef]
- Quinn, J.M.; Williamson, R.B.; Smith, R.K.; Vickers, M.L. Effects of riparian grazing and channelisation on streams in Southland, New Zealand. 2. Benthic invertebrates. N. Z. J. Mar. Freshw. Res. 1992, 26, 259–273. [Google Scholar] [CrossRef] [Green Version]
- Xenopoulos, M.A.; Schindler, D.W. Physical Factors Determining Ultraviolet Radiation Flux into Ecosystems. Ecosyst. Evol. Ultrav. Radiat. 2001, 36–62. [Google Scholar] [CrossRef]
- Kelly, D.J.; Clare, J.J.; Bothwell, M.L. Attenuation of solar ultraviolet radiation by dissolved organic matter alters benthic colonization patterns in streams. J. N. Am. Benthol. Soc. 2001, 20, 96–108. [Google Scholar] [CrossRef]
- Directive 2000/60/EC of the European Parlament and of the Council of 23 October 2000. Available online: https://eur-lex.europa.eu/eli/dir/2000/60/oj (accessed on 8 October 2020).
- Rimet, F.; Bouchez, A. Life-forms, cell-sizes and ecological guilds of diatoms in European rivers. Knowl. Manag. Aquat. Ecosyst. 2012, 1–12. [Google Scholar] [CrossRef]
- Mataruga, Z.; Jarić, S.; Kostić, O.; Marković, M.; Jakovljević, K.; Mitrović, M.; Pavlović, P. The potential of elm trees (Ulmus glabra Huds.) for the phytostabilisation of potentially toxic elements in the riparian zone of the Sava River. Environ. Sci. Pollut. Res. 2020, 27, 4309–4324. [Google Scholar] [CrossRef]
- Rakocevic, J. Application of epilithic diatoms in the ecological assessment of mountain rivers: Contribution to the development of biomonitoring tools for Montenegrin aquatic ecosystems using the case study of the Tara River. Nova Hedwig. 2018, 106, 337–356. [Google Scholar] [CrossRef]
- Odum, E.P. Fundamentals of Ecology; W.B. Saunders Company: Philadelphia, PA, USA, 1971; p. 574. [Google Scholar]
- Udovičić, B. Energija i Okolina; Građevinska Knjiga: Beograd, Serbia, 1989; p. 190. [Google Scholar]
- Bricelj, M. River and Man—Sava, 1st ed.; Državna založba Slovenije: Ljubljana, Slovenia, 1991; p. 83. [Google Scholar]
- Biggs, B.J.F.; Kilroy, C. Stream Periphyton Monitoring Manual for The New Zealand Ministry for the Environment; National Institute of Water and Atmospheric Research: Christchurch, New Zealand, 2000; p. 246. [Google Scholar]
- Krammer, K.; Lange-Bertalot, H. Bacillariophyceae. 1. Teil: Naviculaceae; VEB G. Fischer. Jena: Jena, Germany, 1986; p. 876. [Google Scholar]
- Krammer, K.; Lange-Bertalot, H. Bacillariophyceae. 2. Teil: Bacillariaceae, Epithemiaceae, Surirellaceae; VEB G. Fischer: Jena, Germany, 1988; p. 596. [Google Scholar]
- Krammer, K.; Lange-Bertalot, H. Bacillariophyceae—Teil 3: Centrales, Fragilariaceae, Eunotiaceae; VEB G. Fischer: Jena, Germany, 1991; p. 576. [Google Scholar]
- Krammer, K.; Lange-Bertalot, H. Bacillariophyceae. 4. Teil: Achnanthaceae, Kritische Ergänzungen zu Navicula (Lineolatae) und Gomphonema Gesamtliteraturverzeichnis; VEB G. Fischer: Jena, Germany, 1991; p. 437. [Google Scholar]
- Rott, E.; Pipp, E.; Pfister, P.; Van Dahm, H.; Ortler, K.; Binder, N.; Pall, K. Indikationslisten fur Aufwuchsalgen in Östereichen Fließgevessern, Teil 2: Trophienindikation so vie Geochemische Präferenz, Taxonomische und Toxicologische Anmerkungen; Bundesministerium für Land und Forstwirtschaft: Wien, Australia, 1999; p. 248.
- Kosi, G.; Šiško, M.; Bricelj, M.; Urbanič, G.; Grbović, J.; Rotar, B.; Stanič, D. Adaptation of Saprobic Index to the demands of Water Framework Directive (Directive 2000/60/EC) for the Assessment of Ecological State of the Rivers in Slovenia using Phytobenthos (in Slovenian); Environmental Agency of the Republic of Slovenia: Ljubljana, Slovenia, 2006; pp. 1–83.
- Braak, C.J.F.; Šmilauer, P. CANOCO Reference Manual and CanoDraw for Windows User’s Guide: Software for Canonical Community Ordination (Version 4.5); Microcomputer Power: Ithaca, NY, USA, 2002. [Google Scholar]
- Hammer, Ø.; Harper, D.A.T.; Ryan, P.D. PAST: Paleontological Statistics Software Package for Education and Data Analysis. Palaeontol. Electron. 2001, 4, 1–9. [Google Scholar]
- Cantonati, M. Diatom communities of springs in the southern Alps. Diatom Res. 1998, 13, 201–220. [Google Scholar] [CrossRef]
- Hynes, H.B.N. The Ecology of Running Waters; University of Toronto Press: Toronto, ON, Canada, 1970; p. 555. [Google Scholar]
- Vermaat, J.E.; Hootsmans, M.J.M. Periphyton dynamics in a temperature-light gradient. In Lake Veluwe, a Macrophyte-Dominated System under Eutrophication Stress; Springer: Dordrecht, The Netherlands, 1994; pp. 193–212. [Google Scholar]
- Cole, J.J.; Caraco, N.F. Carbon in catchments: Connecting terrestrial carbon losses with aquatic metabolism. Mar. Freshw. Res. 2001, 52, 101. [Google Scholar] [CrossRef] [Green Version]
- Sládeček, V. System of Water Quality. Acta Hydrochim. Hydrobiol. 1973, 218. [Google Scholar] [CrossRef]
- Šaulys, V.; Survilė, O.; Stankevičienė, R. An Assessment of Self-Purification in Streams. Water 2020, 12, 87. [Google Scholar] [CrossRef] [Green Version]
- Eliasz-Kowalska, M.; Wojtal, A.Z. Limnological Characteristics and Diatom Dominants in Lakes of Northeastern Poland. Diversity 2020, 12, 374. [Google Scholar] [CrossRef]
- Exner-Kittridge, M.; Strauss, P.; Blöschl, G.; Eder, A.; Saracevic, E.; Zessner, M. The seasonal dynamics of the stream sources and input flow paths of water and nitrogen of an Austrian headwater agricultural catchment. Sci. Total Environ. 2016, 542, 935–945. [Google Scholar] [CrossRef] [PubMed] [Green Version]
- Bailey, R.T.; Ahmadi, M. Spatial and temporal variability of in-stream water quality parameter influence on dissolved oxygen and nitrate within a regional stream network. Ecol. Modell. 2014, 277, 87–96. [Google Scholar] [CrossRef]
- Webster, J.R.; Benfield, E.F.; Ehrman, T.P.; Schaeffer, M.A.; Tank, J.L.; Hutchens, J.J.; D’Angelo, D.J. What happens to allochthonous material that falls into streams? A synthesis of new and published information from Coweeta. Freshw. Biol. 1999, 41, 687–705. [Google Scholar] [CrossRef] [Green Version]
- Chénier, M.R.; Beaumier, D.; Roy, R.; Driscoll, B.T.; Lawrence, J.R.; Greer, C.W. Impact of Seasonal Variations and Nutrient Inputs on Nitrogen Cycling and Degradation of Hexadecane by Replicated River Biofilms. Appl. Environ. Microbiol. 2003, 69, 5170–5177. [Google Scholar] [CrossRef] [Green Version]
- Biggs, B.J.F.; Smith, R.A.; Duncan, M.J. Velocity and sediment disturbance of periphyton in headwater streams: Biomass and metabolism. J. N. Am. Benthol. Soc. 1999, 18, 222–241. [Google Scholar] [CrossRef]
- Cunha de Menezes, B.; Paulo, J.; Bittencourt, P.; Sá Farias, D.; Paulo Cunha de Menezes, J.; Parreira Bittencourt, R.; De Sá Farias, M.; Pinheiro Bello, I. Universidade de Taubaté Deoxygenation rate, reaeration and potential for self-purification of a small tropical urban stream. An. Interdiscip. J. Appl. Sci. 2015, 10, 748–757. [Google Scholar] [CrossRef]
- Rimet, F.; Cauchie, H.M.; Hoffmann, L.; Ector, L. Response of diatom indices to simulated water quality improvements in a river. J. Appl. Phycol. 2005, 17, 119–128. [Google Scholar] [CrossRef]
- Cantonati, M.; Kelly, M.G.; Lange-Bertalot, H. Freshwater Benthic Diatoms of Central Europe: Over 800 Common Species Used in Ecological Assessment; Koeltz Botanical Books: Schmitten-Oberreifenberg, Germany, 2017; p. 942. [Google Scholar]
- Rakowska, B.; Szczepocka, E. Demonstration of the Bzura River restoration using diatom indices. Biologia 2011, 66, 411–417. [Google Scholar] [CrossRef]
- Menegalija, T.; Kosi, G. Distribution of diatoms in springs in the Julian Alps (NW Slovenia). Nat. Slov. 2008, 10, 21–37. [Google Scholar]
- Beauger, A.; Allain, E.; Voldoire, O.; Wetzel, C.E.; Ector, L.; Van de Vijver, B. Temporal Evolution of Diatoms in a Temporary Pond Situated in the Massif du Sancy Mountains (Massif Central, France) and Description of a New Pinnularia Species. Diversity 2020, 12, 367. [Google Scholar] [CrossRef]
- Biggs, B.J.F.; Goring, D.G.; Nikora, V.I. Subsidy and stress responses of stream periphyton to gradients in water velocity as a function of community growth form. J. Phycol. 1998, 34, 598–607. [Google Scholar] [CrossRef]
- Hondzo, M.; Wang, H. Effects of turbulence on growth and metabolism of periphyton in a laboratory flume. Water Resour. Res. 2002, 38, 13-1–13-9. [Google Scholar] [CrossRef]
- Vannote, R.L.; Minshall, G.W.; Cummins, K.W.; Sedell, J.R.; Cushing, C.E. The River Continuum Concept. Can. J. Fish. Aquat. Sci. 1980, 37, 130–137. [Google Scholar] [CrossRef]
- Zelnik, I.; Balanč, T.; Toman, M. Diversity and Structure of the Tychoplankton Diatom Community in the Limnocrene Spring Zelenci (Slovenia) in Relation to Environmental Factors. Water 2018, 10, 361. [Google Scholar] [CrossRef] [Green Version]
- Battegazzore, M.; Pompilio, L.; Botta, P.; D’Arnese, L.; Benigni, E.; Bertola, A.; Spano, M. Diatoms used for the evaluation of the effects of experimental water releases from hydroelectric power plants in alpine river systems: The case of the Cairasca-Devero basins (NW Italy). In Proceedings of the 7th CE-Diatom Meeting, Thonon-les-Bains, France, 16–20 September 2013; pp. 108–110. [Google Scholar]
- Gallo, L.; Battegazzore, M.; Corapi, A.; de Filippis, A.; Mezzotero, A.; Lucadamo, L. Environmental analysis of a regulated Mediterranean stream based on epilithic diatom communities—The Crati River case (southern Italy). Diatom Res. 2013, 28, 143–156. [Google Scholar] [CrossRef]
Figure 1.
Map of locations of all sampling sites within the territory of Slovenia. The positions of dams and accumulations on the river Sava are also presented. The sampling sites: ZE - Zelenci, DO—Dovje, OT—Otoče, ST—Struževo, SE—Šentjakob, KR—Kresnice, PO—Podkraj, KK—Krško, JE—Jesenice na Dolenjskem.

Figure 2.
Ordination diagram of detrended correspondence analysis (DCA). The symbols for winter samples are blue, labeled “Site_w” and the symbols for summer samples are yellow, labeled “Site_s”.
Figure 2.
Ordination diagram of detrended correspondence analysis (DCA). The symbols for winter samples are blue, labeled “Site_w” and the symbols for summer samples are yellow, labeled “Site_s”.

Figure 3.
Ordination diagram of the samples and significant parameters (p < 0.05) according to redundancy analysis (RDA). Blue symbols represent winter samples (e.g., 1.ZE.w etc.), and yellow symbols represent summer samples (e.g., 1.ZE.s).
Figure 3.
Ordination diagram of the samples and significant parameters (p < 0.05) according to redundancy analysis (RDA). Blue symbols represent winter samples (e.g., 1.ZE.w etc.), and yellow symbols represent summer samples (e.g., 1.ZE.s).

Figure 4.
Saprobic index values for all winter samples (Sampling sites are defined in Figure 1).
Figure 4.
Saprobic index values for all winter samples (Sampling sites are defined in Figure 1).

Figure 5.
Saprobic index values for all summer samples (Sampling sites are defined in Figure 1).
Figure 5.
Saprobic index values for all summer samples (Sampling sites are defined in Figure 1).

Figure 6.
Trophic index values for all winter samples (Sampling sites are defined in Figure 1).
Figure 6.
Trophic index values for all winter samples (Sampling sites are defined in Figure 1).

Figure 7.
Trophic index for all summer samples (Sampling sites are defined in Figure 1).
Figure 7.
Trophic index for all summer samples (Sampling sites are defined in Figure 1).

Figure 8.
Proportion of different ecological types of diatoms (ecotypes) in a single sample during winter and summer sampling on the Sava River. Light green: LP—low profile species, dark green: HP—high profile species, orange: M—motile species, blue: PL—planktonic species. For full names of the sampling sites and their locations along the river Sava see Figure 1.

Table 1.
Spearman correlation coefficients (ρ) between quality indices, ecological groups of diatoms and environmental parameters. Statistically significant (p < 0.05) correlations are shown only. TI—trophic index, SI—saprobic index, LP—low profile species, HP—high profile species, M—motile species, PL—planktonic species.
| Quality Index | Ecological Groups | |||||
|---|---|---|---|---|---|---|
| TI | SI | LP | HP | M | PL | |
| Altitude | −0.660 | −0.784 | −0.552 | |||
| Distance from the source | 0.660 | 0.784 | 0.552 | |||
| Channel width | 0.776 | 0.743 | −0.554 | 0.659 | ||
| Periphyton dry mass | 0.550 | |||||
| Current velocity | −0.546 | |||||
| T water | −0.593 | |||||
| Conductivity | 0.717 | 0.792 | 0.676 | |||
| PO4–P | 0.533 | 0.497 | ||||
| TDS | 0.771 | 0.839 | −0.473 | 0.721 | ||
| TN | 0.530 | 0.548 | 0.604 | |||
| NH4–N | 0.520 | 0.551 | 0.481 | |||
| NO3–N | 0.589 | 0.638 | 0.611 | |||
Table 2.
Average values of winter and summer samples for the parameters and indices that were statistically significant according to t-test.
Table 2.
Average values of winter and summer samples for the parameters and indices that were statistically significant according to t-test.
| Winter Samples Average | p-Value | Summer Samples Average | |
|---|---|---|---|
| Parameter: | |||
| Water temperature (°C) | 7.1 | <0.001 | 17.5 |
| Conductivity (µS/cm) | 348 | <0.001 | 321 |
| TDS (mg/L) | 341 | <0.001 | 316 |
| TN (mg/L) | 1.54 | 0.017 | 0.98 |
| NH4–N (mg/L) | 0.39 | 0.048 | 0.03 |
| NO3––N (mg/L) | 1.06 | 0.005 | 0.74 |
| [O2] (mg/L) | 12.9 | <0.001 | 10.3 |
| O2 saturation (%) | 99 | 0.050 | 112 |
| SI | 2.22 | 0.043 | 1.93 |
| Species number | 36.1 | 0.003 | 26.6 |
| Shannon diversity index | 3.70 | 0.012 | 2.94 |
Table 3.
Dominance of taxa in winter (w) and summer (s) samples. The proportions of the two most abundant taxa are in shaded cells. Other species are considered co-dominant because their proportion is >10%. For full names of the sampling sites and their locations along the river Sava see Figure 1.
Table 3.
Dominance of taxa in winter (w) and summer (s) samples. The proportions of the two most abundant taxa are in shaded cells. Other species are considered co-dominant because their proportion is >10%. For full names of the sampling sites and their locations along the river Sava see Figure 1.
| ZE | DO | OT | ST | ŠE | KR | PO | KK | JE | ||||||||||
|---|---|---|---|---|---|---|---|---|---|---|---|---|---|---|---|---|---|---|
| Taxa | w | s | w | s | w | s | w | s | w | s | w | s | w | s | w | s | w | s |
| Achnanthidium minutissimum | 41 | 51 | 30 | 48 | 23 | 41 | 22 | 38 | 30 | 26 | 16 | 27 | 16 | 36 | ||||
| Achnanthidium pyrenaicum | 20 | 21 | 25 | 35 | 13 | 38 | 12 | 37 | 29 | 14 | 17 | 24 | 42 | |||||
| Encyonema minutum | 15 | 10 | 17 | |||||||||||||||
| Gomphonema tergestinum | 15 | 32 | ||||||||||||||||
| Navicula lanceolata | 17 | 27 | ||||||||||||||||
| Nitzschia fonticola | 15 | 13 | ||||||||||||||||
| Cyclotella meneghiniana | 42 | |||||||||||||||||
| Amphora pediculus | 20 | |||||||||||||||||
| Surirella minuta | 11 | |||||||||||||||||
| Navicula reichardtiana | 7 | |||||||||||||||||
| Cocconeis placentula | 17 | |||||||||||||||||
| Diatoma ehrenbergii | 13 | |||||||||||||||||
| Mayamaea atomus | 10 | |||||||||||||||||
| Nitzschia gracilis | 10 | |||||||||||||||||
Publisher’s Note: MDPI stays neutral with regard to jurisdictional claims in published maps and institutional affiliations. |
© 2020 by the authors. Licensee MDPI, Basel, Switzerland. This article is an open access article distributed under the terms and conditions of the Creative Commons Attribution (CC BY) license (http://creativecommons.org/licenses/by/4.0/).
Share and Cite
MDPI and ACS Style
Zelnik, I.; Sušin, T. Epilithic Diatom Community Shows a Higher Vulnerability of the River Sava to Pollution during the Winter. Diversity 2020, 12, 465. https://0-doi-org.brum.beds.ac.uk/10.3390/d12120465
AMA Style
Zelnik I, Sušin T. Epilithic Diatom Community Shows a Higher Vulnerability of the River Sava to Pollution during the Winter. Diversity. 2020; 12(12):465. https://0-doi-org.brum.beds.ac.uk/10.3390/d12120465
Chicago/Turabian StyleZelnik, Igor, and Tjaša Sušin. 2020. "Epilithic Diatom Community Shows a Higher Vulnerability of the River Sava to Pollution during the Winter" Diversity 12, no. 12: 465. https://0-doi-org.brum.beds.ac.uk/10.3390/d12120465
Note that from the first issue of 2016, this journal uses article numbers instead of page numbers. See further details here.