Article

Transcriptome Comparison of Secondary Metabolite Biosynthesis Genes Expressed in Cultured and Lichenized Conditions of Cladonia rangiferina

by
Natalia Sveshnikova
* and
Michele D. Piercey-Normore
School of Science and the Environment, Grenfell Campus, Grenfell Campus, Memorial University of Newfoundland, Corner Brook, NL A2H 5G4, Canada
*
Author to whom correspondence should be addressed.
Submission received: 29 September 2021 / Revised: 18 October 2021 / Accepted: 21 October 2021 / Published: 24 October 2021

Abstract

:
Lichen secondary metabolites are natural products of high medicinal and industrial value, which are produced by the fungal symbiont (mycobiont) of lichens in response to environmental changes. It has been shown that the cultured mycobiont is capable of secondary metabolite production, specifically polyketides, and polyketide production is affected by the presence or absence of the algal or cyanobacterial symbiont (photobiont). Identification of polyketide synthases encoding genes is, in turn, key for understanding the regulation of secondary metabolite synthesis. Using a previously established method of resynthesis for Cladonia rangiferina as well as the sequenced and assembled genome of that species, we compared transcriptomes of C. rangiferina cultured alone and resynthesized with the photobiont (Asterochloris glomerata) to reveal transcriptionally active genes in secondary metabolic gene clusters, as well some of the neighbouring genes, induced by the presence of the photobiont and events of lichenization. The results identify potential candidates for PKS genes in C. rangiferina, identify potential neighbouring genes in the PKS cluster, and offer insights into further research. The study provides preliminary insights into the activity of several identified biosynthetic gene clusters (BGC) as well as interactions of genes within those clusters.

1. Introduction

There are over 1000 lichen secondary metabolites identified to date [1]. Their potential for pharmaceutical and biotechnology uses lies in bioactive properties such as antibacterial and antifungal activity, or industrially relevant features such as hydrophobicity and metal chelation [2,3,4,5,6]. There is, therefore, a growing need for known and yet to be discovered secondary metabolites. However, knowledge of their regulation in lichens has been a slow process. Although modern improved culture methods increased progress in biotechnology using axenic lichen fungi (mycobionts) [7], the use of engineered biosynthesis in an easily cultivated universal host, carrying gene clusters of corresponding synthases, seems to be a more viable solution [8]. Thus, the identification of genes involved in secondary metabolite synthesis, and discerning conditions required for their activation, has become an important part of the discovery and exploration of new bioactive compounds.
The conventional approach to identifying gene function is to begin with the product that must be identified and characterised, and then the gene(s) responsible for its production must be revealed [9]. Evolutionary and comparative genomics, combined with reverse genetics and gene knockout techniques remain to be powerful tools allowing for the identification and characterization of genes involved in biosynthetic pathways [10,11,12,13]. However, modern genome mining technologies and a growing amount of DNA sequence data have allowed the opposite approach: the function of newly identified genes and gene clusters can be predicted based on characteristics of already investigated genes and their products [14]. This genome mining method led to the discovery of many biosynthetic pathways for which no actual product has been characterized until now [15,16,17].
The vast majority of the secondary metabolites in lichens are produced by three types of synthases—large multienzyme protein complexes: terpene synthases (TPS) producing terpenes, nonribosomal peptide synthetases (NRPS) producing small peptides, and polyketide synthases (PKS), producing polyketides [18,19,20]. Polyketide synthases may be further characterized according to their sequences, primary structures, and catalytic mechanisms into more specialized subgroups [21]. Lichen-forming fungi are known to have type I polyketide synthases; however, recent assays revealed the presence of type III-like PKS in some lichen mycobionts, though the role is unclear [22]. Genes involved in the biosynthesis of secondary metabolites are usually organized in separate clusters for fungi, often under the control of a single regulator, and not all of them are expressed under standard laboratory conditions [19,23]. Activation of these genes in nature depends on different environmental and physiological factors [18,24].
Although lichen polyketides, terpenes and small peptides, are known to be produced by the mycobiont alone [25], their synthesis requires carbon, which in nature is provided by the photosynthetic partner, algae or cyanobacteria (photobiont) [26]. Some lichen-fungi that associate with cyanobacteria can fix nitrogen playing roles in nutrient acquisition or pollution tolerance within the environment [27,28], but these lichens are less frequently cultured and tend to produce fewer polyketides. Co-culturing of the lichen-forming fungus with its green algal photobiont has been shown to allow secondary metabolite biosynthesis to occur [7]. One study showed that the aposymbiotic cultures of the mycobiont growing on the media supplemented with carbon sources, produced polyketides [29]. To identify which genes are activated by lichenization, we compared transcriptomes of C. rangiferina cultured alone, C. rangiferina at later stages of resynthesis (as identified by Athukorala, [30]) with the photobiont (Asterochloris glomerata), and the natural lichen thallus of C. rangiferina.
Profiles were screened for the presence and expression of predicted secondary metabolite biosynthesis gene clusters, generated by the latest version of antiSMASH analysing software (open access) [31] from previously sequenced and assembled (URGP 2014) genome of Cladonia rangiferina. The study provides preliminary insights into the activity of several identified biosynthetic gene clusters (BGC) as well as the interaction and mutual influence of genes within those clusters. Further research can be focused on the specific BGC (and neighbouring) genes, contributing to the research of probable gene transfer and engineered biosynthesis of secondary metabolites in an artificial host.
Objectives:
The goal of the research was the identification of genes involved in polyketide synthesis in Cladonia rangiferina, through expression patterns affected by the events of lichenization, with the more specific objectives being:
(a)
To identify which, if any, secondary metabolite BGC genes are affected by lichenization processes.
(b)
To identify additional genes responsible for PKS activation outside the BGC core.
(c)
To evaluate the importance of the lichenization processes for potential use as a triggering mechanism of secondary metabolite production.

2. Materials and Methods

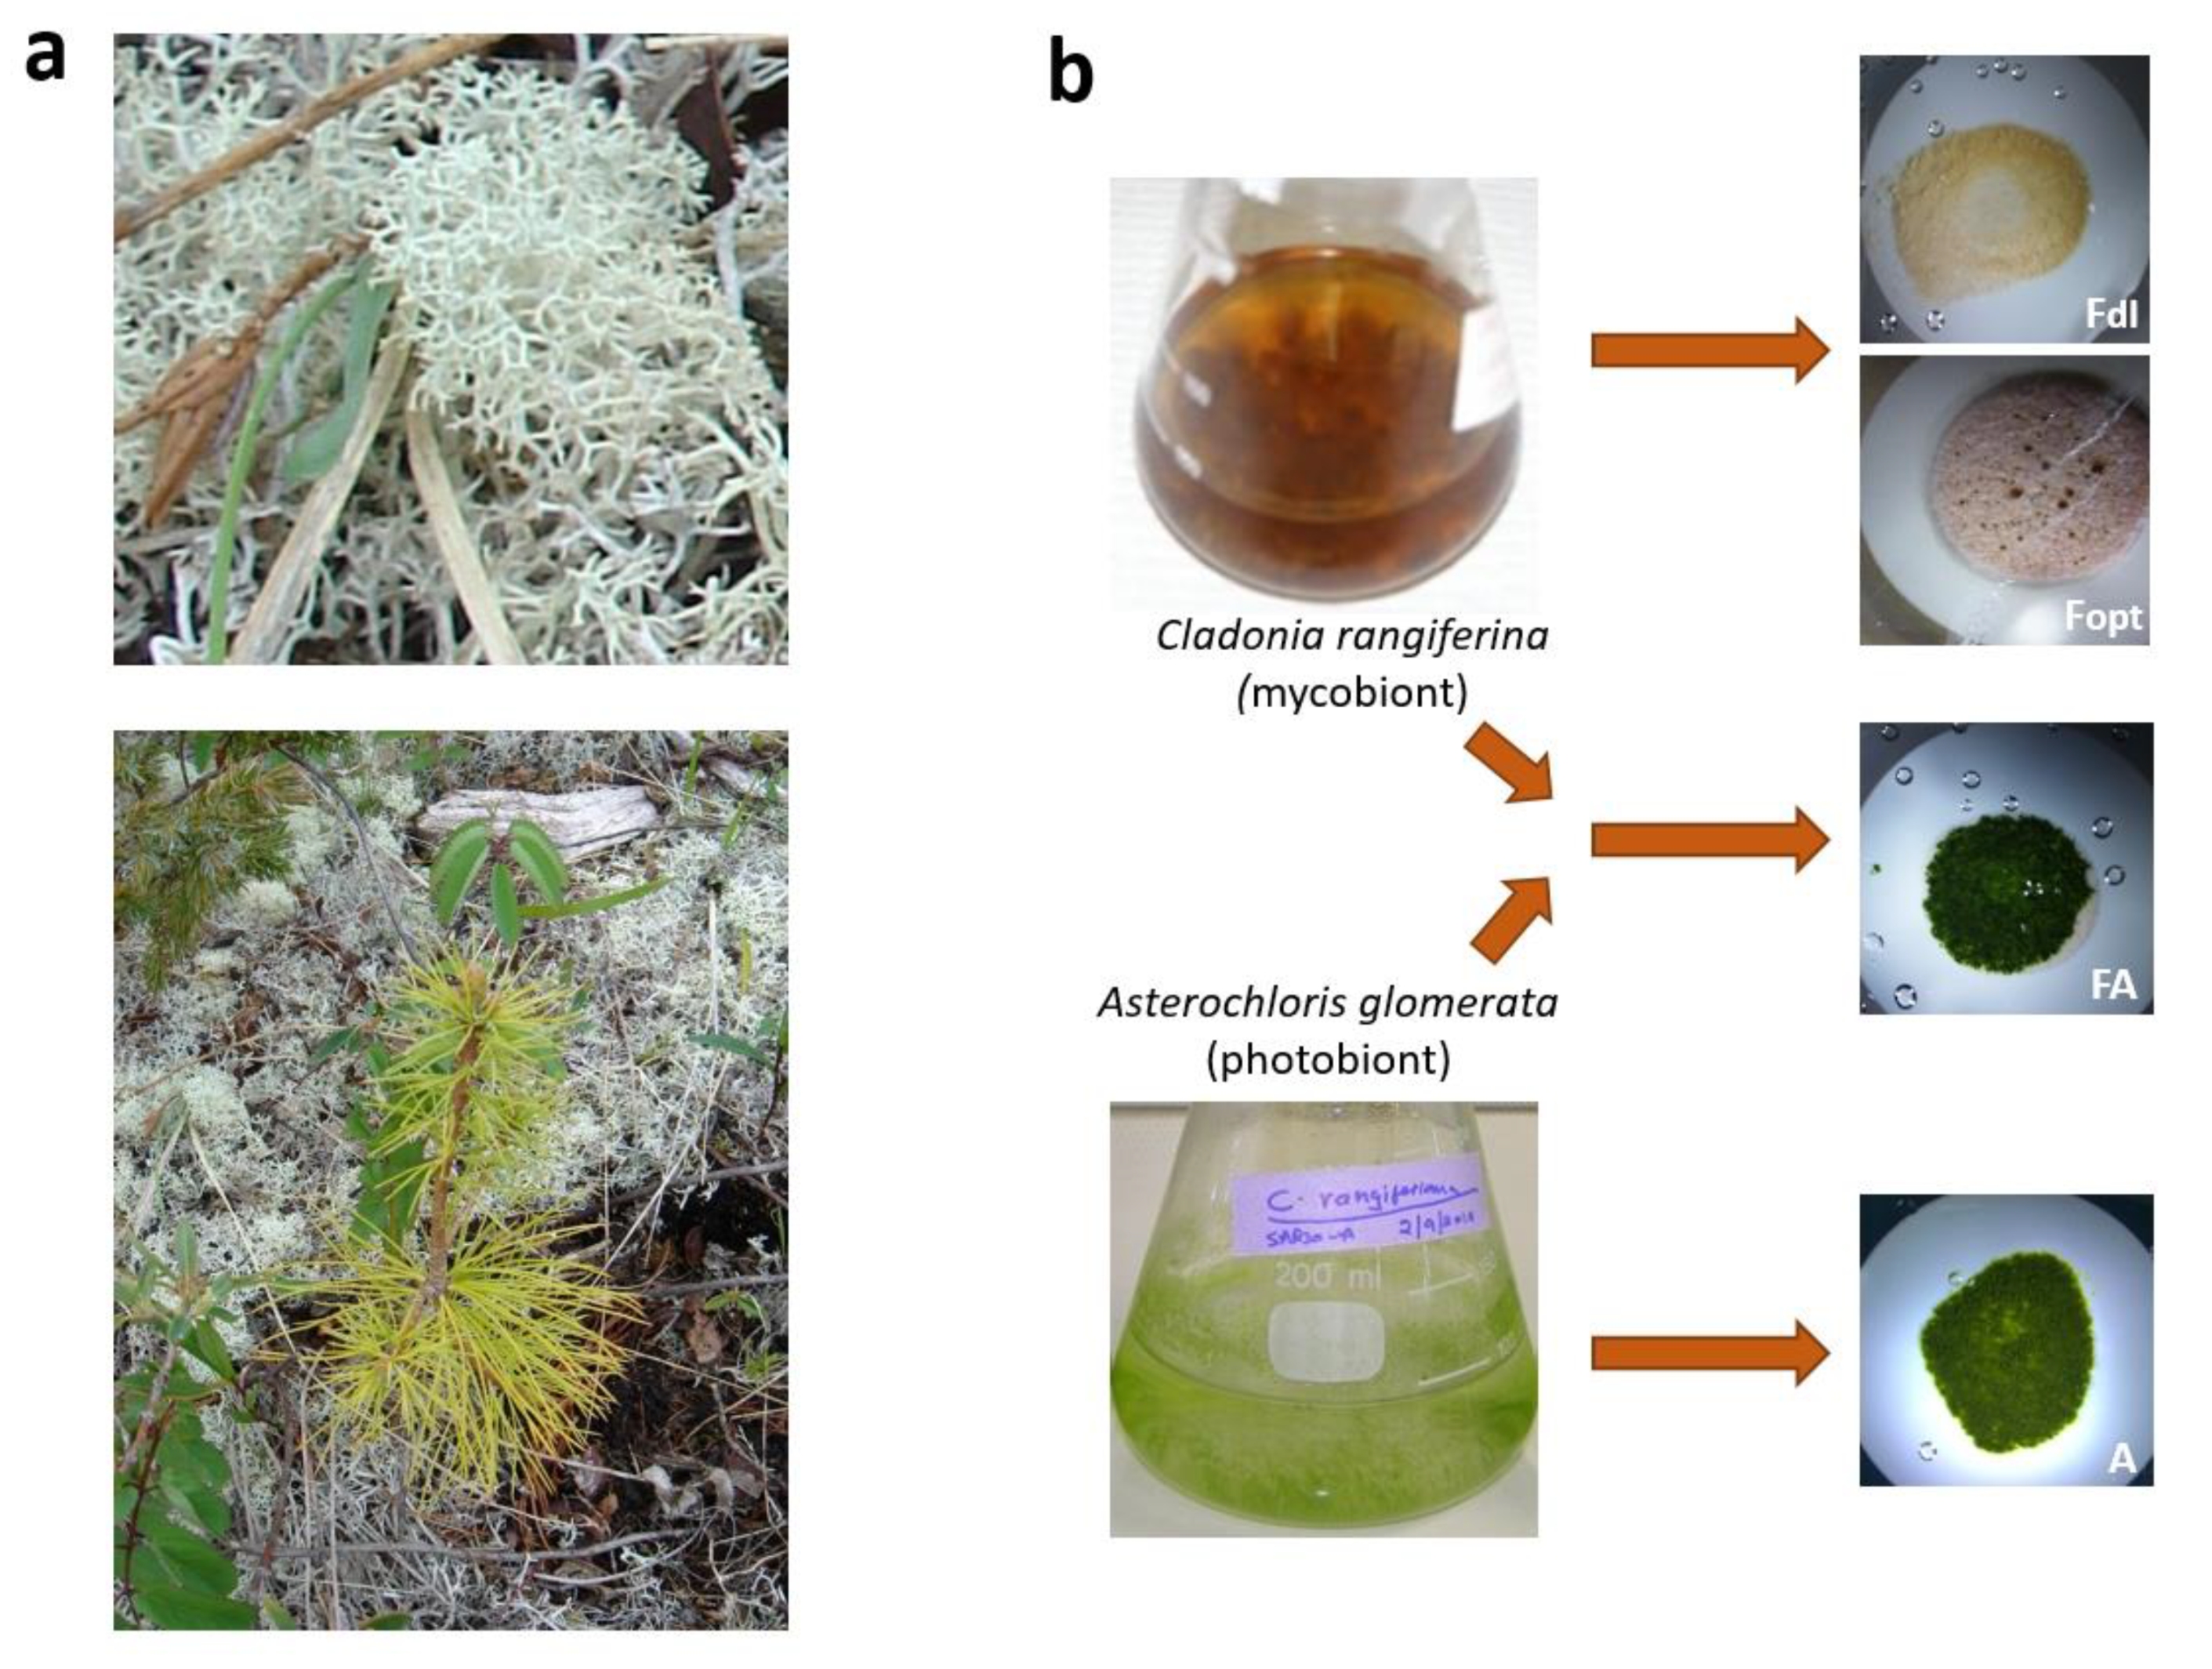
2.1. Co-Inoculation and Resynthesis

Resynthesis was performed according to the previously established protocol for lichenization in C. rangiferina [30]. Two axenic cultures were obtained from a lab culture collection, Cladonia rangiferina and Asterochloris glomerata, which were subcultured three months before resynthesis on 1.5% malt yeast extract agar (MY) (malt extract; 20 g, yeast extract; 2 g, agar; 15 g in 1 L distilled water) and Bold’s Basal Medium (BBM, liquid) [32,33] respectively.
The identity of each of the cultured symbionts was confirmed by sequencing of internal transcribed spacer 1 and 2 (ITS 1 and 2) region of the nuclear ribosomal RNA gene performed with primers 1780-F (5’-CTGCGGAAGGATCATTAATGAG-3’) [34] for the mycobiont and 1780A (5’-CTGCGGAAGGATCATTGATTC-3’) [34] for the photobiont, with ITS4 (3’-TCCTCCGCTTATTGATATGC-5’) [35] as a 3′ primer for both symbionts. The resulting sequences showed 100% similarity to the sequences KY119381 (fungus) and MT036563 (alga), respectively.
One month prior to co-inoculation, fungal colonies were gently ground with a sterile mortar and pestle and inoculated into 100 mL of liquid MY medium (20 g malt extract and 2 g yeast extract in 1 L of distilled water). Liquid cultures were maintained at 20 °C with continuous shaking at 150 r/min.
After one month incubation, 50 mL of fungal culture was centrifuged at 8000 rpm for 10 min, drained, ground with a mortar and pestle under sterile conditions, and resuspended in 50 mL of 99:1 medium (1 mL of MY added to 99 mL of BBM; [36]) to obtain a homogeneous suspension. One hundred millilitres of lichen algal culture was centrifuged, at 8000 rpm for 10 min, drained, and the algal cell pellet was resuspended in 50 mL of the same 99:1 medium (1 mL of MY added to 99 mL of BBM; [36]) to obtain a concentrated suspension. The resulting suspensions were used for co-inoculation: 500 μL of the prepared C. rangiferina suspension was inoculated onto nitrocellulose filters (25 mm diameter, 0.22 μm, MilliporeSigma, Canada GSWP02500) in the Petri plates containing 99:1 agar medium and allowed to dry for 1 h under sterile conditions. After 1 h the same nitrocellulose filter papers containing C. rangiferina were inoculated with 500 μL of A. glomerata and dried for 1 h under sterile conditions.
Two large Petri plates with five filters each were prepared for every culture, resulting in 10 replicates of the alga alone, fungus alone (on the nutrient-poor medium and optimal nutrient-rich medium), and fungus combined with the alga (co-culture). The 40-day old cultures were pooled together for the total RNA extraction.
The natural thallus of C. rangiferina used in comparison experiments was collected from Birchy Bay, Newfoundland (N49° 190 15.300; W56° 410 07.0200; 126.2 masl). Dry thallus was rehydrated for about 6 h under the same incubation conditions as the cultures prior to RNA extraction [37].

2.2. RNA Extraction, RNA Sequencing and Transcript Analysis

Total RNA was extracted using the RNeasy kit (Qiagen, Germantown, MD, Canada, according to the manufacturer’s instructions (resulting in 35 µL of total RNA (RIN > 6.5) with a concentration between 90–200 ng/µL). The cDNA library construction and RNAseq were done through services offered by McGill University and Genome Quebec Innovation Centre (http://www.gqinnovationcenter.com/index.aspx?l=e) using Illumina HiSeq 4000 System (Illumina, Inc., San Diego, CA, USA).
The sequencing reads were mapped to the C. rangiferina genome (unpublished) by alignment program HISAT2 v. 2.2.1 (The Center for Computational Biology at Johns Hopkins University, Baltimore, MD, USA) [38]. Genome annotation was performed using gene finder tool GlimmerHMM v. 3.0.4. (The Center for Computational Biology at Johns Hopkins University, Baltimore, MD, USA) [39], a gene finder based on a Generalized Hidden Markov Model [40] trained on the genome of Cladonia grayi [41], and the perl toolkit AGAT v. 0.5.1 (BeeBiome-consortium, Alcediag, Montpellier, France) [42]. After the file conversion with samtools v.1.9 (HTSlib, GitHub) (http://www.htslib.org/) and extraction of gene sequences with BEDTools v.2.29.2 (HTSlib, GitHub) [43], transcripts were assembled and their abundances estimated with StringTie v.2.1.3 (The Center for Computational Biology at Johns Hopkins University, Baltimore, MD, USA) [44].
The differential expression analysis was performed using Bioconductor software package edgeR (Storey Lab, Princeton University, Princeton, NJ, USA) [45]. A gene was classified as differentially expressed if the expression change exceeded two-fold (Log2 2-FC) at an FDR of 0.05.
Using GlimmerHMM (The Center for Computational Biology at Johns Hopkins University, Baltimore, MD, USA) [39], the number of protein coding genes was predicted. The sequenced reads for all four samples were mapped to the C. rangiferina mycobiont genome with over 90% overall alignment rate for each sample.

2.3. Secondary Metabolite Gene Clusters Determination and Analysis

The web-based prediction tool “antibiotics and secondary metabolites analysis shell” (antiSMASH)–a tool designed to identify secondary metabolite ‘biosynthetic gene clusters’ (BGCs) in genomes of plants, bacteria and fungi [31] (v.5, the latest version on the day of research) was used to reveal secondary metabolite gene clusters within the C. rangiferina genome. The potential gene clusters (or “regions”) were searched against the database of highly conserved enzyme HMM profiles (core-enzymes), which are indicative of a specific BGC type, and after that individual protoclusters encoded in the region were determined according to pre-defined cluster rules. The regions that make up a core later were extended by its neighbourhood, which constitutes genes encoded up-stream and down-stream of the core, that may affect core gene transcription.
The list of all differentially expressed genes (DEG) was compared to predicted gene clusters and the resulting genes were analysed using R statistical packages for graphical representation.

3. Results and Discussion

Two long-term axenic cultures from the laboratory culture collection—Cladonia rangiferina and Asterochloris glomerata—were used to investigate transcriptome changes during the process of resynthesis. The chosen experimental conditions included control: the non-symbiotic fungus C. rangiferina growing on the diluted nutrient-poor medium (Fdl), and two experimental treatments: the non-symbiotic fungus C. rangiferina growing on the nutrient-rich malt yeast extract (Fopt)—a medium known as optimal for growth of a variety of fungi [46], and a co-culture of C. rangiferina fungus mixed with alga A. glomerata growing on the diluted medium (FA). Natural thallus (NT) of C. rangiferina collected in Central Newfoundland was used for comparison (Figure 1).
A similar experiment with a photobiont, A. glomerata, was conducted: the non-symbiotic alga (A) versus a co-culture of C. rangiferina mixed with A. glomerata (FA), with the natural thallus (NT) of C. rangiferina used for comparison.
Using a previously established protocol for C. rangiferina lichenization [30] we chose the 40-day incubation for sampling as the point when the stable expression of a few known PKS genes could be observed [29].

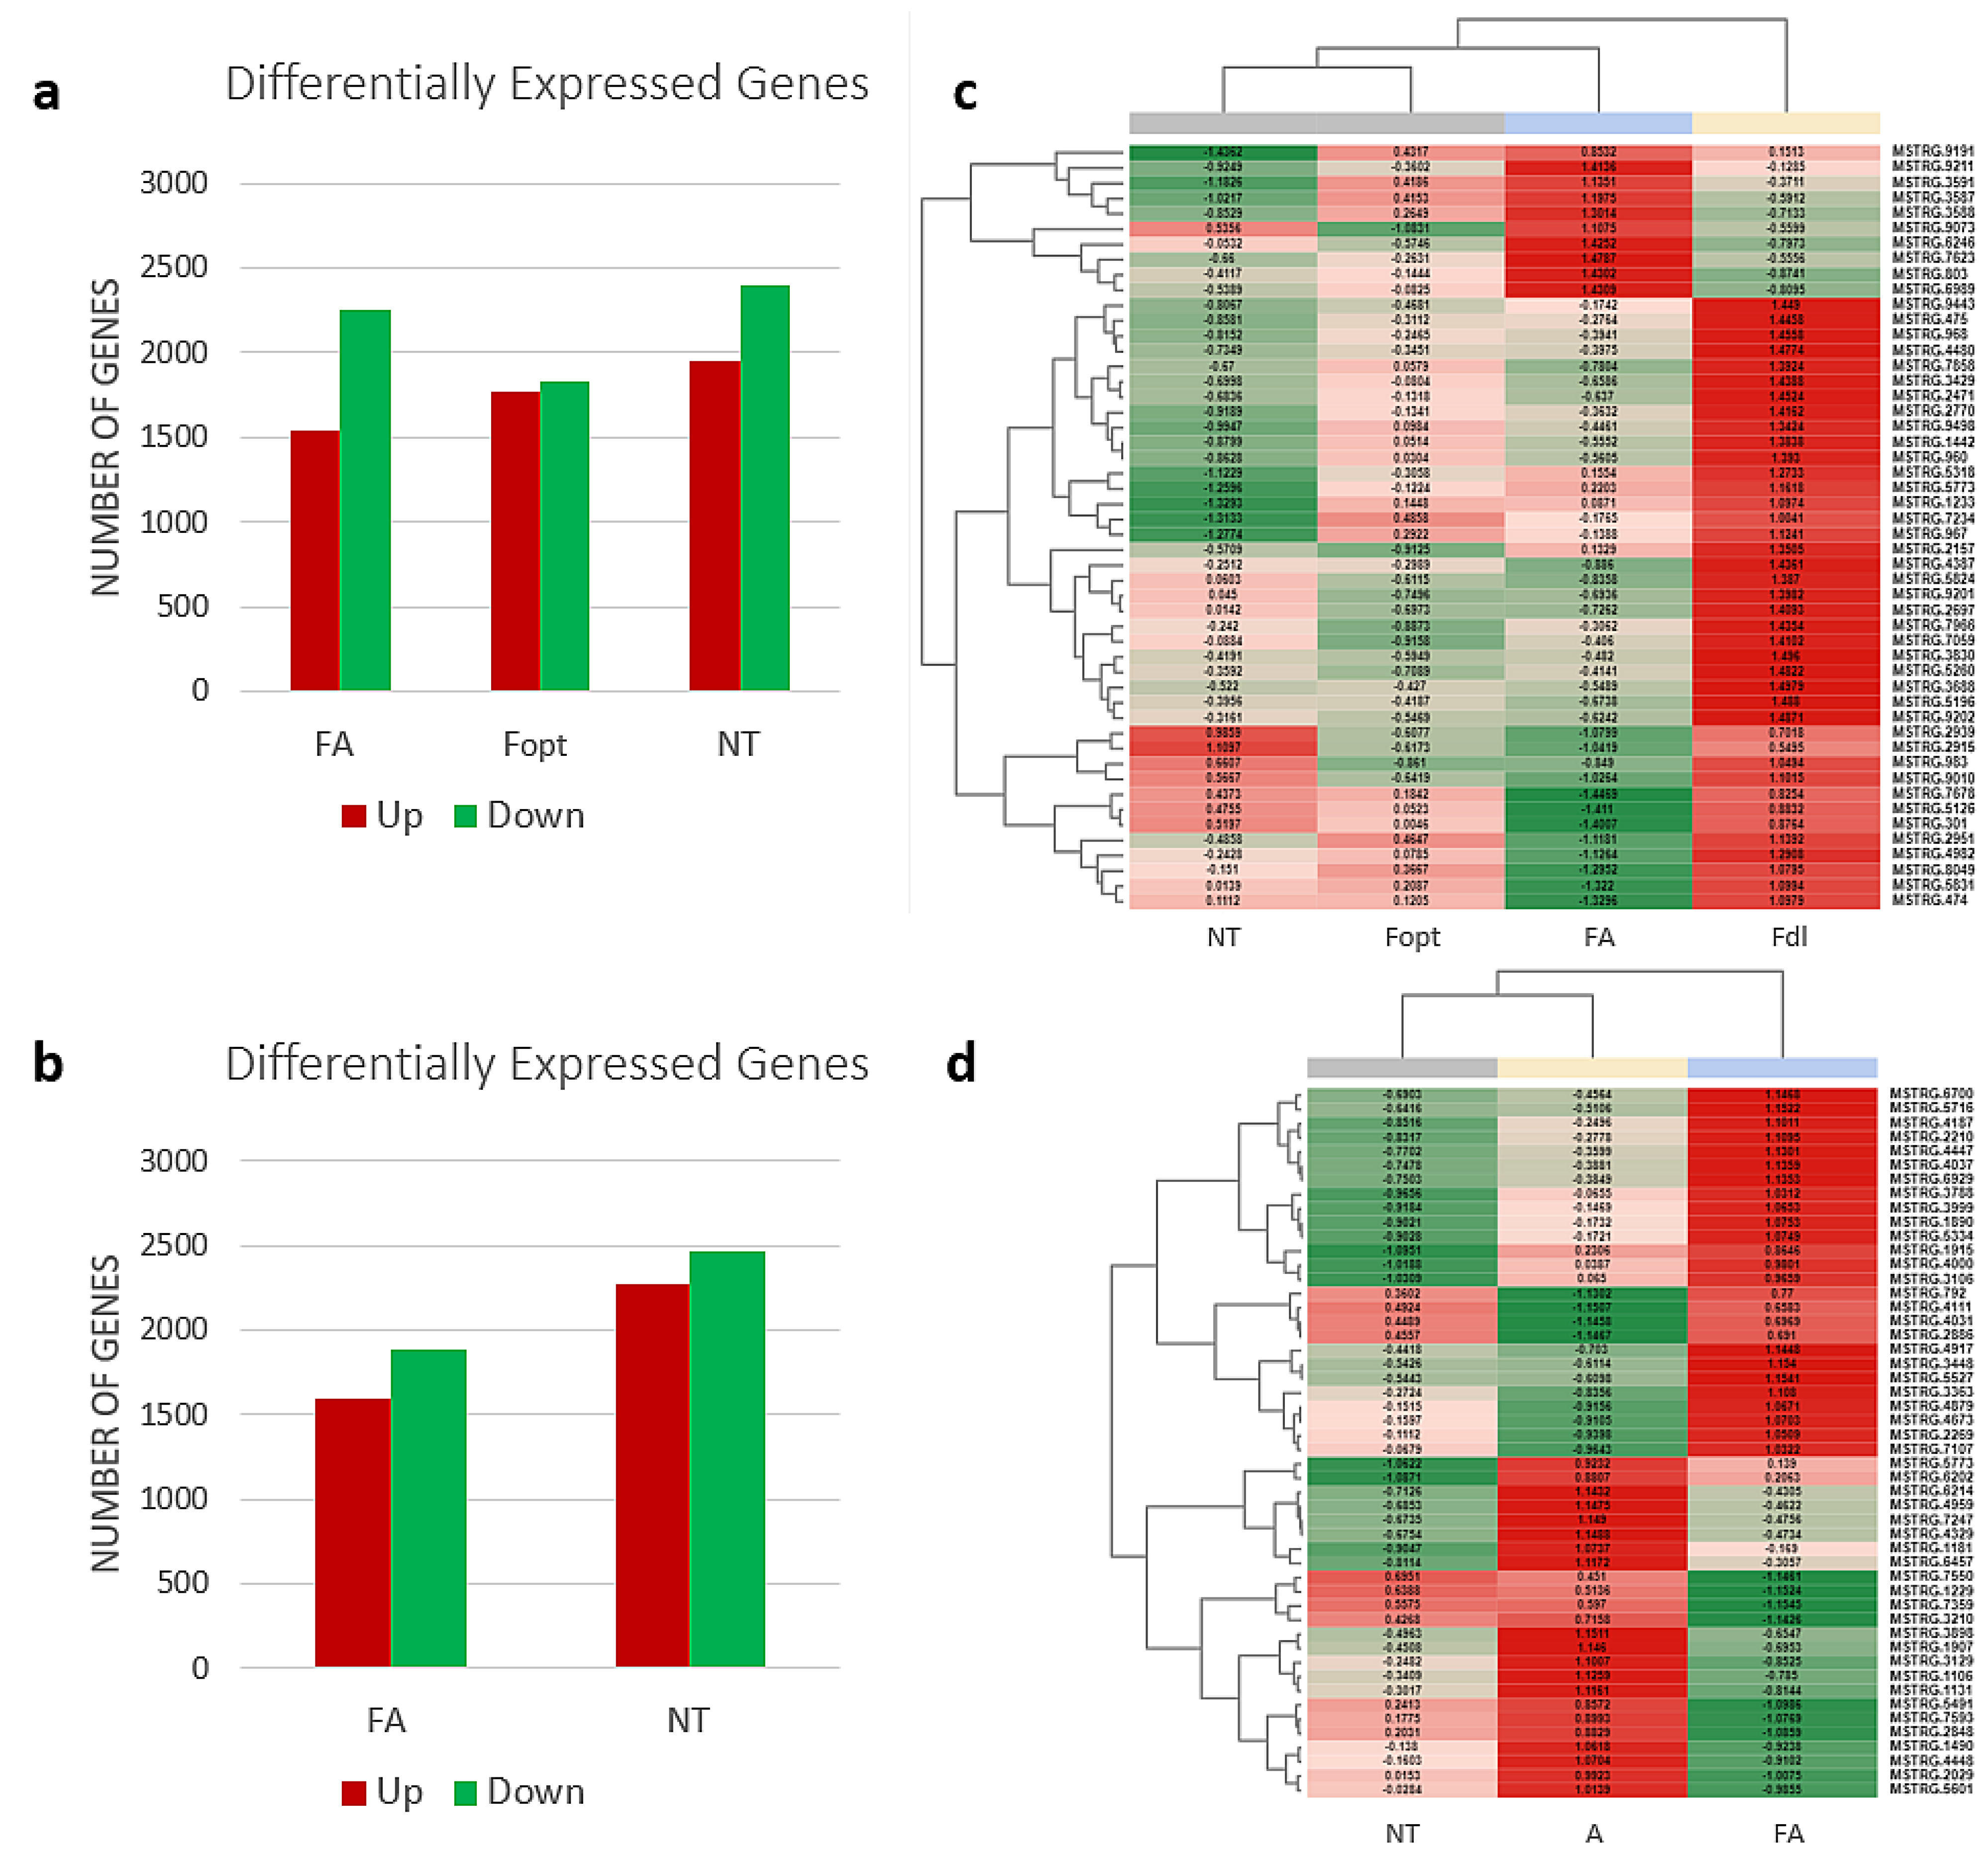
3.1. RNA Sequencing and Transcriptome Analysis

In order to obtain the necessary amount of RNA for an efficient next-generation sequencing (Illumina Hiseq (Illumina, Inc., San Diego, CA, USA) paired-end reads, 100 bp), all replicates for each culture respectively were pooled together. Pooling samples together (biological averaging) is a method that was used in microarray research for years [47,48], and was later adopted for the RNA sequencing optimization [49,50], supported by modern methods of computation of differential expression between two experimental conditions (the NOISeq package for R, [51,52]). Applying this strategy resulted in a sufficient amount of RNA that provided an average of ~50 million 100-bp reads for each sample.
The number of predicted genes (28,715 for the mycobiont and 26,162 for the photobiont), as well as the numbers of protein coding genes (10,140 and 8431, respectively) and differentially expressed genes during lichenization (Figure 2a,b, Additional file S2, Supplementary Materials), were in agreement with previous observations [41,53,54,55,56].
Pairwise differential expression analysis of read counts in the experimental conditions (FA, Fopt, NT for mycobiont; and FA, NT for photobiont) relative to the non-symbiotic monocultures (Fdl and A respectively) was combined with GO/InterPro annotation using Blast2Go software to identify genes and cell processes affected by the events of lichenization.
Figure 3 presents the fifteen most active up- and down-regulated processes for every GO category in the co-culture for both partners.
Despite the long history of lichenology, lichen-forming fungal and algal genome databases are lacking in entries, but other fungal and algal databases are available for comparison (Figure 3, Table 1). As expected (and was previously reported for different co-cultures [41,56]) both the mycobiont and photobiont demonstrated downregulation of the expression of the numerous genes in comparison to the mono-cultures (Figure 2a,b). Interestingly enough, in the case of the mycobiont, the same effect was observed for the monoculture, growing on the optimal nutrient-rich media (Fopt, growing on malt yeast extract), indicating that the genes and processes in question may be related to the carbohydrate intake.
Table 1 shows the annotated genes for the top 50 differentially expressed genes in this study. The photobiont genes include upregulated photosynthetic proteins (MSTRG.2269, MSTRG.3363) and those participating in amino acid transportation (MSTRG.1890), which may have been expected during lichen formation and was observed for other lichen species [56], while far fewer annotated down-regulated genes include hydrolases and proteins involved in transcription regulation.
In the case of the mycobiont, the most downregulated cluster (genes MSTRG.2157—MSTRG.9202, Figure 2c) includes FAD-dependent oxidoreductases and proteins involved in processes related to membrane transportation, which is common for the production of degrading compounds by saprobic organisms and it forms part of fungal metabolic processes [57]. It can be speculated, that a monoculture of fungus, lacking any other source of carbohydrate, might be forced to rely on those processes to extract nutrients from nutrient deficient media. However, when other nutrient sources are available such as a photobiont producing carbohydrates or carbohydrates easily absorbed from the media, the need for those proteins is lessened.
Among the up-regulated genes of the mycobiont, the most common was found to be p450 (MSTRG.9191, MSTRG.3591, MSTRG.3588), which is known to catalyze monooxygenation reactions in primary and secondary metabolism [58]. Expression of p450 genes was observed in previous studies on polyketide synthases [59]. Even though the entire transcriptome analysis was not the goal of this research, the presence of polyketide synthase (MSTRG.960, region 17.1, Figure 4a) among the most differentially expressed genes was notable, supporting a possible influence of lichenization processes on secondary metabolite enzymes.

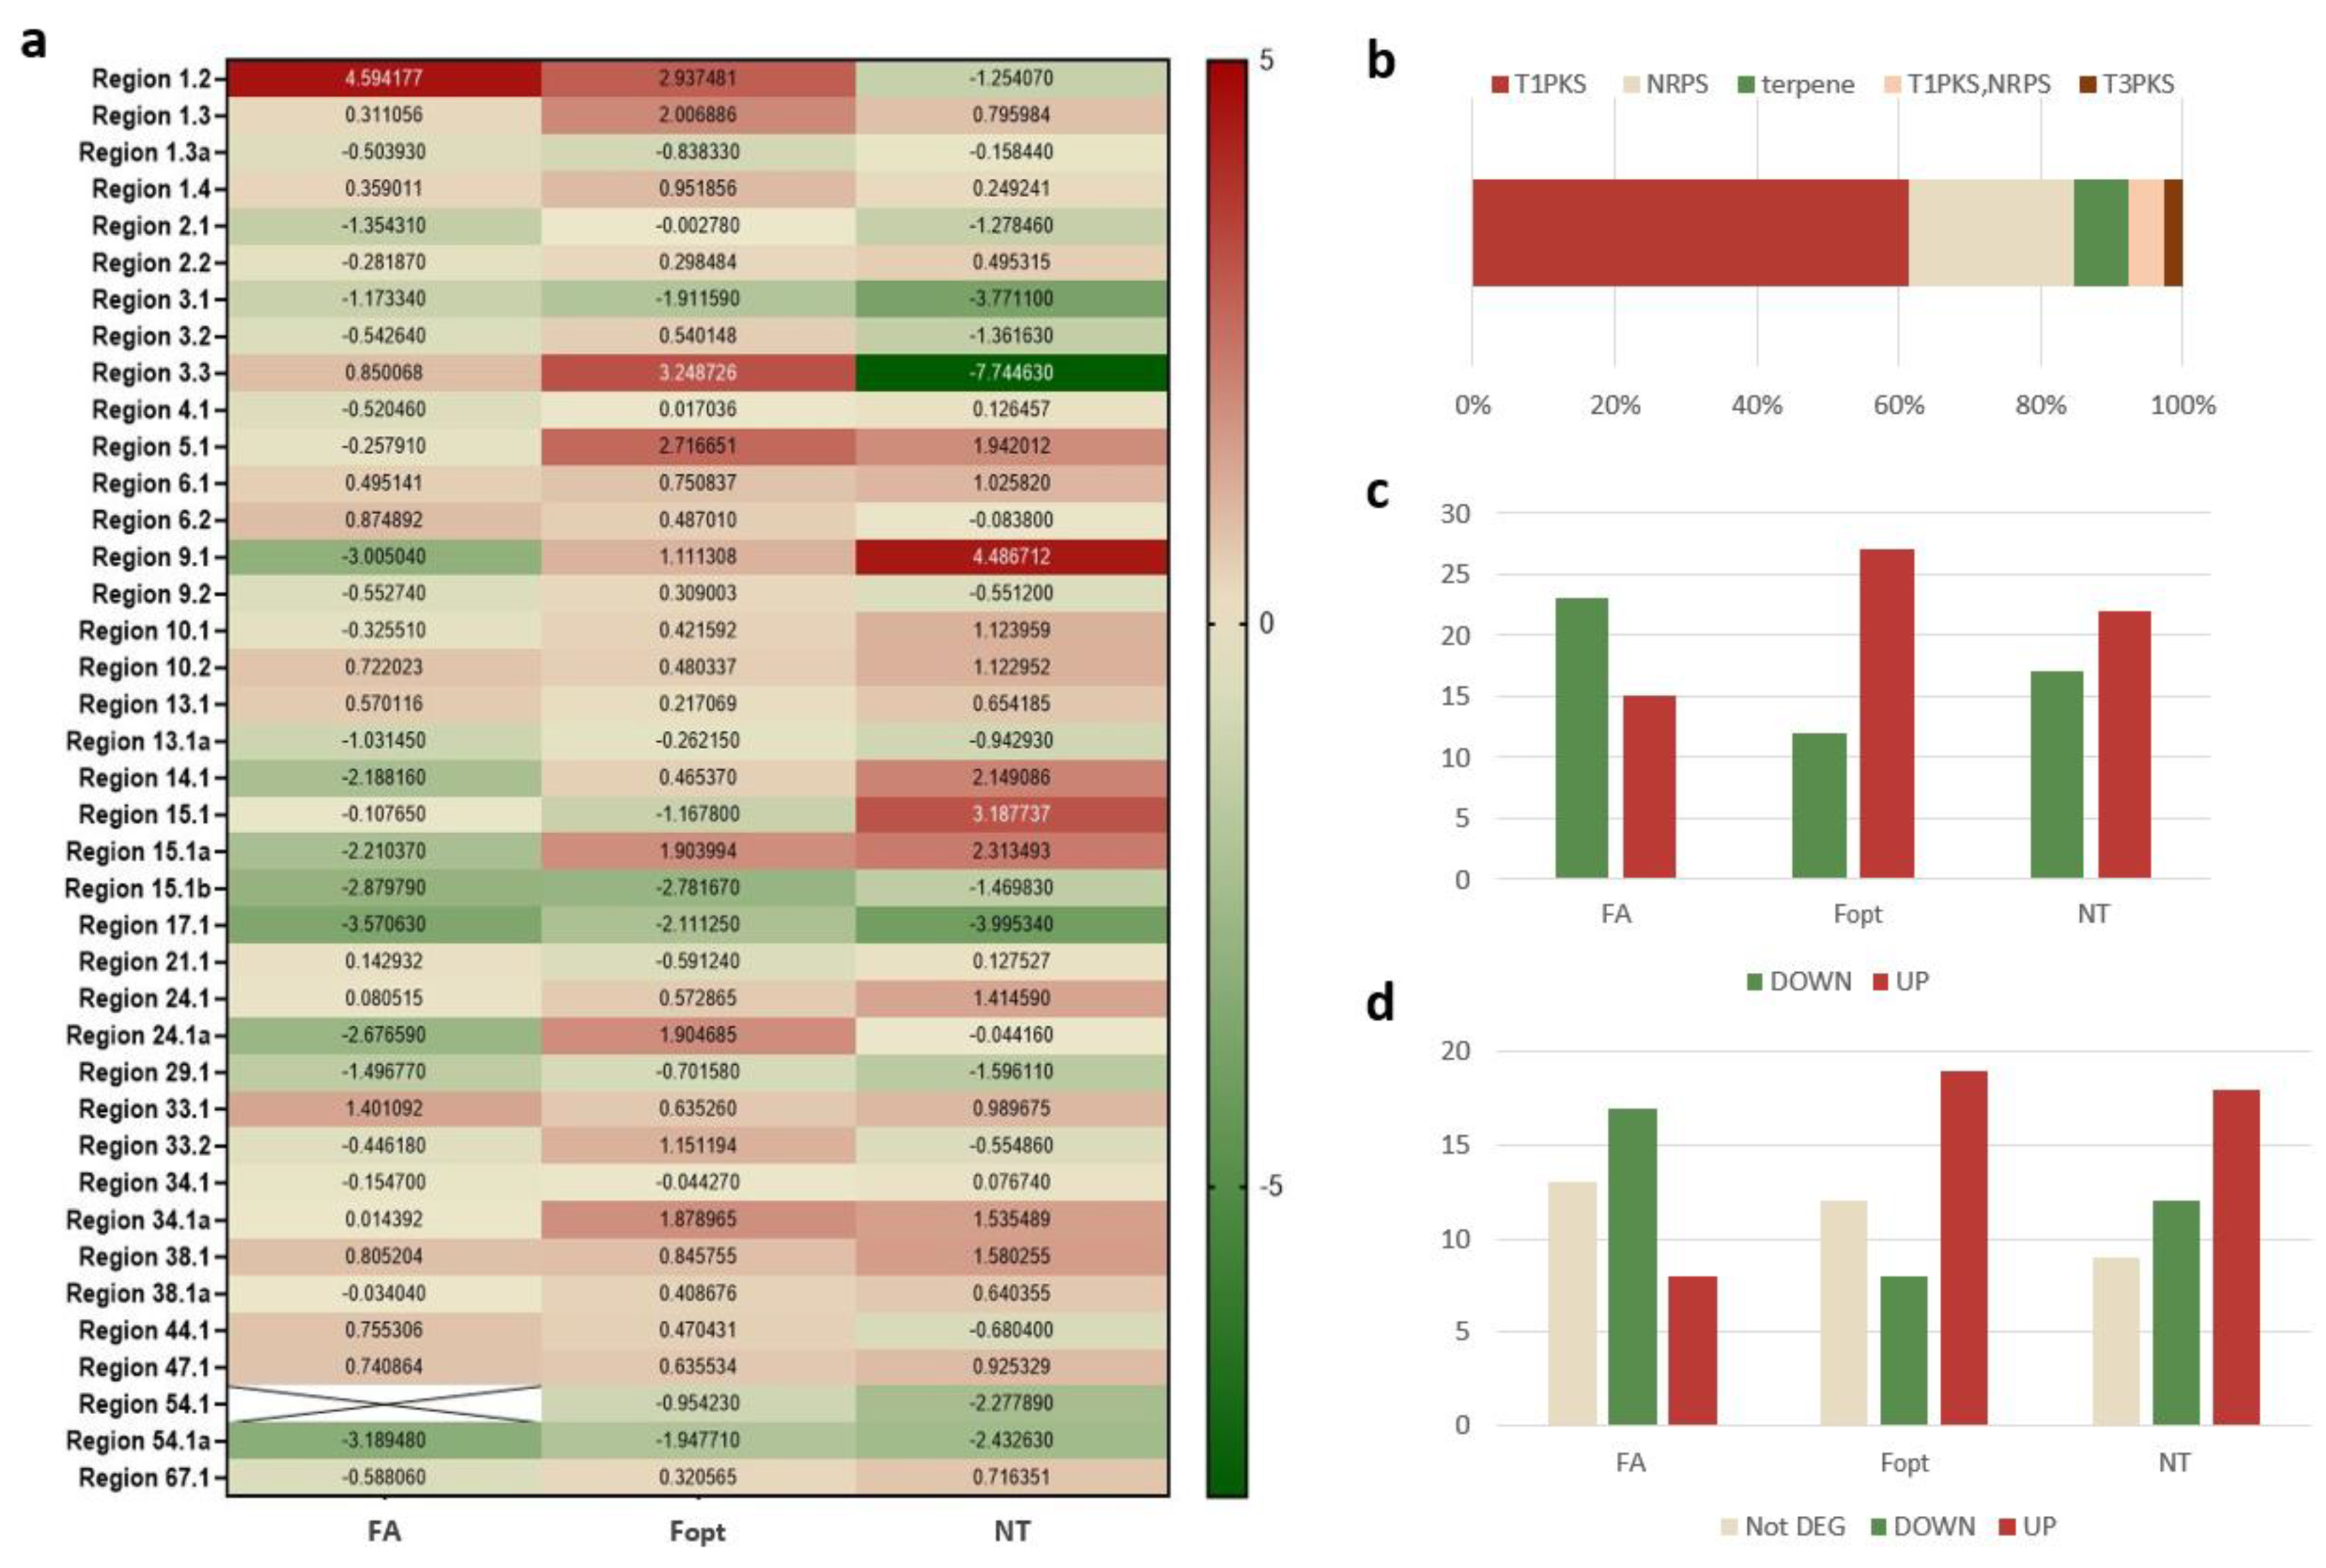
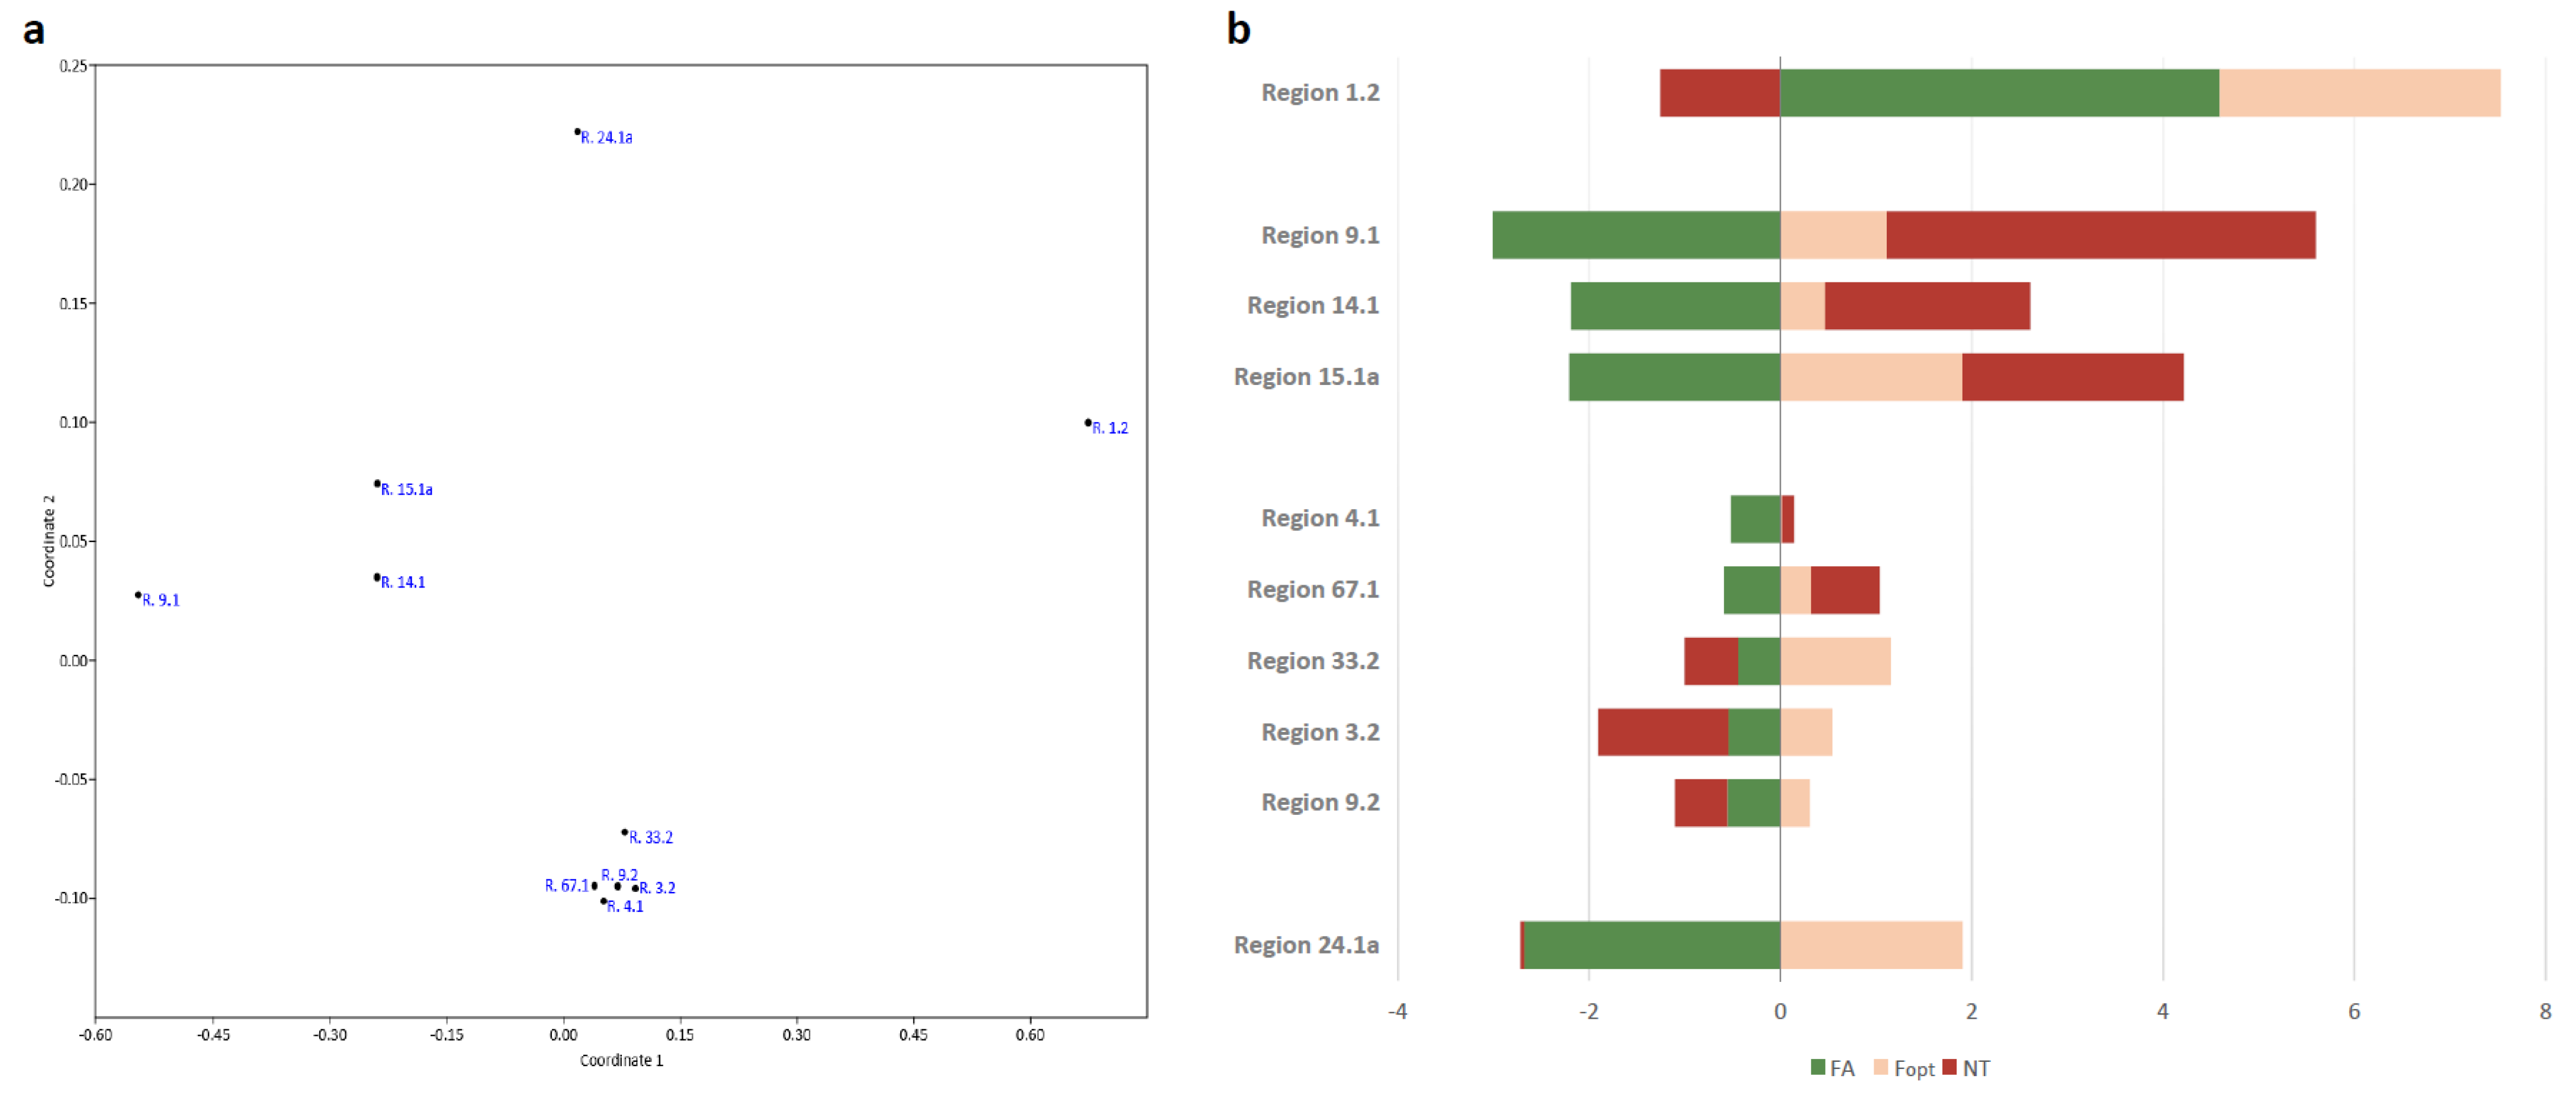
3.2. PKS Transcription Analysis

Version v.5 of the antiSMASH software identified 33 potential biosynthetic gene clusters (BGCs, or “regions”) within the genome of Cladonia rangiferina: 22 Type I PKS, one Type III PKS, three terpene-synthases, and seven NRPS (Additional file S1, Supplementary Materials). However, two of them, region 1.1 (core gene MSTRG.3413) and region 39.1 (core gene MSTRG.8594), were not found in the transcriptome of C. rangiferina (neither mono-culture, co-culture, or the wild type), and one, region 54.1 (core gene MSTRG.7390), was not expressed in co-culture (while both mono-cultures and the natural lichen thallus showed some level of expression). All three belong to the T1PKS family. The reason for the lack of their expression could be investigated in future research, but in the present study, they had to be excluded from further analysis.
Figure 4a shows the expression of the core biosynthetic genes in the remaining 30 BGCs for all three conditions: mono-culture, co-culture and natural lichen thallus of C. rangiferina.
Although the high probability threshold excludes some genes from the list of DEGs, the log2-ratio of the two conditions was used as an indicator of the direction of expression (up- or down-regulated) (Figure 4a,c). Results clearly indicate that events of lichenization required down-regulation of a number of biosynthetic genes, whether strict DEG selection was applied (Figure 4d, FA) or not (Figure 4c, FA), while the survival of a monoculture in the optimal medium (Fopt) or the functioning of the natural thallus (NT) both required higher expression levels of biosynthetic genes.
The difference was found to be even more prominent after further separation of biosynthetic genes into two groups, those with the same direction of expression regulation (up or down) across all three conditions (co-culture, monoculture in optimal medium, and the natural lichen thallus) and those that demonstrate some difference in regulation. The first group was an unlikely candidate for the genes affecting lichenization processes (due to the similar expression pattern in the monoculture). Thus, regions 3.1, 6.1, 15.1b, 17.1, 29.1, 33.1, 38.1, 47.1, 54.1a were excluded from further investigation (along with regions 1.3, 1.3a, 1.4, 2.1, 10.2, 13.1, 13.1a, 24.1 and 34.1a, that, with relaxed rules for DEG selection, showed the same tendency in expression across different conditions).
The exclusion of these regions left only 21 regions as potential candidates with 10 of them being differentially expressed and mostly down-regulated in the co-culture (Figure 5b).
One exception (region 1.2) was found to be highly upregulated in both mono- and co-culture (Fopt and FA), while down-regulated in the natural lichen thallus (NT). This may indicate that the secondary metabolite gene is responsible for fungal metabolism, rather than lichenization processes and could be excluded from further investigation.
The cluster analysis (Figure 5) of nine remaining BGCs separated them into two distinct groups: strongly expressed (or repressed) regions 9.1, 14.1, 15.1a (with the less prominent 24.1a) and weaker differentially expressed regions 4.1, 3.2, 9.2, 33.2 and 67.1. While all of them are up-regulated in the monoculture and down-regulated in the co-culture, they show different expression patterns in the natural lichen thallus. There can be a number of explanations for the difference. For example, the requirements of establishing algal–fungal interaction in the co-culture could be different from those for sustaining the natural lichen thallus. Alternatively, the re-hydration process could affect the expression profile of the natural lichen thallus. However, at least four regions in the transcriptome of the natural lichen (3.2, 9.2, 24.1a and 33.2) demonstrated an expression pattern similar to the one found in the co-culture.

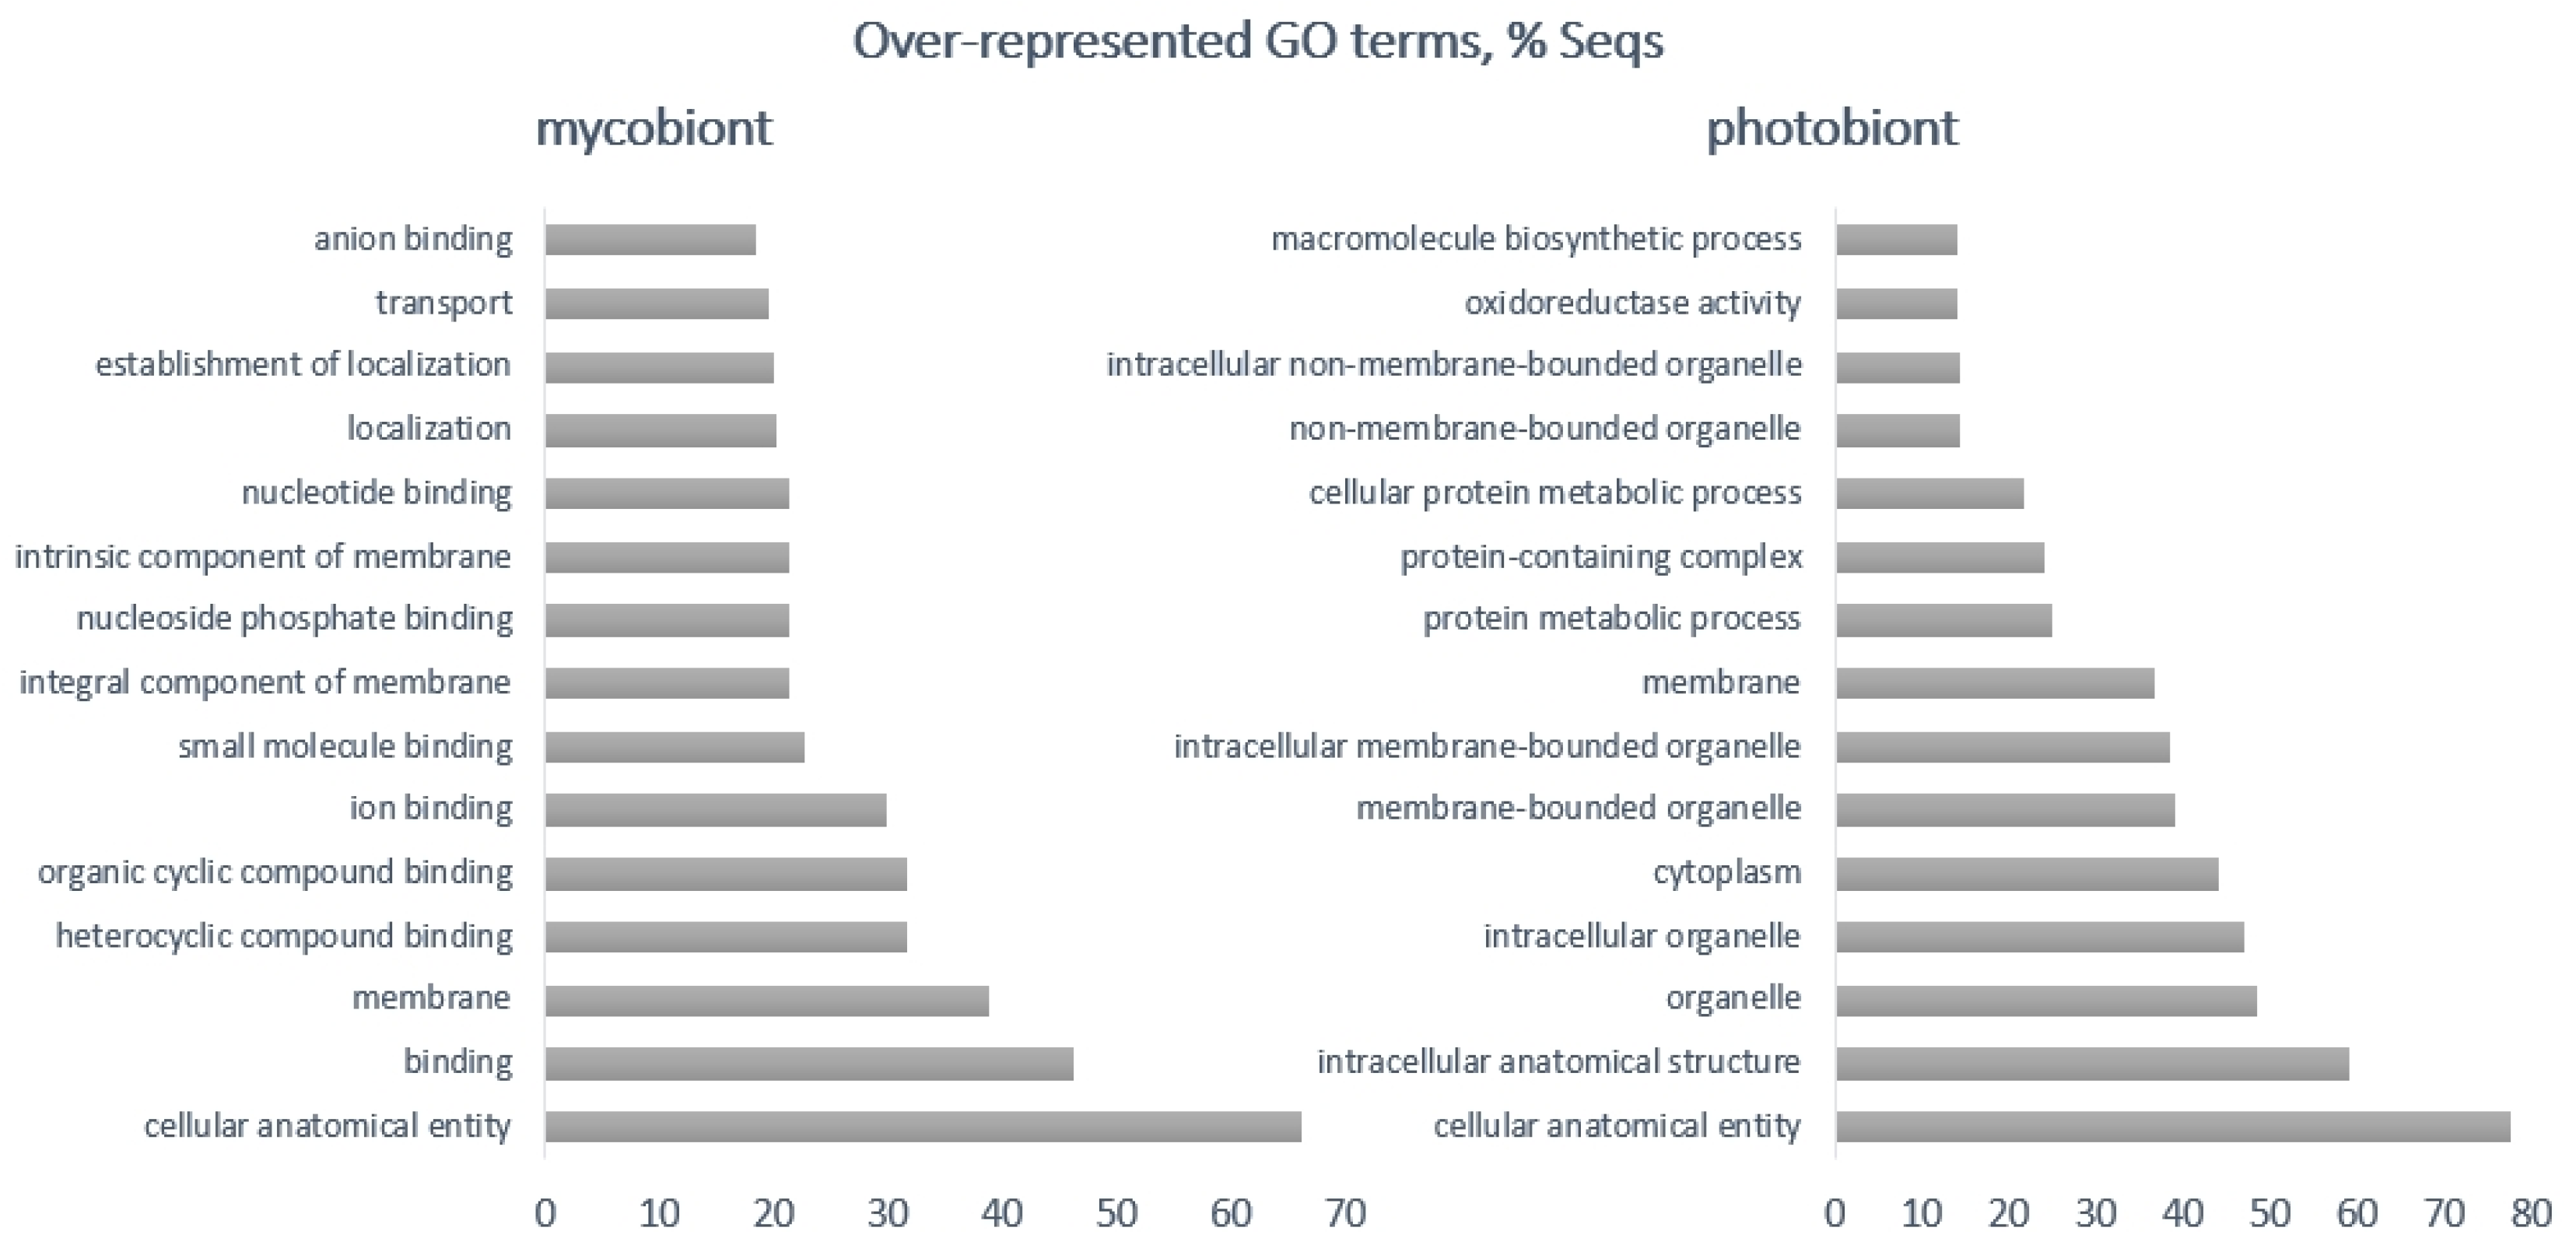
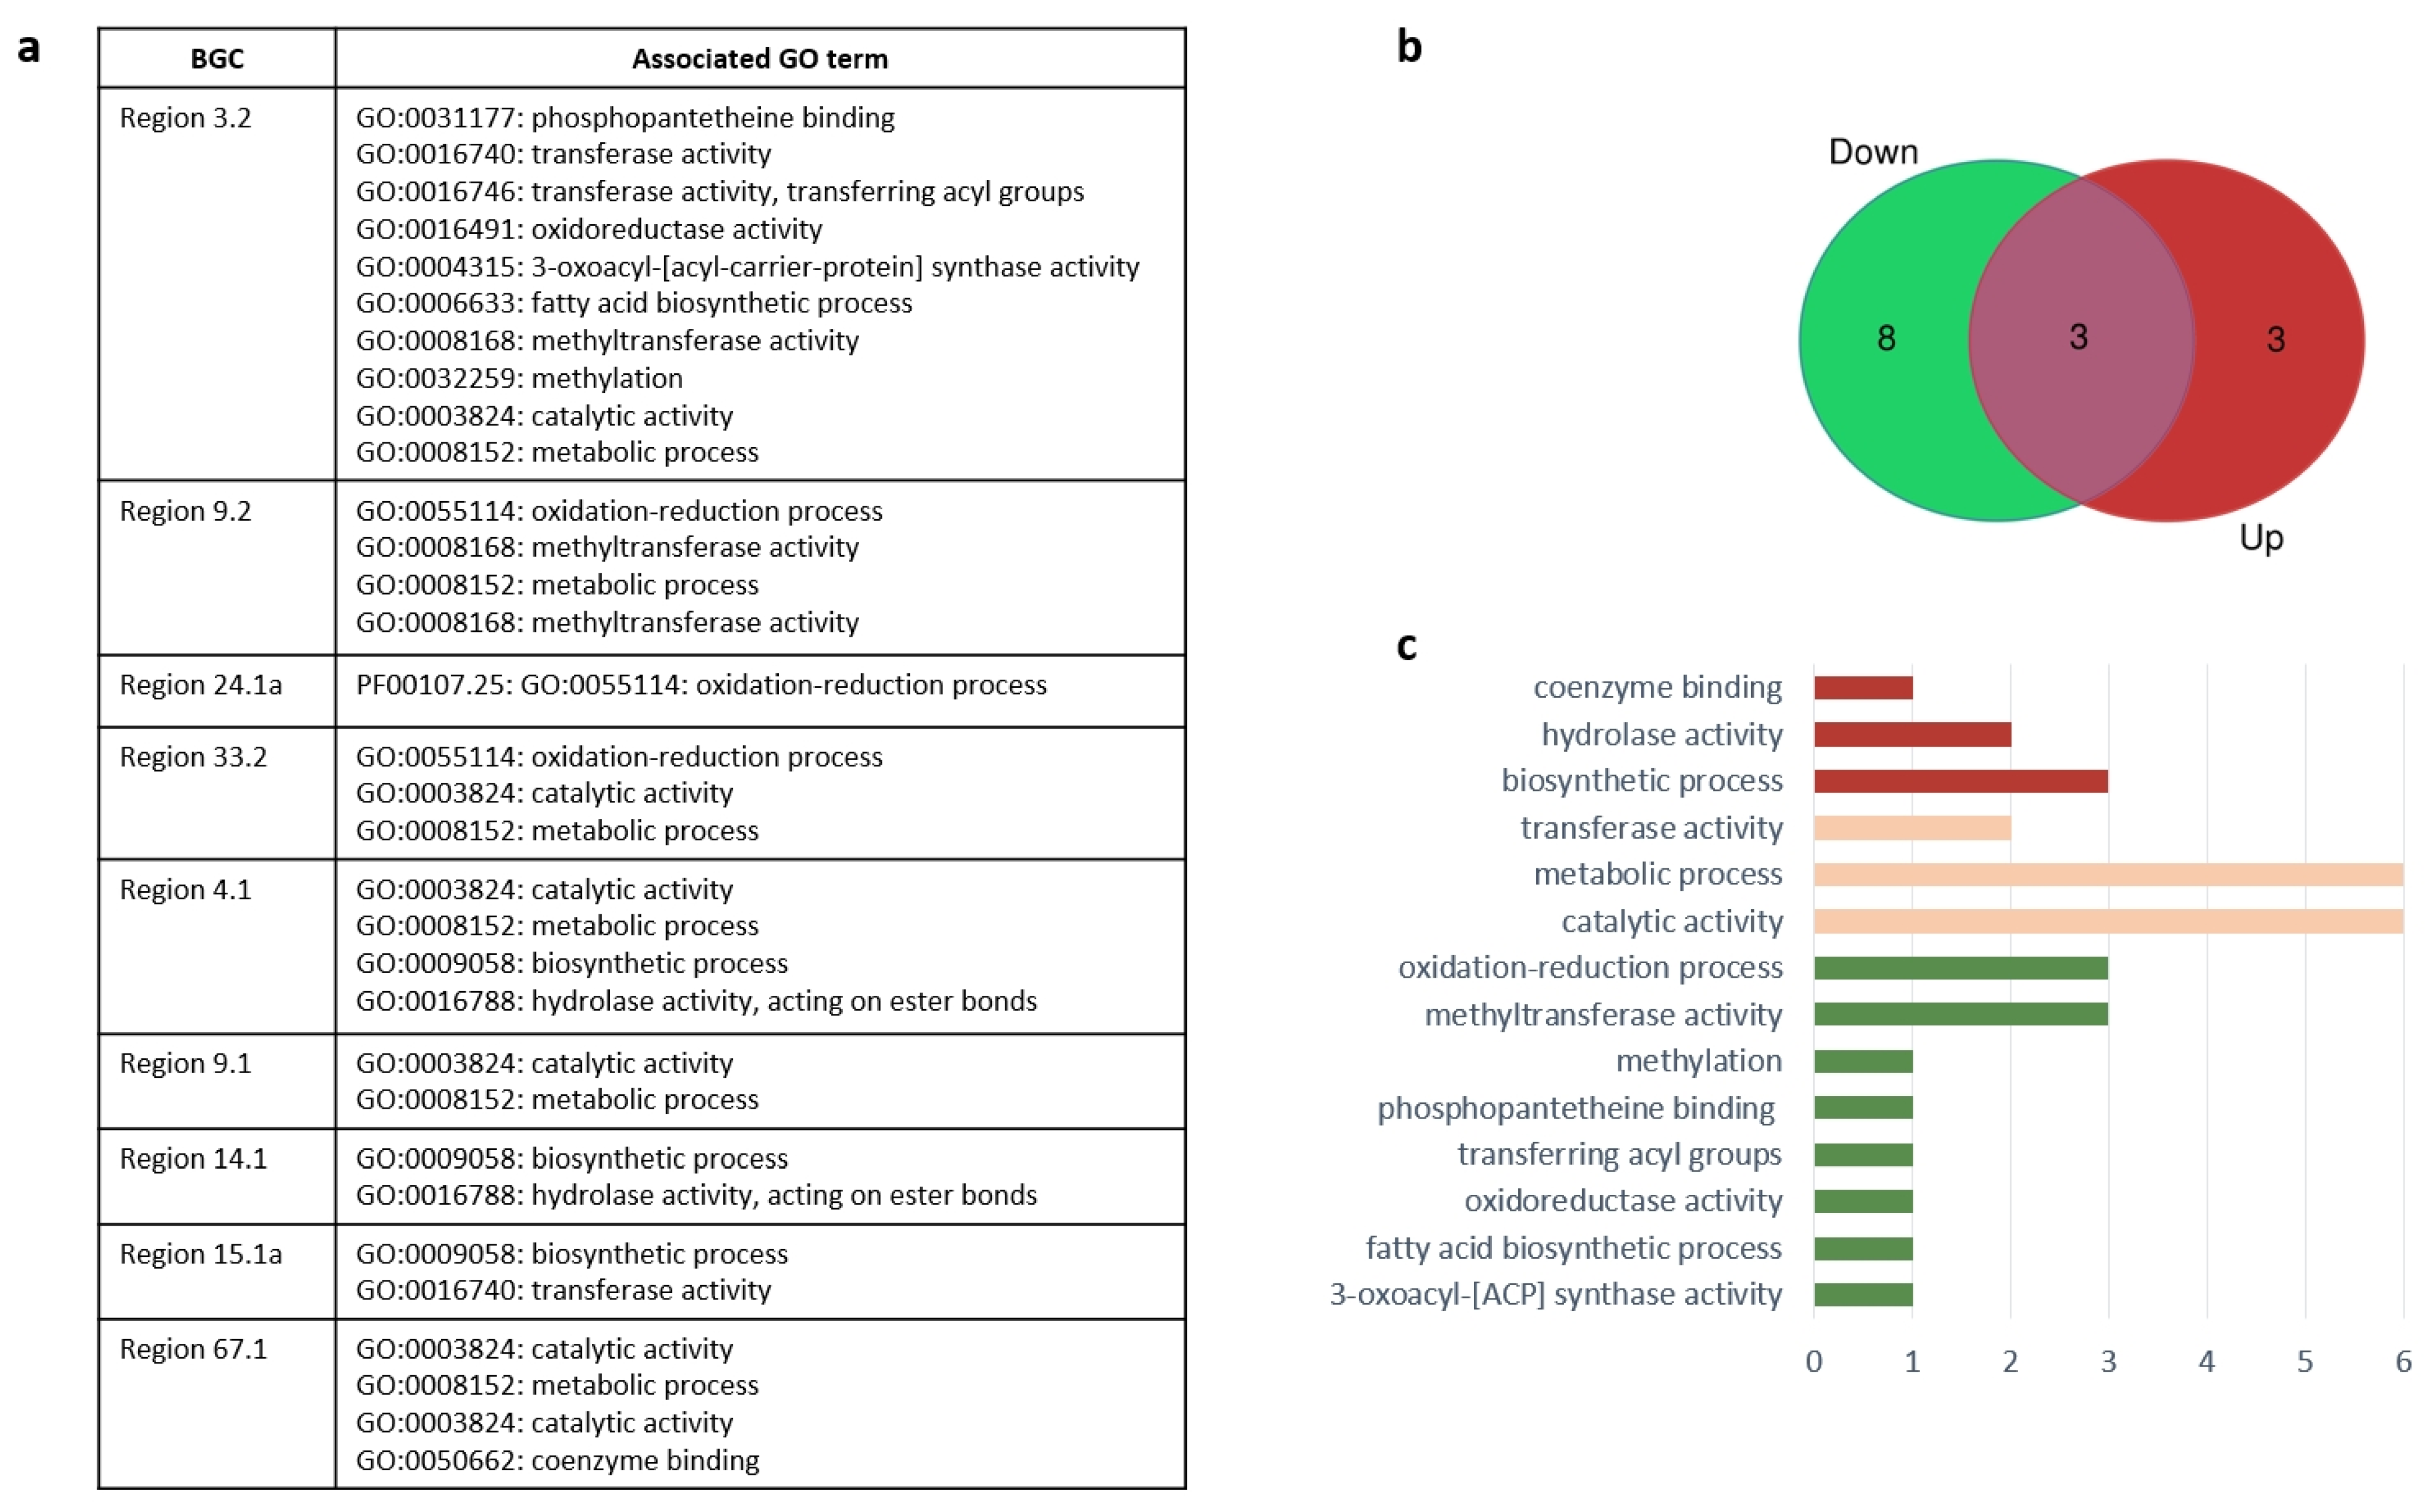
3.3. Functional Analysis of the Selected Core Biosynthetic Genes

Table 2 and Figure 6 provide a summary of the findings for each antiSMASH predicted biosynthetic genes in the C. rangiferina genome potentially affected by lichenization. To our knowledge, none of them have been described for C. rangiferina, and except for general class prediction, little is known about most of them. Therefore, for a meaningful characterisation the most similar proteins identified among the top BLAST search results were used for comparison.
The analysed genes in biosynthetic clusters can be separated into two groups: those in which expression is up-regulated in the natural lichen thallus (NT), similar to mono-culture grown on an optimal substrate (Fopt), and those that are down-regulated in the natural lichen thallus, similar to the co-culture (FA). Analysis of GO terms associated with the genes (Figure 6) revealed that the GO terms were not unique to each group (Figure 6b), supporting the previous observations of existing overlap in function of fungal gene clusters [60,61].
Only two out of nine genes could be annotated with the Kyoto Encyclopedia of Genes and Genomes (KEGG) and assigned a functional metabolic pathway to the predicted gene cluster: region 9.2 (down-regulated) and region 14.1 (up-regulated). Both of them were found in a specialised fatty acid biosynthesis pathway, while region 9.2 alone was also found in general metabolic pathways like biotin metabolism, thiamine metabolism and purine metabolism. Since secondary metabolite pathways also include genes encoding tailoring enzymes, transcription factors, and transporters, similar to those in general metabolic pathways [62], the two regions above could conceivably be part of secondary metabolite pathways.
The group of five secondary metabolite gene clusters whose up-regulation was observed both in the natural thallus of C. rangiferina and the mycobiont growing on the optimal nutrient-rich medium may be obtained from axenic lichen fungi without lichenization. Their similarity with already established genes makes them promising candidates for the biotechnological industry. Region 15.1a is recognised as a putative squalene/phytoene synthase (Cladonia uncialis), and triterpene squalene is known as a natural compound with a number of uses in pharmaceutical, nutraceutical, and personal care industries [63]. Region 14.1 is putatively a type I PKS (Cladonia uncialis), and shows similarity with conidial yellow pigment biosynthesis polyketide synthase (Xylona heveae), which is a secondary metabolite affecting conidiation, cell wall integrity, and stress tolerance of fungal cells [64]. Regions 9.1 and 4.1 are recognised as acetyl-CoA synthetase-like proteins (Phialocephala scopiformis and Rhizodiscina lignyota respectively), which form part of numerous primary and secondary metabolic pathways, participating in the formation and regulation of natural products like nonribosomal peptides, polyketides, phenylpropanoids, lipopeptides, and terpenes [65,66]. In addition, there is a similarity between region 4.1 and microperfuranone synthase (Colletotrichum orbiculare) producing furanone derivative compounds, which are quorum-sensing inhibitors with potential as novel therapeutics [67,68]. Lastly, region 67.1 is a hybrid PKS-NRPS enzyme that shows similarity with beta-ketoacyl synthase (Macrophomina phaseolina), an enzyme involved in fatty acid synthesis by processing malonyl-CoA as a carbon source. However, the sequence of the region also resembles some synthases directly producing secondary metabolites like lovastatin nonaketide synthase (Arthroderma uncinatum) or gramicidin synthase (Cucurbitaria berberidis), that are of interest in the pharmaceutical industry [69,70].
The role that these genes and their products play in the metabolism of the natural lichen thallus of C. rangiferina remains to be discovered. However, the fact that they are downregulated in the co-culture might suggest a negative influence on cell recognition and interaction processes. There is also a possibility that the production of secondary metabolites from those genes is highly resource demanding and requires a stable influx of carbohydrates, which cannot be provided at the early stages of interactions between the fungus and alga before the thallus is formed.

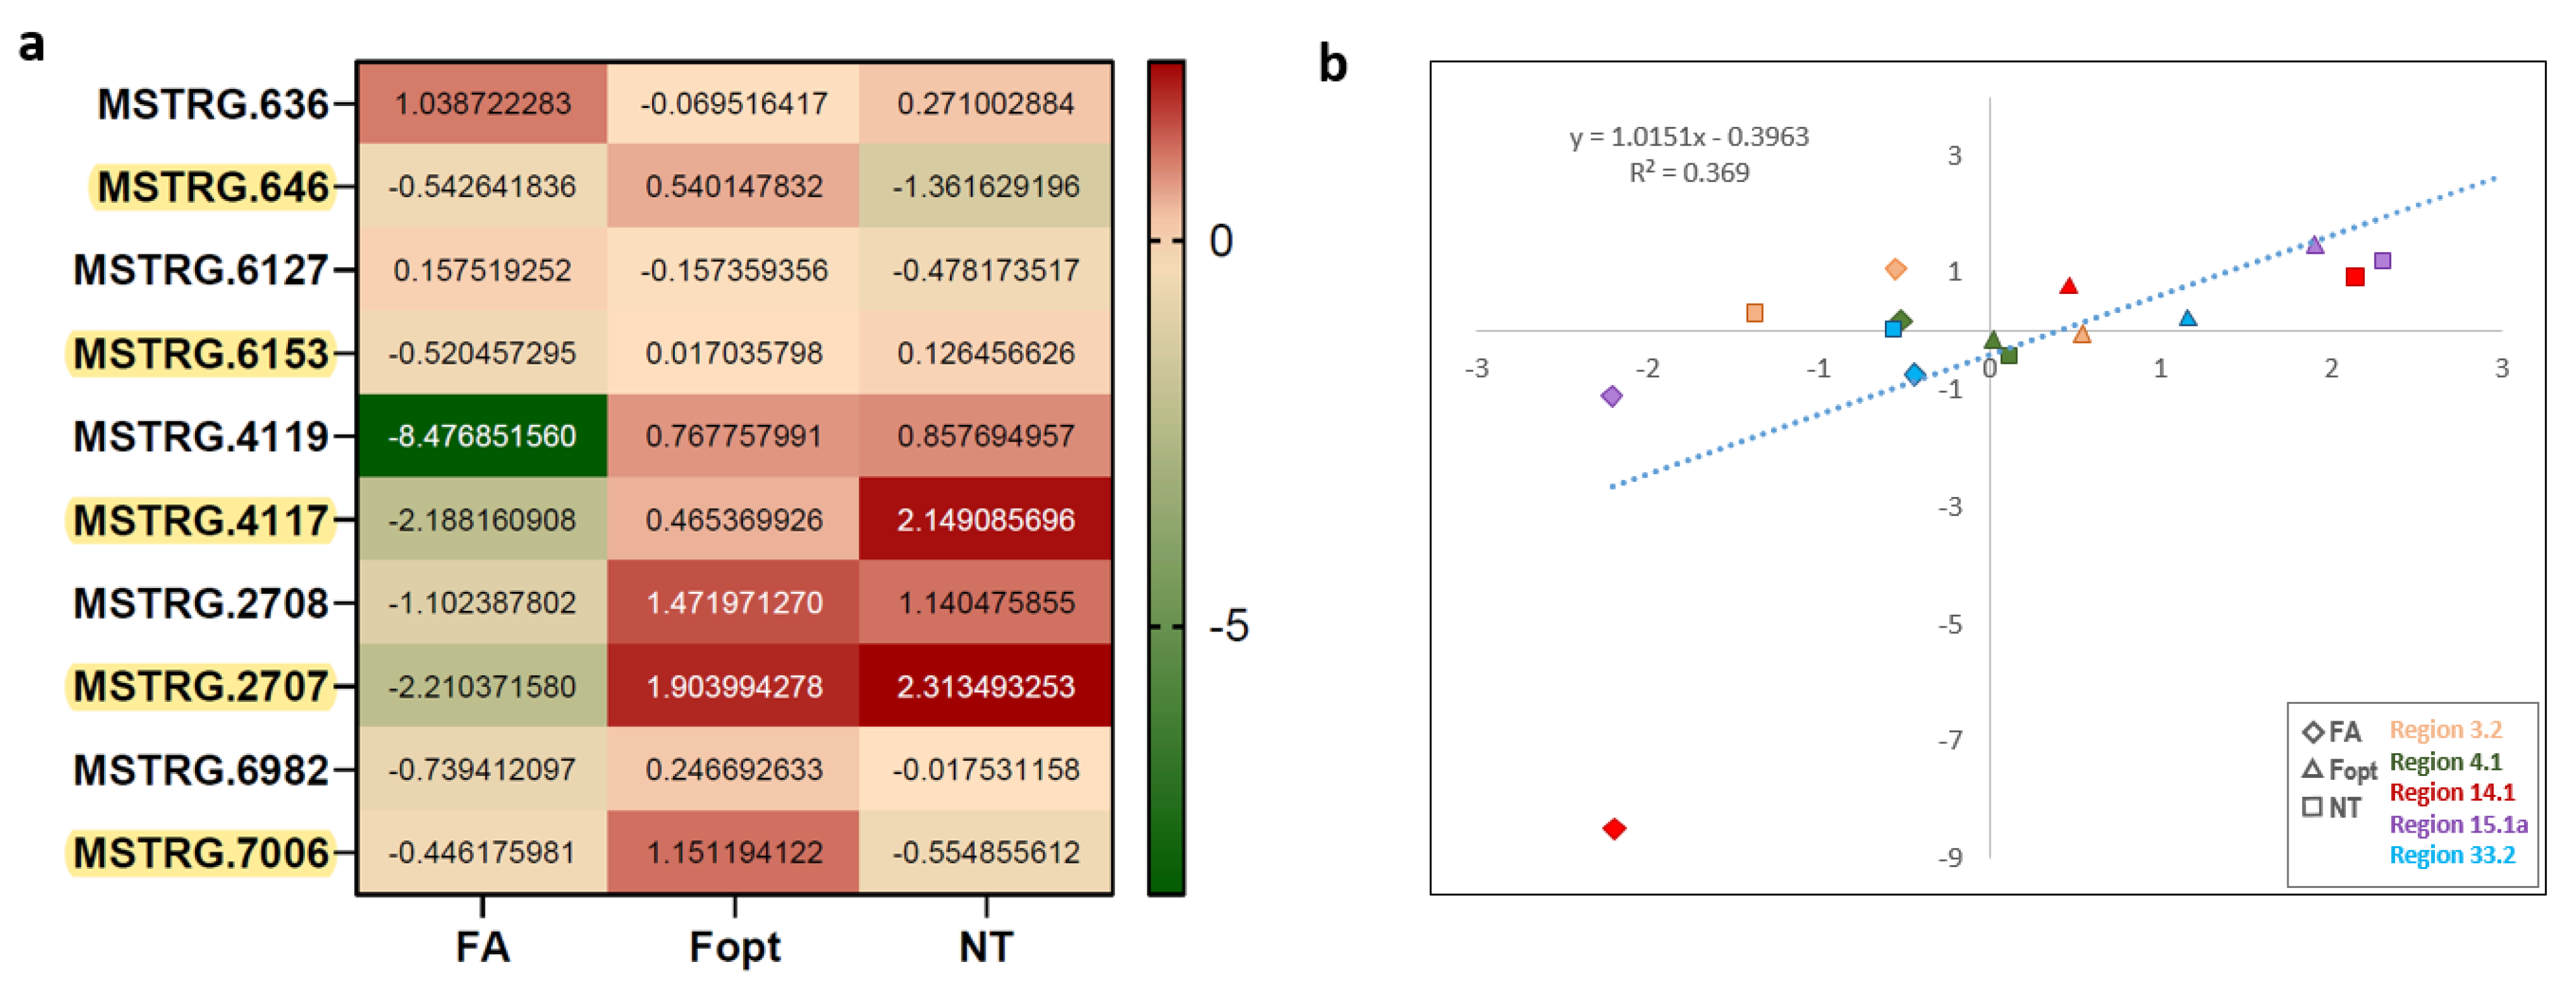
3.4. Expression of Neighbouring Genes in Biosynthetic Gene Clusters

Several categories of neighbouring genes for the predicted BGC were identified by antiSMASH in accordance with smCOG annotation (clusters of orthologous groups, [71]). These include additional biosynthetic genes, transport-related genes, regulatory genes, and “other genes” which are not known to be directly involved in secondary metabolite production. The genes from each group were found upstream and downstream of the core of each predicted BGC thought to be affected by events of lichenization. However, only five genes in all nine clusters demonstrated the expected expression pattern that correlated (positively or negatively) with the expression of the cluster’s core. Table 3 shows the list of these genes and their predicted function, while Figure 7 shows the correlation between the expression of predicted cores and corresponding additional proteins. For most of the pairs, the correlation is positive, and a few exceptions (like regions 3.2 or 4.1) could be condition-dependent.
As with the core clusters, none of these proteins in Table 3 were previously characterised for C. rangiferina. Therefore, their function was deduced by domain characteristics and similarity with proteins from non-lichenized fungi. Three of those regions (regions 3.2, 14.1, 33.2) were recognised as additional biosynthetic genes, and two regions (4.1 and 15.1) were similar to “other genes”, two hydrolases, one SDR protein, a synthetase, and a helicase.
The expression of hydrolases could be expected during lichenization processes for the establishment of the symbiotic interface [56]. The alpha/beta hydrolase from region 3.2 shows high similarity with epoxide hydrolase from Glonium stellatum and is up-regulated in both the co-culture and the natural lichen thallus (negatively correlating with expression of the core genes of the cluster). The second hydrolase (region 33.2), also belonging to the alpha/beta hydrolases family, is down-regulated (similar expression pattern as the cluster core). This region 33.2 shows similarity with thioesterase (found in Trichophyton interdigitale), which is an enzyme catalyzing the production of fatty acids and CoA, and thus could be involved in the production of a secondary metabolite. Considering the fact that similar genes are predicted to be part of the PKS and NRPS clusters in different fungi, they may represent NRPS-PKS hybrids of C. rangiferina.
Another predicted protein was found to be short-chain dehydrogenases/reductases in the region 14.1 (Table 3). The short-chain dehydrogenases/reductases (SDR) constitute one of the largest enzyme superfamilies involved in the metabolism of a large variety of compounds and contribute to essential functions of every known organism [72]. The fact that the expression of SDR in the cluster 14.1 positively correlates with the expression of corresponding core gene might indicate its involvement in the production of a secondary metabolite.
Finally, both predicted proteins found in regions 4.1 and 15.1 (Table 3) seem to be the unlikely candidates for the signal/regulation genes of biosynthetic gene clusters. The tRNA-synthetases and RNA helicases play important roles in RNA metabolism, often associated with antivirus and stress responses [73,74,75]. As stress response is also considered as the major function of the secondary metabolite, that can explain the close proximity of both types of genes on the chromosome.
Without further research, it would be too early to speculate on the relationship between neighbouring proteins and secondary metabolite synthases, and whether they represent a necessary part of the full biosynthetic gene cluster. However, their position and coordinated expression patterns with core enzymes suggest there may be possible relationships.

4. Conclusions

Lichen secondary metabolite production depends on the photobiont partner and is expected to be affected by the processes of lichenization. We analysed the transcriptome of the co-culture of the lichen-forming fungus of Cladonia rangiferina and its photobiont partner—Asterochloris glomerata in comparison with the monoculture(s) and the natural lichen thallus to determine which, if any, of the predicted biosynthetic gene clusters were affected by lichenization. Thirty out of 33 predicted biosynthetic gene clusters within the genome of Cladonia rangiferina were found to be expressed in the mono-culture of the mycobiont as well as in the natural lichen thallus. Nine of them were shown to be actively regulated during the lichenization process that includes core enzymes (five type I polyketide synthases, three nonribosomal peptide synthases, and one terpene synthase) and five additional genes potentially involved in lichen secondary metabolite production.
The function of these genes is unknown; however, all nine affected secondary metabolite synthases were found to be down-regulated during the events of lichenization, suggesting possible inhibitory roles in the early stages of lichen formation.
Although the role of the five additional neighbouring genes, with expression patterns that correlate with expression of the core genes in clusters, remains to be discovered, they show similarity with known genes of other fungal species, involved in the production of secondary metabolites. This knowledge can help to determine the function of the biosynthetic gene clusters containing those genes, as well as the role of the core genes of these clusters.
Overall, the study provides a research basis for further investigation of the secondary metabolite biosynthesis of lichens in general and C. rangiferina in particular, as well as the possibility of engineered biosynthesis of secondary metabolites in an artificial host.

Supplementary Materials

The following are available online at https://0-www-mdpi-com.brum.beds.ac.uk/article/10.3390/d13110529/s1, Additional file S1: antiSMASH analysis of the genome of Cladonia rangiferina, Additional file S2: the list of differentially expressed genes (DEGs) with indicated expression level and their sequences, Figure S1: Experimental conditions, changes over time, Figure S2: Heatmap demonstrating transcription levels of the core and neighbouring genes in BGCs for all three conditions: FA, Fopt and NT.

Author Contributions

Conceptualization, N.S. and M.D.P.-N.; methodology, N.S.; validation, N.S. and M.D.P.-N.; formal analysis, N.S.; investigation, N.S.; data curation, N.S.; writing—original draft preparation, N.S.; writing—review and editing, M.D.P.-N.; project administration, M.D.P.-N.; funding acquisition, M.D.P.-N. All authors have read and agreed to the published version of the manuscript.

Funding

National Sciences and Engineering Research Council of Canada (NSERC).

Institutional Review Board Statement

Not applicable.

Data Availability Statement

Geentic sequences of the genes discussed in this paper are available as a supplement to this paper.

Acknowledgments

A National Sciences and Engineering Research Council of Canada (NSERC) grant awarded to MPN is gratefully acknowledged. This research was enabled in part by support provided by ACENET (https://ace-net.ca/) and Compute Canada (https://www.computecanada.ca).

Conflicts of Interest

The authors declare no conflict of interest. The funders had no role in the design of the study; in the collection, analyses, or interpretation of data; in the writing of the manuscript, or in the decision to publish the results.

References

  1. Molnár, K.; Farkas, E. Current results on biological activities of lichen secondary metabolites: A review. Z. Für Nat. C J. Biosci. 2010, 65, 157–173. [Google Scholar] [CrossRef] [PubMed]
  2. Calcott, M.J.; Ackerley, D.F.; Knight, A.; Keyzers, R.A.; Owen, J.G. Secondary metabolism in the lichen symbiosis. Chem. Soc. Rev. 2018, 47, 1730–1760. [Google Scholar] [CrossRef] [PubMed]
  3. Reddy, R.G.; Veeraval, L.; Maitra, S.; Chollet-Krugler, M.; Tomasi, S.; Dévéhat, F.L.; Boustie, J.; Chakravarty, S. Lichen-derived compounds show potential for central nervous system therapeutics. Phytomedicine 2016, 23, 1527–1534. [Google Scholar] [CrossRef] [PubMed]
  4. Nguyen, K.H.; Chollet-Krugler, M.; Gouault, N.; Tomasi, S. UV-protectant metabolites from lichens and their symbiotic partners. Nat. Prod. Rep. 2013, 12, 1490–1508. [Google Scholar] [CrossRef] [PubMed]
  5. Shrestha, G.; Clair, L.L.S. Lichens: A promising source of antibiotic and anticancer drugs. Phytochem. Rev. 2013, 12, 229–244. [Google Scholar] [CrossRef]
  6. Zambare, V.P.; Christopher, L.P. Biopharmaceutical potential of lichens. Pharm. Biol. 2012, 50, 778–798. [Google Scholar] [CrossRef]
  7. Stocker-Wörgötter, E. Metabolic diversity of lichen-forming ascomycetous fungi: Culturing, polyketide and shikimate metabolite production, and PKS genes. Nat. Prod. Rep. 2008, 25, 188–200. [Google Scholar] [CrossRef]
  8. Gao, X.; Chooi, Y.H.; Ames, B.D.; Wang, P.; Walsh, C.T.; Tang, Y. Fungal indole alkaloid biosynthesis: Genetic and biochemical investigation of the tryptoquialanine pathway in Penicillium aethiopicum. J. Am. Chem. Soc. 2011, 133, 2729–2741. [Google Scholar] [CrossRef] [PubMed] [Green Version]
  9. Newman, D.J.; Cragg, G.M. Natural products as sources of new drugs over the 30 years from 1981 to 2010. J. Nat. Prod. 2012, 75, 311–335. [Google Scholar] [CrossRef] [PubMed] [Green Version]
  10. Hittinger, C.T.; Rokas, A.; Carroll, S.B. Parallel inactivation of multiple GAL pathway genes and ecological diversification in yeasts. Proc. Natl. Acad. Sci. USA 2004, 101, 14144–14149. [Google Scholar] [CrossRef] [PubMed] [Green Version]
  11. Schwachtje, J.; Kutschbach, S.; Baldwin, I.T. Reverse genetics in ecological research. PLoS ONE 2008, 3, e1543. [Google Scholar] [CrossRef] [PubMed] [Green Version]
  12. Zhang, H.; Abraham, N.; Khan, L.A.; Gobel, V. RNAi-based biosynthetic pathway screens to identify in vivo functions of non-nucleic acid-based metabolites such as lipids. Nat. Protoc. 2015, 10, 681–700, published correction in Nat. Protoc. 2015, 10, 939. [Google Scholar] [CrossRef] [PubMed] [Green Version]
  13. Krause, D.J.; Kominek, J.; Opulente, D.A.; Shen, X.-X.; Zhou, X.; Langdon, Q.K.; De Virgilio, J.; Hulfachor, A.B.; Kurtzman, C.P.; Rokas, A.; et al. Functional and evolutionary characterization of a secondary metabolite gene cluster in budding yeasts. Proc. Natl. Acad. Sci. USA 2018, 115, 11030–11035. [Google Scholar] [CrossRef] [PubMed] [Green Version]
  14. Ziemert, N.; Alanjary, M.; Weber, T. The evolution of genome mining in microbes—A review. Nat. Prod. Rep. 2016, 33, 988–1005. [Google Scholar] [CrossRef] [PubMed] [Green Version]
  15. Perić-Concha, N.; Long, P.F. Mining the microbial metabolome: A new frontier for natural product lead discovery. Drug Discov. Today 2003, 1, 1078–1084. [Google Scholar] [CrossRef]
  16. Yin, J.; Straight, P.D.; Hrvatin, S.; Dorrestein, P.C.; Bumpus, S.B.; Jao, C.; Kelleher, N.L.; Kolter, R.; Walsh, C.T. Genome-wide high-throughput mining of natural-product biosynthetic gene clusters by phage display. Chem. Biol. 2007, 14, 303–312. [Google Scholar] [CrossRef] [Green Version]
  17. Brakhage, A.A.; Schuemann, J.; Bergmann, S.; Scherlach, K.; Schroeckh, V.; Hertweck, C. Activation of Fungal Silent Gene Clusters: A New Avenue to Drug Discovery. In Natural Compounds as Drugs: Volume II; Petersen, F., Amstutz, R., Eds.; Birkhäuser Basel: Basel, Switzerland, 2008; pp. 1–12. [Google Scholar] [CrossRef]
  18. Staunton, J.; Weissman, K.J. Polyketide biosynthesis: A millennium review. Nat. Prod. Rep. 2001, 18, 380–416. [Google Scholar] [CrossRef] [PubMed]
  19. Keller, N.P. Fungal secondary metabolism: Regulation, function and drug discovery. Nat. Rev. Microbiol. 2019, 17, 167–180. [Google Scholar] [CrossRef]
  20. Mosunova, O.; Navarro-Muñoz, J.C.; Collemare, J. The Biosynthesis of Fungal Secondary Metabolites: From Fundamentals to Biotechnological Applications. Ref. Modul. Life Sci. 2021, 2, 458–476. [Google Scholar] [CrossRef]
  21. Shen, B. Polyketide biosynthesis beyond the type I, II and III polyketide synthase paradigms. Curr. Opin. Chem. Biol. 2003, 7, 285–295. [Google Scholar] [CrossRef]
  22. Muggia, L.; Grube, M. Type III polyketide synthases in lichen mycobionts. Fungal. Biol. 2010, 114, 379–385. [Google Scholar] [CrossRef] [PubMed]
  23. Kjaerbolling, I.; Mortensen, U.H.; Vesth, T.; Andersen, M.R. Strategies to establish the link between biosynthetic gene clusters and secondary metabolites. Fungal. Genet. Biol. 2019, 130, 107–121. [Google Scholar] [CrossRef]
  24. Weissman, K.J. Uncovering the structures of modular polyketide synthases. Nat. Prod. Rep. 2015, 32, 436–453. [Google Scholar] [CrossRef] [PubMed]
  25. Elix, J.; Stocker-Wörgötter, E. Biochemistry and Secondary Metabolites. In Lichen Biology; Nash, T., III, Ed.; Cambridge University Press: Cambridge, UK, 2008; pp. 104–133. [Google Scholar] [CrossRef]
  26. Mosbach, K. Biosynthesis of lichen substances, products of a symbiotic association. Angew. Chem. Int. Ed. Engl. 1969, 8, 240–250. [Google Scholar] [CrossRef]
  27. Almendras, K.; García, J.; Carú, M.; Orlando, J. Nitrogen-Fixing Bacteria Associated with Peltigera Cyanolichens and Cladonia Chlorolichens. Molecules 2018, 23, 3077. [Google Scholar] [CrossRef] [Green Version]
  28. Bharudin, I.; Abdul Rahim, S.N.; Abu Bakar, M.F.; Ibrahim, S.N.; Kamaruddin, S.; Latif, M.T.; Samsudin, M.W.; Abdul Murad, A.M.; Abu Bakar, F.D. De novo transcriptome resources of the lichens, Dirinaria sp. UKM-J1 and UKM-K1 collected from Jerantut and Klang, Malaysia. Data Brief 2018, 19, 2416–2419. [Google Scholar] [CrossRef] [PubMed]
  29. Elshobary, M.E.; Osman, M.E.; Abo-Shady, A.M.; Komatsu, E.; Perreault, H.; Sorensen, J.; Piercey-Normore, M.D. Algal carbohydrates affect polyketide synthesis of the lichen-forming fungus Cladonia rangiferina. Mycologia 2016, 108, 646–656. [Google Scholar] [CrossRef] [Green Version]
  30. Athukorala, S.N.; Huebner, E.; Piercey-Normore, M.D. Identification and comparison of the 3 early stages of resynthesis for the lichen Cladonia rangiferina. Can. J. Microbiol. 2014, 60, 41–52. [Google Scholar] [CrossRef] [PubMed]
  31. Blin, K.; Shaw, S.; Steinke, K.; Villebro, R.; Ziemert, N.; Lee, S.Y.; Medema, M.H.; Weber, T. antiSMASH 5.0: Updates to the secondary metabolite genome mining pipeline. Nucleic Acids Res. 2019, 47, 81–87. [Google Scholar] [CrossRef] [Green Version]
  32. Deason, T.R.; Bold, H.C. Phycological Studies. I. Exploratory Studies of Texas Soil Algae; University of Texas Publication: Austin, TX, USA, 1960. [Google Scholar]
  33. Bischoff, H.W.; Bold, H.C. Some Soil Algae from Enchanted Rock and Related Algal Species. Phycological Studies IV; University of Texas Publication: Austin, TX, USA, 1963; Volume 6318, p. 95. [Google Scholar]
  34. Piercey-Normore, M.D.; Depriest, P.T. Algal switching among lichen symbioses. Am. J. Bot. 2001, 88, 1490–1498. [Google Scholar] [CrossRef] [PubMed]
  35. White, T.J.; Bruns, T.D.; Lee, S.; Taylor, J.W. Amplification and direct sequencing of fungal ribosomal RNA genes for phylogenetics. In Gelfand MAIDH, PCR Protocols: A Guide to Methods and Applications; Sninsky, J.J., White, T.J., Eds.; Academic Press: New York, NY, USA, 1990; pp. 315–322. [Google Scholar]
  36. Joneson, S.; Armaleo, D.; Lutzoni, F. Fungal and algal gene expression in early developmental stages of lichen-symbiosis. Mycologia 2011, 103, 291–306. [Google Scholar] [CrossRef] [PubMed] [Green Version]
  37. Doering, J.A.; Miao, V.P.; Piercey-Normore, M.D. Rehydration conditions for isolation of high quality RNA from the lichen Lobaria pulmonaria. BMC Res. Notes 2014, 7, 442. [Google Scholar] [CrossRef] [Green Version]
  38. Kim, D.; Paggi, J.M.; Park, C.; Bennett, C.; Salzberg, S.L. Graph-based genome alignment and genotyping with HISAT2 and HISAT-genotype. Nat. Biotechnol. 2019, 37, 907–915. [Google Scholar] [CrossRef]
  39. Majoros, W.H.; Pertea, M.; Salzberg, S.L. TigrScan and GlimmerHMM: Two open source ab initio eukaryotic gene-finders. Bioinformatics 2004, 20, 2878–2879. [Google Scholar] [CrossRef] [PubMed]
  40. Salzberg, S.L.; Pertea, M.; Delcher, A.L.; Gardner, M.J.; Tettelin, H. Interpolated Markov models for eukaryotic gene finding. Genomics 1999, 59, 24–31. [Google Scholar] [CrossRef] [PubMed] [Green Version]
  41. Armaleo, D.; Müller, O.; Lutzoni, F.; Andrésson, Ó.S.; Blanc, G.; Bode, H.B.; Collart, F.R.; Dal Grande, F.; Dietrich, F.; Grigoriev, I.V.; et al. The lichen symbiosis re-viewed through the genomes of Cladonia grayi and its algal partner Asterochloris glomerata. BMC Genom. 2019, 20, 605. [Google Scholar] [CrossRef] [PubMed] [Green Version]
  42. Dainat, J. AGAT: Another Gff Analysis Toolkit to handle annotations in any GTF/GFF format. (Version v.0.5.1). Zenodo 2020. [Google Scholar] [CrossRef]
  43. Quinlan, A.R.; Hall, I.M. BEDTools: A flexible suite of utilities for comparing genomic features. Bioinformatics 2010, 26, 841–842. [Google Scholar] [CrossRef] [PubMed] [Green Version]
  44. Kovaka, S.; Zimin, A.V.; Pertea, G.M.; Razaghi, R.; Salzberg, S.L.; Pertea, M. Transcriptome assembly from long-read RNA-seq alignments with StringTie2. Genome Biol. 2019, 20, 278. [Google Scholar] [CrossRef] [Green Version]
  45. Chen, Y.; Lun, A.T.L.; McCarthy, D.J.; Ritchie, M.E.; Phipson, B.; Hu, Y.-F.; Zhou, X.; Robinson, M.D.; Smyth, G.K. Empirical Analysis of Digital Gene Expression Data in R. 2020. Available online: https://bioconductor.org/packages/release/bioc/html/edgeR.html (accessed on 1 March 2021).
  46. Haley, L.D.; Callaway, C.S. Laboratory Methods in Medical Mycology, 4th ed.; U.S. Dept. of Health, Education and Welfare, Center for Disease Control.: Atlanta, GA, USA, 1978. [Google Scholar]
  47. Kendziorski, C.; Irizarry, R.A.; Chen, K.S.; Haag, J.D.; Gould, M.N. On the utility of pooling biological samples in microarray experiments. Proc. Natl. Acad. Sci. USA 2005, 102, 4252–4257. [Google Scholar] [CrossRef] [Green Version]
  48. Zhang, S.D.; Gant, T.W. Effect of pooling samples on the efficiency of comparative studies using microarrays. Bioinformatics 2005, 21, 4378–4383. [Google Scholar] [CrossRef] [PubMed] [Green Version]
  49. Biswas, S.; Agrawal, Y.N.; Mucyn, T.S.; Dangl, J.L.; Jones, C.D. Biological Averaging in RNA-Seq. arXiv 2013, arXiv:1309.0670. [Google Scholar]
  50. Assefa, A.T.; Vandesompele, J.; Thas, O. On the utility of RNA sample pooling to optimize cost and statistical power in RNA sequencing experiments. BMC Genom. 2020, 21, 312. [Google Scholar] [CrossRef] [PubMed]
  51. Tarazona, S.; García-Alcalde, F.; Dopazo, J.; Ferrer, A.; Conesa, A. Differential expression in RNA-seq: A matter of depth. Genome Res. 2011, 21, 2213–2223. [Google Scholar] [CrossRef] [Green Version]
  52. Tarazona, S.; Furió-Tarí, P.; Turrà, D.; Pietro, A.D.; Nueda, M.J.; Ferrer, A.; Conesa, A. Data quality aware analysis of differential expression in RNA-seq with NOISeq R/Bioc package. Nucleic Acids Res. 2015, 43, 140. [Google Scholar] [CrossRef] [PubMed] [Green Version]
  53. Junttila, S.; Rudd, S. Characterization of a transcriptome from a non-model organism, Cladonia rangiferina, the grey reindeer lichen, using high-throughput next generation sequencing and EST sequence data. BMC Genom. 2012, 13, 575. [Google Scholar] [CrossRef] [PubMed] [Green Version]
  54. Junttila, S.; Rudd, S. De novo assembly and annotation of the grey reindeer lichen (Cladonia rangiferina) transcriptome. EMBnet. journal 2013, 19, 51–52. [Google Scholar] [CrossRef] [Green Version]
  55. Wang, Y.; Zhang, X.; Zhou, Q.; Zhang, X.; Wei, J. Comparative transcriptome analysis of the lichen-forming fungus Endocarpon pusillum elucidates its drought adaptation mechanisms. Sci. China Life Sci. 2015, 58, 89–100. [Google Scholar] [CrossRef] [PubMed] [Green Version]
  56. Kono, M.; Kon, Y.; Ohmura, Y.; Satta, Y.; Terai, Y. In vitro resynthesis of lichenization reveals the genetic background of symbiosis-specific fungal-algal interaction in Usnea hakonensis. BMC Genom. 2020, 21, 671. [Google Scholar] [CrossRef]
  57. Asemoloye, M.D.; Marchisio, M.A.; Gupta, V.K.; Pecoraro, L. Genome-based engineering of ligninolytic enzymes in fungi. Microb. Cell Factories 2021, 20, 20. [Google Scholar] [CrossRef] [PubMed]
  58. Hussain, R.; Ahmed, M.; Khan, T.A.; Akhter, Y. Fungal P450 monooxygenases—The diversity in catalysis and their promising roles in biocontrol activity. Appl. Microbiol. Biotechnol. 2020, 104, 989–999. [Google Scholar] [CrossRef] [PubMed]
  59. Abdel-Hameed, M.; Bertrand, R.L.; Piercey-Normore, M.D.; Sorensen, J.L. Putative identification of the usnic acid biosynthetic gene cluster by de novo whole-genome sequencing of a lichen-forming fungus. Fungal. Biol. 2016, 120, 306–316. [Google Scholar] [CrossRef] [PubMed]
  60. Wisecaver, J.H.; Slot, J.C.; Rokas, A. The Evolution of Fungal Metabolic Pathways. PLoS Genet. 2014, 10, e1004816. [Google Scholar] [CrossRef] [Green Version]
  61. Greene, G.H.; McGary, K.L.; Rokas, A.; Slot, J.C. Ecology drives the distribution of specialized tyrosine metabolism modules in fungi. Genome Biol. Evol. 2014, 6, 121–132. [Google Scholar] [CrossRef] [PubMed] [Green Version]
  62. Keller, N.P.; Hohn, T.M. Metabolic Pathway Gene Clusters in Filamentous Fungi. Fungal Genet. Biol. 1997, 21, 17–29. [Google Scholar] [CrossRef] [PubMed] [Green Version]
  63. Gohil, N.; Bhattacharjee, G.; Khambhati, K.; Braddick, D.; Singh, V. Engineering Strategies in Microorganisms for the Enhanced Production of Squalene: Advances, Challenges and Opportunities. Front. Bioeng. Biotechnol. 2019, 7, 50. [Google Scholar] [CrossRef] [PubMed]
  64. Zhang, W.; An, N.; Guo, J.; Wang, Z.; Meng, X.; Liu, W. Influences of genetically perturbing synthesis of the typical yellow pigment on conidiation, cell wall integrity, stress tolerance, and cellulase production in Trichoderma reesei. J. Microbiol. 2021, 59, 426–434. [Google Scholar] [CrossRef] [PubMed]
  65. D’Ambrosio, H.K.; Derbyshire, E.R. Investigating the Role of Class I Adenylate-Forming Enzymes in Natural Product Biosynthesis. ACS Chem. Biol. 2020, 15, 17–27. [Google Scholar] [CrossRef] [PubMed]
  66. Lu, Z.; Peng, B.; Ebert, B.E.; Dumsday, G.; Vickers, C.E. Auxin-mediated protein depletion for metabolic engineering in terpene-producing yeast. Nat. Commun. 2021, 12, 1051. [Google Scholar] [CrossRef]
  67. Yeh, H.H.; Chiang, Y.M.; Entwistle, R.; Ahuja, M.; Lee, K.H.; Bruno, K.S.; Wu, T.K.; Oakley, B.R.; Wang, C.C. Molecular genetic analysis reveals that a nonribosomal peptide synthetase-like (NRPS-like) gene in Aspergillus nidulans is responsible for microperfuranone biosynthesis. Appl. Microbiol. Biotechnol. 2012, 96, 739–748. [Google Scholar] [CrossRef] [PubMed] [Green Version]
  68. Proctor, C.R.; McCarron, P.A.; Ternan, N.G. Furanone quorum-sensing inhibitors with potential as novel therapeutics against Pseudomonas aeruginosa. J. Med. Microbiol. 2020, 69, 195–206. [Google Scholar] [CrossRef] [PubMed]
  69. Neto, R.N.M.; de Barros Gomes, E.; Weba-Soares, L.; Dias, L.R.L.; da Silva, L.C.N.; de Miranda, R.C.M. Biotechnological Production of Statins: Metabolic Aspects and Genetic Approaches. Curr. Pharm. Biotechnol. 2019, 20, 1244–1259. [Google Scholar] [CrossRef] [PubMed]
  70. Lang, C.; Staiger, C. Tyrothricin—An underrated agent for the treatment of bacterial skin infections and superficial wounds? Pharmazie 2016, 71, 299–305. [Google Scholar] [PubMed]
  71. Tatusov, R.L.; Galperin, M.Y.; Natale, D.A.; Koonin, E.V. The COG database: A tool for genome-scale analysis of protein functions and evolution. Nucleic Acids Res. 2000, 28, 33–36. [Google Scholar] [CrossRef] [PubMed] [Green Version]
  72. Persson, B.; Kallberg, Y.; Bray, J.E.; Bruford, E.; Dellaporta, S.L.; Favia, A.D.; Duarte, R.G.; Jörnvall, H.; Kavanagh, K.L.; Kedishvili, N.; et al. The SDR (short-chain dehydrogenase/reductase and related enzymes) nomenclature initiative. Chem. Biol. Interact. 2009, 178, 94–98. [Google Scholar] [CrossRef] [PubMed] [Green Version]
  73. Ibba, M.; Soll, D. Aminoacyl-tRNA synthesis. Annu. Rev. Biochem. 2000, 69, 617–650. [Google Scholar] [CrossRef] [PubMed]
  74. Ji, Q.Q.; Fang, Z.P.; Ye, Q.; Chi, C.W.; Wang, E.D. Self-protective responses to norvaline-induced stress in a leucyl-tRNA synthetase editing-deficient yeast strain. Nucleic Acids Res. 2017, 45, 7367–7381. [Google Scholar] [CrossRef] [PubMed] [Green Version]
  75. Meier-Stephenson, V.; Mrozowich, T.; Pham, M.; Patel, T.R. DEAD-box helicases: The Yin and Yang roles in viral infections. Biotechnol. Genet. Eng. Rev. 2018, 34, 3–32. [Google Scholar] [CrossRef] [PubMed]
Figure 1. Co-inoculation and resynthesis. (a) Cladonia rangiferina in its natural habitat (bottom), the natural thallus (NT) of C. rangiferina (top). (b) Two axenic cultures from a lab culture collection, Cladonia rangiferina and Asterochloris glomerata (left), filters showing culture/conditions (right): non-symbiotic fungus C. rangiferina growing on the diluted nutrient-poor medium (Fdl) and the optimal nutrient-rich malt yeast extract (Fopt); a co-culture of C. rangiferina fungus mixed with alga A. glomerata growing on the diluted medium (FA); the non-symbiotic alga (A). Photo credits: N. Sveshnicova, D. Gunawardana, M. Piercey-Normore.
Diversity 13 00529 g001
Figure 2. Gene expression analysis. (a,c) Number of differentially expressed genes at a false discovery rate (FDR) < 0.05 in (a) fungal and algal co-culture (FA), fungal monoculture on optimal medium (Fopt), and natural thallus (NT) (all three conditions were compared to the fungal monoculture on diluted medium) or (b) in fungal and algal co-culture (FA), and natural thallus (NT) (both conditions were compared to the algal monoculture); (c,d) unsupervised hierarchical clustering showing heat maps for the top 50 (out of 3500–4500) differentially expressed genes, for all four conditions for the fungi (c), and all three conditions for alga (d) calculated for monoculture/co-culture pairs (Fdl/FA and A/FA respectively).
Diversity 13 00529 g002
Figure 3. Fisher’s exact test of the differentially expressed genes showing fifteen most over-represented GO terms in co-culture for mycobiont and photobiont.
Diversity 13 00529 g003
Figure 4. Expression of the core biosynthetic genes in predicted BGCs. (a) Non-clustered heatmap showing the unfiltered expression data for all expressed regions (log2-ratio of conditions (FA, Fopt, and NT) vs. mono-culture (Fdl)). (b) Percentage of each type of enzyme, including several mixed clusters (T1PKS/NRPS). (c) Unfiltered numbers of up- and down-regulated genes within predicted BGC for each of FA, Fopt, and NT. (d) Strongly differentially expressed genes in BGC regions, filtered by probability threshold of 0.9.
Diversity 13 00529 g004
Figure 5. Cluster analysis of selected BGCs. (a) Non-metric multidimensional scaling illustrating relational patterns of DEGs of the selected regions. (b) Expression regulation of the DEGs in ten selected regions.
Diversity 13 00529 g005
Figure 6. GO term analysis. (a) GO terms associated with selected BGC by antiSMASH software for nine selected regions. (b) Overlapping terms between two groups: up-regulated (Up) and down-regulated (Down) in the natural thallus of C. rangiferina. (c) Representation analysis of the GO terms: from up-regulated group (red), down-regulated (green), and overlapping regulation (beige).
Diversity 13 00529 g006
Figure 7. Expression of neighbouring genes within predicted BGCs. (a) Heatmap showing transcription levels of the core (highlighted) and neighbouring genes in all three conditions: FA, Fopt and NT. (b) Correlogram showing a positive correlation between expression of the core and the neighbouring genes.
Diversity 13 00529 g007
Table 1. Annotated most up-/down- regulated genes relative to non-symbiotic cultures.
PhotobiontMycobiont
Up-regulatedphotosystem I reaction center, chloroplastic plastocyanin, glutathione-dependent formaldehyde dehydrogenase, integral membrane single C2 domain protein, auxin influx carrier, phosphatase regulator, glutamate dehydrogenase 1, auxin influx carrierp450, acyl transferase, POB3, transcription factors, a putative regulatory protein, IBR, heterokaryon incompatibility protein
Down-regulatedglutathione-dependent formaldehyde dehydrogenase, signal peptides, auxin transport protein, carbonic anhydrase, bZIP transcription factor, pre-mRNA processing factor 8heme exporter protein D, berberine bridge-like enzyme, renin receptor-like protein, MFS-1, FAD linked oxidases, a post-Golgi secretory-vesicle coat complex, AAA proteins,
proteins binding to iron-sulphur clusters, major facilitator protein family, amino acid permease, polyketide synthase, alcohol dehydrogenase
Table 2. Biosynthetic gene clusters with DEG in each of the experimental conditions (FA, Fopt, and NT) and the most similar regions based on BLAST.
RegionGeneExpressionTypeDescription
FAFoptNT
Region 15.1aMSTRG.2707DOWNUPUPTSSqualene/phytoene synthase
Region 14.1MSTRG.4117DOWNUPUPT1PKSConidial yellow pigment biosynthesis PKS
Region 9.1MSTRG.9071DOWNUPUPNRPSAcetyl-CoA synthetase
Region 4.1MSTRG.6153DOWNUPUPNRPSAcetyl-CoA synthetase
Region 67.1MSTRG.1101DOWNUPUPNRPSPKS-NRPS enzyme
Region 9.2MSTRG.9225DOWNUPDOWNT1PKSDiketide synthase
Region 3.2MSTRG.646DOWNUPDOWNT1PKSDiketide synthase
Region 33.2MSTRG.7006DOWNUPDOWNT1PKS-NRPSNRPS-PKS hybrid
Region 24.1aMSTRG.4303DOWNUPDOWNT1PKSReducing PKS DEP5
Table 3. Differentially expressed neighbouring genes in selected BGCs.
RegionCorresponding DEGPredicted Protein
Region 3.2MSTRG.646
MSTRG.636
type I PKS
alpha/beta hydrolase fold
Region 4.1MSTRG.6153
MSTRG.6127
NRPS
leucyl-tRNA synthetase
Region 14.1MSTRG.4117
MSTRG.4119
type I PKS
short-chain dehydrogenase/reductase (SDR)
Region 15.1aMSTRG.2707
MSTRG.2708
terpene synthase
ATP-dependent RNA helicase
Region 33.2MSTRG.7006
MSTRG.6982
NRPS-PKS hybrid
alpha/beta hydrolase
Publisher’s Note: MDPI stays neutral with regard to jurisdictional claims in published maps and institutional affiliations.

