Article

Chromosomal-Level Assembly of Antarctic Scaly Rockcod, Trematomus loennbergii Genome Using Long-Read Sequencing and Chromosome Conformation Capture (Hi-C) Technologies

1
Division of Biotechnology, College of Life Sciences and Biotechnology, Korea University, Seoul 02841, Korea
2
Division of Polar Life Science, Korea Polar Research Institute, Incheon 21990, Korea
3
National Institute of Water & Atmospheric Research Ltd. (NIWA), 217 Akersten Street Port Nelson, Nelson 7001, New Zealand
4
Department of BT-Convergent Pharmaceutical Engineering, Sun Moon University, Asan 31460, Korea
*
Authors to whom correspondence should be addressed.
These authors contributed equally to this work.
Submission received: 8 November 2021 / Revised: 7 December 2021 / Accepted: 12 December 2021 / Published: 14 December 2021

Abstract

:
Trematomus species (suborder Notothenioidei; family Nototheniidae) are widely distributed in the southern oceans near Antarctica. There are 11 recognized species in the genus Trematomus, and notothenioids are known to have high chromosomal diversity (2n = 24–58) because of relatively recent and rapid adaptive radiation. Herein, we report the chromosomal-level genome assembly of T. loennbergii, the first characterized genome representative of the genus Trematomus. The final genome assembly of T. loennbergii was obtained using a Pacific Biosciences long-read sequencing platform and high-throughput chromosome conformation capture technology. Twenty-three chromosomal-level scaffolds were assembled to 940 Mb in total size, with a longest contig size of 48.5 Mb and contig N50 length of 24.7 Mb. The genome contained 42.03% repeat sequences, and a total of 24,525 protein-coding genes were annotated. We produced a high-quality genome assembly of T. loennbergii. Our results provide a first reference genome for the genus Trematomus and will serve as a basis for studying the molecular taxonomy and evolution of Antarctic fish.

Graphical Abstract

1. Introduction

Genus Trematomus belongs to the suborder Notothenioidei, the dominant fish fauna distributed in the Southern Ocean around Antarctica. Notothenioids are adapted to low temperatures to protect them from cold stress, and they have been found to contain antifreeze glycoproteins (AFGPs) and lack a heat-shock response (HSR) [1,2,3,4]. Additionally, some notothenioid species lost myoglobin and/or hemoglobin during adaptation to cold water [1,5,6]. There are 11 recognized species in the genus Trematomus [7], however, some species are deemed to be taxonomically problematic. Particularly, T. lepidorhinus and T. loennbergii have similar morphology and are mainly distinguished by scales on the snout, lower jaw, and preorbital (scaled vs. naked), and the snout length ratio (nearly as long as the eye diameter vs. much shorter) [8,9,10]. Moreover, they cannot be discriminated by any molecular markers including mitochondrial or nuclear markers, thus the necessity of distinctive nuclear markers and morphological reconsideration has been suggested [10,11,12,13]. On the other hand, trematomids have undergone relatively recent and rapid adaptive radiation, resulting in high chromosomal diversity (2n = 24–58) among notothenioids [14,15,16,17]. In the case of T. lepidorhinus, the diploid chromosome number is 47 in males and 48 in females [14,18], while T. loennbergii has diploid numbers ranging between 26 and 33 without sex-related differences [14,19,20]. This implies that karyotype comparison might be a useful tool for species discrimination, although both have 52 chromosomal arms [10,14].
In this study, we assembled the chromosomal-level genome of T. loennbergii using a Pacific Biosciences (PacBio) platform and high-throughput chromosome conformation capture (Hi-C) strategy. PacBio sequencing, also called single molecule real-time (SMRT) sequencing, is a long-read sequencing approach that has been widely used for de novo assembly [21]. The use of long reads provides significant advantages over short read-based sequencing for genome assembly, enabling high-quality genome assembly even in the presence of repetitive or low-complexity DNA regions [21]. Hi-C is a chromosome conformation capture (3C)-based technology that generates chromatin proximity information between all regions of the genome, and this spatial information can be used to assemble contigs and scaffolds as a chromosome-level [22,23,24]. These days, many projects have attempted the scaffolding strategy that combines long-read sequencing with Hi-C [21]. To date, the mitochondrial genomes of two species, T. bernacchii [25] and T. pennellii [26], have been described, and genome survey data of T. loennbergii have recently been published [27], but the chromosomal-level genome assemblies of Trematomus species have not yet been reported. This study provides a first reference genome for the genus Trematomus and will serve as a basic resource for studying the taxonomy and evolution of Antarctic fish.

2. Materials and Methods

2.1. Sample Collection and DNA Extraction

The T. loennbergii sample was collected from Ross Sea, Antarctica (SCAR Subarea 88.1), and transported to the laboratory while frozen. High molecular-weight genomic DNA was extracted from the muscle tissues of the frozen specimen using a phenol/chloroform method for long-read sequencing on a PacBio Sequel platform (Pacific Biosciences, Menlo Park, CA, USA). The quality and quantity of DNA were checked with a Fragment Analyzer (Agilent Technologies, Santa Clara, CA, USA) and Qubit 2.0 fluorometer (Invitrogen, Life Technologies, Carlsbad, CA, USA).

2.2. Genome Sequencing and Assembly Using PacBio Long Reads

The DNA was purified by AMPure® PB beads (Pacific Biosciences, CA, USA) before library preparation. The SMRTbell library and SMRTbell-polymerase complex were constructed using a SMRTbell template prep kit 1.0 and a Sequel binding kit 3.0 according to the manufacturer’s protocol (Pacific Biosciences, Menlo Park, CA, USA) (Table S1). The complex was loaded onto the Sequel instrument with SMRT cells 1M v3 and Sequel sequencing kit 3.0 (Pacific Biosciences, Menlo Park, CA, USA). We produced 6,258,640 subreads with a total read length of 77,938,427,833 bp using four SMRT cells (Table S2). The FALCON-Unzip assembler (ver. 0.4, Falcon, RRID:SCR_016089) was used for de novo assembly [28] with the options length_cutoff = 12,000 and length_cutoff_pr = 10,000. We polished initial genome assembly in order to improve its accuracy with Pilon v1.22 (Pilon, RRID:SCR_014731) [29] using BAM files produced by Bowtie v2.3.4.1 [30] with the short-read assembly dataset, and we used Purge Haplotigs [31] to find and remove haplotigs from the assemblies. The contiguity of assemblies was evaluated with an N50 value, which is defined as the shortest contig/scaffold length that accounts for half of the total genome length.

2.3. Hi-C Analysis and Chromosome Assembly

The frozen muscle tissue from the same individual utilized for DNA extraction was also used for Hi-C library construction. Briefly, nuclear chromatin was fixed in the fish muscle tissue with formaldehyde and then extracted. Fixed chromatin was digested with DpnII, and sticky ends were filled in with biotinylated nucleotides and ligated. Next, crosslinks were reversed, and the resulted hybrid DNA strands were purified from present free biotinylated nucleotides. Biotinylated linear DNA fragments were then sheared to size of ~350 bp and pulled down by streptavidin beads to obtain enriched sample for genuine interactions. To generate the library, paired-end adaptors were ligated to the resulted linear DNA fragments and PCR amplified [32]. Insert size and concentration were checked, and the final libraries were sequenced on the Illumina Novaseq platform (San Diego, CA, USA) with 150-bp paired-end reads. A total of 208 million Hi-C reads were generated (Table S2) and these were used as input data for HiRise, a software pipeline designed specifically for using proximity ligation data to scaffold genome assemblies [33] with the default settings to map to the polished scaffolds. Dovetail Hi-C library sequences were aligned to the draft input assembly using a modified SNAP read mapper (http://snap.cs.berkeley.edu, accessed on 30 April 2021). The separations of Hi-C read pairs mapped within draft scaffolds were analyzed by HiRise to produce a likelihood model for genomic distance between read pairs and generate the Hi-C contact map. The model was used to identify and discard putative mis-joins, score prospective joins, and make joins above thresholds, meaning that scaffolds anchored to single chromosome were considered as accurate joins. The syntenic relationship between assembled genome (scaffolds > 9 Mb) of T. loennbergii and Gasterosteus aculeatus genome were analyzed and visualized by SyMAP v3.4 [34] and Circos [35] with the default parameters.

2.4. Quality Evaluation

After HiRise pipeline, the completeness of the T. loennbergii genome assembly was evaluated using BUSCO version 4.0 (BUSCO, RRID:SCR_015008) in genome assessment mode [36] with the actinopterygii_odb10 dataset.

2.5. Transcriptome Sequencing

Total RNA was extracted from skin and muscle samples that were used for DNA extraction using a RNeasy Plus Mini kit (Qiagen, Hilden, Germany), according to the manufacturer’s protocol. The quality and quantity of RNA were measured with a 2100 Bioanalyzer (Agilent Technologies, Santa Clara, CA, USA) and Qubit 2.0 fluorometer (Invitrogen, Life Technologies, CA, USA). Complementary DNA (cDNA) for Iso-seq libraries was synthesized using a SMARTer PCR cDNA synthesis kit (Clontech, Palo Alto, CA, USA). Iso-seq SMRTbell libraries for the Sequel system (Pacific Biosciences, Menlo Park, CA, USA) were prepared following the manufacturer’s protocol. Iso-seq libraries were sequenced using a total of two SMRT cells 1M v3 LR with Sequel sequencing chemistry 3.0 to generate 1,211,859 subreads with a total read length 63,927,996,589 bp (Table S2). Iso-seq data analysis was conducted through Iso-seq3 application in SMRT Link (ver. 6.0.0) with default settings.

2.6. Genome Annotation and Repeat Analysis

A de novo library of repeat sequences was constructed based on the Purge Haplotigs-processed genome using RepeatModeler ver. 1.0.3 (RRID:SCR_015027) [37] consisting of RECON ver. 1.08 [37] and RepeatScout ver. 1.0.5 (RRID:SCR_ 014653) [38]. Tandem Repeats Finder ver. 4.09 [39] was used to predict consensus sequences and classify information for each repeat and tandem repeat, including simple repeats, satellites, and low-complexity repeats. RepeatMasker ver. 4.0.9 (http://repeatmasker.org, accessed on 30 April 2021) was used to mask interspersed repeats and low complexity DNA sequences, and calculate Kimura distance-based copy divergence for each types of repeat motifs with the default settings.
For genome annotation, we used MAKER ver. 2.28 (MAKER, RRID:SCR_005309) [40]. Ab initio gene prediction was performed using SNAP (SNAP, RRID:SCR_002127) and Augustus (Augustus: Gene Prediction, RRID:SCR_008417). MAKER was initially run in est2genome mode based on T. loennbergii transcriptome sequencing data from Iso-seq and Purge Haplotigs-processed genome data. In addition, protein sequences from 14 species genomes (Amphiprion ocellaris, Astyanax mexicanus, Chaenocephalus aceratus, Danio rerio, Dicentrarchus labrax, Gadus morhua, Gasterosteus aculeatus, Notothenia coriiceps, Oreochromis niloticus, Oryzias latipes, Poecilia formosa, Takifugu rubripes, Tetraodon nigroviridis, and Xiphophorus maculatus) were downloaded from the NCBI GenBank database and used for running protein2genome mode as references for homology-based gene prediction.

2.7. Functional Annotation

Functional annotations were accomplished by aligning protein fasta sequences from Maker annotation to the NCBI non-redundant protein (nr) [41], SwissProt (Swissprot, RRID:SCR_002380) [42], Translation of European Molecular Biology Laboratory (TrEMBL, RRID:SCR_002380) [42], Eukaryotic Orthogous Groups (KOG) [43], and Kyoto Encyclopedia of Genes and Genomes (KEGG, RRID:SCR_001120) [44] databases using BLASTP v2.2.31 [45] with a maximal e-value of 10−10 and to the Pfam database (Pfam, RRID:SCR_004726) [46] using HMMer V3.0 [47]. Protein signatures from resulted transcriptome data were annotated using the InterProScan 5 (InterProScan, RRID:SCR_005829) [48] pipeline for further gene ontology (GO) analysis, with respect to biological process, molecular function, and cellular component categories, implemented in Blast2GO (ver. 4.1.9) [49].
Other non-coding RNAs, such as miRNAs, rRNAs, and tRNAs, were predicted using Infernal software package ver. 1.1 (Infernal, RRID:SCR_011809) [50] and the Rfam (Rfam, RRID:SCR_007891) [51] database. Putative tRNAs were identified by tRNAscan-SE ver. 1.4 (tRNAscan-SE, RRID:SCR_010835) [52].

2.8. Gene Family Identification and Phylogenetic Analysis

The Orthologous gene families were clustered for 20 teleost fishes based on their transcripts protein sequences similarity using OrthoFinder 2 [53] with default parameters (Table S5). The maximum-likelihood (ML) tree of 20 teleost species was constructed using one to one single-copy orthologs via MEGA X software [54] with 1000 bootstraps. TimeTree [55] (median estimates of the pairwise divergence time for D. rerio and G. morhua: 230.4 Ma) was used to calibrate the divergence times using MCMC algorithms implemented in PAML packages [56]. The gene gain and loss was analyzed using CAFÉ ver. 4.0 [57] with p < 0.05.

3. Results and Discussion

3.1. Genome Assembly

The genome assembly of the Antarctic scaly rockcod, T. loennbergii, has been generated using long-read SMRT sequencing from PacBio and the Hi-C scaffolding strategy. After Hi-C super-scaffolding, a genome of approximately 940 Mb was obtained, of which the longest contig was 48.5 Mb, and the length of N50 was 24.7 Mb (Table 1). The number of scaffolds in the assembled genome was 1132, and 23 scaffolds were above 9 Mb in length (Table 1 and Table S4, Figure 1A). The number of the longest scaffolds (n = 23) is larger than the number of chromosomes previously known in T. loennbergii (2n = 26–33) [14,19,20], so further studies that can encompass the genomic and cytogenetic data are needed.
The Benchmarking Universal Single-Copy Orthologs (BUSCO) v4.0 was used along with the actinopterygii odb10 database to assess the completeness of the T. loennbergii genome assembly. Among 3640 expected actinopterygii genes, 3291 (90.4%) and 96 (2.6%) genes were completely and partially identified, respectively. Among the complete actinopterygii genes, 3222 (88.5%) and 69 (1.9%) were identified as single-copy and duplicated BUSCOs, respectively (Table 2).
The syntenic relationship of T. loennbergii and Gasterosteus aculeatus genomes was compared by SyMAP v3.4 [34], which showed a high level of synteny conservation that generally corresponded to one-to-one (Figure 1B). All of these results indicate that we obtained highly contiguous and complete genome assemblies of T. loennbergii.

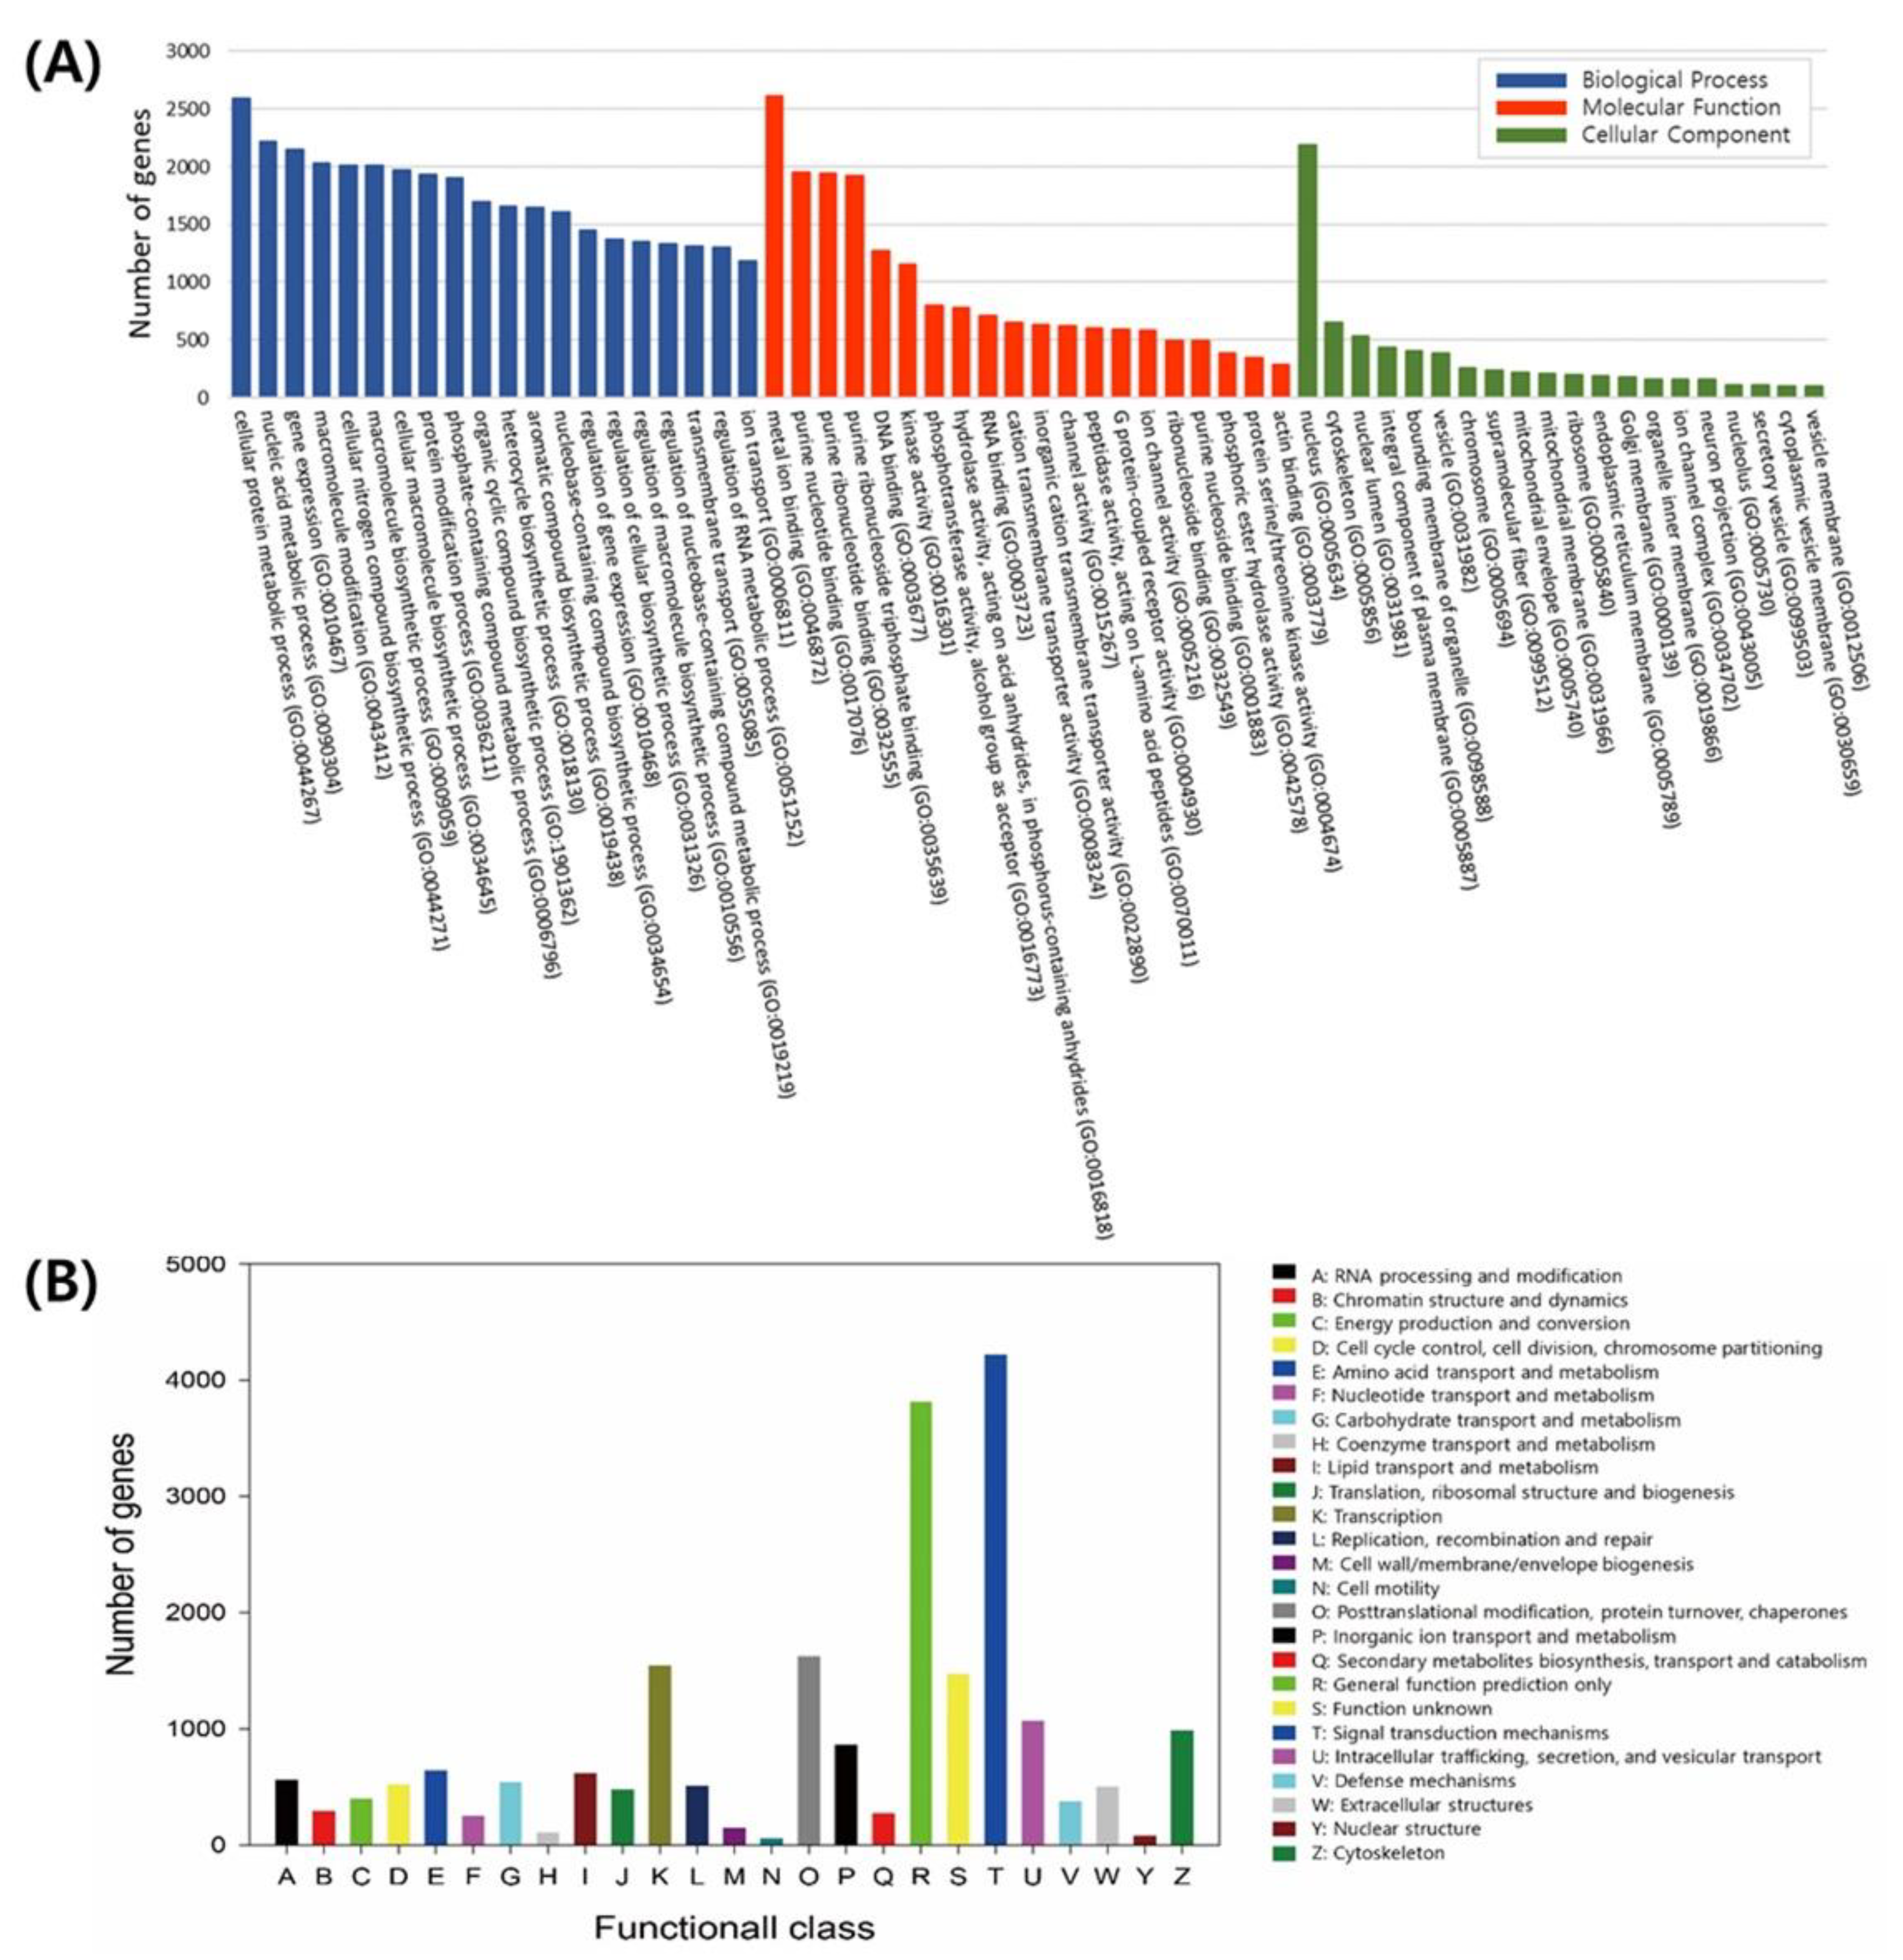
3.2. Genome Annotation

We analyzed the repetitive sequences in the T. loennbergii genome including those in the tandem repeats and transposable elements (TEs). The genome of T. loennbergii contains 42.03% repeated sequences, and 38.64% account for TEs (Table S4). Among these, 15.84% are DNA transposons, 2.97% are long terminal repeats (LTRs), 5.66% are long interspersed elements (LINEs), and 0.54% are short interspersed elements (SINEs) (Table S5). Kimura distances [58] were calculated for all TE copies from the genome library to estimate the age of TEs, which shows the more recent TE insertions (Kimura divergence K-values ≤ 5) that are strongly shaped by DNA transposons in a repeated landscape (Figure 2).
A total of 24,525 protein-coding genes in the T. loennbergii genome were annotated using combination of ab initio gene prediction, homology search, and transcript mapping. The total length of exons was 62 Mb, with 11.3 exons per gene on average (Table 3). For the consequence of the functional annotation, a total of 24,480 (99.8%) genes were annotated in at least one database (Table 3). The genes annotated in the GO and KOG databases were 19,389 (79.1%) and 15,801 (64.4%), respectively (Table 3), and the functional classifications are shown in Figure 3.

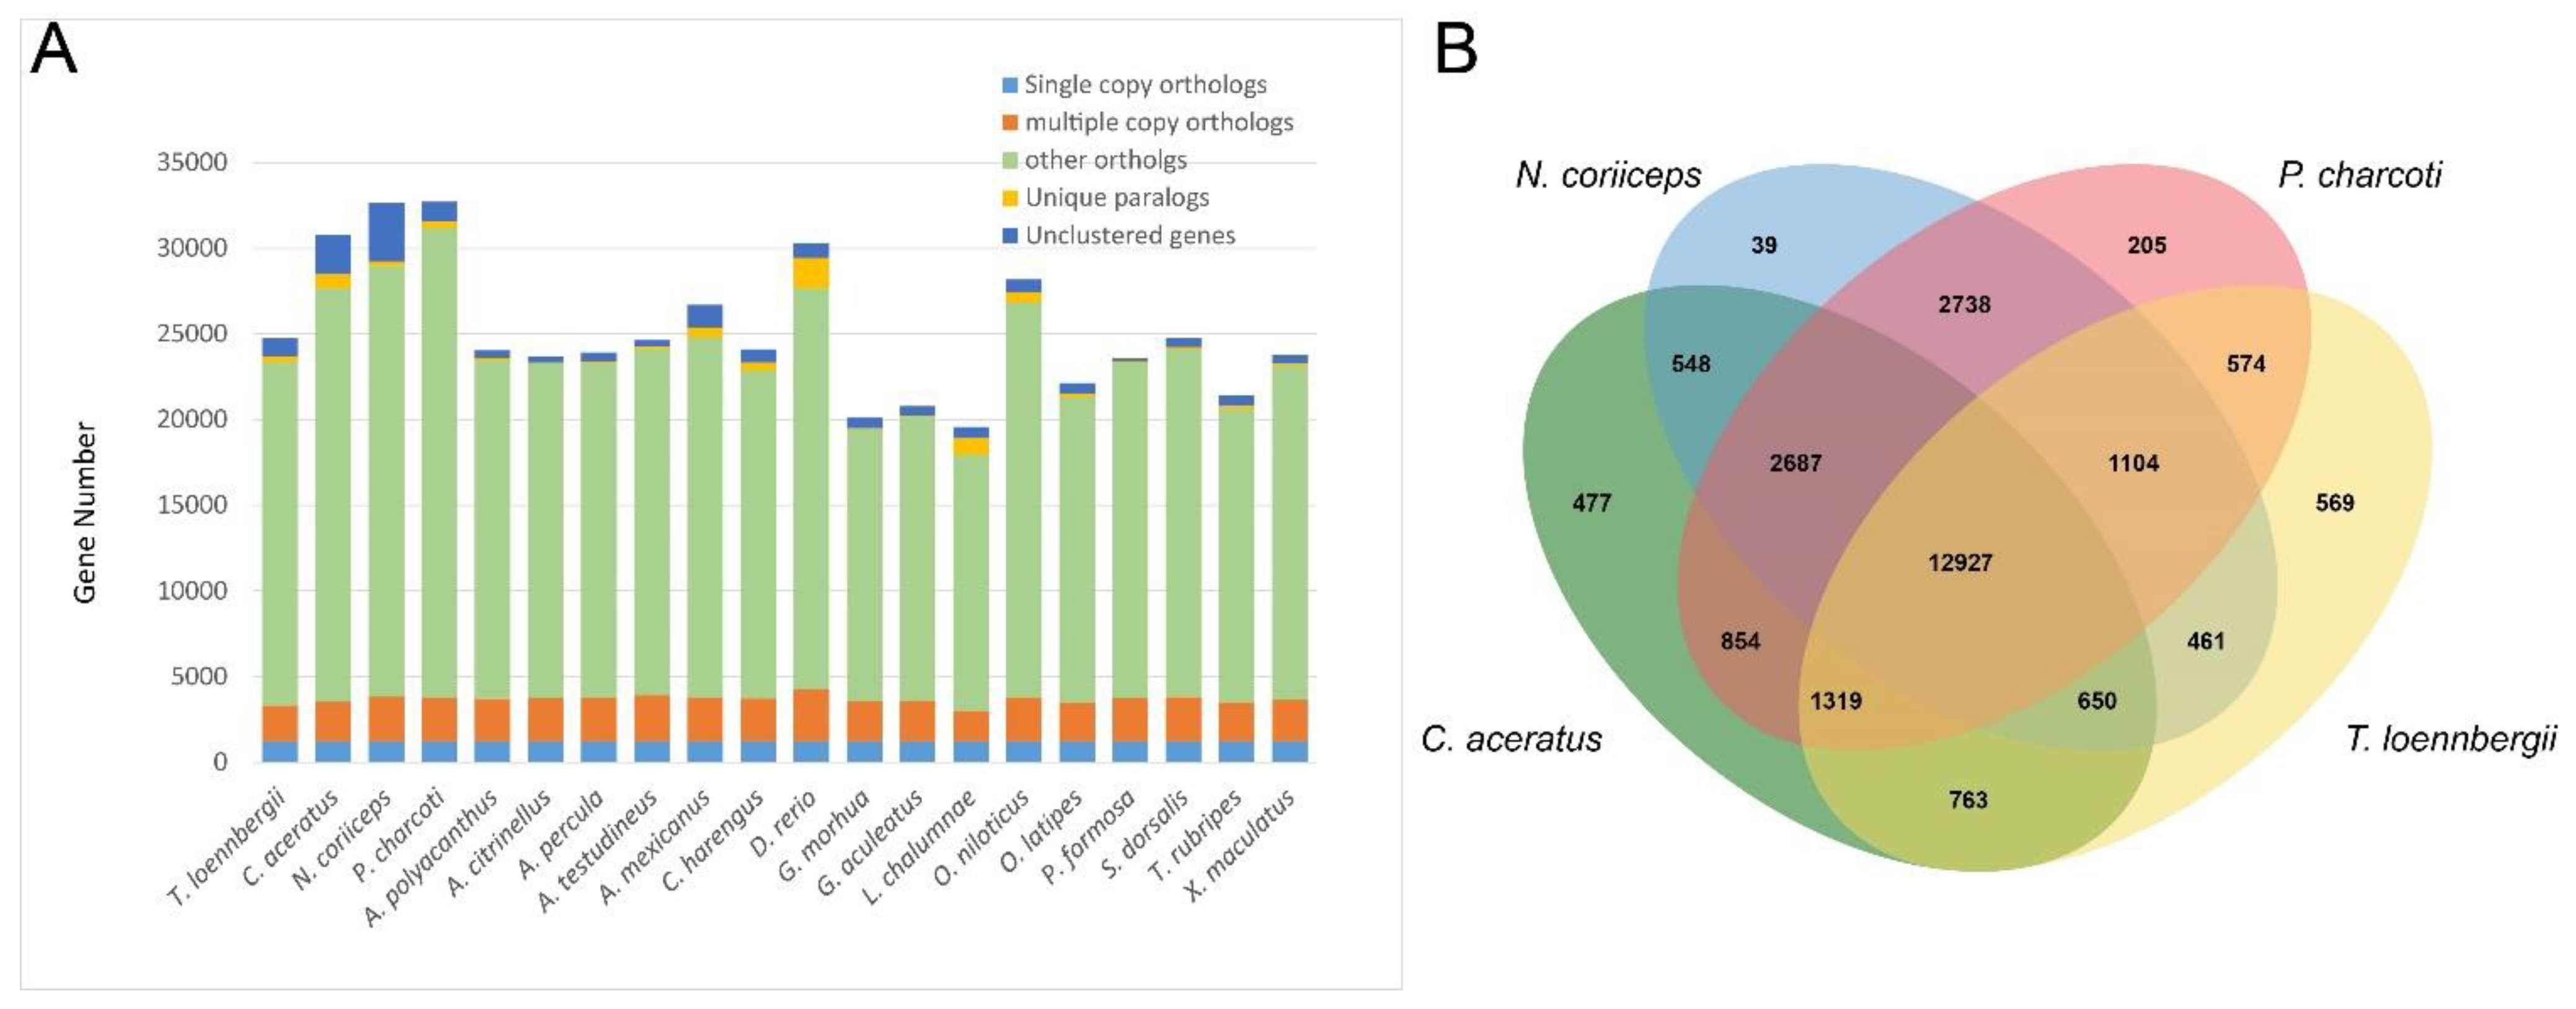
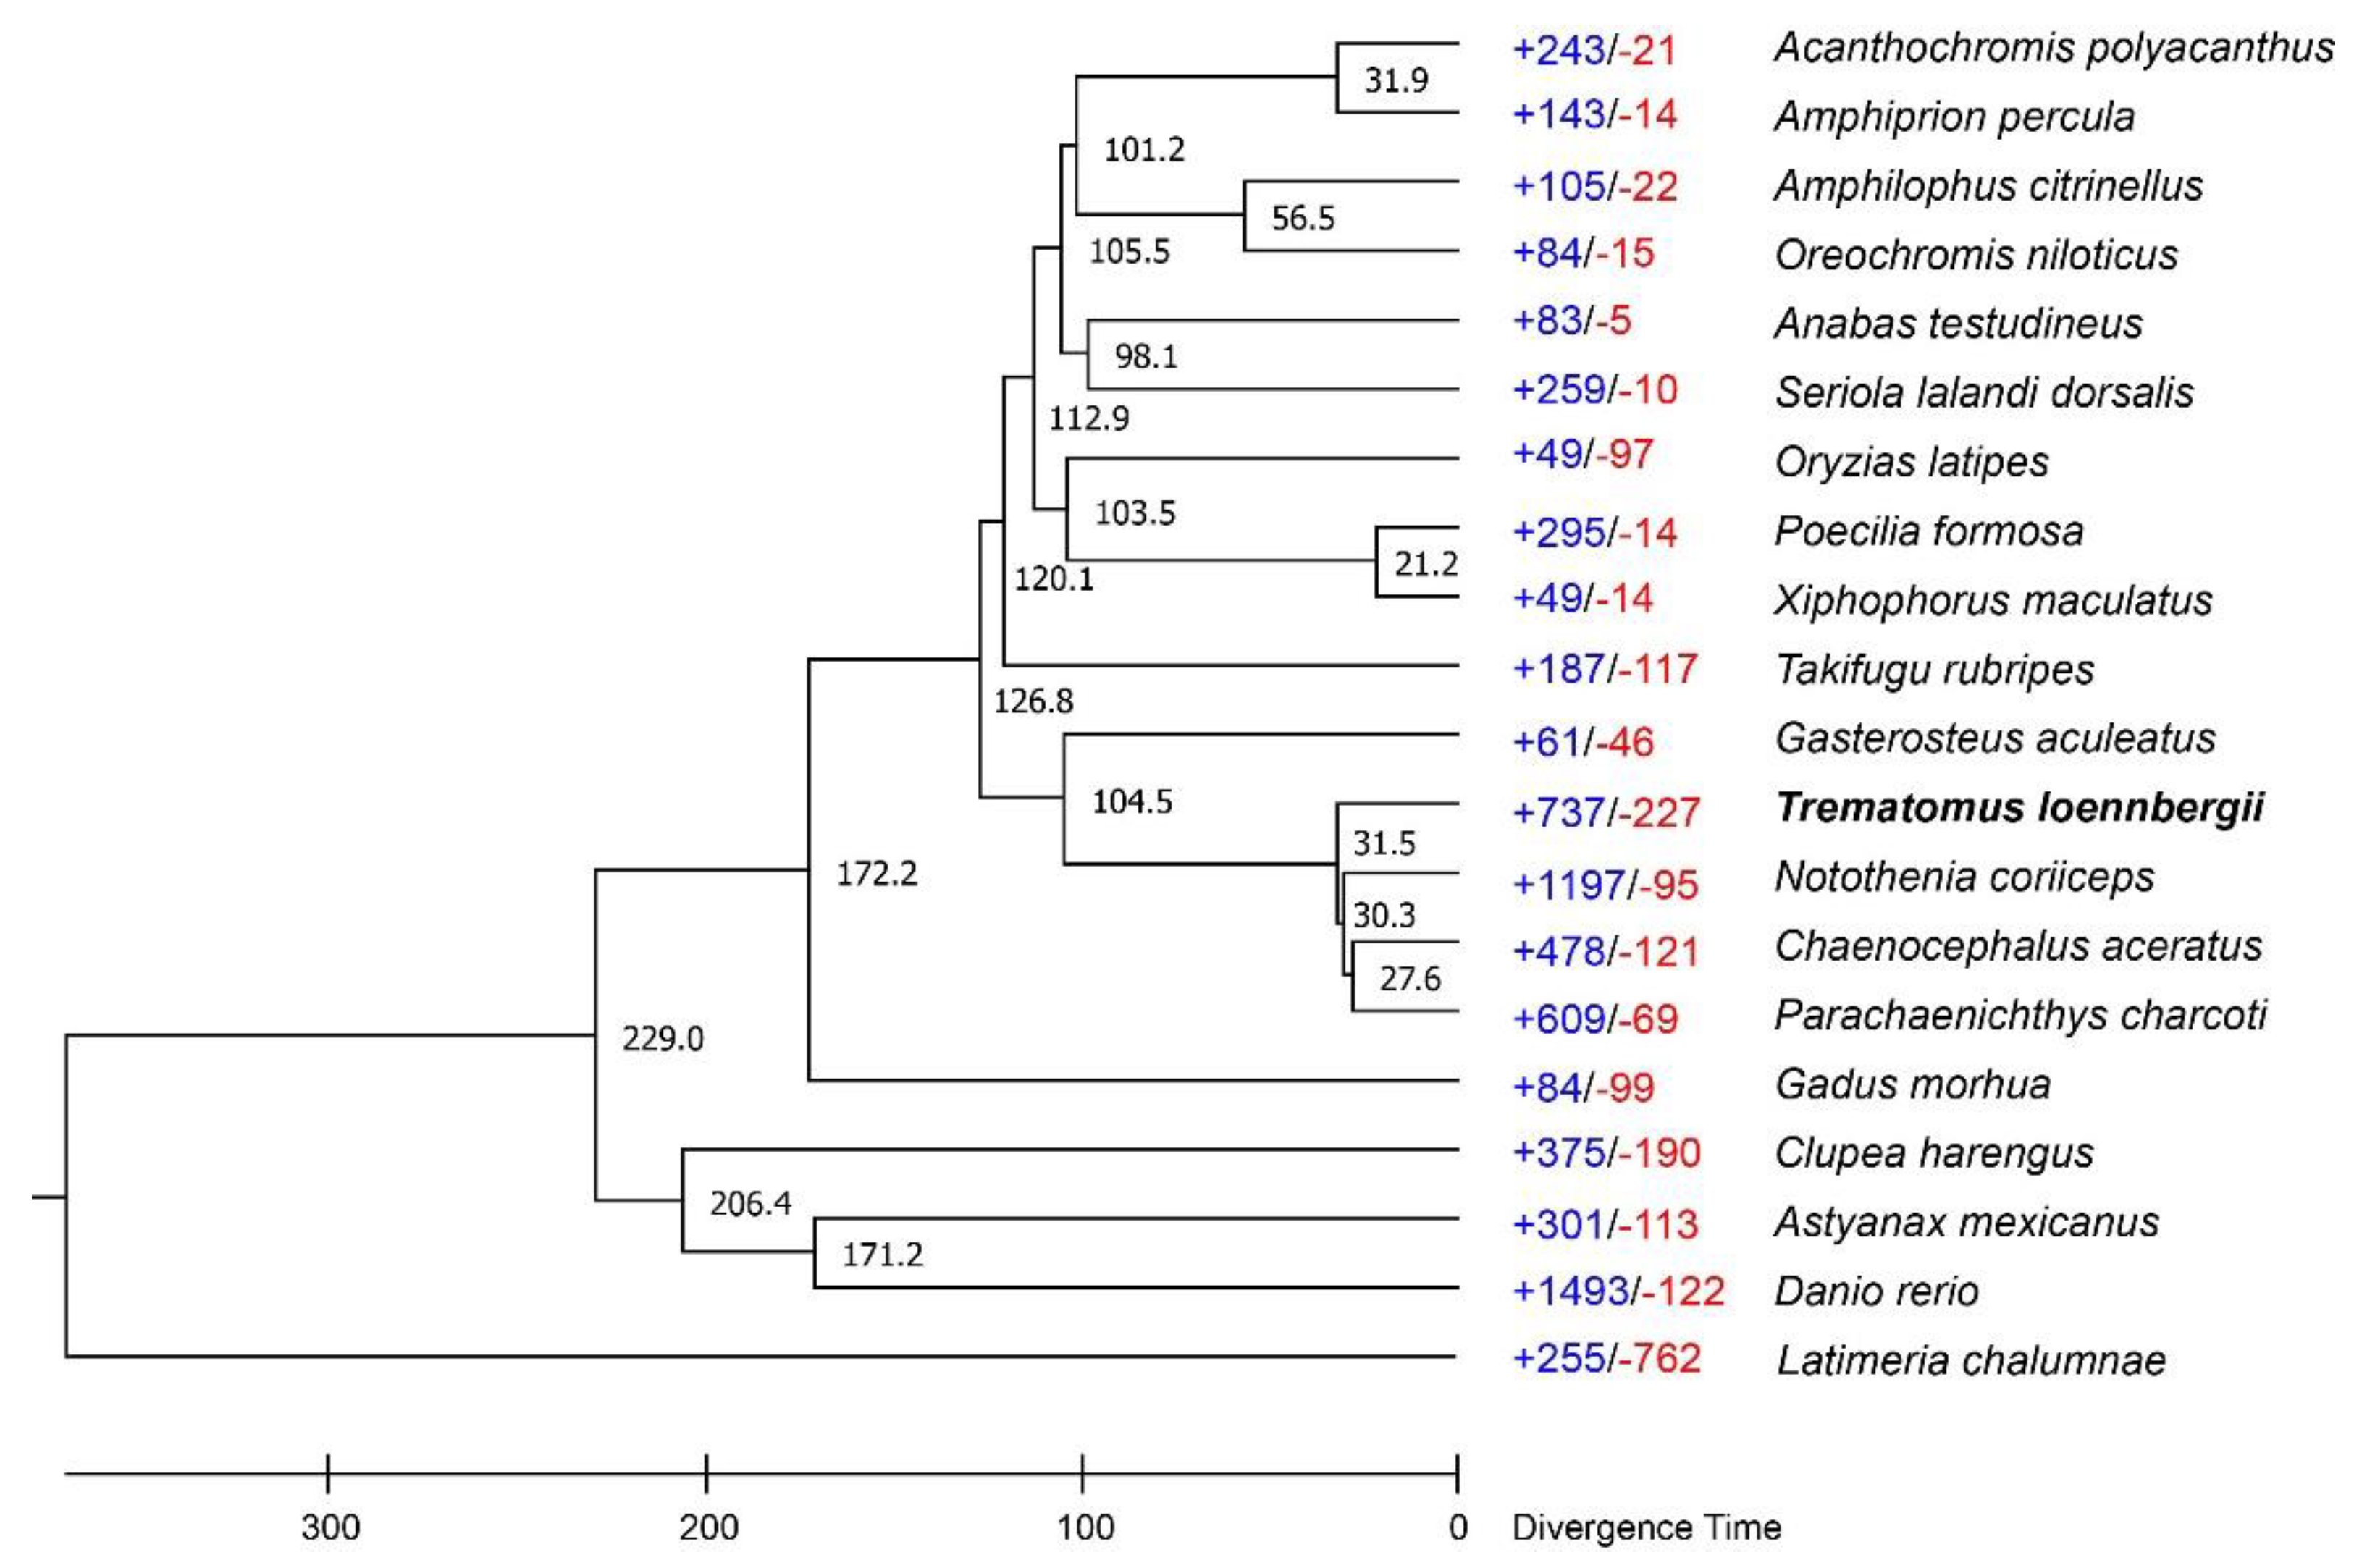
3.3. Gene Family Identification and Phylogenetic Analysis

In total, 7160 orthologue gene families were identified in all examined species of which 895 are species specific for T. loennbergii (Figure 4A and Table S6). A vast majority of the expanded gene ontology in the biological processes belong to regulation of metabolic process (negative regulation of macromolecule metabolic process, GO:0010605; negative regulation of nitrogen compound metabolic process, GO:0051172; negative regulation of cellular metabolic process, GO:0031324; regulation of macromolecule metabolic process, GO:0060255; regulation of nitrogen compound metabolic process, GO:0051171; regulation of primary metabolic process, GO:0080090), ion transmembrane transport (inorganic ion transmembrane transport, GO:0098660; cation transmembrane transport, GO:0098655; inorganic anion transmembrane transport, GO:0098661) and detection of stimulus (detection of chemical stimulus, GO:0009593; detection of stimulus involved in sensory perception, GO:0050906) (Tables S7 and S8). Among those, the GO terms associated with the macromolecule metabolic process have also been enriched in relation to cold adaptation or cold tolerance in several studies [59,60,61], suggesting further investigation on these expanded gene families.
Among Antarctic fish clade (T. loennbergii, Notothenia coriiceps, Chaenocephalus aceratus, and Parachaenichthys charcoti), we identified that 12,927 gene families were shared in four species, and 569 gene families were unique to T. loennbergii (Figure 4B). The four Antarctic fish assigned to the order Perciformes formed a monophyletic clade, and TimeTree [55] calibrated divergence time between T. loennbergii and other 3 Antarctic fish lineage was approximately 31.5 million years ago (Figure 5). Analysis of gene family gain and loss using CAFÉ ver. 4.0 [57] showed that T. loennbergii genome characterizes by expansion of 737 and contraction of 227 gene families in relation to remaining teleosts included to analysis (Figure 5). The expanded and contracted gene families in the T. loennbergii against other Antarctic teleosts were involved in broad range of gene functions, which are worthy of further study as they would be associated with T. loennbergii-specific physiological properties (Table S9).

4. Conclusions

Here, we report the chromosomal-level genome assembly of T. loennbergii, which was achieved using a third-generation sequencing platform, PacBio Sequel, and Hi-C analysis. The final genome assembly of the T. loennbergii is 940 Mb with N50 of 24.7 Mb, and has 294,525 protein-coding genes which were annotated from the newly obtained genome assembly. This retrieved novel genomic data is expected to improve our understanding on the evolutionary history and genome organization of the genus Trematomus, as well as providing valuable information for molecular taxonomy and evolutionary studies on Antarctic fish species. The obtained information under the current study genome assembly can be used in the future as reference data for genomic studies on the gene expression, signaling pathway, and biochemical processes characteristics for the Antarctic fishes, such as antifreeze proteins synthesis or evolutionary basis of heat-shock proteins activity loss.

Supplementary Materials

The following are available online at https://0-www-mdpi-com.brum.beds.ac.uk/article/10.3390/d13120668/s1, Table S1: Key protocol for Trematomus loennbergii genome sequencing and assembly. Table S2: Sequencing data generated for Trematomus loennbergii genome assembly, Table S3: Lengths of Trematomus loennbergii genome scaffolds, Table S4: Statistics for annotated Trematomus loennbergii transposable elements, Table S5: Species information used in this study, Table S6: Summary of gene families of Trematomus loennbergii and other fish species, Table S7: Gene Ontology of expanded genes families in the Trematomus loennbergii genome among twenty fishes, Table S8: Gene Ontology of contracted genes families in the Trematomus loennbergii genome among twenty fishes, Table S9: Gene Ontology of specific genes families in the Trematomus loennbergii genome among four Antarctic fishes.

Author Contributions

Conceptualization, J.-H.K., T.-J.O. and H.P.; methodology, E.C., J.K. and S.-R.H.; software, E.J. and S.J.L.; validation, T.-J.O. and H.P.; formal analysis, E.J., S.J.L., E.C., J.K. and S.-R.H.; resources, S.J.P.; data curation, E.J.; writing—original draft preparation, E.J. and S.J.L.; writing—review and editing, T.-J.O. and H.P.; project administration, H.P.; funding acquisition, J.-H.K. and H.P. All authors have read and agreed to the published version of the manuscript.

Funding

This research was supported by the ‘Ecosystem Structure and Function of Marine Protected Area (MPA) in Antarctica’ project (PM21060), funded by the Ministry of Oceans and Fisheries (20170336) and a Korea University Grant to H.P.

Institutional Review Board Statement

The procedures adopted in this study were performed in accordance with the guidelines of the Animal Welfare Ethical Committee and the Animal Experimental Ethics Committee of the Korea Polar Research Institute (KOPRI, Incheon, Korea).

Informed Consent Statement

Not applicable.

Data Availability Statement

The Trematomus loennbergii genome project was deposited at NCBI under BioProject number PRJNA610666. The whole-genome sequence was deposited in the Sequence Read Archive (SRA) database with the accession number SRR11364406 and SRR11364405.

Conflicts of Interest

The authors declare that they have no competing interest.

References

  1. Beers, J.M.; Jayasundara, N. Antarctic notothenioid fish: What are the future consequences of ‘losses’ and ‘gains’ acquired during long-term evolution at cold and stable temperatures? J. Exp. Biol. 2015, 218, 1834–1845. [Google Scholar] [CrossRef] [PubMed] [Green Version]
  2. DeVries, A.L.; Wohlschlag, D.E. Freezing resistance in some Antarctic fishes. Science 1969, 163, 1073–1075. [Google Scholar] [CrossRef]
  3. Buckley, B.A.; Place, S.P.; Hofmann, G.E. Regulation of heat shock genes in isolated hepatocytes from an Antarctic fish, Trematomus bernacchii. J. Exp. Biol. 2004, 207, 3649–3656. [Google Scholar] [CrossRef] [PubMed] [Green Version]
  4. Hofmann, G.E.; Buckley, B.A.; Airaksinen, S.; Keen, J.E.; Somero, G.N. Heat-shock protein expression is absent in the Antarctic fish Trematomus bernacchii (family Nototheniidae). J. Exp. Biol. 2000, 203, 2331–2339. [Google Scholar] [CrossRef]
  5. Kim, B.-M.; Amores, A.; Kang, S.; Ahn, D.-H.; Kim, J.-H.; Kim, I.-C.; Lee, J.H.; Lee, S.G.; Lee, H.; Lee, J. Antarctic Blackfin icefish genome reveals adaptations to extreme environments. Nat. Ecol. Evol. 2019, 3, 469–478. [Google Scholar] [CrossRef] [PubMed] [Green Version]
  6. Kock, K.-H. Antarctic Fish and Fisheries; Cambridge University Press: Cambridge, UK, 1992. [Google Scholar]
  7. Froese, R.; Pauly, D. FishBase. Available online: www.fishbase.org (accessed on 10 February 2020).
  8. De Witt, H.; Heemstra, P.; Gon, O. Nototheniidae; J. L. B. Smith Institute of Ichthyology: Grahamstown, South Africa, 1990; pp. 279–331. [Google Scholar]
  9. Miller, R.G. History and Atlas of the Fishes of the Antarctic Ocean; Foresta Inst: Carson City, NV, USA, 1993. [Google Scholar]
  10. Lautredou, A.-C.; Bonillo, C.; Denys, G.; Cruaud, C.; Ozouf-Costaz, C.; Lecointre, G.; Dettai, A. Molecular taxonomy and identification within the Antarctic genus Trematomus (Notothenioidei, Teleostei): How valuable is barcoding with COI? Polar Sci. 2010, 4, 333–352. [Google Scholar] [CrossRef]
  11. Dettaï, A.; Adamowizc, S.J.; Allcock, L.; Arango, C.P.; Barnes, D.K.; Barratt, I.; Chenuil, A.; Couloux, A.; Cruaud, C.; David, B. DNA barcoding and molecular systematics of the benthic and demersal organisms of the CEAMARC survey. Polar Sci. 2011, 5, 298–312. [Google Scholar] [CrossRef]
  12. Dettai, A.; Berkani, M.; Lautredou, A.-C.; Couloux, A.; Lecointre, G.; Ozouf-Costaz, C.; Gallut, C. Tracking the elusive monophyly of nototheniid fishes (Teleostei) with multiple mitochondrial and nuclear markers. Mar. Genom. 2012, 8, 49–58. [Google Scholar] [CrossRef] [PubMed]
  13. Smith, P.; Steinke, D.; Dettai, A.; McMillan, P.; Welsford, D.; Stewart, A.; Ward, R. DNA barcodes and species identifications in Ross Sea and Southern Ocean fishes. Polar Biol. 2012, 35, 1297–1310. [Google Scholar] [CrossRef]
  14. Ghigliotti, L.; Cheng, C.C.-H.; Ozouf-Costaz, C.; Vacchi, M.; Pisano, E. Cytogenetic diversity of notothenioid fish from the Ross sea: Historical overview and updates. Hydrobiologia 2015, 761, 373–396. [Google Scholar] [CrossRef]
  15. Auvinet, J.; Graça, P.; Belkadi, L.; Petit, L.; Bonnivard, E.; Dettaï, A.; Detrich, W.; Ozouf-Costaz, C.; Higuet, D. Mobilization of retrotransposons as a cause of chromosomal diversification and rapid speciation: The case for the Antarctic teleost genus Trematomus. BMC Genom. 2018, 19, 339. [Google Scholar] [CrossRef] [Green Version]
  16. Pisano, E.; Ozouf-Costaz, C. Chromosome change and the evolution in the Antarctic fish suborder Notothenioidei. Antarct. Sci. 2000, 12, 334–342. [Google Scholar] [CrossRef]
  17. Amores, A.; Wilson, C.A.; Allard, C.A.; Detrich, H.W.; Postlethwait, J.H. Cold fusion: Massive karyotype evolution in the Antarctic Bullhead Notothen Notothenia coriiceps. G3 Genes Genomes Genet. 2017, 7, 2195–2207. [Google Scholar] [CrossRef] [Green Version]
  18. Ozouf-Costaz, C.; Hureau, J.; Beaunier, M. Chromosome studies on fish of the suborder Notothenioidei collected in the Weddell Sea during EPOS 3 cruise. Cybium 1991, 15, 271–289. [Google Scholar]
  19. Ozouf-Costaz, C.; Pisano, E.; Thaeron, C.; Hureau, J. Karyological survey of the Notothenioid fish occurring in Adélie Land (Antarctica). In Proceedings of the 5th Indo-Pac Fish Conf Nouméa, Nouméa, New Caledonia, 3–8 November 1997; pp. 427–440. [Google Scholar]
  20. Morescalchi, A.; Pisano, E.; Stanyon, R.; Morescalchi, M. Cytotaxonomy of antarctic teleosts of the Pagothenia/Trematomus complex (Nototheniidae, Perciformes). Polar Biol. 1992, 12, 553–558. [Google Scholar] [CrossRef]
  21. Giani, A.M.; Gallo, G.R.; Gianfranceschi, L.; Formenti, G. Long walk to genomics: History and current approaches to genome sequencing and assembly. Comput. Struct. Biotechnol. J. 2020, 18, 9–19. [Google Scholar] [CrossRef] [PubMed]
  22. Lieberman-Aiden, E.; Van Berkum, N.L.; Williams, L.; Imakaev, M.; Ragoczy, T.; Telling, A.; Amit, I.; Lajoie, B.R.; Sabo, P.J.; Dorschner, M.O. Comprehensive mapping of long-range interactions reveals folding principles of the human genome. Science 2009, 326, 289–293. [Google Scholar] [CrossRef] [PubMed] [Green Version]
  23. Burton, J.N.; Adey, A.; Patwardhan, R.P.; Qiu, R.; Kitzman, J.O.; Shendure, J. Chromosome-scale scaffolding of de novo genome assemblies based on chromatin interactions. Nat. Biotechnol. 2013, 31, 1119–1125. [Google Scholar] [CrossRef] [PubMed]
  24. Kaplan, N.; Dekker, J. High-throughput genome scaffolding from in vivo DNA interaction frequency. Nat. Biotechnol. 2013, 31, 1143–1147. [Google Scholar] [CrossRef] [PubMed]
  25. Song, W.; Li, L.; Huang, H.; Zhao, M.; Jiang, K.; Zhang, F.; Zhao, M.; Chen, X.; Ma, L. The complete mitochondrial genome sequence and gene organization of Trematomus bernacchii (Perciformes: Nototheniidae) with phylogenetic consideration. Mitochondrial DNA Part B 2016, 1, 50–51. [Google Scholar] [CrossRef]
  26. Alam, M.J.; Kim, J.-H.; Andriyono, S.; Lee, J.-H.; Lee, S.R.; Park, H.; Kim, H.-W. Characterization of complete mitochondrial genome and gene organization of sharp-spined notothenia, Trematomus pennellii (Perciformes: Nototheniidae). Mitochondrial DNA Part B 2019, 4, 648–649. [Google Scholar] [CrossRef] [Green Version]
  27. Choi, E.; Im, T.-E.; Lee, S.J.; Jo, E.; Kim, J.; Kim, S.H.; Chi, Y.M.; Kim, J.-H.; Park, H. The complete mitochondrial genome of Trematomus loennbergii (Perciformes, Nototheniidae). Mitochondrial DNA Part B 2021, 6, 1032–1033. [Google Scholar] [CrossRef] [PubMed]
  28. Chin, C.-S.; Peluso, P.; Sedlazeck, F.J.; Nattestad, M.; Concepcion, G.T.; Clum, A.; Dunn, C.; O’Malley, R.; Figueroa-Balderas, R.; Morales-Cruz, A. Phased diploid genome assembly with single-molecule real-time sequencing. Nat. Methods 2016, 13, 1050. [Google Scholar] [CrossRef] [PubMed] [Green Version]
  29. Vaser, R.; Sović, I.; Nagarajan, N.; Šikić, M. Fast and accurate de novo genome assembly from long uncorrected reads. Genome Res. 2017, 27, 737–746. [Google Scholar] [CrossRef] [PubMed] [Green Version]
  30. Langmead, B.; Salzberg, S.L. Fast gapped-read alignment with Bowtie 2. Nat. Methods 2012, 9, 357–359. [Google Scholar] [CrossRef] [Green Version]
  31. Roach, M.J.; Schmidt, S.A.; Borneman, A.R. Purge Haplotigs: Allelic contig reassignment for third-gen diploid genome assemblies. BMC Bioinform. 2018, 19, 460. [Google Scholar] [CrossRef]
  32. Belton, J.-M.; McCord, R.P.; Gibcus, J.H.; Naumova, N.; Zhan, Y.; Dekker, J. Hi–C: A comprehensive technique to capture the conformation of genomes. Methods 2012, 58, 268–276. [Google Scholar] [CrossRef] [PubMed] [Green Version]
  33. Putnam, N.H.; O’Connell, B.L.; Stites, J.C.; Rice, B.J.; Blanchette, M.; Calef, R.; Troll, C.J.; Fields, A.; Hartley, P.D.; Sugnet, C.W. Chromosome-scale shotgun assembly using an in vitro method for long-range linkage. Genome Res. 2016, 26, 342–350. [Google Scholar] [CrossRef] [Green Version]
  34. Soderlund, C.; Bomhoff, M.; Nelson, W.M. SyMAP v3. 4: A turnkey synteny system with application to plant genomes. Nucleic Acids Res. 2011, 39, e68. [Google Scholar] [CrossRef] [PubMed] [Green Version]
  35. Krzywinski, M.; Schein, J.; Birol, I.; Connors, J.; Gascoyne, R.; Horsman, D.; Jones, S.J.; Marra, M.A. Circos: An information aesthetic for comparative genomics. Genome Res. 2009, 19, 1639–1645. [Google Scholar] [CrossRef] [Green Version]
  36. Simão, F.A.; Waterhouse, R.M.; Ioannidis, P.; Kriventseva, E.V.; Zdobnov, E.M. BUSCO: Assessing genome assembly and annotation completeness with single-copy orthologs. Bioinformatics 2015, 31, 3210–3212. [Google Scholar] [CrossRef] [Green Version]
  37. Bao, Z.; Eddy, S.R. Automated de novo identification of repeat sequence families in sequenced genomes. Genome Res. 2002, 12, 1269–1276. [Google Scholar] [CrossRef] [Green Version]
  38. Price, A.L.; Jones, N.C.; Pevzner, P.A. De novo identification of repeat families in large genomes. Bioinformatics 2005, 21, i351–i358. [Google Scholar] [CrossRef] [PubMed] [Green Version]
  39. Benson, G. Tandem repeats finder: A program to analyze DNA sequences. Nucleic Acids Res. 1999, 27, 573–580. [Google Scholar] [CrossRef] [Green Version]
  40. Holt, C.; Yandell, M. MAKER2: An annotation pipeline and genome-database management tool for second-generation genome projects. BMC Bioinform. 2011, 12, 491. [Google Scholar] [CrossRef] [Green Version]
  41. Marchler-Bauer, A.; Lu, S.; Anderson, J.B.; Chitsaz, F.; Derbyshire, M.K.; DeWeese-Scott, C.; Fong, J.H.; Geer, L.Y.; Geer, R.C.; Gonzales, N.R. CDD: A Conserved Domain Database for the functional annotation of proteins. Nucleic Acids Res. 2010, 39, D225–D229. [Google Scholar] [CrossRef] [Green Version]
  42. Boeckmann, B.; Bairoch, A.; Apweiler, R.; Blatter, M.-C.; Estreicher, A.; Gasteiger, E.; Martin, M.J.; Michoud, K.; O’Donovan, C.; Phan, I. The SWISS-PROT protein knowledgebase and its supplement TrEMBL in 2003. Nucleic Acids Res. 2003, 31, 365–370. [Google Scholar] [CrossRef]
  43. Koonin, E.V.; Fedorova, N.D.; Jackson, J.D.; Jacobs, A.R.; Krylov, D.M.; Makarova, K.S.; Mazumder, R.; Mekhedov, S.L.; Nikolskaya, A.N.; Rao, B.S. A comprehensive evolutionary classification of proteins encoded in complete eukaryotic genomes. Genome Biol. 2004, 5, R7. [Google Scholar] [CrossRef] [Green Version]
  44. Kanehisa, M.; Goto, S. KEGG: Kyoto encyclopedia of genes and genomes. Nucleic Acids Res. 2000, 28, 27–30. [Google Scholar] [CrossRef]
  45. Altschul, S.F.; Gish, W.; Miller, W.; Myers, E.W.; Lipman, D.J. Basic local alignment search tool. J. Mol. Biol. 1990, 215, 403–410. [Google Scholar] [CrossRef]
  46. El-Gebali, S.; Mistry, J.; Bateman, A.; Eddy, S.R.; Luciani, A.; Potter, S.C.; Qureshi, M.; Richardson, L.J.; Salazar, G.A.; Smart, A. The Pfam protein families database in 2019. Nucleic Acids Res. 2019, 47, D427–D432. [Google Scholar] [CrossRef]
  47. Eddy, S.R.; Mitchison, G.; Durbin, R. Maximum discrimination hidden Markov models of sequence consensus. J. Comput. Biol. 1995, 2, 9–23. [Google Scholar] [CrossRef] [PubMed]
  48. Jones, P.; Binns, D.; Chang, H.-Y.; Fraser, M.; Li, W.; McAnulla, C.; McWilliam, H.; Maslen, J.; Mitchell, A.; Nuka, G. InterProScan 5: Genome-scale protein function classification. Bioinformatics 2014, 30, 1236–1240. [Google Scholar] [CrossRef] [Green Version]
  49. Götz, S.; García-Gómez, J.M.; Terol, J.; Williams, T.D.; Nagaraj, S.H.; Nueda, M.J.; Robles, M.; Talón, M.; Dopazo, J.; Conesa, A. High-throughput functional annotation and data mining with the Blast2GO suite. Nucleic Acids Res. 2008, 36, 3420–3435. [Google Scholar] [CrossRef] [PubMed]
  50. Nawrocki, E.P.; Kolbe, D.L.; Eddy, S.R. Infernal 1.0: Inference of RNA alignments. Bioinformatics 2009, 25, 1335–1337. [Google Scholar] [CrossRef] [PubMed] [Green Version]
  51. Gardner, P.P.; Daub, J.; Tate, J.; Moore, B.L.; Osuch, I.H.; Griffiths-Jones, S.; Finn, R.D.; Nawrocki, E.P.; Kolbe, D.L.; Eddy, S.R. Rfam: Wikipedia, clans and the “decimal” release. Nucleic Acids Res. 2010, 39, D141–D145. [Google Scholar] [CrossRef] [Green Version]
  52. Lowe, T.M.; Eddy, S.R. tRNAscan-SE: A program for improved detection of transfer RNA genes in genomic sequence. Nucleic Acids Res. 1997, 25, 955–964. [Google Scholar] [CrossRef]
  53. Emms, D.M.; Kelly, S. OrthoFinder: Phylogenetic orthology inference for comparative genomics. Genome Biol. 2019, 20, 238. [Google Scholar] [CrossRef] [Green Version]
  54. Kumar, S.; Stecher, G.; Li, M.; Knyaz, C.; Tamura, K. MEGA X: Molecular evolutionary genetics analysis across computing platforms. Mol. Biol. Evol. 2018, 35, 1547–1549. [Google Scholar] [CrossRef] [PubMed]
  55. Hedges, S.B.; Dudley, J.; Kumar, S. TimeTree: A public knowledge-base of divergence times among organisms. Bioinformatics 2006, 22, 2971–2972. [Google Scholar] [CrossRef] [PubMed]
  56. Yang, Z. PAML 4: Phylogenetic analysis by maximum likelihood. Mol. Biol. Evol. 2007, 24, 1586–1591. [Google Scholar] [CrossRef] [PubMed] [Green Version]
  57. Han, M.V.; Thomas, G.W.; Lugo-Martinez, J.; Hahn, M.W. Estimating gene gain and loss rates in the presence of error in genome assembly and annotation using CAFE 3. Mol. Biol. Evol. 2013, 30, 1987–1997. [Google Scholar] [CrossRef] [PubMed]
  58. Kimura, M. A simple method for estimating evolutionary rates of base substitutions through comparative studies of nucleotide sequences. J. Mol. Evol. 1980, 16, 111–120. [Google Scholar] [CrossRef]
  59. Deng, X.; Wang, J.; Li, Y.; Wu, S.; Yang, S.; Chao, J.; Chen, Y.; Zhang, S.; Shi, M.; Tian, W. Comparative transcriptome analysis reveals phytohormone signalings, heat shock module and ROS scavenger mediate the cold-tolerance of rubber tree. Sci. Rep. 2018, 8, 4931. [Google Scholar] [CrossRef]
  60. Li, B.; Ning, L.; Zhang, J.; Bao, M.; Zhang, W. Transcriptional profiling of Petunia seedlings reveals candidate regulators of the cold stress response. Front. Plant Sci. 2015, 6, 118. [Google Scholar] [CrossRef] [PubMed] [Green Version]
  61. Zieger, M.A.; Gupta, M.P.; Wang, M. Proteomic analysis of endothelial cold-adaptation. BMC Genom. 2011, 12, 630. [Google Scholar] [CrossRef] [Green Version]
Figure 1. (A) Hi-C interaction heat map for Trematomus loennbergii. (B) Collinear relationship between T. loennbergii and Gasterosteus aculeatus. Alignment was accomplished with SyMAP v3.4. The colored blocks represent T. loennbergii scaffolds, and the white boxes represent G. aculeatus chromosomes. Blue and green bars represent genes of G. aculeatus and T. loennbergii, respectively. Connections within the circle represent alignment between the two assemblies.
Diversity 13 00668 g001
Figure 2. Kimura distance-based copy divergence analysis of transposable elements. Graphs represent genome coverage (y-axis) for each type of TE (DNA transposons, SINE, LINE, and LTR retrotransposons) in the Trematomus loennbergii genome.
Diversity 13 00668 g002
Figure 3. (A) Gene ontology (GO) annotations for the predicted genes within the Trematomus loennbergii genome. The horizontal axis indicates the classes of the 5-level GO-annotation, and the vertical level axis indicates the number of genes in each class. (B) Eukaryotic Orthologous Groups (KOG) classification of the predicted genes within the T. loennbergii genome. Results are grouped into 25 functional classes according to their functions. The horizontal axis indicates each class, and the vertical level axis indicates the number of genes in each class.
Diversity 13 00668 g003
Figure 4. Gene family comparison. (A) Orthologous gene families between Trematomus loennbergii and other fish species. (B) Venn diagram of orthologous gene families between T. loennbergii and other three Antarctic fish species.
Diversity 13 00668 g004
Figure 5. Phylogenetic analysis of Trematomus loennbergii within the teleost lineage and gene family gain-and-loss analysis, including the number of gained (+) and lost single-copy orthologous gene families (−). Each number of branch site indicates divergence times between lineages.
Diversity 13 00668 g005
Table 1. Statistics for Trematomus loennbergii genome assembly.
AssemblyContigsScaffolds
Number14821132
Total size of assembly (bp)944,447,341944,482,341
Longest contig (bp)17,998,61848,466,630
N50 contigs length (bp)1,726,67424,660,741
Number of scaffolds > 9 Mb423
Table 2. Completeness of the Trematomus loennbergii genome assembly evaluated with Benchmarking Universal Single-Copy Orthologs (BUSCO).
Actinopterygii_odb10NumberPercentage (%)
Complete BUSCOs (C)329190.4
Complete and single-copy BUSCOs (S)322288.5
Complete and duplicated BUSCOs (D)691.9
Fragmented BUSCOs (F)962.6
Missing BUSCOs (M)2537.0
Total BUSCO groups searched3640-
Table 3. Trematomus loennbergii genome annotation statistics.
Annotation DatabaseAnnotated NumberPercentage (%)
No. Genes24,525-
nr Annotation23,01693.8
GO Annotation19,38979.1
KEGG Annotation11,54647.1
KOG Annotation15,80164.4
Pfam Annotation17,31370.6
Swissprot Annotation19,80980.8
TrEMBL Annotation22,93293.5
-CountLength Sum (bp)
Exon329,46862,037,587
CDS311,91848,174,219
Publisher’s Note: MDPI stays neutral with regard to jurisdictional claims in published maps and institutional affiliations.

