
Long-Term Monitoring Reveals Differential Responses of Mussel and Host Fish Communities in a Biodiversity Hotspot


Abstract
:1. Introduction
2. Methods
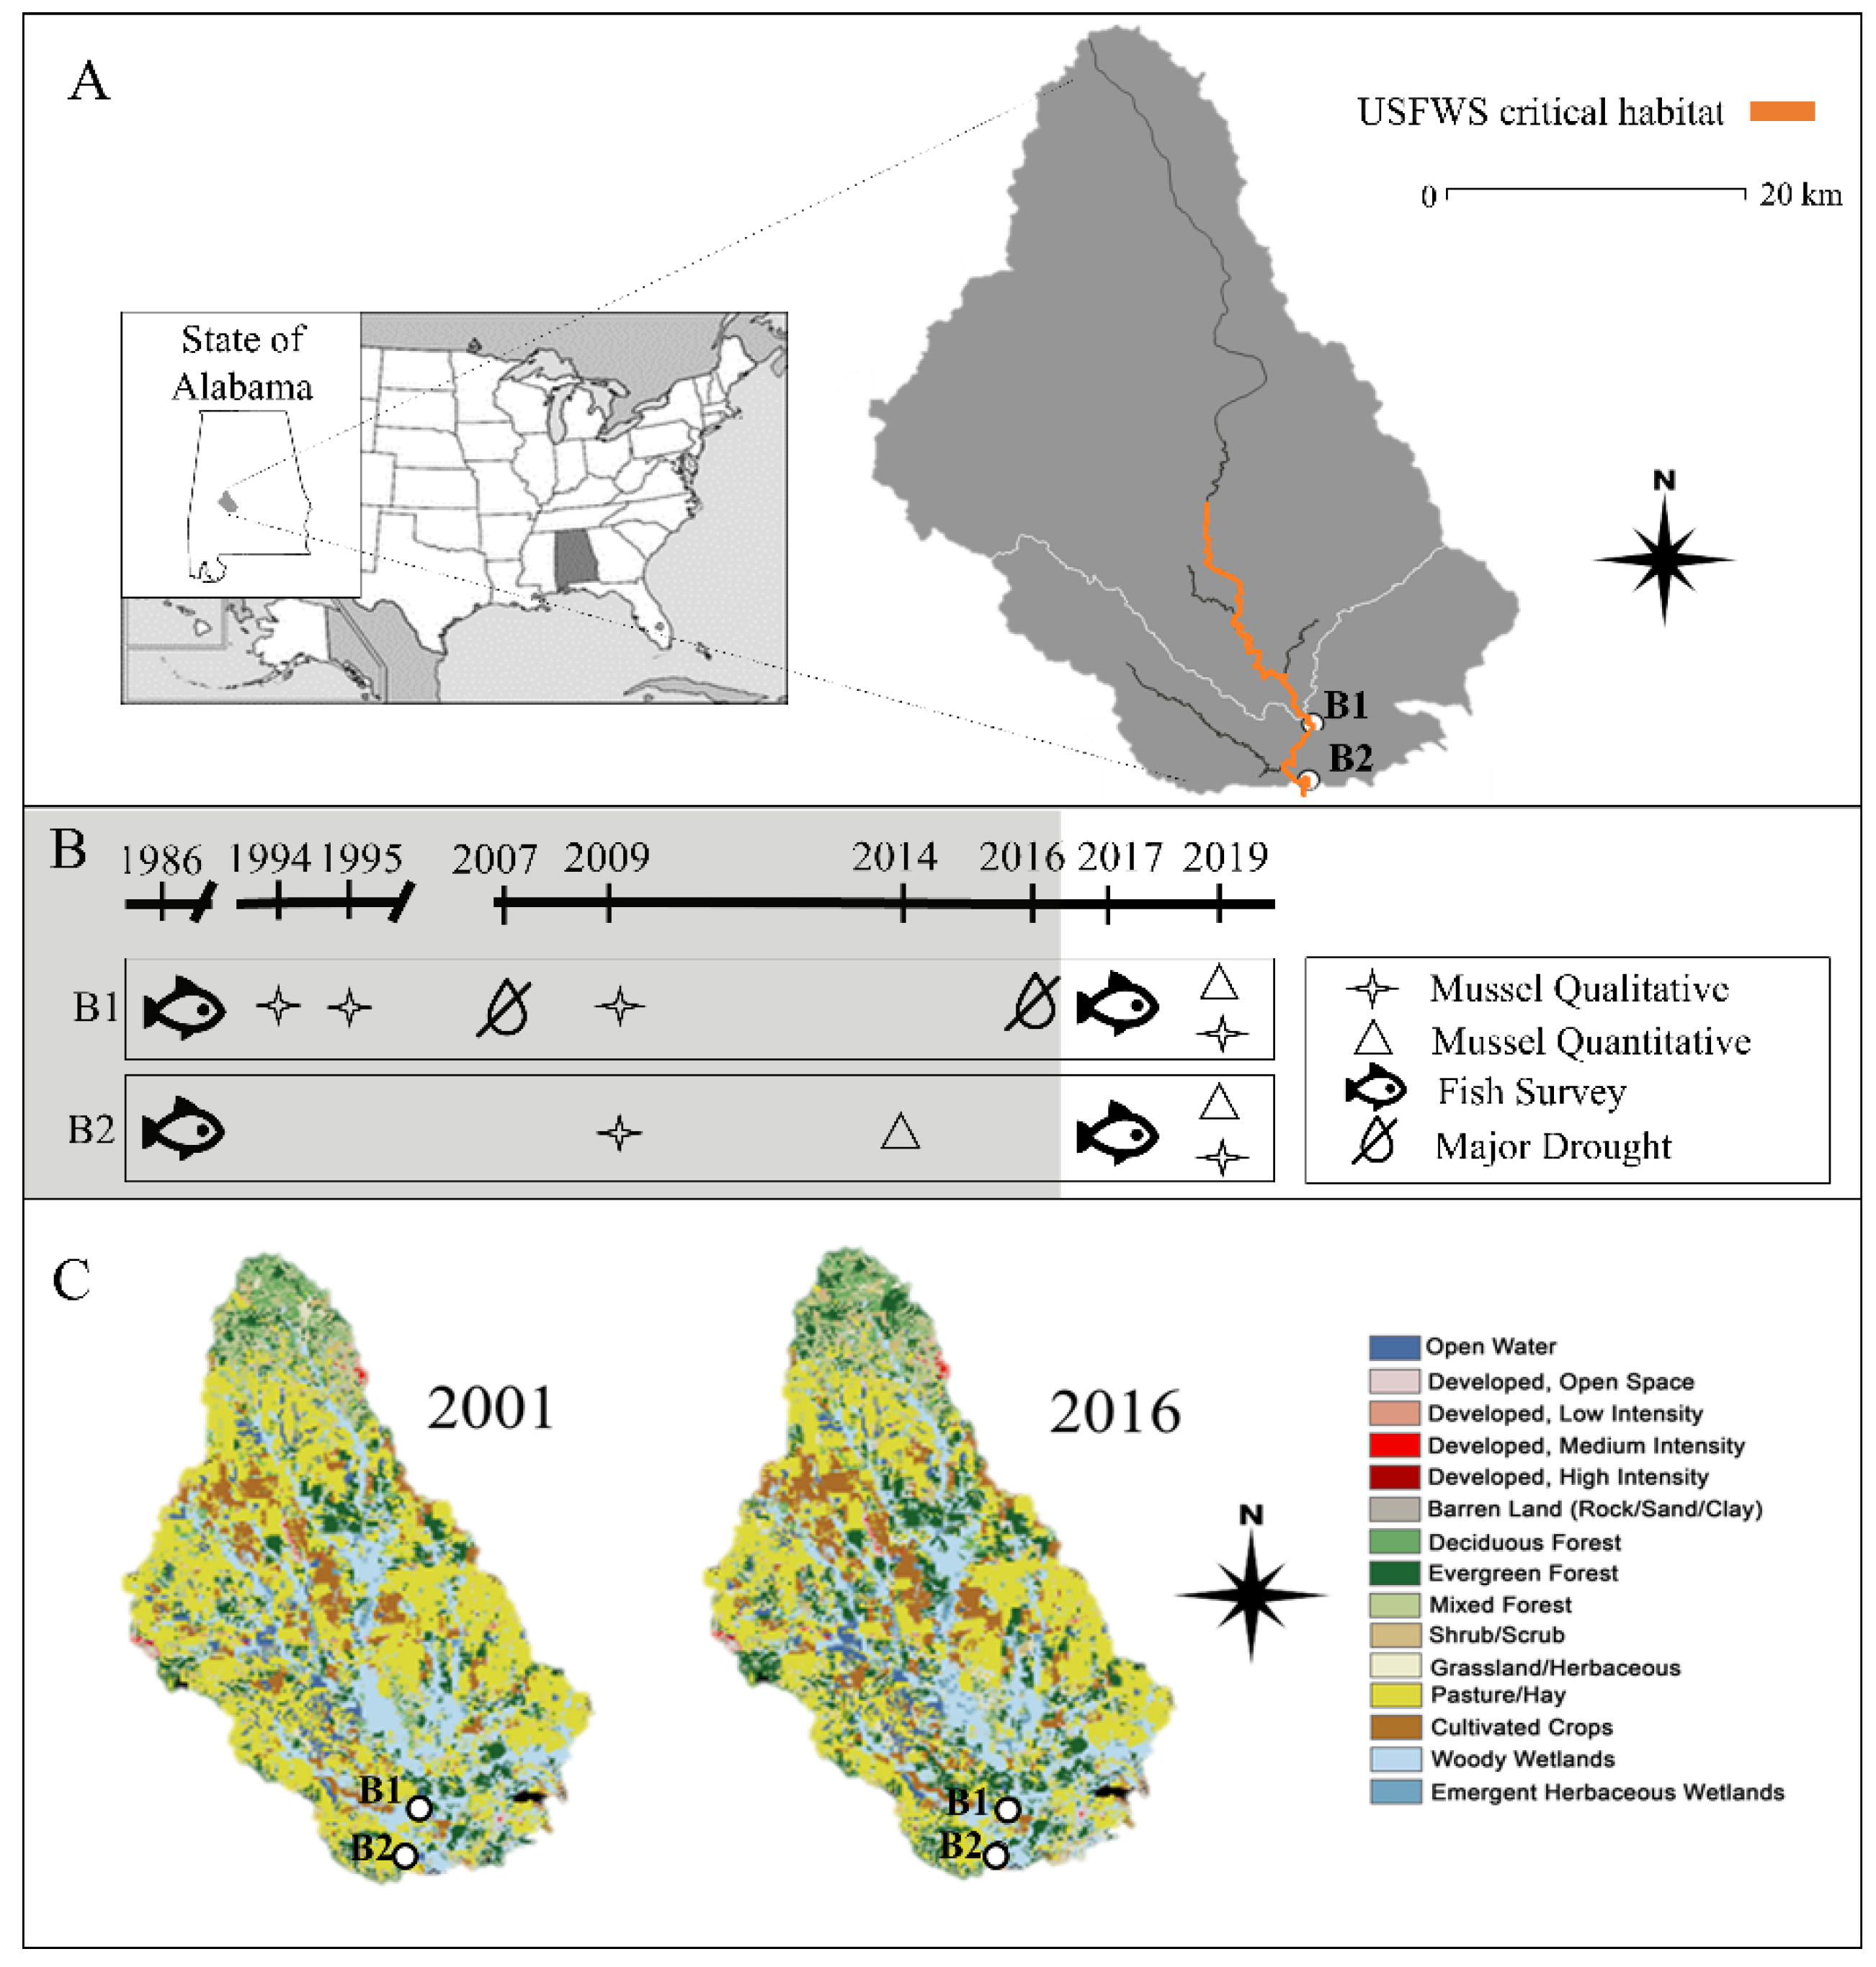
2.1. Study Area
2.2. Habitat Assessment
2.3. Mussel Surveys
2.4. Fish Collection and Assignment as Hosts
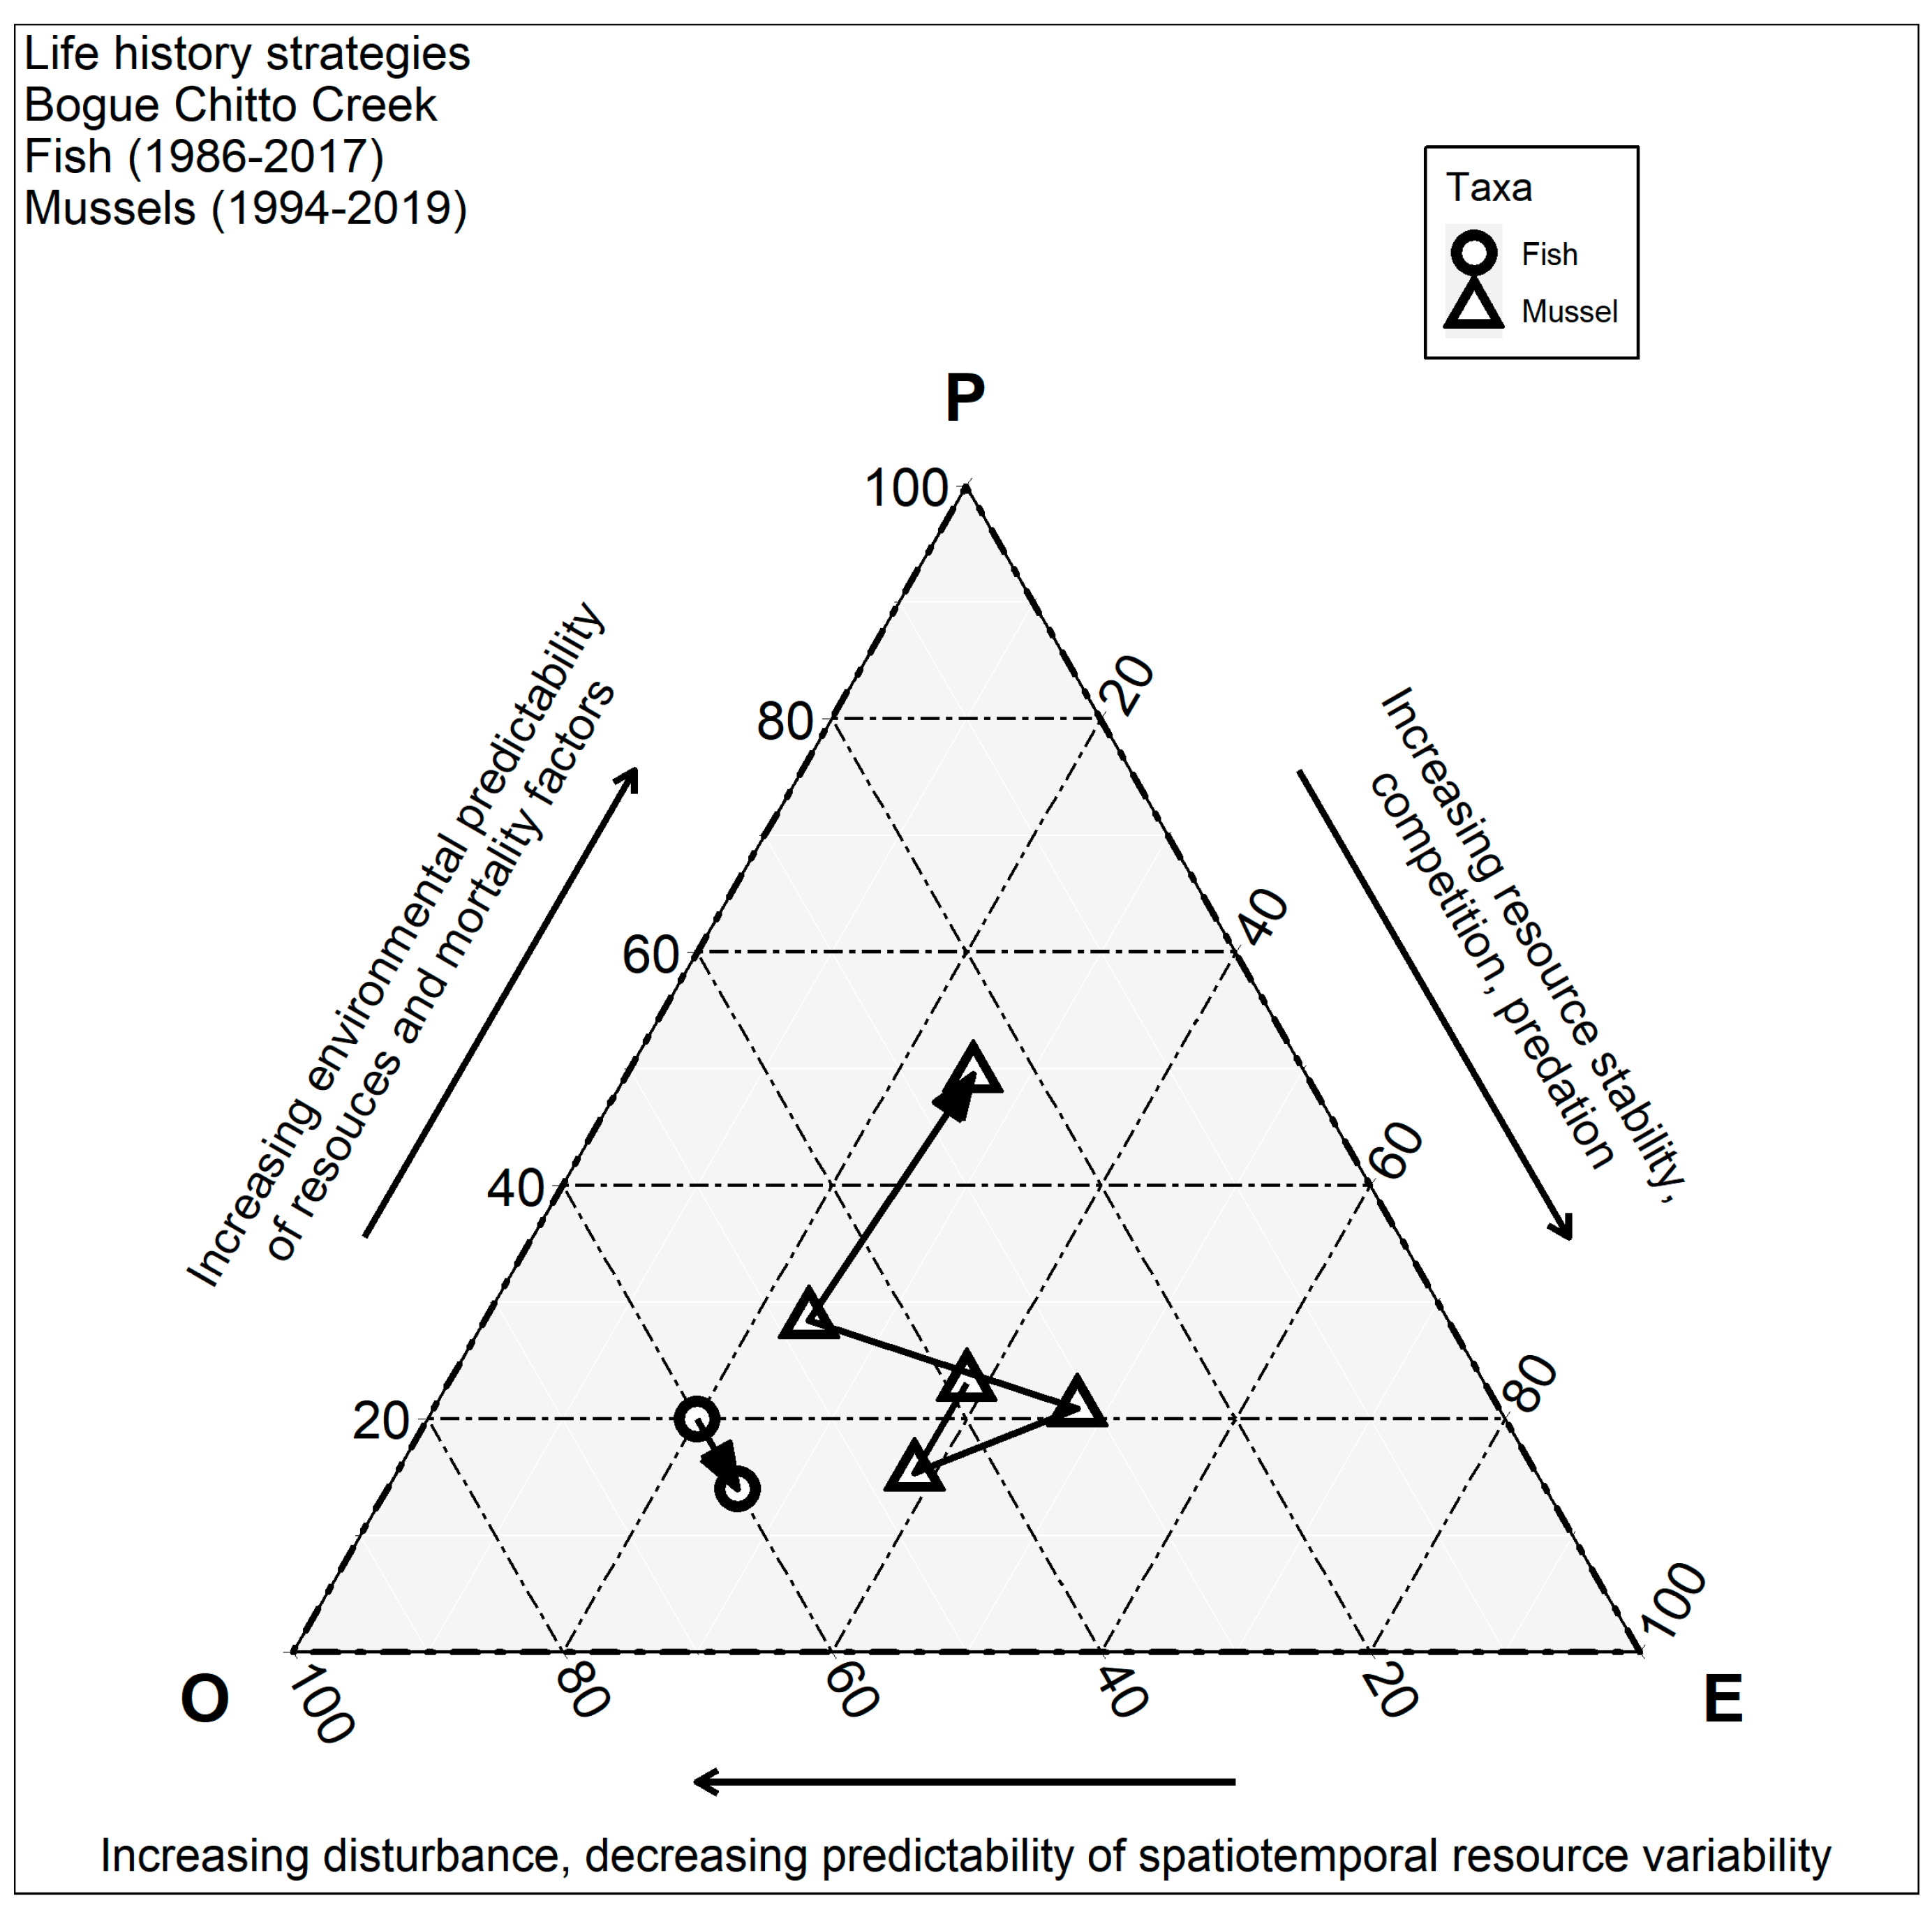
2.5. Mussel and Fish Life History Strategy Classifications
2.6. Statistical Analyses
3. Results
3.1. Habitat Changes
3.2. Mussel Abundance
3.3. Mussel Richness and Assemblage Composition
3.4. Fish Communities and Host–Mussel Relationships
3.5. Temporal Shifts in Life History Strategies
4. Discussion
5. Conclusions
Supplementary Materials
Author Contributions
Funding
Institutional Review Board Statement
Informed Consent Statement
Data Availability Statement
Acknowledgments
Conflicts of Interest
References
- Tilman, D.; Clark, M.; Williams, D.R.; Kimmel, K.; Polasky, S.; Packer, C. Future threats to biodiversity and pathways to their prevention. Nat. Cell Biol. 2017, 546, 73–81. [Google Scholar] [CrossRef] [PubMed]
- Reid, A.J.; Carlson, A.K.; Creed, I.F.; Eliason, E.J.; Gell, P.A.; Johnson, P.T.J.; Kidd, K.A.; MacCormack, T.J.; Olden, J.D.; Ormerod, S.J.; et al. Emerging threats and persistent conservation challenges for freshwater biodiversity. Biol. Rev. 2018, 94, 849–873. [Google Scholar] [CrossRef] [PubMed] [Green Version]
- Myers, N.; Mittermeier, R.A.; Mittermeier, C.G.; Da Fonseca, G.A.B.; Kent, J. Biodiversity hotspots for conservation priorities. Nature 2000, 403, 853–858. [Google Scholar] [CrossRef] [PubMed]
- Lydeard, C.; Cowie, R.H.; Ponder, W.F.; Bogan, A.E.; Bouchet, P.; Clark, S.A.; Cummings, K.S.; Frest, T.J.; Gargominy, O.; Herbert, D.G.; et al. The Global Decline of Nonmarine Mollusks. BioScience 2004, 54, 321–330. [Google Scholar] [CrossRef]
- Cincotta, R.P.; Wisnewski, J.; Engelman, R. Human population in the biodiversity hotspots. Nat. Cell Biol. 2000, 404, 990–992. [Google Scholar] [CrossRef] [PubMed]
- Kerr, J.T. Species richness, endemism, and choice of areas for conservation. Conserv. Biol. 1997, 11, 1094–1100. [Google Scholar] [CrossRef]
- Eisenhauer, N.; Bonn, A.; Guerra, C.A. Recognizing the quiet extinction of invertebrates. Nat. Commun. 2019, 10, 1–3. [Google Scholar] [CrossRef]
- Connell, J.H.; Sousa, W.P. On the evidence needed to judge ecological stability or persistence. Am. Nat. 1983, 121, 789–824. [Google Scholar] [CrossRef]
- Elliott, J.M. The need for long-term investigations in ecology and the contribution of the Freshwater Biological Association. Freshw. Biol. 1990, 23, 1–5. [Google Scholar] [CrossRef]
- Dudgeon, D.; Arthington, A.H.; Gessner, M.O.; Kawabata, Z.-I.; Knowler, D.J.; Lévêque, C.; Naiman, R.J.; Prieur-Richard, A.-H.; Soto, D.; Stiassny, M.L.J.; et al. Freshwater biodiversity: Importance, threats, status and conservation challenges. Biol. Rev. 2006, 81, 163–182. [Google Scholar] [CrossRef]
- Geist, J. Integrative freshwater ecology and biodiversity conservation. Ecol. Indic. 2011, 11, 1507–1516. [Google Scholar] [CrossRef]
- Watson, J.E.M.; Dudley, N.; Segan, D.B.; Hockings, M. The performance and potential of protected areas. Nat. Cell Biol. 2014, 515, 67–73. [Google Scholar] [CrossRef]
- Juffe-Bignoli, D.; Harrison, I.; Butchart, S.H.M.; Flitcroft, R.; Hermoso, V.; Jonas, H.; Lukasiewicz, A.; Thieme, M.L.; Turak, E.; Bingham, H.; et al. Achieving Aichi Biodiversity Target 11 to improve the performance of protected areas and conserve freshwater biodiversity. Aquat. Conserv. Mar. Freshw. Ecosyst. 2016, 26, 133–151. [Google Scholar] [CrossRef]
- Abell, R.; Lehner, B.; Thieme, M.; Linke, S. Looking beyond the fenceline: Assessing protection gaps for the world’s rivers. Conserv. Lett. 2017, 10, 384–394. [Google Scholar] [CrossRef] [Green Version]
- Strayer, D.L. Freshwater Mussel Ecology: A Multifactor Approach to Distribution and Abundance (Vol. 1); University of California Press: Berkeley, CA, USA, 2008. [Google Scholar]
- Sansom, B.J.; Bennett, S.J.; Atkinson, J.F.; Vaughn, C.C. Long-term persistence of freshwater mussel beds in labile river channels. Freshw. Biol. 2018, 63, 1469–1481. [Google Scholar] [CrossRef]
- Hedden, S.C.; Gido, K.B. Dispersal drives changes in fish community abundance in intermittent stream networks. River Res. Appl. 2020, 36, 797–806. [Google Scholar] [CrossRef]
- Winemiller, K.O.; Rose, K.A. Patterns of Life-History Diversification in North American Fishes: Implications for Population Regulation. Can. J. Fish. Aquat. Sci. 1992, 49, 2196–2218. [Google Scholar] [CrossRef]
- Haag, W.R. North American Freshwater Mussels: Natural History, Ecology, and Conservation; Cambridge University Press: Cambridge, UK, 2012. [Google Scholar]
- Barnhart, M.C.; Haag, W.R.; Roston, W.N. Adaptations to host infection and larval parasitism in Unionoida. J. N. Am. Benthol. Soc. 2008, 27, 370–394. [Google Scholar] [CrossRef] [Green Version]
- Vaughn, C.C.; Taylor, C.M. Macroecology of a host-parasite relationship. Ecography 2000, 23, 11–20. [Google Scholar] [CrossRef]
- Modesto, V.; Ilarri, M.; Souza, A.T.; Lopes-Lima, M.; Douda, K.; Clavero, M.; Sousa, R. Fish and mussels: Importance of fish for freshwater mussel conservation. Fish Fish. 2018, 19, 244–259. [Google Scholar] [CrossRef]
- Schwalb, A.N.; Morris, T.J.; Mandrak, N.E.; Cottenie, K. Distribution of unionid freshwater mussels depends on the distribution of host fishes on a regional scale. Divers. Distrib. 2013, 19, 446–454. [Google Scholar] [CrossRef]
- Haag, W.R.; Warren, M.L., Jr. Role of ecological factors and reproductive strategies in structuring freshwater mussel communities. Can. J. Fish. Aquat. Sci. 1998, 55, 297–306. [Google Scholar] [CrossRef]
- Vaughn, C.C.; Hoellein, T.J. Bivalve Impacts in Freshwater and Marine Ecosystems. Annu. Rev. Ecol. Evol. Syst. 2018, 49, 183–208. [Google Scholar] [CrossRef] [Green Version]
- Miller, R.R.; Williams, J.D.; Williams, J.E. Extinctions of North American fishes during the past century. Fisheries 1989, 14, 22–38. [Google Scholar] [CrossRef] [Green Version]
- Box, J.B.; Mossa, J. Sediment, Land Use, and Freshwater Mussels: Prospects and Problems. J. North Am. Benthol. Soc. 1999, 18, 99–117. [Google Scholar] [CrossRef]
- Haag, W.R. Reassessing Enigmatic Mussel Declines in the United States. Freshw. Mollusk Biol. Conserv. 2019, 22, 43–60. [Google Scholar] [CrossRef]
- Haag, W.R.; Culp, J.J.; McGregor, M.A.; Bringolf, R.; Stoeckel, J.A. Growth and survival of juvenile freshwater mussels in streams: Implications for understanding enigmatic mussel declines. Freshw. Sci. 2019, 38, 753–770. [Google Scholar] [CrossRef]
- US Fish and Wildlife Service. Endangered and Threatened Wildlife and Plants; Designation of Critical Habitat for Three Threatened Mussels and Eight Endangered Mussels in the Mobile River Basin Final Rule; Federal Register: Washington, DC, USA, 2004; pp. 40084–40171.
- Homer, C.; Dewitz, J.; Jin, S.; Xian, G.; Costello, C.; Danielson, P.; Gass, L.; Funk, M.; Wickham, J.; Stehman, S.; et al. Conterminous United States land cover change patterns 2001–2016 from the 2016 National Land Cover Database. ISPRS J. Photogramm. Remote. Sens. 2020, 162, 184–199. [Google Scholar] [CrossRef]
- Atkins, J.B.; Zappia, H.; Robinson, J.L.; McPherson, A.K.; Moreland, R.S.; Harned, D.A.; Johnston, B.F.; Harvill, J.S. Water quality in the Mobile River Basin, Alabama, Georgia, and Mississippi, and Tennessee, 1999–2001. In Circular; US Geological Survey: Montgomery, AL, USA, 2004; Volume 1231. [Google Scholar]
- NOAA National Centers for Environmental Information, State of the Climate: Drought for August 2007, Published Online September 2007. Available online: https://www.ncdc.noaa.gov/sotc/drought/200708 (accessed on 2 May 2020).
- Palmer, W.C. Meteorological Drought (Vol. 30); US Department of Commerce, Weather Bureau: Washington, DC, USA, 1965.
- Karr, J.R.; Fausch, K.D.; Angermeier, P.L.; Yant, P.R.; Schlosser, I.J. Assessing Biological Integrity in Running Waters: A Method and Its Rationale; Illinois Natural History Survey Special Publication No. 5; Illinois Natural History Survey: Champaign, IL, USA, 1986. [Google Scholar]
- O’Neil, P.E.; Shepard, T.E.A. Calibration of the Index of Biotic Integrity for the Hills and Coastal Terraces Ichthyoregion in Alabama Open File Report 0918; Geological Survey of Alabama: Tuscaloosa, AL, USA, 2011. [Google Scholar]
- Bearden, R.A.; McGregor, S.W.; West, D.A.; Nenstiel, R.P.; Hastertm, G.A. Watershed Assessment of the Bogue Chitto Creek Watershed (Bulletin 189); Geological Survey of Alabama: Tuscaloosa, AL, USA, 2019. [Google Scholar]
- Obermeyer, B.K. A Comparison of Quadrats Versus Timed Snorkel Searches for Assessing Freshwater Mussels. Am. Midl. Nat. 1998, 139, 331–339. [Google Scholar] [CrossRef]
- Vaughn, C.C.; Taylor, C.M.; Eberhard, K.J. A comparison of the effectiveness of timed searches vs. quadrat sampling in mussel surveys. In A UMRCC Symposium, Proceedings of the Conservation and Management of Freshwater Mussels II: Initiatives for the Future, St. Louis, MO, USA, 16–18 October 1995; Upper Mississippi River Conservation Committee: Rock Island, IL, USA, 1995; pp. 16–18. [Google Scholar]
- Freshwater Mussel Host Database. The Freshwater Mussel Host Database, Illinois Natural History Survey & Ohio State University Museum of Biological Diversity. 2017. Available online: http://wwx.inhs.illinois.edu/collections/mollusk/data/freshwater-mussel-host-database (accessed on 7 September 2020).
- Boschung, H.T.; Mayden, R.L. Fishes of Alabama; Smithsonian Books: Washington, DC, USA, 2004. [Google Scholar]
- Frimpong, E.A.; Angermeier, P.L. Fish Traits: A Database of Ecological and Life-history Traits of Freshwater Fishes of the United States. Fisheries 2009, 34, 487–495. [Google Scholar] [CrossRef]
- Winemiller, K.O. Patterns of variation in life history among South American fishes in seasonal environments. Oecologia 1989, 81, 225–241. [Google Scholar] [CrossRef] [PubMed]
- Matthews, W.J.; Marsh-Matthews, E. Dynamics of an upland stream fish community over 40 years: Trajectories and support for the loose equilibrium concept. Ecology 2016, 97, 706–719. [Google Scholar]
- Hornbach, D.J.; Allen, D.C.; Hove, M.C.; MacGregor, K.R. Long-term decline of native freshwater mussel assemblages in a federally protected river. Freshw. Biol. 2018, 63, 243–263. [Google Scholar] [CrossRef]
- Giri, S.; Qiu, Z. Understanding the relationship of land uses and water quality in Twenty First Century: A review. J. Environ. Manag. 2016, 173, 41–48. [Google Scholar] [CrossRef] [Green Version]
- Silapajarn, K.; Boyd, C.E.; Silapajarn, O. Physical and Chemical Characteristics of Pond Water and Bottom Soil in Channel Catfish Ponds in West-Central Alabama; Bulletin 655; Alabama Agricultural Experiment Station, Auburn University: Auburn, AL, USA, 2004. [Google Scholar]
- Boyd, C.E.; Queiroz, J.; Lee, J.; Rowan, M.; Whitis, G.N.; Gross, A. Environmental Assessment of Channel Catfish Ictalurus punctatus Farming in Alabama. J. World Aquac. Soc. 2007, 31, 511–544. [Google Scholar] [CrossRef]
- Tavares, L.H.S.; Boyd, C.E. Possible Effects of Sodium Chloride Treatment on Quality of Effluents from Alabama Channel Catfish Ponds. J. World Aquac. Soc. 2003, 34, 217–222. [Google Scholar] [CrossRef]
- Boyd, C.E. Water Quality: An Introduction; Academic Publishers: Norwell, MA, USA, 2000. [Google Scholar]
- Sousa, R.G.; Novais, A.A.; Costa, R.; Strayer, D.L. Invasive bivalves in fresh waters: Impacts from individuals to ecosystems and possible control strategies. Hydrobiologia 2013, 735, 233–251. [Google Scholar] [CrossRef] [Green Version]
- Non-Indigenous Aquatic Species (NAS) Database. Available online: https://nas.er.usgs.gov/ (accessed on 9 July 2020).
- Pergl, J.; Pyšek, P.; Essl, F.; Jeschke, J.M.; Courchamp, F.; Geist, J.; Hejda, M.; Kowarik, I.; Mill, A.; Musseau, C.; et al. Need for routine tracking of biological invasions. Conserv. Biol. 2019, 34, 1311–1314. [Google Scholar] [CrossRef]
- Gagnon, P.M.; Golladay, S.W.; Michener, W.K.; Freeman, M.C. Drought Responses of Freshwater Mussels (Unionidae) in Coastal Plain Tributaries of the Flint River Basin, Georgia. J. Freshw. Ecol. 2004, 19, 667–679. [Google Scholar] [CrossRef]
- Vicente-Serrano, S.M.; Quiring, S.M.; Peña-Gallardo, M.; Yuan, S.; Domínguez-Castro, F. A review of environmental droughts: Increased risk under global warming? Earth-Sci. Rev. 2020, 201, 102953. [Google Scholar] [CrossRef]
- NOAA National Centers for Environmental Information, State of the Climate: Drought for October 2016, Published Online November 2016. Available online: https://www.ncdc.noaa.gov/sotc/drought/201610 (accessed on 2 May 2020).
- Mitchell, Z.A.; McGuire, J.; Abel, J.; Hernandez, B.A.; Schwalb, A.N. Move on or take the heat: Can life history strategies of freshwater mussels predict their physiological and behavioural responses to drought and dewatering? Freshw. Biol. 2018, 63, 1579–1591. [Google Scholar] [CrossRef]
- DuBose, T.P.; Atkinson, C.L.; Vaughn, C.C.; Golladay, S.W. Drought-Induced, Punctuated Loss of Freshwater Mussels Alters Ecosystem Function Across Temporal Scales. Front. Ecol. Evol. 2019, 7, 274. [Google Scholar] [CrossRef] [Green Version]
- Atkinson, C.L.; Julian, J.P.; Vaughn, C.C. Species and function lost: Role of drought in structuring stream communities. Biol. Conserv. 2014, 176, 30–38. [Google Scholar] [CrossRef]
- Böhm, M.; Dewhurst-Richman, N.I.; Seddon, M.; Ledger, S.E.H.; Albrecht, C.; Allen, D.; Bogan, A.E.; Cordeiro, J.; Cummings, K.S.; Cuttelod, A.; et al. The conservation status of the world’s freshwater molluscs. Hydrobiol. 2020, 1–24. [Google Scholar] [CrossRef]


| Year | Site | Type of Survey | Reference | Species Richness | Shannon’s Diversity | Combined Diversity |
|---|---|---|---|---|---|---|
| 1986 | B1 + B2 | Fish Survey | GSA (Unpublished report) | 33 | 0.69 | |
| 1994 | B1 | Mussel Qualitative | S. McGregor (Bearden et al. 2019) | 15 | ||
| 1995 | B1 | Mussel Qualitative | S. McGregor (Bearden et al. 2019) | 14 | ||
| 2009 | B1/B2 | Mussel Qualitative | AABC (Unpublished report) | 11/12 | 10 | |
| 2014 | B2 | Mussel Quantitative | AABC (Unpublished report) | 10 | 2.07 | |
| 2017 | B1 + B2 | Fish Survey | GSA and ADEM (Bearden et al. 2019) | 35 | 1.14 | |
| 2019 | B1/B2 | Mussel Quantitative and Qualitative | Current Study | 11/7 | 1.90/1.24 | 11 |
| Year | Land Cover | Open Water | Developed | Deciduous Forest | Evergreen Forest | Mixed Forest | Crops | Hay | Woody Wetlands | Emergent Herbaceous |
|---|---|---|---|---|---|---|---|---|---|---|
| 2001 | 3.08 | 0.79 | 3.99 | 9.89 | 10.02 | 8.48 | 42.76 | 18.31 | 2.67 | |
| 2004 | 3.64 | 1.60 | 4.00 | 11.12 | 10.26 | 8.68 | 39.65 | 17.34 | 3.70 | |
| 2006 | 3.59 | 1.62 | 3.95 | 12.34 | 10.32 | 9.00 | 38.28 | 18.14 | 2.76 | |
| 2008 | 3.59 | 1.65 | 3.66 | 12.81 | 10.08 | 9.56 | 37.56 | 17.88 | 3.20 | |
| 2011 | 3.59 | 1.68 | 3.59 | 13.42 | 10.09 | 10.12 | 36.17 | 17.53 | 3.82 | |
| 2013 | 3.51 | 1.67 | 3.81 | 13.91 | 10.42 | 10.17 | 35.53 | 18.28 | 2.71 | |
| 2016 | 3.25 | 1.69 | 3.71 | 13.87 | 10.57 | 10.98 | 34.77 | 18.32 | 2.84 |
| B1 | 1994 | 1995 | 2009 | 2014 | 2019 | ||||
|---|---|---|---|---|---|---|---|---|---|
| Species | Proportional Unionid Abundance (%) | Proportional Unionid Abundance (%) | Proportional Unionid Abundance (%) | Abundance | Proportional Unionid Abundance (%) | Mean Density (mussels/m2) | Abundance | Proportional Unionid Abundance (%) | Mean Density (mussels/m2) |
| Amblema plicata | 86.20 | 45.04 | 22.68 | 8 | 38.1 | 0.84 | |||
| Corbicula fluminea * | NA | NA | NA | 20 | NA | 2.12 | |||
| Cyclonaias asperata | 0.57 | 0.90 | 41.17 | 6 | 28.5 | 0.60 | |||
| Fusconaia cerina | 0 | 0 | 0.85 | 0 | 0 | 0 | |||
| Leptodea fragilis | 0.57 | 0.90 | 0.85 | 1 | 3.2 | 0.10 | |||
| Lampsilis ornata | 0.57 | 0 | 0.85 | 1 | 3.2 | 0.10 | |||
| Lampsilis teres | 2.29 | 0.90 | 0.85 | 0 | 0 | 0 | |||
| Obliquaria reflexa | 0.57 | 0.90 | 5.04 | 2 | 6.4 | 0.21 | |||
| Pleurobema decisum E | 1.14 | 0.90 | 1.68 | 0 | 0 | 0 | |||
| Potamilus purpuratus | 2.29 | 45.04 | 3.36 | 0 | 0 | 0 | |||
| Pyganodon grandis | 0.57 | 0.90 | 0.84 | 0 | 0 | 0 | |||
| Quadrula apiculata | 1.14 | 0.90 | 13.44 | 2 | 6.4 | 0.21 | |||
| Tritogonia verrucosa | 1.14 | 0.90 | 3.36 | 0 | 0 | 0 | |||
| Toxolasma parvum | 0 | 0 | 0 | 1 | 3.2 | 0.10 | |||
| Villosa lienosa | 1.14 | 0.90 | 1.68 | 0 | 0 | 0 | |||
| Total unionids | 174 | 110 | 118 | 21 ** | |||||
| B2 | |||||||||
| Corbicula fluminea | NA | NA | NA | NA | 64 | NA | 6.40 | ||
| Cyclonaias asperata | 2 | 8 | 20.51 | 0.72 | 3 | 50 | 0.30 | ||
| Fusconaia cerina | 0 | 1 | 2.56 | 0.08 | 0 | 0 | 0 | ||
| Lampsilis ornata | 0 | 2 | 5.12 | 0.16 | 0 | 0 | 0 | ||
| Lampsilis straminea | 8 | 0 | 0 | 0 | 0 | 0 | 0 | ||
| Lampsilis teres | 4 | 5 | 12.82 | 0.44 | 0 | 0 | 0 | ||
| Lasmigona alabamensis | 6 | 0 | 0 | 0 | 0 | 0 | 0 | ||
| Leptodea fragilis | 2 | 4 | 10.25 | 0.32 | 0 | 0 | 0 | ||
| Medionidus accutissimus | 2 | 0 | 0 | 0 | 0 | 0 | 0 | ||
| Megalonaias nervosa | 48 | 2 | 5.12 | 0.16 | 0 | 0 | 0 | ||
| Obliquaria reflexa | 0 | 0 | 0 | 0 | 1 | 16 | 0.10 | ||
| Pleurobema decisum E | NA | 5 | 12.82 | 0.44 | 0 | 0 | 0 | ||
| Potamilus purpuratus | 2 | 0 | 0 | 0 | 0 | 0 | 0 | ||
| Pyganodon grandis | 2 | 0 | 0 | 0 | 0 | 0 | 0 | ||
| Quadrula apiculata | 2 | 1 | 2.54 | 0.08 | 0 | 0 | 0 | ||
| Toxolasma parvum | 0 | 0 | 0 | 0 | 1 | 16 | 0.10 | ||
| Tritogonia verrucosa | 2 | 0 | 0 | 0 | 0 | 0 | 0 | ||
| Truncilla donaciformis | 2 | 2 | 5.12 | 0.16 | 0 | 0 | 0 | ||
| Villosa lienosa | 0 | 9 | 23.08 | 0.8 | 1 | 16 | 0.10 | ||
| Total unionids | 50 | 39 | 6 ** | ||||||
| Mussel Species | Host Fish Species | Host Fish Family | # Host Fish Species | # Host Fish Family | Host Fish Abundance | |||
|---|---|---|---|---|---|---|---|---|
| 1986 | 2017 | 1986 | 2017 | 1986 | 2017 | |||
| Amblema plicata | Cyprinella venusta , Lepomis cyanellus, L. gulosus, L. megalotis, L. macrochirus, Micropterus salmoides, Moxostoma erythurum, Percina caprodes, Pomoxis nigromaculatus | Centrarchidae, Percidae, Cyprinidae, Catostomidae | 5 | 9 | 3 | 4 | 74 | 112 |
| Cyclonaias asperata | Ictalurus punctuatus, Notorus leptacanthus | Ictaluridae | 1 | 2 | 1 | 1 | 3 | 12 |
| Lasmigona alabamensis | Unknown | |||||||
| Leptodea fragilis | Aplodinotus grunniens2 | |||||||
| Lampsilis ornata | M.salmoides | Centrarchidae | 1 | 1 | 1 | 1 | 1 | 3 |
| Lampsilis teres | L. cyanellus, L. gulosus, L. macrochirus. L. megalotis, M. salmoides, P. nigromaculatus | Centrarchidae | 3 | 6 | 1 | 1 | 13 | 29 |
| Obliquaria reflexa | L. chrysocephalus, M. salmoides | Centrarchidae, Cyprinidae | 2 | 2 | 2 | 2 | 14 | 4 |
| Pleurobema decisum | C. venusta, L. chrysocephalus | Centrarchidae | 2 | 1 | 73 | 82 | ||
| Quadrula apiculata | Unknown | |||||||
| Toxolasma parvum | Etheostoma nigrum, L. cyanellus, L. gulosus, L. macrochirus | Centrarchidae, Percidae | 2 | 4 | 1 | 1 | 5 | 26 |
| Villosa lienosa | L.cyanellus, L. megalotis. M. salmoides, I. punctuatus | Centrarchidae, Ictaluridae | 3 | 4 | 2 | 2 | 15 | 64 |
| Hamiota perovalis1 | Micropterus salmoides | Centrarchidae | 1 | 1 | 1 | |||
| Pyganodon grandis1 | L. macrochirus, M. salmoides, Dorosoma cepedianum, Ameiurus natalis, P. nigromacaulatus Lepomis cyanellus3 | Centrarchidae, Clupeidae, Ictaluridae | 4 | 3 | 4 | |||
| Potamilus purpuratus1 | Aplodinotus grunniens2Lepomis gulosus3 | Centrachidae | ||||||
| Tritogonia verrucosa1 | A. natalis, I. punctuactus, G. affinis, N. texanus3 | Ictaluridae, Poeciliidae | 2 | 2 | 14 | |||
| Total Number | 10 | 14 | 4 | 5 | ||||
Publisher’s Note: MDPI stays neutral with regard to jurisdictional claims in published maps and institutional affiliations. |
© 2021 by the authors. Licensee MDPI, Basel, Switzerland. This article is an open access article distributed under the terms and conditions of the Creative Commons Attribution (CC BY) license (http://creativecommons.org/licenses/by/4.0/).
Share and Cite
Sanchez Gonzalez, I.; Hopper, G.W.; Bucholz, J.; Atkinson, C.L. Long-Term Monitoring Reveals Differential Responses of Mussel and Host Fish Communities in a Biodiversity Hotspot. Diversity 2021, 13, 122. https://0-doi-org.brum.beds.ac.uk/10.3390/d13030122
Sanchez Gonzalez I, Hopper GW, Bucholz J, Atkinson CL. Long-Term Monitoring Reveals Differential Responses of Mussel and Host Fish Communities in a Biodiversity Hotspot. Diversity. 2021; 13(3):122. https://0-doi-org.brum.beds.ac.uk/10.3390/d13030122
Chicago/Turabian StyleSanchez Gonzalez, Irene, Garrett W. Hopper, Jamie Bucholz, and Carla L. Atkinson. 2021. "Long-Term Monitoring Reveals Differential Responses of Mussel and Host Fish Communities in a Biodiversity Hotspot" Diversity 13, no. 3: 122. https://0-doi-org.brum.beds.ac.uk/10.3390/d13030122