Article

Genetic Diversity and Population Structure of Two Endangered Neotropical Parrots Inform In Situ and Ex Situ Conservation Strategies

by
Carlos I. Campos
1,
Melinda A. Martinez
1,
Daniel Acosta
1,
Jose A. Diaz-Luque
2,
Igor Berkunsky
3,
Nadine L. Lamberski
4,
Javier Cruz-Nieto
5,
Michael A. Russello
6 and
Timothy F. Wright
1,*
1
Department of Biology, New Mexico State University, Las Cruces, NM 88003, USA
2
Fundación CLB (FPCILB), Estación Argentina, Calle Fermín Rivero 3460, Santa Cruz de la Sierra, Bolivia
3
Instituto Multidisciplinario sobre Ecosistemas y Desarrollo Sustenable, CONICET-Universidad Nacional del Centro de la Provincia de Buenos Aires, Tandil 7000, Argentina
4
San Diego Zoo Wildlife Alliance, San Diego, CA 92027, USA
5
Organización Vida Silvestre A.C. (OVIS), San Pedro Garza Garciá 66260, Mexico
6
Department of Biology, University of British Columbia, Kelowna, BC V1V 1V7, Canada
*
Author to whom correspondence should be addressed.
Submission received: 18 June 2021 / Revised: 9 August 2021 / Accepted: 11 August 2021 / Published: 17 August 2021

Abstract

:
A key aspect in the conservation of endangered populations is understanding patterns of genetic variation and structure, which can provide managers with critical information to support evidence-based status assessments and management strategies. This is especially important for species with small wild and larger captive populations, as found in many endangered parrots. We used genotypic data to assess genetic variation and structure in wild and captive populations of two endangered parrots, the blue-throated macaw, Ara glaucogularis, of Bolivia, and the thick-billed parrot, Rhynchopsitta pachyrhyncha, of Mexico. In the blue-throated macaw, we found evidence of weak genetic differentiation between wild northern and southern subpopulations, and between wild and captive populations. In the thick-billed parrot we found no signal of differentiation between the Madera and Tutuaca breeding colonies or between wild and captive populations. Similar levels of genetic diversity were detected in the wild and captive populations of both species, with private alleles detected in captivity in both, and in the wild in the thick-billed parrot. We found genetic signatures of a bottleneck in the northern blue-throated macaw subpopulation, but no such signal was identified in any other subpopulation of either species. Our results suggest both species could potentially benefit from reintroduction of genetic variation found in captivity, and emphasize the need for genetic management of captive populations.

1. Introduction

One important step in designing effective conservation plans for endangered species is the quantification of genetic diversity and population structure. Underlying genetic factors can have important ramifications on the susceptibility of wild populations to extinction [1,2], success or failure of captive breeding programs [3], and reintroductions of captive individuals to wild populations [4]. Many conservation plans focus on reintroducing captive individuals back into their native range [5]. Reintroductions can often benefit wild populations by increasing the amount of breeding individuals and raising the effective population size [6]. However, the result of reintroductions is not always favorable; such interventions may be detrimental and cause a reduction in the fitness of the population through increased inbreeding or introduction of deleterious alleles due to artificial selection to the captive environment [6,7,8]. To better understand whether a reintroduction event will lead to a desired result, the underlying genetics of both [9] wild and captive populations should be quantified.
Nearly half of all Neotropical parrots (Order Psittaciformes) are threatened with some level of extinction [10,11,12] due in large part to habitat loss and capture for the pet trade [13,14,15]. Neotropical parrots represent a special case for conservation because they are often found in large numbers in captivity due to an intensive pet trade that removes individuals from the wild and places them in zoos and private homes. As a result of this trade, captive populations may be as large as wild populations, or even larger, with the most extreme cases being ones such as the Spix’s macaw, Cyanopsitta spixii, which is extinct in the wild [16,17]. Properly managed captive populations aim to serve as a reservoir of genetic diversity or preserve unique genetic variants no longer detected in wild population(s) through selective breeding [18]. However, captive breeding programs may face unique challenges such as a reduction in genetic diversity due to small founder size [19], or increased inbreeding from incomplete pedigree data [20]. This situation makes it valuable to reconstruct patterns of genetic variation in both captive and wild populations.
One strategy that has often been debated for parrot conservation is the reintroduction of captive individuals into the wild [21]. One rationale for doing so is to reintroduce valuable gene variants back into declining populations [22]. However, this does not take into account some potential risks in doing so, including disease introduction [23] and behavioral issues affecting successful integration of released individuals [24]. One example of a successful reintroduction is that of the orange-bellied parrot, Neophema chrysogaster, in 2010 [25]. In this case reintroductions were deemed to be the best option as captive populations displayed novel genetic diversity not found in wild populations [26] and extinction in the wild was thought to be imminent. Alternatively, some reintroductions fail as was the case for releases of the thick-billed parrot, Rhynchopsitta pachyrhyncha, from 1986–1992 due to factors including poor condition of released birds that lead to to increased rates of predation and disease [27]. A metanalysis of parrot reintroductions showed that high predation rates, longer periods of supplementary food supply, and selection of high-quality release sites are some of the most important factors affecting reintroduction success [28].
Two parrot species that have disproportionally large captive populations relative to their remaining wild populations are the critically endangered blue-throated macaw, Ara glaucogularis, and the endangered thick-billed parrot. The blue-throated macaw is endemic to the tropical savannahs of the Beni region of Bolivia and is one of the most endangered species of macaws still found in the wild [10]. Population estimates over the last decade had placed an upper limit of 250 individuals in the wild divided into two subpopulations: a northern subpopulation to the east of the Mamoré river near Trinidad in the Mamoré province and a southern subpopulation near Loreto in the Marbán province [29]. With the addition of a recently discovered third subpopulation to the west of the Mamoré River in Yacuma and José Ballivián provinces, estimates for the global wild population have risen to 312–455 individuals [30]. The captive population is estimated to consist of approximately 1000 individuals throughout the private sector and zoos in North America, as recorded through the Association of Zoos and Aquariums (AZA)-recognized captive “studbook” (i.e., the official record of the pedigree and demographic history of all animals managed among AZA member institutions and their partners) [31]. Recent studies on the persistence of the wild blue-throated macaw population have suggested that the population is stable, with survival and breeding success of adults being the most influential aspect affecting population growth [32,33]. Current conservation strategies are aimed at increasing the long-term persistence of the wild population and include protection from poaching and predation, installation and monitoring of nest boxes, and the creation of the private Barba Azul Nature Reserve [29]. Future reintroductions are a goal of private breeding programs in Bolivia, the United States, Canada, and the United Kingdom.
The thick-billed parrot is found in the high-elevation forests of the Sierra Madre Occidental mountain range throughout the northern Mexican states of Sonora, Durango, and Chihuahua [34]. Population numbers for this species vary due to infrequent surveys and difficulties in accessing remote sites [35], but current estimates suggest between 2000–2800 mature individuals remain [34]. There is also a well-established captive population consisting of some 100 birds held at zoos that are managed as part of an AZA-recognized studbook, as well as an undetermined number of individuals in private hands [36]. Threats faced by the thick-billed parrot include habitat loss due to logging operations throughout its range as well as historical pet trade capture and shooting [37,38,39]. A recent study discovered evidence of increased rates of predation by bobcats and recommended increased antipredation methods at nesting sites [40]. Studies have suggested that reduction of logging and favorable ecological conditions in the thick-billed parrot habitat range are key to its recovery [41].
Both the blue-throated macaw and thick-billed parrot face similar challenges of low or declining populations in the wild and sizeable populations in captivity. Direct comparisons between the two species can be valuable to elucidate general patterns that other endangered species may be facing. Small population sizes may influence the long-term persistence of each species through increased inbreeding and susceptibility to demographic and environmental stochasticity [42]. Nonetheless, little is known about the underlying level of genetic diversity and population structure in the wild and captivity as well as the genetic consequences of recent population declines in both species. Quantifying these population genetic parameters can help to inform the best plan of action for each species moving forward.
Our project aims to improve understanding of blue-throated macaw and thick-billed parrot population genetics for aiding the conservation of these species. To achieve these goals, we genotyped individuals from wild and captive populations using panels of polymorphic microsatellite loci. We used these multi-locus genotypes to first test for the presence of genetic structure in wild and captive populations of each species. We then quantified the genetic diversity of all populations (wild and captive) and tested for signatures of a population bottleneck in the wild population of each species. We subsequently used these results to assess the suitability of reintroductions from the captive to wild populations from a standpoint of genetic diversity and health.

2. Materials and Methods

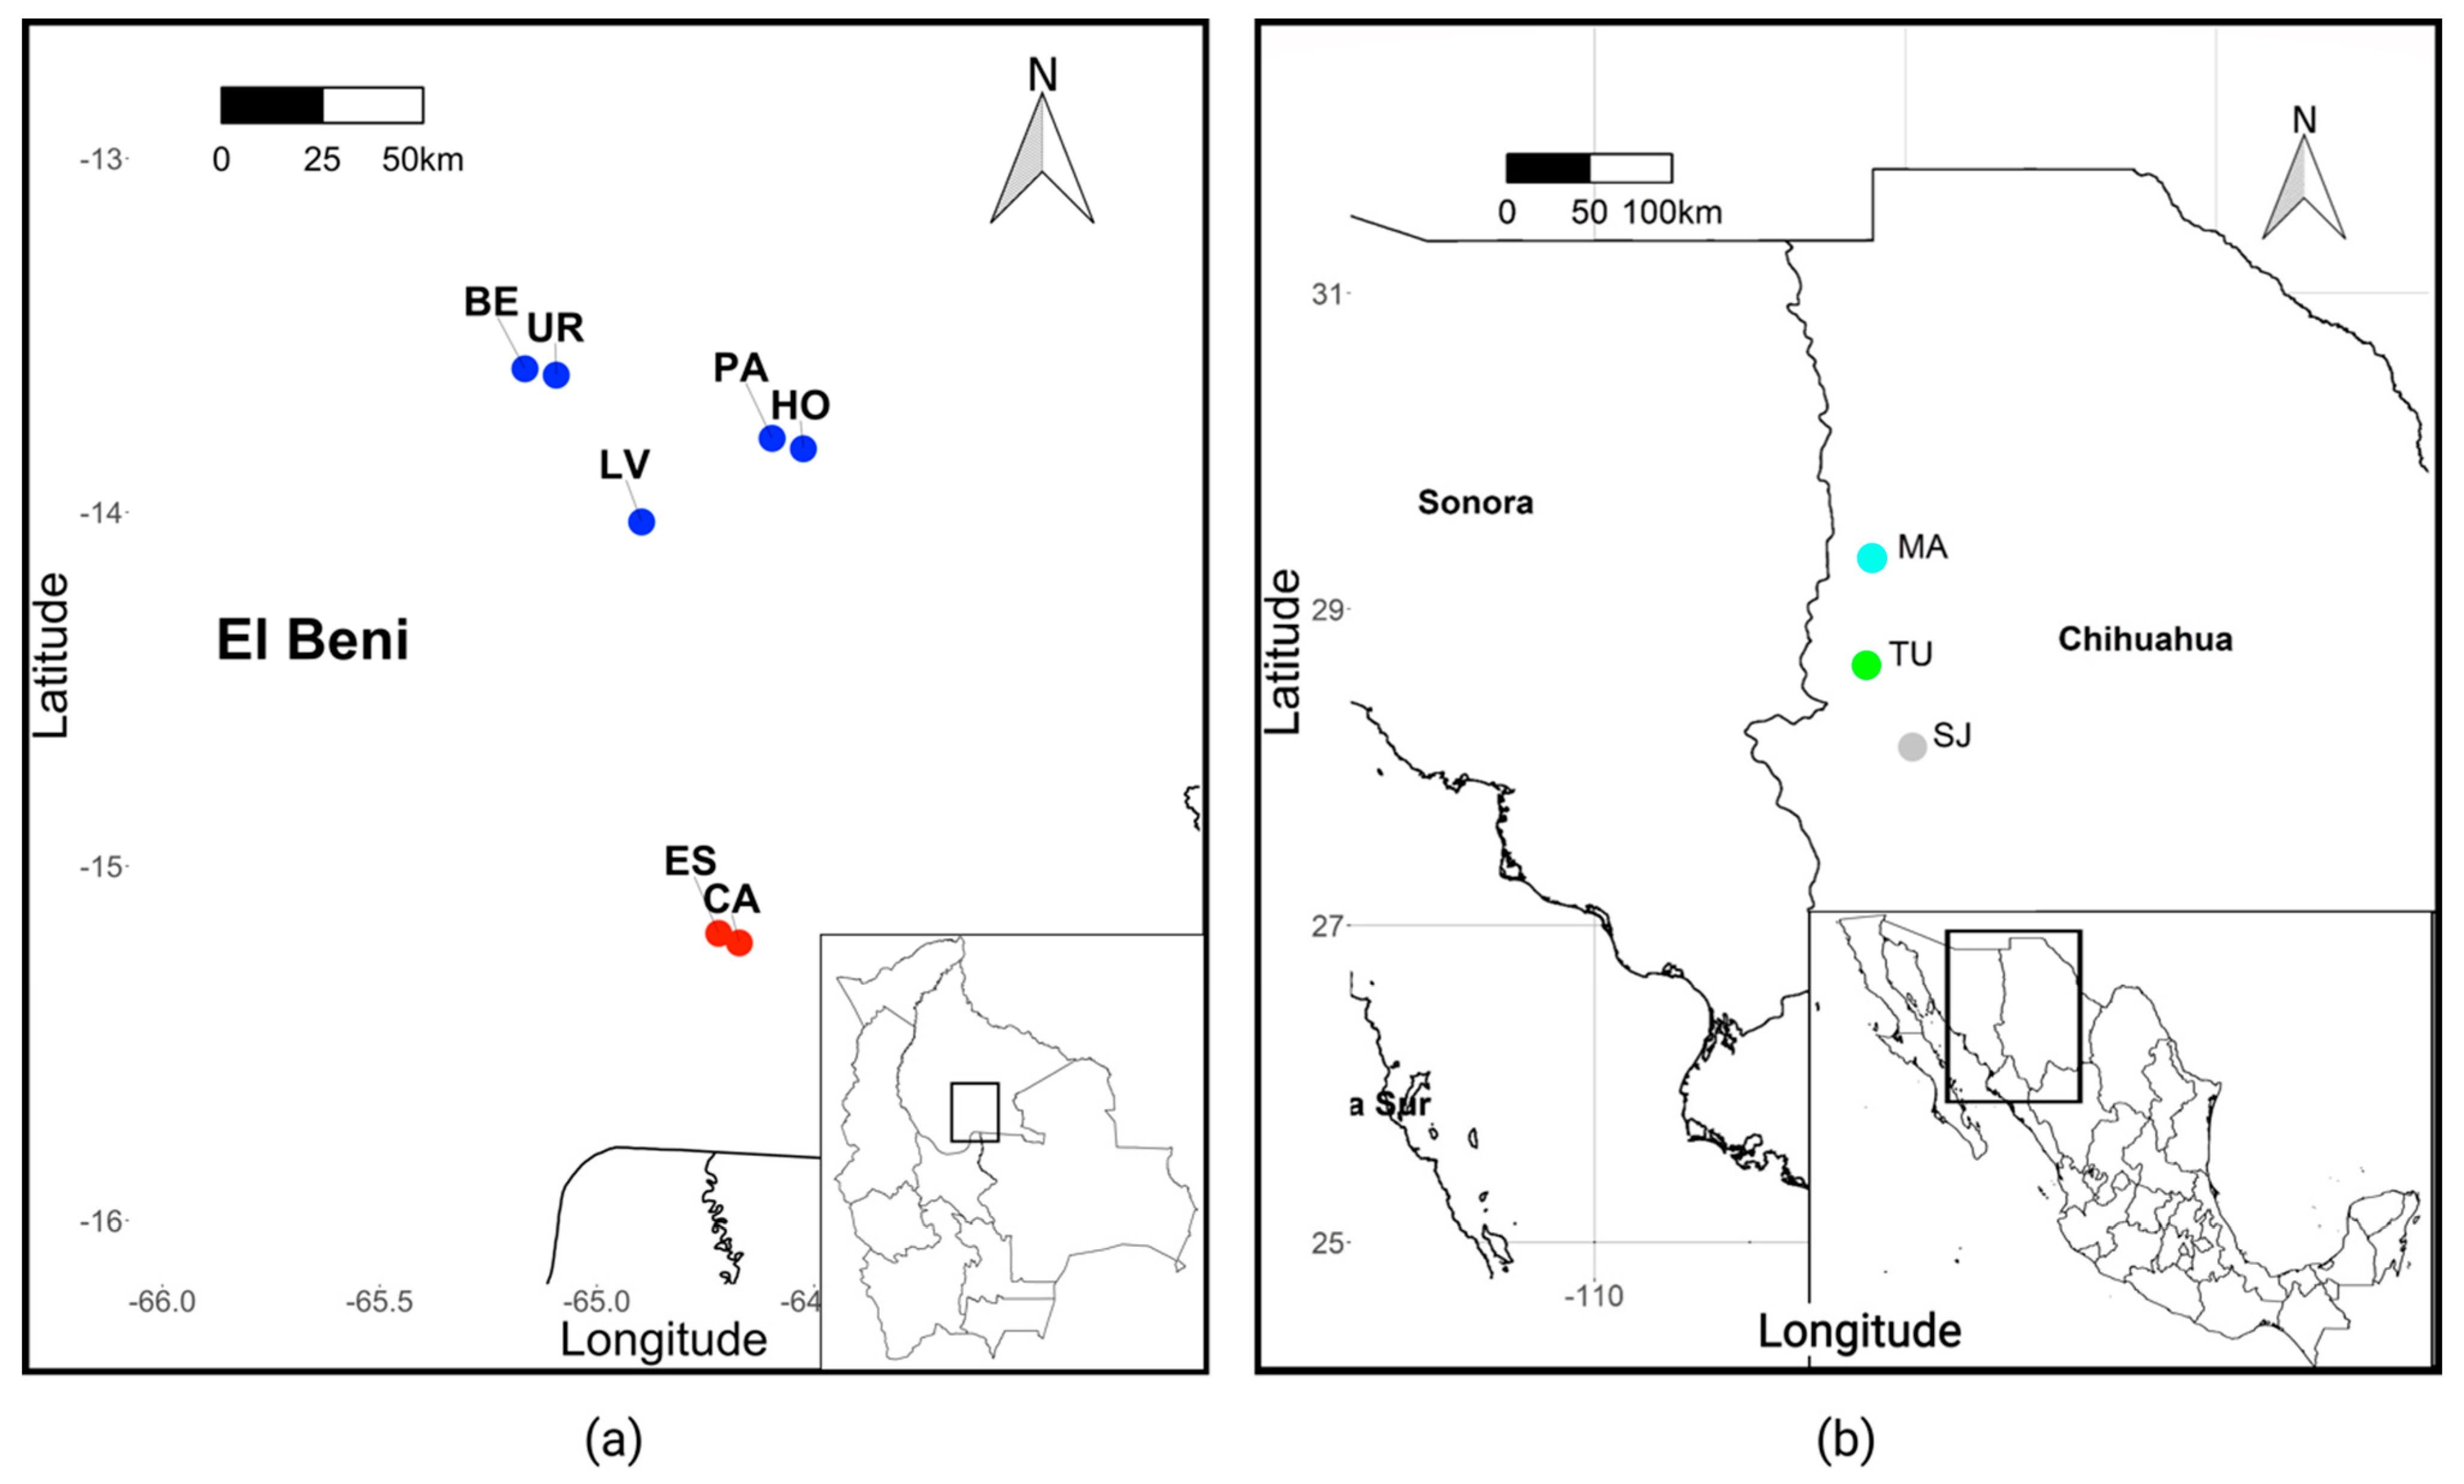
2.1. Sample Collection

All procedures were approved by New Mexico State University (NMSU) Institutional Animal Care and Use Committee (protocols: thick-billed parrot 2007-07 and 2008-028; blue-throated macaw 2015-033 and 2018-025). Samples were exported under CITES permits (blue-throated macaw: Bolivian export 001128 and USA import US15671C/9; thick-billed parrot: Mexico export MX43843 and USA import 06US118407/9).
Blood samples were collected from 60 wild blue-throated macaws from the northern and southern subpopulations in Bolivia from 2007–2017 (Figure 1, Supplementary Materials Table S1) and 46 wild thick-billed parrots from three nesting colonies in Mexico from 2007–2009 (Figure 1, Supplementary Materials Table S1). Individuals sampled in the northern part of the blue-throated macaw range came from the northeastern subpopulation and not the newly discovered northwestern population; here we refer to these samples simply as the northern subpopulation. Blood samples were taken from 60 captive blue-throated macaws held in zoos in the United States, Canada, and Bolivia and 73 captive thick-billed parrots held in zoos in the United States (Supplementary Materials Table S2). All Bolivian blood samples were mixed with lysis buffer and stored at room temperature short-term and at −80 °C long-term. All other blood samples were stored on FTA paper (WhatmanTM) at room temperature.

2.2. DNA Extraction

We used two methods of DNA extraction depending on the sample medium. DNA was extracted from blood stored in lysis buffer using the Qiagen DNeasy Blood and Tissue Kit (Qiagen, Valencia, Santa Clarita, CA, USA) following the standard protocol for extraction from nucleated erythrocytes (https://www.qiagen.com (accessed on 20 September 2017)). DNA extraction from blood stored on FTA paper was performed following a standard WhatmanTM elution protocol [43].

2.3. Microsatellite Genotyping

Microsatellite primers developed for the scarlet macaw, Ara macao [44], were tested for their cross-amplification and variability in a subset of captive blue-throated macaws. A panel of 12 of these primers were chosen for use in this study based on consistent amplification and presence of multiple alleles. Separately, we tested microsatellites for the thick-billed parrot from an array of primers developed for several parrot species including the blue-and-yellow macaw, Ara ararauna [45], monk parakeet, Myiopsitta monachus [46], burrowing parrot, Cyanoliseus patagonus [47], and previously unpublished primers for the thick-billed parrot [48,49] (Supplementary Materials Table S3). We selected 11 of these primers for use in this study.
Each forward primer was labelled with a fluorescent dye and PCR was carried out in a 15 µL reaction with the following concentrations: 2.5 mM MgCl, 10× Gold PCR Buffer, 0.3 U AmpliTaq GoldTM (ThermoFisher Scientific), 8 mM dNTP’s, 1–3 µL DNA template (1:10 dilution of DNA extract), and water to dilute. The reaction was carried out with an initial denaturation of 95 °C for 25 s followed by 30 touchdown cycles with annealing temperature starting at 60 °C and decreasing 0.5 °C per cycle, the reaction ended with five final annealing cycles at 45 °C and an extension at 72 °C for 10 min. PCR products were purified using the QIAquick PCR purification kit (Qiagen, Valencia, Santa Clarita, CA, USA), following the multi-well PCR purification protocol. Purified PCR products from the blue-throated macaw were sent to the UTEP Genomic Analysis Core Facility for fragment analysis on an ABI 3500 Genetic Analyzer and allele scoring was performed in Geneious R8.1.7 (http://www.geneious.com accessed on 24 January 2018). Purified PCR fragments from the thick-billed parrot were analyzed on an ABI 3100 Genetic Analyzer at NMSU and allele scoring was performed in GeneMapper v3.5 (ABI). All PCR fragments were analyzed twice to confirm results obtained from scoring.
For all loci, MICRO-CHECKER v2.2.3 [50] was used to check for the presence of null alleles, large allele dropout, and scoring errors. Some wild samples were obtained from different individuals at the same nest. To eliminate bias from the presence of first-order relatives in the analysis we used data from field observations to identify potential parent–offspring and full sibling relationships in each species wild sample pool. The associated studbook for each species’ captive population was used to identify first-order relatives in the captive population via the construction of a captive pedigree using the R package kinship2 [51]. We then used ML-RELATE [52] as a secondary measure to confirm that none of the remaining individuals in any population were first-order relatives. We randomly removed one of each pair of first-order relatives to create a reduced dataset for each species. Global deviations from Hardy–Weinberg equilibrium and linkage disequilibrium between all locus pairs (Markov chain parameters: 1000 randomizations, 100 batches, and 1000 iterations per batch) were tested in Genepop 4.7 [53].

2.4. Population Structure and Genetic Diversity

We used the Bayesian clustering approach implemented in STRUCTURE v2.3 [54] to infer putative population structure in our wild datasets. Using the admixture model and the LOCPRIOR option, we tested a range of population numbers (K) from 1 to 10 using 10 independent Markov Chain Monte Carlo (MCMC) runs of 500,000 repetitions and a burn-in period of 500,000. Results were evaluated using STRUCTURE HARVESTER [55]. To infer the optimal K value, we employed the ∆K method [56] and the plotting of the log probability of the data [57] to assess where ln Pr(X|K) plateaued (see STRUCTURE manual). CLUMPP [58] and DISTRUCT [59] were used to create plots of the STRUCTURE results. Self-assignment rates of individuals to the population from which they were sampled were determined as implemented in GenAlEx v6.5 [60]. We also used this analysis to assign captive individuals to the referenced wild subpopulations. We investigated evidence for first-generation migrants between wild subpopulations using the approach of [61] as implemented in GENECLASS2 [62]. Principal Coordinates Analysis (PCoA) plots were generated for each species from genetic distances as implemented in GenAlEx v6.5. Pairwise Fst values among populations were calculated in GenAlEx v6.5 and p-values were calculated in Hierfstat [63]. We used GenAlEx v6.5 to calculate the number of alleles, number of private alleles, observed heterozygosity, and expected heterozygosity for each locus.

2.5. Demographic History

The presence of a recent population bottleneck in the wild subpopulations was determined using the heterozygote excess test [64] with significance determined using the Sign test and the Wilcoxon signed-rank test (1000 iterations) implemented in BOTTLENECK v1.2.02 [65]. We used the assumptions of a two-phase and stepwise microsatellite mutation model. For the two-phase model, estimates in birds suggest 60 to 80% of mutations occur via a stepwise change [66,67]. Therefore, we used the assumption of either 60 or 80% stepwise mutation for the analysis using this model.

3. Results

3.1. Microsatellite Validation

We genotyped a total of 120 blue-throated macaws at 12 microsatellite loci for this study. Four individuals did not amplify at any locus and were excluded from further analysis. For the remaining individuals, amplification success rates per locus varied from 70 to 97% (Supplementary Materials Table S4). Using field observations, the captive pedigree (Supplementary Materials Figure S1), and ML-Relate, 31 wild and 37 captive individuals were judged to be first-order relatives of other birds in the study (Supplementary Materials Table S5a–c) and were removed to create the reduced dataset used in all remaining analyses. MicroChecker detected no evidence of null alleles in this reduced dataset. Loci SCMA12 and SCMA34 were removed due to levels of missing data exceeding 24%. There was no evidence of deviation from Hardy–Weinberg or linkage equilibria for the remaining loci. After the removal of first-order relatives, the dataset included 48 blue-throated macaws (19 wild and 29 captive) genotyped at 10 microsatellite loci with 3.95% missing data.
We genotyped a total of 119 thick-billed parrots at 11 microsatellite loci. Four samples were deemed to be duplicates of another individual already in the study and two other samples were removed due to unrecorded sample origin. Only one individual was sampled from the San Juanito subpopulation; because we could not perform any population-level comparative analyses with a single individual we excluded this sample from further analysis. For the remaining individuals, amplification success rate per locus varied from 93 to 99% (Supplementary Materials Table S4). Using field observations, the captive pedigree (Supplementary Materials Figure S1), and ML-Relate, 31 wild and 39 captive thick-billed parrots were deemed to be first-order relatives with other birds in the study (Supplementary Materials Table S6a–c) and were removed to create the reduced dataset which was used for all remaining analyses. In this reduced dataset there was evidence of null alleles at locus MmGT090, which was subsequently removed from further analyses. There was no deviation from Hardy–Weinberg or linkage equilibria for the remaining loci. As a result, our dataset contained 42 individuals (15 wild and 27 captive) at 10 microsatellite loci with 2.85% missing data.

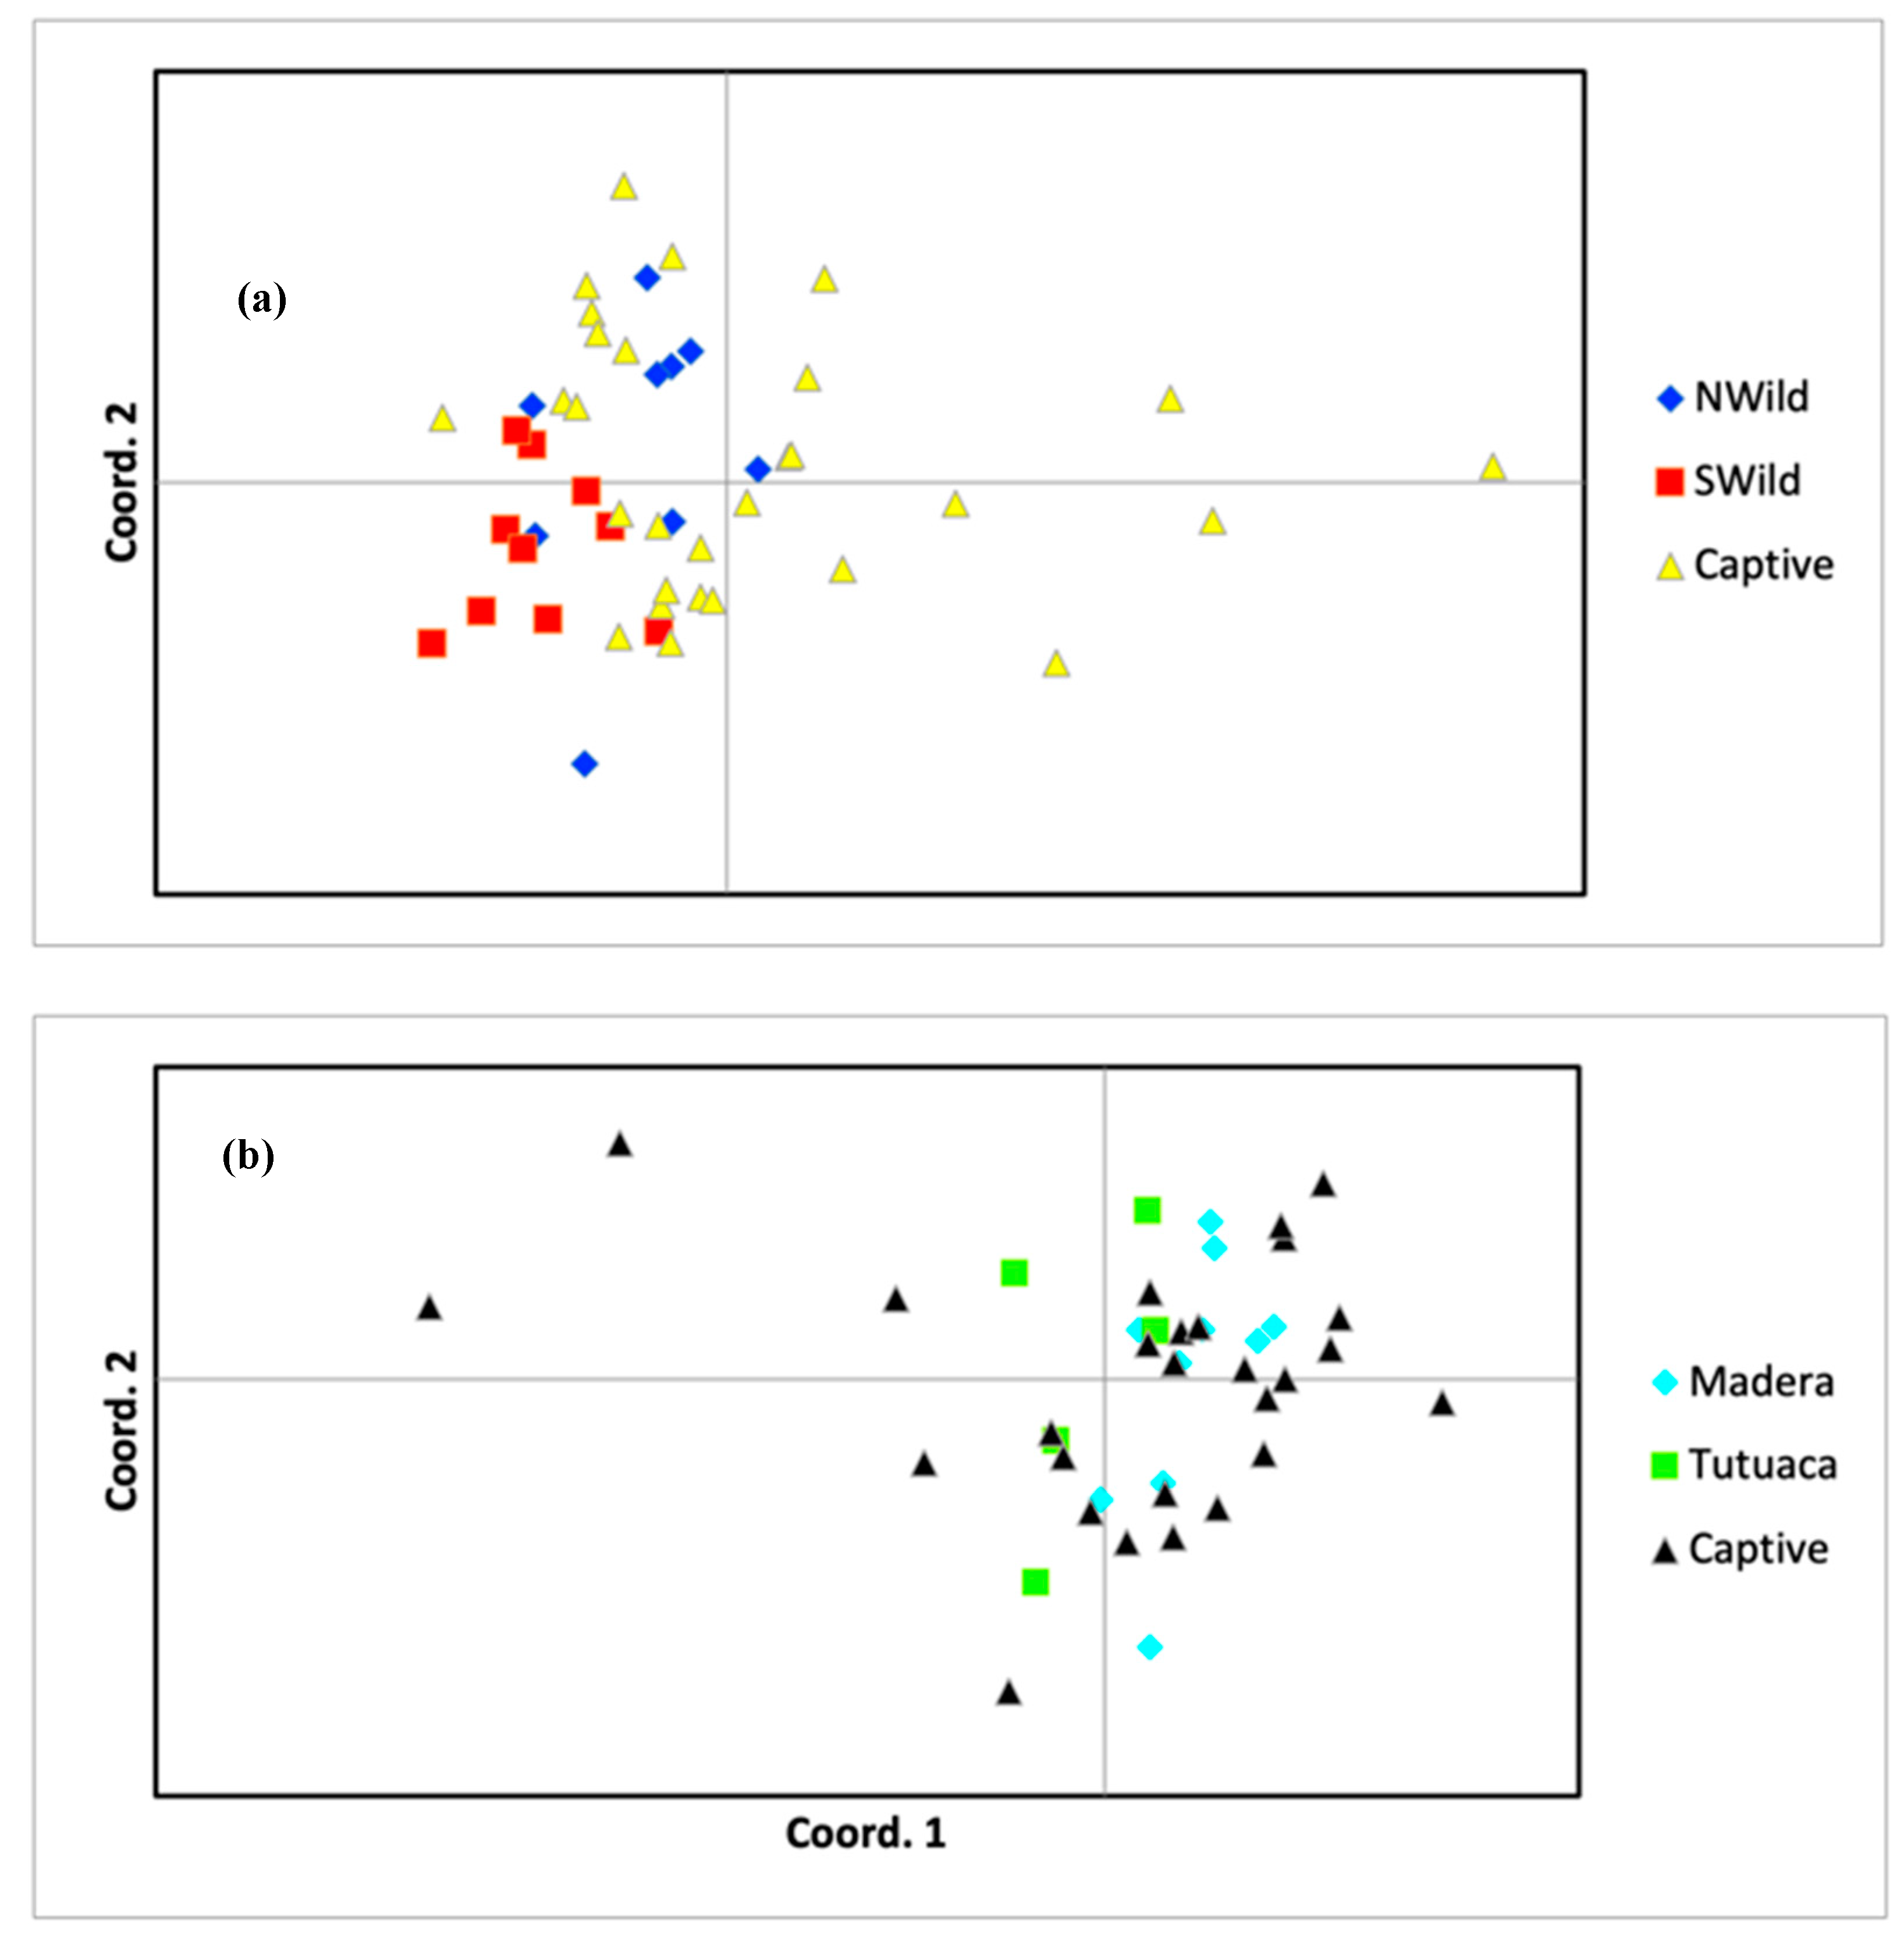
3.2. Population Structure

We found evidence for weak, but significant, population differentiation between the northern and southern subpopulations of the wild blue-throated macaw as evidenced by a pairwise Fst value of 0.048 (p-value < 0.016; Table 1) and significant evidence of genotypic differentiation (chi2 = infinity, p-value = highly sign.). Likewise, 94% of individuals self-assigned to the subpopulation in which they were sampled (Supplementary Materials Table S7), and no first-generation migrants (i.e., individuals not born in their current subpopulation) were detected. However, Bayesian clustering analysis did not find evidence for K > 1 based on ΔK or the plot of the log probability of the data (Supplementary Materials Table S8).
All individuals in the blue-throated macaw captive population were assigned to either the northern (n = 22) or southern (n = 7) wild subpopulation. The pairwise Fst value was significant between the captive population and the southern wild subpopulation but not between the captive population and the northern wild subpopulation. Approximately 16.3% of variation in the blue-throated macaw data was explained by the first two coordinates of the PCoA; the resulting ordination plot suggested that the captive population contained genetic diversity not found in either wild subpopulation (Figure 2). Furthermore, we detected 16 private alleles in the captive population that were not present in either wild population.
We found no evidence of population differentiation between the Madera and Tutuaca subpopulations of the thick-billed parrot (Table 1). Similarly, Bayesian clustering analysis did not find evidence for K > 1 based on ΔK or the plot of the log probability of the data (Supplementary Materials Table S8). Self-assignment to the subpopulation in which an individual was sampled was low (74%; Table S7), however, no first-generation migrants were detected.
All individuals in the thick-billed parrot captive population were assigned to either the Madera (n = 21) or Tutuaca (n = 6) subpopulation. Pairwise Fst values between the captive and wild populations were not significant (Table 1). Approximately 21.6% of variation in the thick-billed parrot data was explained by the first two coordinates of the PCoA; the resulting ordination plot of these two dimensions revealed little evidence of differentiation between the wild and captive populations (Figure 2). We did detect eight private alleles in the captive population and four in the entire wild population.

3.3. Genetic Diversity of Captive and Wild Populations

Mean observed heterozygosity for wild blue-throated macaws was 0.578 and 0.660 for the northern and southern subpopulations, respectively, while allelic richness ranged from 4.1–4.4 (5.5 combined). Both wild subpopulations exhibited negative inbreeding coefficients, although the northern population was not significantly different from 0 (Table 2). Mean observed heterozygosity for the captive population was similar to the wild (0.618), however, allelic richness was higher (7.0) and the inbreeding coefficient was slightly positive (0.025), but not significantly different from 0.
Mean observed heterozygosity for wild thick-billed parrots was 0.610 and 0.560 for the Madera and Tutuaca subpopulations, respectively, while allelic richness ranged from 3.6–4.2 (4.9 combined). Both wild subpopulations exhibited negative inbreeding coefficients, although that of the Tutuaca subpopulation was not significantly different from 0 (Table 2). Mean observed heterozygosity (0.573), allelic richness (5.3), and inbreeding coefficient (−0.060) for the captive population were both similar to values recovered for the wild subpopulations (Table 2).

3.4. Demographic History

To detect evidence of a recent population bottleneck, we implemented the sign test and Wilcoxon signed-rank test in the program BOTTLENECK. Both wild subpopulations of the blue-throated macaw were tested independently. Although BOTTLENECK recommends population sizes of 10 or greater individuals, we chose to test our northern wild (n = 9) subpopulation as well. The thick-billed parrot subpopulations were combined into a single population as no significant evidence of population structure between them was detected. We found evidence of a recent population bottleneck in the northern subpopulation of the blue-throated macaw under the 60% stepwise assumption of two-phase model (Wilcoxon 1-tail: p = 0.009; Wilcoxon 2-tail: p = 0.018) and the 80% stepwise assumption of the two-phase model (Wilcoxon 1-tail: p = 0.016, Wilcoxon 2-tail: 0.032). None of the other tests revealed evidence of a bottleneck in either species (Table 3).

4. Discussion

Here, we investigated the underlying genetic diversity and structure of the critically endangered blue-throated macaw and endangered thick-billed parrot. Similar levels of genetic diversity were detected between the wild and captive populations of both species, with only allelic richness in the wild blue-throated macaw population being measurably less (5.5) than found in captivity (7.0). Private alleles were detected in captivity for both species. We found evidence of weak population differentiation both between the two wild subpopulations of the blue-throated macaw, and among the blue-throated macaw wild and captive populations. We found no evidence of population differentiation between any populations of the thick-billed parrot. We recovered weak evidence of a recent population bottleneck in the northern wild subpopulation of the blue-throated macaw with four of eight total tests returning significant evidence of a bottleneck and no evidence of a recent population bottleneck in the thick-billed parrot. Below, we discuss these results in more depth and their implications for ongoing conservation efforts.

4.1. Population Structure

We found that the wild subpopulations of blue-throated macaws exhibited a low amount of genetic distinctiveness as evidenced by significant Fst values, high self-assignment to the location from which individuals were sampled, and from private allele tests. However, this level of differentiation was not high enough to be detected by Bayesian clustering analysis. Thick-billed parrot subpopulations showed no significant evidence of differentiation between any population pair. One of the problems that many parrot species face is habitat fragmentation [68]. As reviewed in [69], habitat fragmentation caused by humans has led to population differentiation in several species of parrots while undisturbed habitat tends to promote gene flow between populations. The presence of population structure in the blue-throated macaw and not the thick-billed parrot may be indicative of a stronger effect of human-caused habitat fragmentation in the former species, as well as its smaller estimated population size. Alternatively, population structure may arise from social factors promoting high philopatry, as suggested for the cooperatively breeding El Oro parakeet, Pyrrhura orcesi, of Ecuador [70] and the colonially breeding red-fronted macaw, Ara rubrogenys, of Bolivia [71]. The lack of population differentiation in the thick-billed parrot may also be explained by the migratory nature of the species. The thick-billed parrot undergoes seasonal migration from breeding sites in northern Chihuahua to overwintering sites in central Mexico. This migration event has been thought to be a contributor to the lack of geographic variation in vocalizations in thick-billed parrots [37] and could also promote gene flow among populations. An additional consideration in our findings of genetic structure is the influence of the extensive time period over which samples were collected. This is especially important in the blue-throated macaw, where sampling efforts occurred over the span of ten years. It is possible that the genetic structure of initially sampled populations in 2007 could be different from that of the most recent efforts in 2017 and this may have influenced our findings.
One limitation in our ability to detect population differentiation may be low sample size. We sampled over 100 individuals from each species, however, each dataset was reduced to less than 50 individuals due to relatedness. Further sampling efforts for the blue-throated macaw could lead to the addition of individuals from the recently discovered northwestern population in the Yacuma and José Ballivián provinces [30], which may uncover novel population structure not currently observed in our sample. Likewise, thick-billed parrot sampling could be expanded to include new individuals from captivity and other breeding colonies in the wild as our most recent sampling of thick-billed parrots was in 2008.
The detection of private alleles and the lack of PCoA clustering suggests that the captive populations contain genetic variation not sampled in the wild populations of each species. Similarly, private alleles in both captive and wild populations have been observed in the critically endangered orange-bellied parrot [26]. Novel genetic diversity in each population can prove critical when extinction appears imminent in the wild. If absolutely necessary, taking in new individuals as fledglings from declining wild populations can bolster genetic diversity in captivity which, in turn, may help the success of captive releases [25]. Conversely, reintroductions of captive-bred individuals into the wild could potentially reintroduce genetic variants back to locations from which they originally derived, as seen in the Mauritius parakeet, Psittacula eques, where genetic panmixia was restored with relatively small-scale reintroductions [72,73].

4.2. Genetic Diversity

Low levels of genetic diversity have long been associated with factors such as increased inbreeding [74], and fixation of deleterious mutations [75] in small populations. We found overall levels of genetic diversity within the populations of each species [blue-throated macaw (mean Ho range: 0.578–0.660) and thick-billed parrot (mean Ho range 0.560–0.610) that were comparable to other members of the order Psittaciformes with heightened conservation status, including the critically endangered swift parrot, Lathamus discolor (population size = ~2400; mean Ho = 0.679; [76,77] and subspecies of the near-threatened Cuban amazon, Amazona leucocephala (population size = ~23,000; mean Ho range 0.64–0.77; [9,78], but higher than the critically endangered kakapo, Strigops habroptilus (population size = ~116, mean Ho = 0.489; [79,80]. While heterozygosity values may not be directly comparable across studies, all of the cited works used microsatellite loci which provide a general sense of relative levels of genetic variation across a range of threatened and endangered parrot species.
The similarity in genetic diversity of the blue-throated macaw and thick-billed parrot raises interesting comparisons of these species’ natural and human-impacted history. Historically, human-mediated range decline and poaching have been the two major threats faced by both species. The blue-throated macaw relies on palms as a food source and for breeding [81], and suffered a drastic population decline during the 1970s and 1980s due to poaching for the pet trade. The thick-billed parrot also has a specific association with high-elevation pine forest habitat [39], but the extent of historical poaching is thought to have been lower. In contrast, the critically endangered kakapo historically faced different threats, including high rates of predation from cats [82] and introduced rats, Rattus rattus [83].
Our results show that neither the blue-throated macaw nor the thick-billed parrot are experiencing significant levels of inbreeding with a population average inbreeding coefficient range of −0.186 to 0.025 and −0.116 to −0.022, respectively, and with the highest values recorded in the southern population of the blue-throated macaw. It is important to note that we removed 68 blue-throated macaws and 70 thick-billed parrots from our study as they were either known to be, or statistically defined as, first-order relatives of other individuals in the sampling pool. Therefore, true levels of inbreeding in the entire population may be higher than our estimates and there may be substantial family structure within each population. High inbreeding levels have been shown to increase deleterious effects such as reduced clutch size, as seen in the kakapo [84], and hatching failure, as observed in the Puerto Rican parrot, Amazona vittata [85].
While microsatellites can provide estimates of genetic diversity and population structure, they are selectively neutral and do not provide information about functional genetic variation. On the other hand, while the number of individuals sampled in our study was small, it was likely representative given that it encompassed a sizeable proportion of the known populations for each parrot species in question.

4.3. Demographic History

We found evidence of a significant population bottleneck in the Northern wild subpopulation of the blue-throated macaw. However, we should note that this result was detected in a sample of nine individuals, which is less than that recommended (n ≥ 10) for the heterozygote excess test implemented in BOTTLENECK. Although preliminary, our finding is still notable, as bottlenecks could potentially have a negative impact on population fitness through reduced genetic diversity and increased inbreeding [86,87]. Severe inbreeding in the wild could also be a concern if the release of unrelated captive individuals leads to outbreeding depression [88] which has been found to increase disease susceptibility in song sparrows, Melospiza melodia [89]. Importantly, no evidence of increased hatching failure has been detected in the blue-throated macaw [10], suggesting that while the population size is small, this species may not yet be suffering from detectable deleterious effects of inbreeding.

4.4. Conservation Implications

Our estimates of genetic diversity and population structure in wild and captive populations of the blue-throated macaw and thick-billed parrot should help inform conservation efforts in both species (but see [90]). While protection of key habitats and resources have been the primary focus of conservation efforts to date for both species, reintroductions and translocations have also been considered as approaches for bolstering wild populations [86]. Our genetic findings suggest that introduction of variants currently found in the captive populations of each species could be beneficial should such reintroductions be deemed necessary by population managers. For the blue-throated macaw, managers should be mindful of the limited structure we detected in the wild population and consider the origin of captive individuals if planning any reintroductions so as to find the best fit population for release of any given individual. In contrast, we found no differentiation in the wild population of the thick-billed parrot, suggesting that any reintroductions can be designed to maximize the enhancement of genetic diversity across the entire wild population.
Although we evaluate the suitability of captive populations for each species for use in reintroductions, these significant interventions should only be considered after comprehensive feasibility and risk assessments have been conducted and balanced by consideration of costs and benefits relative to other conservation actions [91]. In the meantime, the ex situ management programs of the blue-throated macaw and thick-billed parrot should strive to maintain genetic diversity and minimize kinship in the captive populations so as to maximize their current and future value for the conservation of these two iconic parrot species.

Supplementary Materials

The following are available online at https://0-www-mdpi-com.brum.beds.ac.uk/article/10.3390/d13080386/s1, Table S1: Wild sampling information for the blue-throated macaw and thick-billed parrot, Table S2: Captive sampling information for the blue-throated macaw and thick-billed parrot, Table S3: Previously unpublished primer sequences developed for the thick-billed parrot, Table S4: Primer success rate in PCR for blue-throated macaw and thick-billed parrot, Table S5a–c: Relatedness values of individuals from the blue-throated macaw from MLRelate, Table S6a–c: Relatedness values of individuals from the thick-billed parrot from MLRelate Table S7: Proportions of self-assignment of wild and captive individuals to the wild populations, Table S8: Evanno Table output from STRUCTURE Harvester based on 10 iterations of STRUCTURE output and number of clusters (K) ranging from 1 to 10. Figure S1: Captive pedigrees for the blue-throated macaw and thick-billed parrot.

Author Contributions

Project conception and presentation: T.F.W., M.A.R.; Bolivian sample collection and metadata management: I.B., J.A.D.-L.; Mexican sample collection and metadata management: N.L.L., J.C.-N.; blue-throated macaw and thick-billed parrot data collection and analysis: C.I.C., M.A.M., D.A.; manuscript preparation: C.I.C.; initial revisions: T.F.W., M.A.R., C.I.C.; final manuscript revisions: all. All authors have read and agreed to the published version of the manuscript.

Funding

Funding for this project has been provided by Parrot Action Grants from the World Parrot Trust to T.F.W. and M.A.R.

Institutional Review Board Statement

The use of animals in this study was approved by the Institutional Animal Care and Use Committee of New Mexico State University (protocols 2007-07, 2008-028, 2015-033 and 2018-025). Samples were exported under authority from CITES (blue-throated macaw: Bolivian export 001128 and USA import US15671C/9; thick-billed parrot: Mexico export MX43843 and USA import 06US118407/9).

Data Availability Statement

The data presented in this study are openly available in Dryad at https://0-doi-org.brum.beds.ac.uk/10.5061/dryad.jq2bvq897.

Acknowledgments

D.A. and C.I.C. were supported by the NMSU-HHMI Research Scholars program (Howard Hughes Medical Institute) and M.A.M. was supported by NMSU’s NRCT Career Tracks program (USDA). Samples from Bolivia were collected under the approval of the General Direction of Biodiversity and Protected Areas for a scientific project authorized to the Centro Biodiversidad Genética from University Mayor San Simón. We would like to thank the staff of the Border Biomedical Research Center (BBRC) Genomics Analysis Core Facility for services and facilities provided, Valerie Brewer for assistance with PCR, Grace Smith-Vidaurre for help constructing sample maps, and Kari Schmidt and George Amato of the American Museum of Natural History for sharing two unpublished primer pairs for the thick-billed parrot. Thank you to studbook managers Gen Anderson (BTM) and Susan Healy (TBP). Thank you to all individuals involved in sample collection, especially Amy Chalbot, Gareth Morgan, Marcelo Ruiz, and Mario Daniel Zambrana. Thank you to all institutions who provided samples of captive individuals including: African Lion Safari, Akron Zoo, Albuquerque Zoo, Dallas World Aquarium, Ft. Worth Zoo, Living Desert Zoo, Moody Gardens, Natural Encounters Zoo, Phoenix Zoo, Pinola Conservancy, Riverbanks Zoo, Sacramento Zoo, San Diego Wild Animal Park, San Diego Zoo, Santa Cruz Zoo, Sedgewick Zoo, St. Augustine Alligator Farm, and Tulsa Zoo.

Conflicts of Interest

The authors declare no conflict of interest.

References

  1. Frankham, R. Genetics and extinction. Biol. Conserv. 2005, 126, 131–140. [Google Scholar] [CrossRef]
  2. Palstra, F.; Ruzzante, D. Genetic estimates of contemporary effective population size: What can they tell us about the importance of genetic stochasticity for wild population persistence? Mol. Ecol. 2008, 17, 3428–3447. [Google Scholar] [CrossRef]
  3. Witzenberger, K.A.; Hochkirch, A. Ex situ conservation genetics: A review of molecular studies on the genetic consequences of captive breeding programmes for endangered animal species. Biodiv. Conserv. 2011, 20, 1843–1861. [Google Scholar] [CrossRef]
  4. Haig, S.M.; Ballou, J.D.; Derrickson, S.R. Management options for preserving genetic diversity: Reintroduction of guam rails to the wild. Conserv. Biol. 1990, 4, 290–300. [Google Scholar] [CrossRef]
  5. Seddon, P.; Armstrong, D.; Maloney, R. Developing the science of reintroduction biology. Conserv. Biol. 2007, 21, 303–312. [Google Scholar] [CrossRef]
  6. Hedrick, P.W.; Garcia-Dorado, A. Understanding inbreeding depression, purging, and genetic rescue. Trends Ecol. Evol. 2016, 31, 940–952. [Google Scholar] [CrossRef]
  7. Briskie, J.V.; Mackintosh, M. Hatching failure increases with severity of population bottlenecks in birds. Proc. Natl. Acad. Sci. USA 2004, 101, 558–561. [Google Scholar] [CrossRef] [Green Version]
  8. Frankham, R.; Hendry, H.; Margan, S.; Briscoe, D. Does equalization of family sizes reduce genetic adaption to captivity? Anim. Conserv. 2006, 3, 357–363. [Google Scholar] [CrossRef]
  9. Milián-García, Y.; Jensen, E.L.; Madsen, J.; Álvarez Alonso, S.; Serrano Rodríguez, A.; Espinosa López, G.; Russello, M.A. Founded: Genetic reconstruction of lineage diversity and kinship informs ex situ conservation of cuban amazon parrots (Amazona leucocephala). J. Hered. 2015, 106, 573–579. [Google Scholar] [CrossRef] [PubMed] [Green Version]
  10. Berkunsky, I.; Daniele, G.; Kacoliris, F.P.; Díaz-Luque, J.A.; Silva Frias, C.P.; Aramburu, R.M.; Gilardi, J.D. Reproductive parameters in the critically endangered blue-throated macaw: Limits to the recovery of a parrot under intensive management. PLoS ONE 2014, 9, e99941. [Google Scholar] [CrossRef] [PubMed]
  11. Clarke, R.; By, R. Poaching, habitat loss and the decline of neotropical parrots: A comparative spatial analysis. J. Exp. Criminol. 2013, 9, 333–353. [Google Scholar] [CrossRef]
  12. Collar, N.J. Globally threatened parrots: Criteria, characteristics and cures. Int. Zoo Yearb. 2000, 37, 21–35. [Google Scholar] [CrossRef]
  13. The IUCN Red List of Threatened Species. Available online: https://www.iucnredlist.org (accessed on 18 July 2021).
  14. Berkunsky, I.; Quillfeldt, P.; Brightsmith, D.J.; Abbud, M.C.; Aguilar, J.M.R.E.; Alemán-Zelaya, U.; Aramburú, R.M.; Arce-Arias, A.; Balas-McNab, R.; Balsby, T.J.S.; et al. Current threats faced by Neotropical parrot populations. Biol. Conserv. 2017, 214, 278–287. [Google Scholar] [CrossRef] [Green Version]
  15. Wright, T.; Toft, C.; Enkerlin-Hoeflich, E.; Gonzalez-Elizondo, J.; Albornoz, M.; Rodríguez-Ferraro, A.; Rojas-Suárez, F.; Sanz D’Angelo, V.; Trujillo, A.; Beissinger, S.; et al. Nest poaching in neotropical parrots. Conserv. Biol. 2001, 15, 710–720. [Google Scholar] [CrossRef]
  16. Watson, R. International Studbook: Annual Report and Recommendations for 2011, Spix’s Macaw (Cyanopsitta spixii); Al Wabra Wildlife Preservation: Al Shahaniya, Qatar, 2011. [Google Scholar]
  17. BirdLife International. Cyanopsitta spixii. Available online: http://datazone.birdlife.org/species/factsheet/spixs-macaw-cyanopsitta-spixii (accessed on 18 July 2021).
  18. Ballou, J.D.; Lacy, R.C. Identifying genetically important individuals for management of genetic diversity in captive populations. In Population Management for Survival and Recovery; Ballou, J.D., Gilpin, M., Foose, T.J., Eds.; Columbia University Press: New York, NY, USA, 1995; pp. 76–111. [Google Scholar]
  19. Jamieson, I.G. Founder effects, inbreeding, and loss of genetic diversity in four avian reintroduction programs. Conserv. Biol. 2011, 25, 115–123. [Google Scholar] [CrossRef] [PubMed]
  20. Lutaaya, B.E.; Misztal, I.; Bertrand, J.K.; Mabry, J.W. Inbreeding in populations with incomplete pedigrees. J. Anim. Breed. Genet. 1999, 116, 475–480. [Google Scholar] [CrossRef]
  21. Collar, N.J. Parrot reintroduction: Towards a synthesis of best practice. In Proceedings of the 6th International Parrot Convention, Loro Parque, Puerto de la Cruz, Tenerife, Spain, 27–30 September 2006; pp. 82–107. [Google Scholar]
  22. Ebenhard, T. Conservation breeding as a tool for saving animal species from extinction. Trends Ecol. Evol. 1995, 10, 438–443. [Google Scholar] [CrossRef]
  23. Viggers, K.L.; Lindenmayer, D.; Spratt, D. The importance of disease in reintroduction programmes. Wildl. Res. 1993, 20, 687–698. [Google Scholar] [CrossRef]
  24. McPhee, M. Generations in captivity increases behavioral variance: Considerations for captive breeding and reintroduction programs. Biol. Conserv. 2004, 115, 71–77. [Google Scholar] [CrossRef]
  25. Morrison, C.E.; Johnson, R.N.; Grueber, C.E.; Hogg, C.J. Genetic impacts of conservation management actions in a critically endangered parrot species. Conserv. Genet. 2020, 21, 869–877. [Google Scholar] [CrossRef]
  26. Coleman, R.; Weeks, A. Population Genetics of the Endangered Orange-Bellied Parrot (Neophema chrysogaster): Project Update; University of Melbourne: Melbourne, Australia, 2013. [Google Scholar]
  27. Snyder, N.F.R.; Koenig, S.E.; Koschmann, J.; Snyder, H.A.; Johnson, T.B. Thick-billed parrot releases in Arizona. Condor 1994, 96, 845–862. [Google Scholar] [CrossRef]
  28. White, T.H.; Collar, N.J.; Moorhouse, R.J.; Sanz, V.; Stolen, E.D.; Brightsmith, D.J. Psittacine reintroductions: Common denominators of success. Biol. Conserv. 2012, 148, 106–115. [Google Scholar] [CrossRef]
  29. BirdLife International. Ara Glaucogularis. Available online: https://dx.doi.org/10.2305/IUCN.UK.2018-2.RLTS.T22685542A130868462.en (accessed on 1 June 2021).
  30. Herzog, S.K.; Maillard, Z.O.; Boorsma, T.; Sánchez-Ávila, G.; García-Solíz, V.H.; Paca-Condori, A.C.; De Abajo, M.V.; Soria-Auza, R.W. First systematic sampling approach to estimating the global population size of the critically endangered blue-throated macaw Ara glaucogularis. Bird Conserv. Int. 2021, 31, 293–311. [Google Scholar] [CrossRef]
  31. Anderson, G. North American Regional Studbook for the Blue-Throated Macaw (Ara glaucogularis); St. Augustine Alligator Farm Zoological Park: St. Augustine, FL, USA, 2017. [Google Scholar]
  32. Maestri, M.L.; Ferrati, R.; Berkunsky, I. Evaluating management strategies in the conservation of the critically endangered Blue-throated Macaw (Ara glaucogularis). Ecol. Model. 2017, 361, 74–79. [Google Scholar] [CrossRef]
  33. Strem, R.; Bouzat, J. Population viability analysis of the blue-throated macaw (Ara glaucogularis) using individual-based and cohort-based PVA programs. Open Conserv. Biol. J. 2012, 6, 12–24. [Google Scholar] [CrossRef] [Green Version]
  34. BirdLife International. Rhynchopsitta Pachyrhyncha (Amended Version of 2016 Assessment). Available online: https://0-dx-doi-org.brum.beds.ac.uk/10.2305/IUCN.UK.2017-1.RLTS.T22685766A110475642.en (accessed on 1 June 2021).
  35. U.S. Fish and Wildlife Service. Thick-Billed Parrot (Rhynchopsitta pachyrhyncha) Recovery Plan Addendum; U.S. Fish and Wildlife Service, Southwest Region: Albuquerque, NM, USA, 2013.
  36. Putnam, A. Thick-Billed Parrot (Rhynchopsitta pachyrhyncha) AZA Species Survival Plan; San Diego Zoo Global: San Diego, CA, USA, 2014. [Google Scholar]
  37. Guerra, J.E.; Cruz-Nieto, J.; Ortiz-Maciel, S.G.; Wright, T.F. Limited geographic variation in the vocalizations of the endangered thick-billed parrot: Implications for conservation strategies. Condor 2008, 110, 639–647. [Google Scholar] [CrossRef] [PubMed] [Green Version]
  38. Monterrubio-Rico, T.C.; Enkerlin-Hoeflich, E. Present use and characteristics of thick-billed parrot nest sites in northwestern Mexico. J. Field Ornithol. 2004, 75, 96–103. [Google Scholar] [CrossRef]
  39. Snyder, N.F.; Enkerlin-Hoeflich, E.C.; Cruz-Nieto, M.A.; Valdes-Peña, R.A.; Ortiz-Maciel, S.G.; Cruz-Nieto, J. Thick-billed parrot (rhynchopsitta pachyrhyncha). In Birds of the World, 1st ed.; Billerman, S.M., Ed.; Cornell Lab of Ornithology: Ithaca, NY, USA, 2020. [Google Scholar]
  40. Sheppard, J.K.; Rojas, J.I.G.; Cruz, J.; GonzÁLez, L.F.T.; Nieto, M.Á.C.; Lezama, S.D.J.; Juarez, E.A.; Lamberski, N. Predation of nesting thick-billed parrots Rhychopsitta pachyrhyncha by bobcats in northwestern Mexico. Bird Conserv. Int. 2020, 1–9. [Google Scholar] [CrossRef]
  41. Monterrubio-Rico, T.C.; Charre-Medellin, J.F.; Sáenz-Romero, C. Current and future habitat availability for thick-billed and maroon-fronted parrots in northern Mexican forests. J. Field Ornithol. 2015, 86, 1–16. [Google Scholar] [CrossRef]
  42. Frankham, R. Inbreeding and extinction: A threshold effect. Conserv. Biol. 1995, 9, 792–799. [Google Scholar] [CrossRef]
  43. GE Healthcare Life Sciences. Whatman™ FTA Elute™. Available online: https://at.vwr.com/assetsvc/asset/de_AT/id/17887357/contents (accessed on 20 September 2017).
  44. Olah, G.; Heinsohn, R.G.; Espinoza, J.R.; Brightsmith, D.J.; Peakall, R. An evaluation of primers for microsatellite markers in scarlet macaw (Ara macao) and their performance in a Peruvian wild population. Conserv. Genet. Resour. 2015, 7, 157–159. [Google Scholar] [CrossRef]
  45. Caparroz, R.; Miyaki, C.Y.; Baker, A.J. Characterization of microsatellite loci in the blue-and-gold macaw, Ara ararauna (Psittaciformes: Aves). Mol. Ecol. Notes 2003, 3, 441–443. [Google Scholar] [CrossRef]
  46. Russello, M.A.; Saranathan, V.; Buhrman-Deever, S.; Eberhard, J.; Caccone, A. Characterization of polymorphic microsatellite loci for the invasive monk parakeet (Myiopsitta monachus). Mol. Ecol. Notes 2007, 7, 990–992. [Google Scholar] [CrossRef]
  47. Klauke, N.; Masello, J.F.; Quillfeldt, P.; Segelbacher, G. Isolation of tetranucleotide microsatellite loci in the burrowing parrot (Cyanoliseus patagonus). J. Ornithol. 2009, 150, 921–924. [Google Scholar] [CrossRef] [Green Version]
  48. Schmidt, K.; Amato, G. Thick-Billed Parrot Primers. 2009; unpublished. [Google Scholar]
  49. Acosta, D. Development and Characterization of Microsatellite Markers for the Endangered Thick-Billed Parrot (Rhynchopsitta pachyrhyncha); New Mexico State University: Las Cruces, NM, USA, 2009. [Google Scholar]
  50. Van Oosterhout, C.; Hutchinson, W.; Wills, D.; Shipley, P. MICRO-CHECKER: Software for identifying and correcting genotyping errors in microsatellite data. Mol. Ecol. Notes 2004, 4, 535–538. [Google Scholar] [CrossRef]
  51. Sinnwell, J.P.; Therneau, T.M.; Schaid, D.J. The kinship2 R package for pedigree data. Hum. Hered. 2014, 78, 91–93. [Google Scholar] [CrossRef] [Green Version]
  52. Kalinowski, S.; Wagner, A.; Taper, M. ML-RELATE: A computer program for maximum likelihood estimation of relatedness and relationship. Mol. Ecol. Notes 2006, 6, 576–579. [Google Scholar] [CrossRef]
  53. Raymond, M.; Rousset, F. GENEPOP (version-1.2)—Population-genetics software for exact tests and ecumenicsim. J. Hered. 1995, 86, 248–249. [Google Scholar] [CrossRef]
  54. Falush, D.; Stephens, M.; Pritchard, J.K. Inference of population structure using multilocus genotype data: Linked loci and correlated allele frequencies. Genetics 2003, 164, 1567–1587. [Google Scholar] [CrossRef]
  55. Earl, D.; Vonholdt, B. STRUCTURE HARVESTER: A website and program for visualizing STRUCTURE output and implementing the Evanno method. Conserv. Genet. Resour. 2012, 4, 359–361. [Google Scholar] [CrossRef]
  56. Evanno, G.; Regnaut, S.; Goudet, J. Detecting the number of clusters of individuals using the software structure: A simulation study. Mol. Ecol. 2005, 14, 2611–2620. [Google Scholar] [CrossRef] [PubMed] [Green Version]
  57. Pritchard, J.; Mj, S.; Donnelly, P.J. Inference of population structure using multilocus genotype data. Genetics 2000, 155, 945–959. [Google Scholar] [CrossRef] [PubMed]
  58. Jakobsson, M.; Rosenberg, N. CLUMPP: A cluster matching and permutation program for dealing with label switching and multimodality in analysis of population structure. Bioinformatics 2007, 23, 1801–1806. [Google Scholar] [CrossRef] [PubMed] [Green Version]
  59. Rosenberg, N. DISTRUCT: A program for the graphical display of population structure. Mol. Ecol. Notes 2004, 4, 137–138. [Google Scholar] [CrossRef]
  60. Peakall, R.; Smouse, P. GenAlEx 6.5: Genetic analysis in excel. Population genetic software for teaching and research-an update. Bioinformatics 2012, 28, 2537–2539. [Google Scholar] [CrossRef] [PubMed] [Green Version]
  61. Paetkau, D.; Slade, R.; Burden, M.; Estoup, A. Genetic assignment methods for the direct, real-time estimation of migration rate: A simulation-based exploration of accuracy and power. Mol. Ecol. 2004, 13, 55–65. [Google Scholar] [CrossRef]
  62. Piry, S.; Alapetite, A.; Cornuet, J.; Paetkau, D.; Baudouin, L.; Estoup, A. GENECLASS2: A software for genetic assignment and first-generation migrant detection. J. Hered. 2004, 95, 536–539. [Google Scholar] [CrossRef]
  63. Goudet, J. hierfstat, a package for R to compute and test hierarchical F-statistics. Mol. Ecol. Notes 2005, 5, 184–186. [Google Scholar] [CrossRef] [Green Version]
  64. Cornuet, J.M.; Luikart, G. Description and power analysis of two tests for detecting recent population bottlenecks from allele frequency data. Genetics 1996, 144, 2001–2014. [Google Scholar] [CrossRef]
  65. Piry, S.; Luikart, G.; Cornuet, J.M. BOTTLENECK: A computer program for detecting recent reductions in the effective population size using allele frequency data. J. Hered. 1999, 90, 502–503. [Google Scholar] [CrossRef]
  66. Beck, N.; Double, M.; Cockburn, A. Microsatellite evolution at two hypervariable loci revealed by extensive avian pedigrees. Mol. Biol. Evol. 2003, 20, 54–61. [Google Scholar] [CrossRef] [Green Version]
  67. Miller, M.; Haig, S.; Mullins, T.; Popper, K.; Green, M. Evidence for population bottlenecks and subtle genetic structure in the yellow rail. Condor 2012, 114, 100–112. [Google Scholar] [CrossRef]
  68. Vergara-Tabares, D.L.; Cordier, J.M.; Landi, M.A.; Olah, G.; Nori, J. Global trends of habitat destruction and consequences for parrot conservation. Glob. Chang. Biol. 2020, 26, 4251–4262. [Google Scholar] [CrossRef]
  69. Russello, M.A.; Smith-Vidaurre, G.; Wright, T.F. Genetics of invasive parrot populations. In Naturalized Parrots of the World: Distribution, Ecology, and Impacts of the World’s Most Colorful Colonizers; Pruitt-Jones, S., Ed.; Princeton University Press: Princeton, NJ, USA, 2021. [Google Scholar]
  70. Klauke, N.; Schaefer, H.M.; Bauer, M.; Segelbacher, G. Limited dispersal and significant fine - scale genetic structure in a tropical montane parrot species. PLoS ONE 2016, 11, e0169165. [Google Scholar] [CrossRef] [Green Version]
  71. Blanco, G.; Morinha, F.; Roques, S.; Hiraldo, F.; Rojas, A.; Tella, J.L. Fine-scale genetic structure in the critically endangered red-fronted macaw in the absence of geographic and ecological barriers. Sci. Rep. 2021, 11, 556. [Google Scholar] [CrossRef]
  72. Raisin, C.; Frantz, A.C.; Kundu, S.; Greenwood, A.G.; Jones, C.G.; Zuel, N.; Groombridge, J.J. Genetic consequences of intensive conservation management for the Mauritius parakeet. Conserv. Genet. 2012, 13, 707–715. [Google Scholar] [CrossRef]
  73. Tollington, S.; Jones, C.G.; Greenwood, A.; Tatayah, V.; Raisin, C.; Burke, T.; Dawson, D.A.; Groombridge, J.J. Long-term, fine-scale temporal patterns of genetic diversity in the restored Mauritius parakeet reveal genetic impacts of management and associated demographic effects on reintroduction programmes. Biol. Conserv. 2013, 161, 28–38. [Google Scholar] [CrossRef]
  74. Lacy, R.; Petric, A.; Warneke, M. Inbreeding and outbreeding depression in captive populations of wild animals. In The Natural History of Inbreeding and Outbreeding: Theoretical and Empirical Perspectives; Thornhill, N.W., Ed.; University of Chicago Press: Chicago, IL, USA, 1993. [Google Scholar]
  75. Lande, R. Anthropogenic, ecological and genetic factors in extinction and conservation. Popul Ecol. 1998, 40, 259–269. [Google Scholar] [CrossRef]
  76. Stojanovic, D.; Olah, G.; Webb, M.; Peakall, R.; Heinsohn, R. Genetic evidence confirms severe extinction risk for critically endangered swift parrots: Implications for conservation management. Anim. Conserv. 2018, 21, 313–323. [Google Scholar] [CrossRef]
  77. BirdLife International. Lathamus Discolor. Available online: https://0-dx-doi-org.brum.beds.ac.uk/10.2305/IUCN.UK.2018-2.RLTS.T22685219A130886700.en (accessed on 1 June 2021).
  78. BirdLife International. Amazona Leucocephala. Available online: https://0-dx-doi-org.brum.beds.ac.uk/10.2305/IUCN.UK.2020-3.RLTS.T22686201A179212864.en (accessed on 1 June 2021).
  79. Bergner, L.M.; Jamieson, I.G.; Robertson, B.C. Combining genetic data to identify relatedness among founders in a genetically depauperate parrot, the Kakapo (Strigops habroptilus). Conserv. Genet. 2014, 15, 1013–1020. [Google Scholar] [CrossRef]
  80. BirdLife International. Strigops Habroptila. Available online: https://0-dx-doi-org.brum.beds.ac.uk/10.2305/IUCN.UK.2018-2.RLTS.T22685245A129751169.en (accessed on 1 June 2021).
  81. Yamashita, C.; Barros, Y.M. The Blue-throated Macaw (Ara glaucogularis), characterization of its distinctive habitat in the savannas of Beni, Bolivia. Ararajuba 1997, 5, 141–150. [Google Scholar]
  82. Clout, M.N.; Merton, D.V. Saving the kakapo: The conservation of the world’s most peculiar parrot. Bird Conserv. Int. 1998, 8, 281–296. [Google Scholar] [CrossRef] [Green Version]
  83. Collar, N.; Sharpe, C.J.; Boesman, P.F.D. Kakapo (Strigops habroptila). In Birds of the World, 1st ed.; del Hoyo, J., Elliott, A., Sargatal, J., Christie, D.A., de Juana, E., Eds.; Cornell Lab of Ornithology: Ithaca, NY, USA, 2020. [Google Scholar]
  84. White, K.L.; Eason, D.K.; Jamieson, I.G.; Robertson, B.C. Evidence of inbreeding depression in the critically endangered parrot, the kakapo. Anim. Conserv. 2015, 18, 341–347. [Google Scholar] [CrossRef]
  85. Beissinger, S.R.; Wunderle, J.M.; Meyers, J.M.; Sæther, B.E.; Engen, S. Anatomy of a bottleneck: Diagnosing factors limiting population growth in the Puerto Rican parrot. Ecol. Monogr. 2008, 78, 185–203. [Google Scholar] [CrossRef] [Green Version]
  86. Frankham, R.; Ballou, J.D.; Briscoe, D.A. Introduction to Conservation Genetics; Cambridge University Press: Cambridge, UK, 2002. [Google Scholar]
  87. Shields, W.M. The natural and unnatural history of inbreeding and outbreeding. In The Natural History of Inbreeding and Outbreeding; Thornhill, N.W., Ed.; University of Chicago Press: Chicago, IL, USA, 1993; pp. 143–169. [Google Scholar]
  88. Edmands, S. Between a rock and a hard place: Evaluating the relative risks of inbreeding and outbreeding for conservation and management. Mol. Ecol. 2007, 16, 463–475. [Google Scholar] [CrossRef]
  89. Marr, A.B.; Keller, L.F.; Arcese, P. Heterosis and outbreeding depression in descendants of natural immigrants to an inbred population of song sparrows (Melospiza melodia). Evolution 2002, 56, 131–142. [Google Scholar] [CrossRef]
  90. Herzog, S.; Bürger, J.; Troncoso, A.; Vargas-Rodriguez, R.; Boorsma, T.; Soria-Auza, R.W. Deterministic population growth models and conservation translocation as a management strategy for the critically endangered blue-throated macaw (Ara glaucogularis): A critique of Maestri et al. Ecol. Model. 2018, 388, 145–148. [Google Scholar] [CrossRef]
  91. IUCN/SSP. Guidelines for Reintroductions and Other Conservation Translocations; Version 1.0; IUCN Species Survival Commission: Gland, Switzerland, 2013; p. 57. [Google Scholar]
Figure 1. (a) Wild blue-throated macaw Bolivian sample sites. Northern subpopulation = blue; southern subpopulation = red. Sampling sites (individuals sampled): ES = Esperancita (25), BE = Bethel (9), HO = Holanda (8), LV = La Verde (6), PA = Palma Sola (5), CA = Cantina (5); UR = Urkupina (2). (b) Wild thick-billed parrot sampling sites. MA = Madera (37); TU = Tutuaca (8); SJ = San Juanito (1).
Diversity 13 00386 g001
Figure 2. Principal coordinates analysis (PCoA) between genetic distance of captive, northern wild, and southern wild populations in the (a) blue-throated macaw and whole captive and wild populations in the (b) thick-billed parrot. Plots based on the reduced datasets with first order relatives removed (see Methods).
Diversity 13 00386 g002
Table 1. Pairwise Fst values for the blue-throated macaw and thick-billed parrot. p-values denoted by: * = p-value < 0.05; ** = p-value < 0.016. NA denotes comparisons that cannot be made between a population and one of the subpopulations that compose it.
Blue-Throated MacawThick-Billed Parrot
PopulationCaptiveNorth WildSouth WildPopulationCaptiveMaderaTutuaca
Captive- Captive-
North Wild0.026- Madera0.017-
South Wild0.047 **0.048 **-Tutuaca0.0450.053-
Whole Wild0.025 *NANAWhole Wild0.014NANA
Table 2. Estimates of population genetic parameters for the blue-throated macaw and thick-billed parrot including number of individuals (N), number of alleles (Na), observed heterozygosity (Ho), expected heterozygosity (He), and inbreeding coefficient (F).
Blue-Throated Macaw
LocusCaptiveNorth WildSouth WildWhole Wild
NNaHoHeFNNaHoHeFNNaHoHeFNNaHoHeF
SCMA09 [25]2920.0340.034−0.0189100NA1020.2000.180−0.1111920.1050.100−0.056
SCMA46 [25]2790.8520.846−0.007970.8890.821−0.0831050.7000.725−0.0341970.7890.8120.027
SCMA19 [25]2390.6090.6350.026950.6670.7280.0851020.5000.455−0.0991950.5790.6140.056
SCMA31 [25]2580.8000.8140.017970.7780.8150.0451060.8000.740−0.0811980.7890.8120.027
SCMA41 [25]28100.7500.8390.106970.7780.765−0.0161081.0000.820−0.22019100.8950.820−0.091
SCMA27 [25]2960.7590.707−0.072940.4440.6480.3141020.7000.455−0.5381940.5790.6110.052
SCMA11 [25]2820.1790.2190.184920.1110.105−0.0591020.4000.320−0.2501920.2630.229−0.152
SCMA22 [25]2850.6790.668−0.015920.4440.4440.0001020.5000.455−0.0991920.4740.450−0.052
SCMA26 [25]29100.7240.8250.122950.8890.735−0.2101080.9000.805−0.1181990.8950.817−0.095
SCMA02 [25]2570.8000.731−0.094950.7780.7160.0861040.9000.655−0.3741960.8420.720−0.169
Mean (SE)2770.618 (0.089)0.631 (0.088)0.025 (0.028)94.50.578 (0.100)0.578 (0.094)−0.001 (0.046)104.10.660 (0.081)0.561 (0.069)−0.186 (0.053)195.50.621 (0.087)0.598 (0.082)−0.045 (0.026)
Thick-billed parrot
LocusCaptiveMaderaTutuacaWhole Wild
NNaHoHeFNNaHoHeFNNaHoHeFNNaHoHeF
UnaCT74 [26]2530.1200.114−0.0491020.1000.095−0.053530.2000.4600.5651530.1330.2400.444
UnaCT21 [26]2630.5000.5360.0661030.7000.505−0.386520.4000.320−0.2501530.6000.464−0.292
UnaCT55 [26]2780.8150.767−0.0631070.7000.7000.000550.8000.680−0.1761570.7330.702−0.044
UnaCT43 [26]2520.1200.114−0.0641020.1000.095−0.053510.0000.000NA1520.0670.064−0.034
TBP2−39 [29]27100.7780.684−0.1361070.9000.785−0.146561.0000.800−0.25015100.9330.856−0.091
TBP2−61 [29]2540.6400.578−0.1071040.9000.625−0.440530.6000.460−0.3041550.8000.616−0.300
Rhpac149 [30]2650.6540.604−0.0821050.6000.7000.143540.8000.700−0.1431550.6670.7220.077
Rhpac074 [30]2580.8000.766−0.0441050.9000.690−0.304550.8000.680−0.1761570.8670.744−0.164
MmGT057 [27]2630.5000.452−0.1061020.5000.495−0.010520.4000.4800.1671520.4670.4910.050
CyanP05 [28]2670.8080.794−0.0171050.7000.7650.085550.6000.6800.1181550.6670.7710.135
Mean (SE)265.30.573 (0.084)0.541 (0.079)−0.060 (0.018)104.20.610 (0.095)0.546 (0.081)−0.116 (0.063)53.60.560 (0.098)0.526 (0.075)−0.050 (0.089)154.90.593 (0.092)0.567 (0.080)0.022 (0.069)
Table 3. Heterozygote excess test results indicating p-values for the blue-throated macaw and thick-billed parrot * = p-value < 0.05.
Blue-Throated Macaw: (Left) Southern and (Right) Northern Population
Stepwise Mutation ModelTwo-Phase ModelStepwise Mutation ModelTwo-Phase Model
60% Stepwise80% Stepwise 60% Stepwise80% Stepwise
Sign test0.1580.1530.1760.5350.0740.092
Wilcoxon signed rank test (1-tail)0.2850.0820.1250.1610.009*0.016 *
Wilcoxon signed rank test (2-tail)0.5700.1640.2500.3220.018*0.032 *
Thick-billed parrot: whole wild population
Stepwise Mutation ModelTwo-Phase Model
60% Stepwise80% Stepwise
Sign test0.1930.4490.428
Wilcoxon signed rank test (1-tail)0.8380.4220.577
Wilcoxon signed rank test (2-tail)0.3750.8450.921
Publisher’s Note: MDPI stays neutral with regard to jurisdictional claims in published maps and institutional affiliations.

