
Reproductive Success of an Endangered Plant after Invasive Bees Supplant Native Pollinator Services


1
Department of Biology, College of Science, Utah Valley University, Orem, UT 84058, USA
2
USDA Forest Service, Rocky Mountain Research Stations, Shrub Sciences Laboratory, Provo, UT 84606, USA
*
Author to whom correspondence should be addressed.
Diversity 2022, 14(1), 1; https://0-doi-org.brum.beds.ac.uk/10.3390/d14010001
Submission received: 24 November 2021
/
Revised: 13 December 2021
/
Accepted: 17 December 2021
/
Published: 21 December 2021
(This article belongs to the Special Issue Plant-Animal Interactions: An Evolutionary Approach)
Abstract
:Arctomecon humilis (dwarf bear poppy) is an endangered gypsophile restricted to the St. George area in southern Utah, USA. Extirpation of the rare oligolectic bee Perdita meconis and decline of other native pollinators within the last 20 years has been largely attributed to the advent of invasive Africanized honeybees (AHBs), which have become the predominant pollinator for A. humilis. A three-year study was carried out to determine if reliance on AHBs had a negative effect on reproductive output. In the first year, pollen addition experiments were carried out in a small, isolated population to determine if pollinator scarcity or genetic factors affected reproductive output. In the subsequent two years, reproductive output studies were conducted across four populations. In all years, fruit set across study sites was exceptionally high. There was no consistent effect from flower number or interplant distance, which have historically been shown to have a significant impact on reproductive output prior to AHB arrival. The consequences and sustainability of this relatively young relationship between A. humilis and the AHB remain unclear. However, high reproductive success shows that the AHB is currently capable of adequately fulfilling pollinator services for A. humilis.
1. Introduction
In the face of global pollinator declines [1], conservation of functioning pollinator networks is critical for maintaining plant populations, including many rare species in the western United States [2]. Anthropogenic disturbance may negatively impact native bee networks, especially in ecosystems that have been extensively altered [3], which make them vulnerable to invasion by nonnative species that may potentially cause both biological and economic harm [4,5]. While most management approaches attempt to conserve suites of native species and interactions, the ubiquity and irreversibility of novel ecosystems may require that we challenge historical views of conservation. In novel ecosystems that have experienced shifts in species composition and subsequent interactions, the role of invasive pollinator species may need to be reevaluated in terms of conservation potential [6].
Impacts to native pollinator networks and plants associated with the introduction and invasion of Africanized honeybees (AHBs) have been well documented globally [5,7,8,9]. Expansion of AHBs into areas not previously invaded is likely to continue and native pollinator decline is likely to increase as these bees potentially displace native bees. The invasion by AHBs has been potentially devastating for the rare endemic Perdita meconis (Mojave poppy bee), an oligolectic bee only known to visit Arctomecon and Argemone species in the southwestern United States [10].
Since the advent of AHBs in southern Utah, USA as early as 2000 [11], they have now supplanted preexisting European honeybee populations and have been largely credited with the extirpation of P. meconis in the St. George, Utah area [11,12]. This has caused apprehension over the fate of the endangered Arctomecon humilis (dwarf bear poppy, Papaveraceae), a rare gypsophile plant species that has historically relied on pollination from the naturalized European honeybee and a suite of native pollinators including P. meconis [13,14,15]. Portman et al. [12] associated a substantial decline in fruit set across several A. humilis populations in 2016 with reliance on AHBs as its primary pollinator, particularly at the Shinob Kibe Preserve (12% fruit set).
A previous study on A. humilis reproduction [13] was carried out prior to the ascendancy of AHBs in southwestern Utah after their first documented occurrence there around 2000 [11]. This study demonstrated a significant negative effect of increasing interplant distance and decreasing flower number on reproductive output [13], possibly due to the small size and relatively short foraging distances of the native pollinators. This suggests that reproductive output could have been pollinator-limited even before the advent of AHBs, at least in some years. The impact of the switch to AHBs as the primary pollinator on this relationship had not been examined prior to the present work.
We conducted a three-year study to determine if this new mutualism with an invasive pollinator has negatively impacted the reproductive output of A. humilis. In the first year, pollen addition experiments were carried out using intrapopulation and interpopulation xenogamous crosses to augment natural pollinator activity. The objective was to test the hypothesis that pollen limitation or possibly potential inbreeding depression was responsible for reduced reproductive output at the Shinob Kibe population. In the subsequent two years, reproductive output studies were carried out in four populations to test the hypotheses that (1) populations have lower reproductive success in comparison to past years that is concomitant with the switch to AHBs as the principal pollinator, (2) reproductive output parameters vary significantly among populations and years, and (3) shorter interplant distance and larger floral display increase reproductive success.
2. Materials and Methods
2.1. Study Species
Arctomecon humilis is a federally endangered gypsophile plant species that was listed under the Endangered Species Act in 1979 [16]. All known populations occur over a total area of approximately 3600 hectares near the city of St. George, Utah in Washington County, primarily on fragile, gypsum-rich soils of the Moenkopi geologic formation [17]. It is a short-lived perennial plant whose populations are maintained by highly episodic recruitment events in favorable years due to a long-lived seed bank [18]. Adult plants can produce up to 400 flowers beginning in late spring and produce capsules that split (dehisce) to release seeds while still attached to the plant or after the dried flowers with enclosed capsules break off (abscise) from the pedicel entirely at full maturation. Even in years with low precipitation and unfavorable conditions, many plants flower and produce seeds [12,13,14,15].
A. humilis flowers only produce pollen and no nectar [14,15]. Populations exhibit mixed breeding systems, but the only effective breeding systems are those that require pollinators (i.e., geitonogamy and xenogamy; [15]). Highest fruit and seed set is achieved though xenogamy (outcrossing). A previous study had shown that prior to 2000, A. humilis was primarily visited by various native bee species and the generalist honey bee Apis mellifera, but pollinator visitors had dwindled down to A. mellifera and Lasioglossum bees in 2012 [15]. By 2016, the predominant pollinator in most populations had become the AHB, which had largely replaced European honeybee populations [12]. Based on these recent studies, pollinator surveys were not conducted and it was assumed that AHBs comprise a significant proportion of the current pollinator guild for A. humilis.
2.2. Study Sites
Four populations of A. humilis were selected for reproductive output studies: Shinob Kibe, White Dome, Beehive Dome and the Tonaquint sub-population of Red Bluffs (Table 1). The first year of the study (2018) focused on Shinob Kibe with some data collection at White Dome. In 2019 and 2020, reproductive output data sets were collected at all four populations. Sites were selected at each population that corresponded with newly established drone-based demography monitoring plots [19].
2.3. Fruit and Seed Quantification
Capsule analysis was conducted similarly each year. Once capsules had fully dried, they were dissected and the numbers of unfertilized ovules, aborted seeds, and filled seeds were counted. Ovule fate (the mean proportion of ovules within a fruit that are unfertilized, aborted, or filled) represents a key set of variables in assessing reproductive success, including fertilization success, which is calculated as (aborted ovules + filled ovules)/total ovules. Aborted seeds indicate the successful fertilization of an ovule and sufficient pollen availability for fertilization, while the termination of seed development could be caused by other biotic or abiotic factors. This is based on the assumption that seed abortion occurs post-fertilization and is not a result of pollen scarcity. Fertilized ovules that do not abort are represented as the filled seed proportion. Reproductive data from 2019 were also presented in [19] as a component of seed rain estimates.
Filled seeds in each individual capsule were weighed and divided by the number of filled seeds to calculate the average individual seed mass per capsule. Seed mass was also obtained from the bulk collection for White Dome in 2018. Seed viability was determined by tetrazolium testing [20] for two replicates of 50 seeds drawn from the bulk collection of seeds from the three pollination treatments and from the White Dome comparison group in 2018, as well as for each population in 2019.
2.4. Pollen Addition Experiment
The Shinob Kibe population was visited in early April 2018 prior to flowering to mark individual experimental plants. Forty-five plants with a minimum of 10 buds were selected within 5 m of previously established research paths throughout the population to minimize new disturbance to fragile habitat. Each plant was marked with a metal tag with an identification number and GPS coordinates were recorded. During visits, plants that did not have a sufficient number of open flowers to receive both pollination treatments were removed from the study sample. Between mid-April and late May, the population was visited 3 times to carry out experimental pollination treatments based on previous hand pollination studies conducted on this species [15]. During each visit, freshly opened flowers on every plant were randomly divided into three treatment groups. For the first two groups, pedicels were marked with colored embroidery thread: (1) in intrapopulation treatment, donor pollen was supplied from flowers on plants at Shinob Kibe, and (2) in interpopulation treatment, donor pollen was from randomly selected flowers at White Dome. Open-pollinated flowers with no pollen addition on each individual were used as the control treatment and left unmarked.
Flowers open early in the morning, and stamens shed their pollen early on the same day. By late afternoon the anthers are spent and shriveled, while stigmas can remain receptive for two days [13]. Stamens were collected from freshly shedding anthers at the White Dome population before 8 am each day and stored in glass vials for transport to Shinob Kibe. Stamens from Shinob Kibe were collected for target individuals from plants >4 m distant and also stored in glass vials. Pollen for each treatment was applied to the stigmas of treatment flowers using paintbrushes cleaned with isopropyl alcohol between pollination sessions. Flowering progression (bud to flower ratio), number of open flowers, and the number of treated flowers for each plant were recorded during each visit.
Fruits (capsules) of varying sizes from non-study plants were dissected to determine minimum size thresholds of capsules that produced at least one viable seed. Using these thresholds, the number of fruits and flowers in each treatment on each plant were recorded to determine fruit to flower ratios (fruit set) per individual plant. All remaining fruit in interpopulation and intrapopulation treatments that had not dehisced or abscised were collected with a proportionally equal number of fruits randomly selected from the control group on each plant and stored individually in paper envelopes for laboratory analysis to determine fertilization success and seeds per capsule. Two hundred undehisced capsules were randomly selected from the bulk White Dome capsule collection and analyzed as described above for comparison with the Shinob Kibe capsule data set.
2.5. Two-Year Reproductive Output Study
In 2019, approximately 100 plants from newly established 0.6 ha high-density monitoring plots were selected from each population prior to flowering, except at the Shinob Kibe Preserve, which was considered a single plot for demography purposes due to its relatively small size (Table 1; [19]). In 2020, approximately 30 plants were selected that were outside of the boundaries of monitoring plots. Sample sizes were reduced from 2019 to 2020 based on power analysis of the 2019 data set. Each plant was measured and marked with a metal tag with an identification number and its GPS coordinates were recorded. During peak flowering time, when over 50% of buds had bloomed, the total number of flowers and buds per plant was counted to determine maximum flower number. Fruit set was determined in the field following the same protocol as for the 2018 pollination experiments. In both years, 5% of capsules were randomly collected from each plant for analysis to ensure adequate sample size and to avoid skewing data towards large plants or stripping smaller plants of fruit.
2.6. Interplant Distance and Floral Display
The goal of this study was to determine whether poppy populations in 2019 showed the same relationships between reproductive output parameters and interplant distance (negative) and floral display (positive) as observed prior to the advent of the AHB as the primary pollinator [12]. Orthomosaics (post-processed UAV imagery) collected for monitoring in 2018 and 2019 [19] were utilized to determine interplant distances. In ArcMap (ESRI, Redlands, CA, USA), shape files for plants that had been digitally marked for census and monitoring were georeferenced to a digital elevation model (DEM). The “Extract Values to Points” Spatial Analyst tool was used to output elevation data for all marked plants in the imagery. Based on GPS coordinates, treatment plants were visually matched to plants in the imagery. The “Near Features” tool was used to determine the horizontal distance between each treatment plant and its nearest neighbor. Elevation and nearest distance outputs were used to calculate an adjusted distance value (interplant distance) that accounted for elevation differences in the sometimes steep, hilly terrain.
Calculated interplant distances and flower counts were combined with data on individual plant reproductive output to examine whether fruit set, fertilization success, and filled seed proportion were related to these independent predictor variables at Shinob Kibe in 2018 and 2019 and at White Dome, Beehive Dome, and Tonaquint in 2019. These latter three populations were the populations included in Harper et al. [13].
2.7. Statistical Analysis
Analysis of variance (ANOVA) was used to compare components of reproductive output by treatment, population, and/or year, depending on experiment. Binomial variables were analyzed with SAS 9.4 (SAS Institute, Cary, NC, USA) Proc GLIMMIX, while continuous variables were analyzed with SAS 9.4 (SAS Institute, Cary, NC, USA) Proc GLM. Variables derived from capsule dissection were analyzed on a per plant basis by averaging values for capsules within plants and using these averages as input values in the analyses. This was necessary to avoid skewing the calculations toward larger plants, which had larger capsule sample sizes. Means comparisons were based on LSMEANS from analysis of variance. ANOVA tables for the three studies are presented in Appendix A.
2.7.1. Pollen Addition Experiment
ANOVA was used to compare components of reproductive output among pollination treatments at Shinob Kibe and with the White Dome population. Mean filled seed number per capsule, seed mass, and seed viability were compared with White Dome, while for fruit set White Dome was not included as no fruit set data were available. Means comparisons of reproductive output components between open-pollinated flowers and intrapopulation crosses were used to determine if plants at Shinob Kibe were pollen-limited. The same comparisons between interpopulation and intrapopulation crosses were examined to look for evidence for genetic constraints (such as inbreeding depression) affecting reproductive output. Ovule fate comparisons between manipulated treatments show whether pollen source and supplementation have an effect on processes within capsules that determine seed production and whether biotic or abiotic constraints may be limiting.
2.7.2. Two-Year among-Population Reproductive Output Study
ANOVA comparisons were also used for the same reproductive output metrics described above at four populations in 2019 and 2020 to determine how reproductive output varies as a function of population and year. Fruit set data from 2019 and 2020 were also compared to summarized fruit set data reported from various populations and years [12,13,14]. Fruit set data span 32 years and represent reproductive output data before and after the arrival of the AHB in southern Utah [11]. Trends were evaluated to determine if the arrival of the AHB had an overall negative impact on reproductive output. Trends in fruit set from 1988 to 2020 were also examined to evaluate whether fruit set values were affected by precipitation and temperature.
2.7.3. Effect of Interplant Distance and Floral Display
SAS 9.4 (SAS Institute, Cary, NC, USA) Proc Glimmix was used to test the effects of flowers per plant and interplant distance on ovule fate between and across populations in 2018 and 2019, to determine if plants with higher flower number or with smaller distances to their nearest neighbor had higher reproductive output in terms of fruit set, fertilization success, and filled seed proportion. Flower number and distance were analyzed as continuous variables, but the data are presented by binned categories to facilitate comparison with Harper et al. [13]. Trends were then compared to summarized data reported from this earlier study.
3. Results
3.1. Pollen Addition Experiments
Examination of results from the pollen addition experiment at Shinob Kibe revealed only minor treatment effects (Figure 1 and Figure 2, Table A1, Table A2, Table A3, Table A4, Table A5 and Table A6). Fruit set in the open-pollinated control treatment was surprisingly high (85%) in comparison to a previous year (12%; [12]). High fruit set in open-pollinated flowers indicates that pollinator visitation was adequate at Shinob Kibe in 2018 for fruit production, and is generally on par with or higher than typical fruit set across populations from 1988 to 2018 (Table 2). Although fruit set did not significantly differ between manipulated pollination treatments or between the intrapopulation treatment and the control, interpopulation crosses resulted in significantly higher fruit set (94%) than open-pollinated flowers (Figure 1, Table A1).
Between treatment groups and White Dome, only intrapopulation crosses produced significantly fewer filled seeds per capsule than the control group, with approximately 2.5 less seeds per capsule on average (Table A2). However, seed mass and seed viability were significantly lower in both manipulated treatments compared to open-pollinated flowers at Shinob Kibe and White Dome (Table A3). Viability of seeds produced from open-pollinated flowers was high (90–92%), with a steep decline in viability in both manipulated treatments (72–80%; Table A4). It was observed during tetrazolium testing that embryos of treatment seeds were notably smaller than in seeds of control groups, which may be related to differences in seed mass. Despite a slight increase in fruit set with donor pollen from a distant population, supplemental pollination overall had a negative effect on reproductive output compared to natural pollination services.
3.2. Two-Year among-Population Reproductive Output Study
In the four-population study across two years, there were significant but slight differences in fruit set across sites in both years, but average fruit set was >96% (Figure 3, Table A7 and Table A10). Fruit set values from 2019 and 2020 are the highest reported since 1988 (Table 2), when 100% fruit set was reported from the single population for which data are available. This trend shows that, in terms of fruit production, the switch to the AHB as the primary pollinator does not correspond to lower fruit set. Instead, fruit set values are substantially higher overall than in all the previous years.
Despite similar fruit set, average filled seeds per capsule and seed mass varied significantly among populations each year (Figure 3). In 2019, White Dome produced the fewest seeds per fruit, as well as the smallest seeds, compared to other populations (Table A8 and Table A9). Mass adult plant mortality that corresponded with timing of fruit production was observed in this population in the same year. This effect at White Dome was not seen in 2020 (Table A11 and Table A12). Beehive Dome, which has consistently been the most productive of all populations since 1988, produced the highest number of seeds per capsule and the largest seeds in both years. Seed viability was uniformly high across all populations in 2019 with an average of 96% (data not shown). Viability data are not available for 2020.
When comparing ovule fate across all populations in 2019 (Figure 4, Table A13 and Table A14), White Dome and especially Shinob Kibe had significantly lower fertilization success (higher unfertilized ovule proportion) than the other two populations. Despite the significantly lower fertilization rate at Shinob Kibe, plants on average exhibited fewer aborted seeds compared to other populations and the proportion of ovules that produced a filled seed did not differ among Beehive Dome, Tonaquint, and Shinob Kibe. White Dome suffered from a significantly higher proportion of aborted seeds and lower proportion of filled seeds per fruit in 2019. In 2020, fertilization success and proportion of filled seeds were generally lower than in 2019 with the exception of fertilization success at Shinob Kibe (Figure 4, Table A15 and Table A16). Because of high variation in the fraction of aborted ovules, higher fertilization success does not necessarily correspond to higher filled seed proportion, showing that filled seeds produced per capsule alone cannot be used as a direct measurement of fertilization success. High variation also indicates that other factors that affect reproductive output, particularly seed abortion, operate to varying degrees at each population and are not consistent across years or by population.
3.3. Interplant Distance and Floral Display
Fruit set data were analyzed in relation to interplant distance and floral display at Shinob Kibe in 2018 and at all four populations in 2019. Because of the uniformly high fruit set across all populations in 2019 (Figure 3), there were no effects of interplant distance or flower number that were even marginally significant in any population (Table A17 and Table A18). Fruit set was also not significantly related to interplant distance or floral display at Shinob Kibe in 2018, in spite of lower overall fruit set that year (Table A18).
Ovule fate was analyzed at Beehive Dome, Tonaquint, and White Dome at the population level and across all three populations (Figure 5). The data are presented as binned flower number categories to attempt to draw comparisons to the Harper et al. [13] interplant distance x flower number study discussed earlier. When populations are analyzed together, there was a significant but very small increase in fertilization success as flower number increased (Table A19). However, trends in individual populations vary. Only Tonaquint showed significantly increased fertilization success with higher flower numbers, while fertilization success slightly dropped at Beehive Dome and White Dome did not show any clear pattern, resulting in a marginally significant population by flower number interaction. The pattern of increasing filled seed proportion with increasing flower number was stronger overall, but again there were major differences among populations, with a highly significant population by flower number interaction (Figure 5, Table A20). Filled seed proportion increased significantly with flower number at both Tonaquint and White Dome, but there was very little variation in filled seed proportion at Beehive Dome as a function of flower number. A contrasting result was obtained at Shinob Kibe, where fertilization success actually dropped significantly with increasing flower number (Figure 6, Table A21). A similar trend there, significant in 2019, was seen for filled seed number (Table A22).
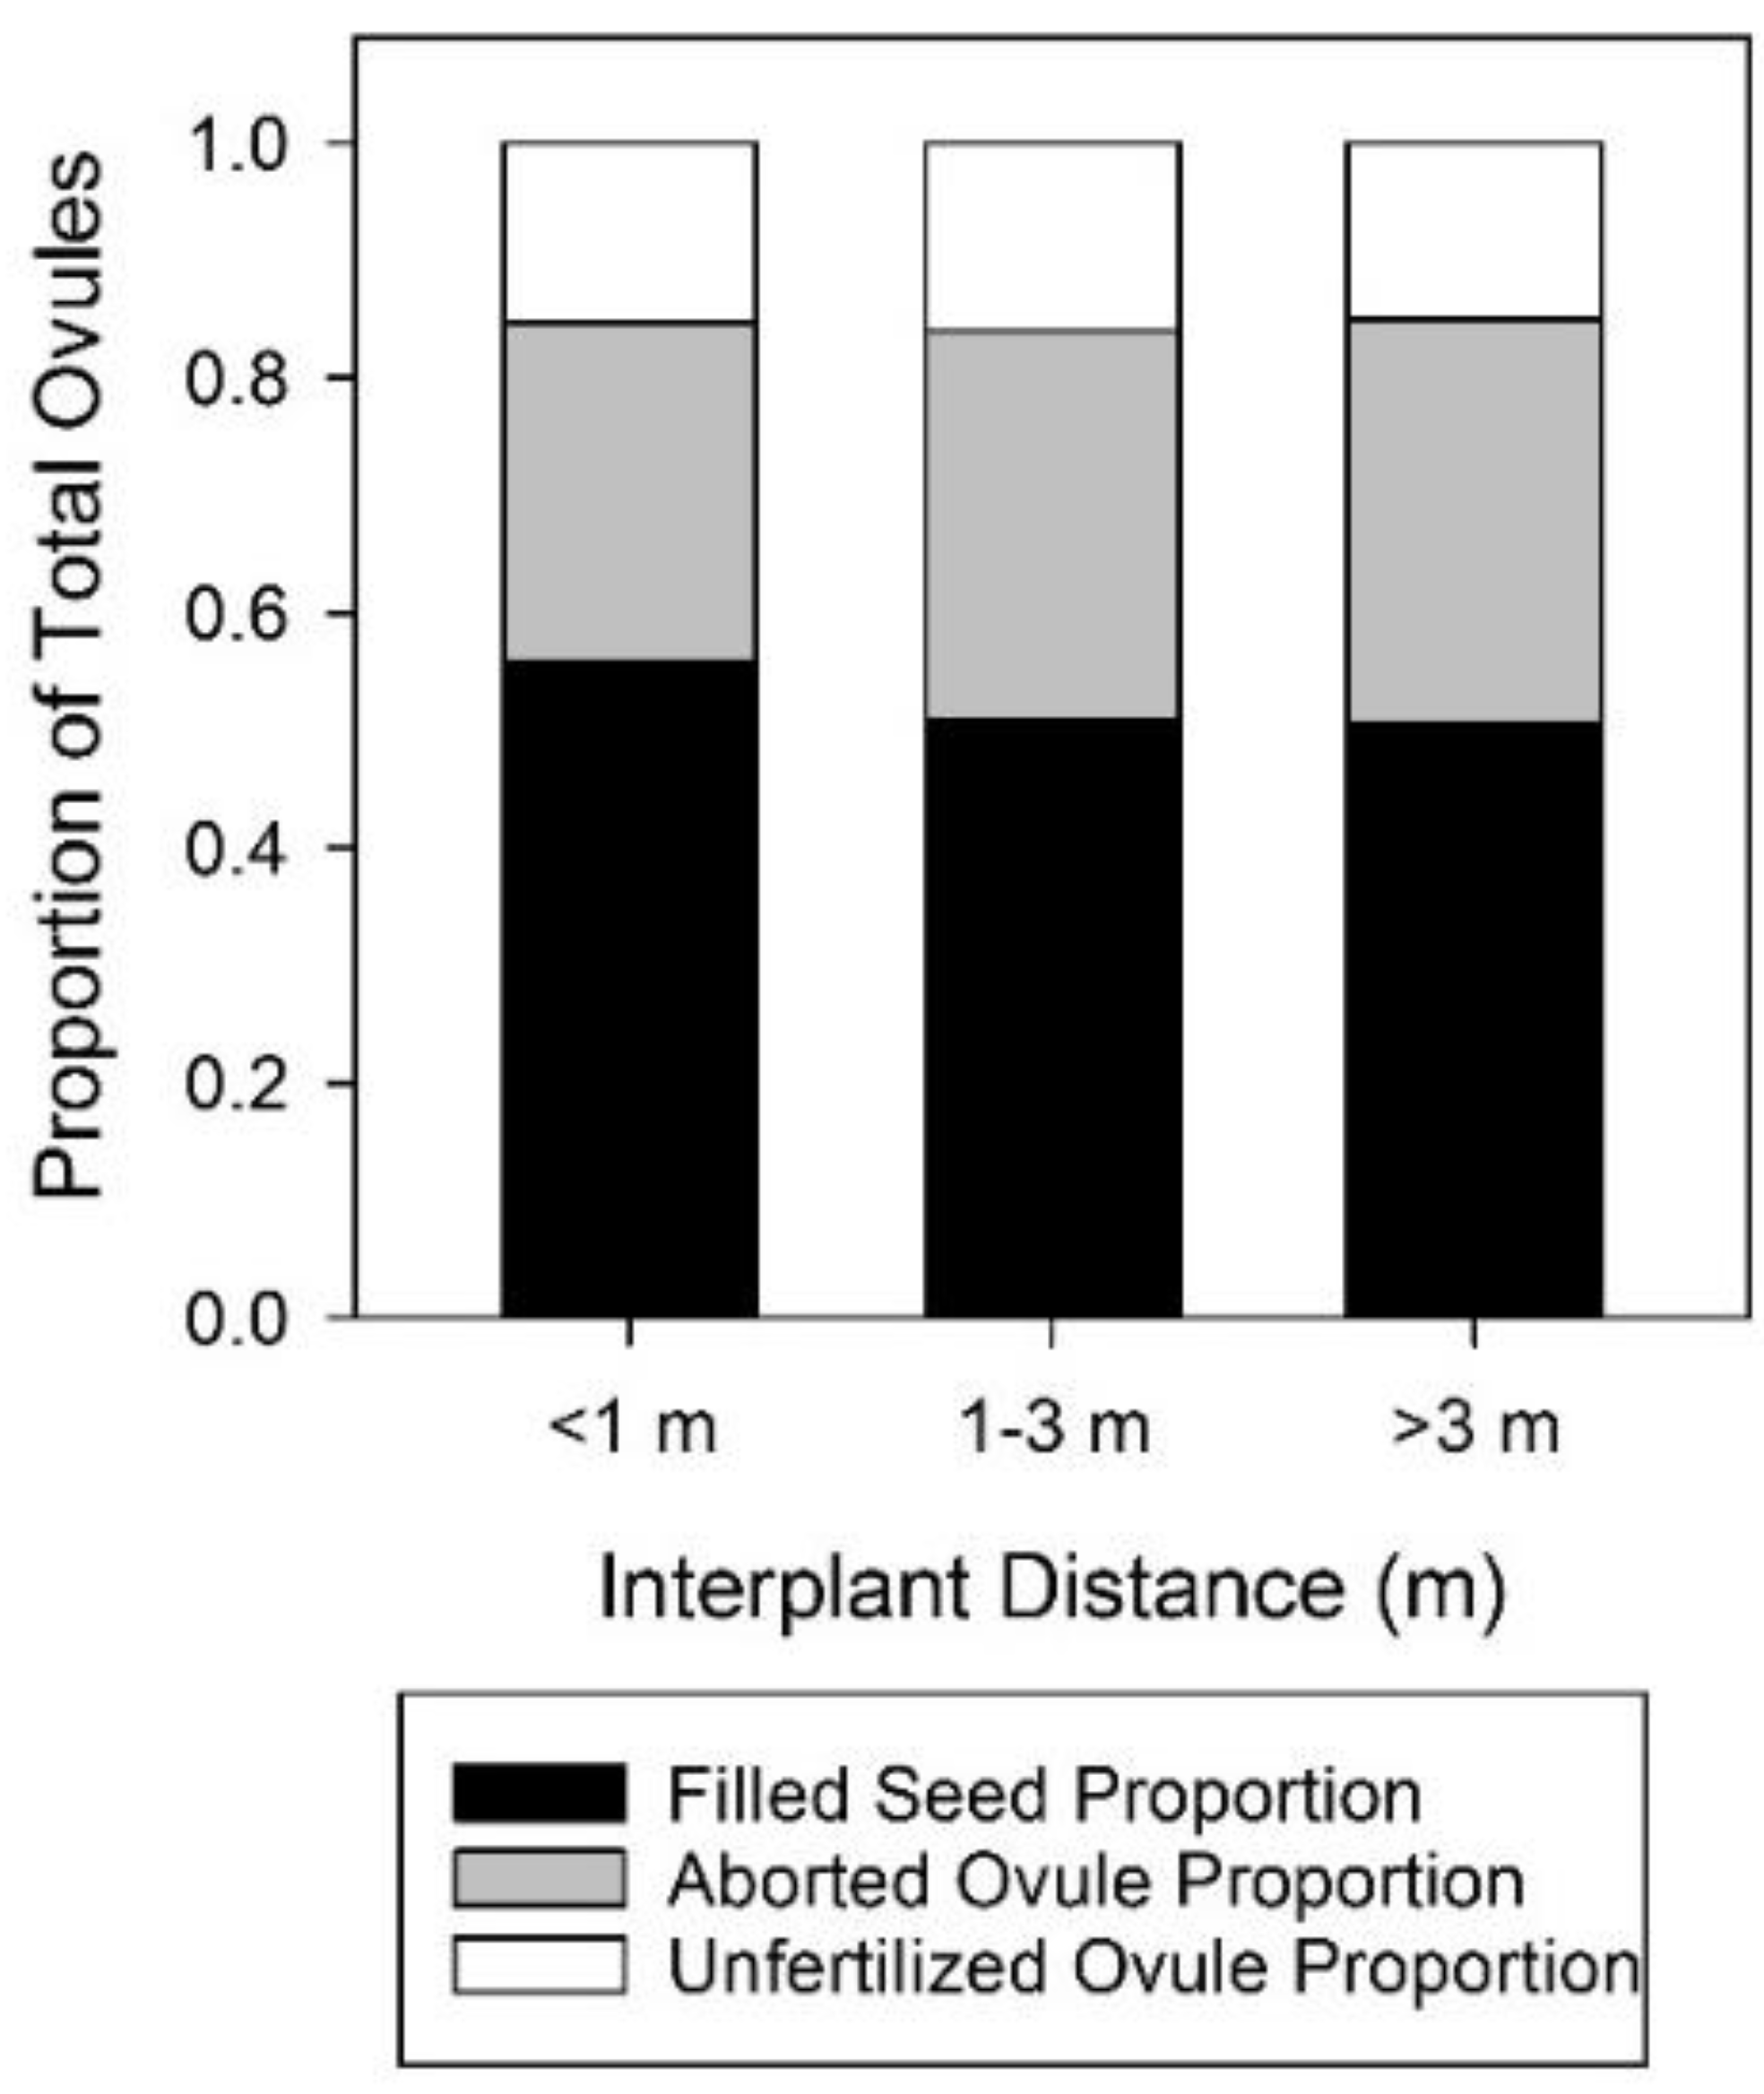
Analysis of ovule fate as a function of interplant distance overall in the three-population study showed no significant effect on fertilization success but a small but significant decrease in filled seed as interplant distance increased (Figure 7, Table A19 and Table A20). There were no significant effects of interplant distance at Shinob Kibe (Table A21 and Table A22), even though the range of interplant distances was considerably greater than at the other three populations.
The effect of floral display on fertilization success was minimal and inconsistent, and effects on filled seed proportion were also inconsistent and relatively small. Even the direction of the effect was not consistent. Effects of interplant distance on reproductive output were absent or very small. The clear trend of increased reproductive output with shorter interplant distances and larger floral displays seen in Harper et al. [13] was clearly not replicated in this study.
4. Discussion
4.1. Pollen Addition
In 2018, open-pollinated flowers had remarkably high fruit set, especially when compared to the low observed fruit set two years prior in 2016. Hand pollination only increased fruit set when flowers were outcrossed to a distant population, yet both manipulated treatments resulted in significantly smaller seeds. The tradeoff for smaller seeds may have fitness consequences and is likely responsible for smaller embryos observed during tetrazolium testing that resulted in lower seed viability. Differences in seed mass and fill in manipulated treatments are likely due to some mechanical aspect of hand pollination itself, such as stigma damage or inappropriate pollen-loading [21]. This same trend in lowered seed mass was also seen by Tepedino et al. [15].
Despite the relatively low filled seed numbers at Shinob Kibe, which were on the lower end of typically high filled seed numbers for A. humilis [15,18], low seed production per capsule does not seem to be a phenomenon restricted to Shinob Kibe. In fact, despite being the smallest and most isolated A. humilis population in this study, Shinob Kibe was not the least productive of the populations based on reproductive output metrics in any year. If pollen availability were the primary factor causing reduced seed number per capsule for A. humilis, pollen augmentation should theoretically increase seed fill; this did not occur. It is probable that other resource limitations are also contributing to the lower proportion of filled seeds, which cannot be addressed by supplemental pollination alone. Based on these results, pollen availability does not seem to be limiting fruit set at Shinob Kibe and plants are receiving adequate pollinator visitation when compared to historical visitation. Given that fruit set at Shinob Kibe in the following two years of the study was close to 100% without donor pollen from another population, there is little evidence that fruit set there is genetically constrained.
4.2. Reproductive Output Trends
Remarkably, fruit set was near 100% across all populations in 2019 and 2020. In the past, reported fruit set in any given year varied greatly among populations and was infrequently near 100% (Table 2). Although there is significantly more variation in ovule fate and seed characteristics between populations, this result is encouraging and indicates complete pollinator visitation during the flowering season. Fruit set has not continued a negative trend following the switch to the AHB as the principal pollinator for A. humilis. Seed fill and seeds per fruit were lower on average during the three years of our study than those reported earlier [13,15], but fertilization success was exceptionally high in 2019 and 2020 (74–87% Figure 4). This suggests that seed fill may be resource-limited, so that higher fertilization success can be compensated by higher seed abortion and only sets an upper limit on seed fill. This interpretation is supported by the 2018 results, where both fertilization success and aborted seed fraction were much lower than in 2019 and 2020, resulting in similar seed fill across the three years (Figure 2 and Figure 4). Previous studies did not report fertilization success or seed abortion fractions.
The effect of interplant distance and floral display on reproductive output did not show the same clear trends as Harper et al. [13], and in some cases contradicted their findings, as seen at Shinob Kibe in both years (Figure 6). Due to high population numbers and robust flowering of plants across all populations in 2019 and 2020, direct comparisons to Harper et al. [13] may not be possible. Additionally, 2000 was a year with much lower precipitation, lower population densities, and smaller plants than seen in 2018 and 2019. The effect of interplant distance and floral display may play a significant role in reproductive output on dry, sparse years, but such years do not substantially contribute to seed bank replenishment. Nevertheless, the dissolution of this once strong trend may be significant in understanding the role of AHBs in this new pollinator regime and the possible benefit to A. humilis. As AHBs are known to be strong fliers with large foraging distances [22], it is not surprising that they might be better able to locate and forage on smaller plants and plants at greater distances from each other than the smaller native bees [23] that were likely important pollinators in the Harper et al. [13] study.
If the arrival of the AHB in southern Utah has not been shown to negatively impact the reproductive output of A. humilis overall, then other factors must account for the high variability in reproductive output that occurs among populations and years. Historical trends showed that 2016 was the worst year reported for reproductive output with a low fruit set average across populations of 46.6%. Over the course of the four subsequent years, A. humilis experienced two of its most productive years since 1989. This demonstrates that basing conclusions about long-term trends on a single year of low reproductive output can be misleading. Long-term monitoring that includes reproductive output as well as other data associated with demography may reveal other factors associated with this type of drastic annual variation and is critical for the management of A. humilis.
Within-fruit seed abortion varied greatly across populations and years, and could be affected by both genetic factors and resource availability. One of the more obvious factors affecting reproductive output in this study is disease. Although White Dome did not differ in fruit set or filled seed viability from other populations in 2019, it suffered high seed abortion rates and significantly smaller seeds. Widespread adult plant mortality occurred at White Dome during peak fruit production that year with symptoms suggestive of a pathogen. Diseased tissue was noted across all populations in 2019 and 2020, although not as severe as at White Dome. This occurred after a notably cooler and wetter spring, and likely contributed to lower seed production due to increased seed abortion. Arctomecon californica, another rare gypsophile plant species restricted to the Mojave Desert in southern Nevada and adjacent Arizona, is also known to experience increased adult plant mortality in cool, wet years, likely from disease caused by the pathogen Alternaria [24]. No other A. humilis studies have reported observations of disease in any population of A. humilis prior to 2019.
Timing of seasonal temperature and precipitation events play a role in seedling recruitment and other life history events for A. humilis [18]. Limited or poorly timed precipitation may also limit resource availability for floral and seed production. Winter precipitation and minimum temperature have also been shown to be major factors influencing AHB persistence in habitats in the southwestern United States, and in general AHBs preferred low to moderate winter precipitation and minimum temperatures that do not persist below freezing [25]. However, Washington County experienced cooler and wetter winters in 2019 and 2020 than the previous seven years, and ultimately had the most robust reproductive effort. Climatic data do not show an obvious correlation with reproductive output.
Land use and anthropogenic activity around A. humilis populations may also impact both pollinators and plants themselves, resulting in lower reproductive output. Shinob Kibe and White Dome are both closely blockaded by recent and sporadic bouts of urban development, from housing and industrial complexes to nearby high-traffic roads. The Tonaquint sub-population is bisected by a heavy-use dirt road and experiences frequent nearby OHV traffic as well as recreational firearm activity. While Beehive Dome is relatively far from this development, the area does have active grazing allotments [17]. It is possible that disturbance due to large machinery associated with development, such as high dust generation [26], could influence plant-pollinator interactions.
4.3. Conservation Implications
It remains unclear what environmental variables contribute to the drastic fluctuations in fruit set and seed production in A. humilis. However, the reliance on AHBs for pollination does not seem to play a role in significantly lowering reproductive success for A. humilis. It is difficult to determine if AHBs are indeed responsible for the extirpation of P. meconis near St. George and the decline of other native pollinators in the A. humilis pollinator guild. In some ecological cases, AHBs may just be a “passenger of change, not the driver” [27,28]. In populations of the sister taxon Arctomecon californica, it was found that P. meconis coexisted with AHBs without significant population or visitation frequency decline compared to historical data [29]. Although A. humilis and A. californica share similar life histories and habitats, there are naturally differences which may contribute a particular set of ecosystem attributes that make species interactions more vulnerable to negative impacts of invasion, such as plant density, abundance of co-flowering species, and land use [29]. Regardless of the drivers of change in the A. humilis pollinator guild, the question remains concerning how to manage rare native plants that are now almost entirely supported by an invasive pollinator.
While there may be a tendency to assume that the invasion of species is inherently negative for ecosystems, a limited number of studies report neutral, if not positive, impacts of the AHB [9]. Characteristics of africanization may in fact be beneficial for A. humilis plants. Compared to European honeybees (as well as smaller native bees), the flight capacity of AHBs is significantly higher [22,23]. Additionally, AHBs have a higher preference for pollen over nectar, as opposed to European honeybees with higher foraging preferences for nectar [22]. For fragmented and highly aggregated populations of A. humilis, this increased foraging range and pollen preference may prove crucial during years of low plant abundance. Current pollination services from AHB may be the reason why interplant distance and flower number no longer exercise the same restrictions on reproductive success as they did prior to the rise of AHBs in southern Utah.
As AHBs may continue to encroach into Utah with changing climatic conditions [25], eradication simply may not be possible. In order to protect the species they now interact with, shifts in management strategies and prioritization may be required to better understand the new role that AHBs and other invasive species play in novel ecosystems. Long-term monitoring is essential for determining how this new pollinator relationship will develop over time and affect long-term prospects of A. humilis. AHB populations are also not immune to the same kinds of threats that face European honeybees and in fact all pollinating species [1,30,31]. Reliance on the visitation of a single pollinator may put A. humilis at higher risk of decline if populations of that pollinator were to collapse. Conservation strategies may now need to include protecting this new interaction.
Author Contributions
Conceptualization, A.M.D. and S.E.M.; methodology, A.M.D. and S.E.M.; formal analysis, A.M.D. and S.E.M.; investigation, A.M.D. and S.E.M.; resources, S.E.M.; data curation, A.M.D. and S.E.M.; writing—original draft preparation, A.M.D.; writing—review & editing, A.M.D. and S.E.M.; visualization, A.M.D. and S.E.M.; supervision, A.M.D. and S.E.M.; project administration, A.M.D. and S.E.M.; funding acquisition, A.M.D. and S.E.M. All authors have read and agreed to the published version of the manuscript.
Funding
This study was funded by The Nature Conservancy (Grant # P100997, F104790), U.S. Fish and Wildlife Service (Challenge Cost Share Grant #F19AP00568), and The Utah Native Plant Society Grant-In-Aid Program.
Institutional Review Board Statement
Not applicable.
Informed Consent Statement
Not applicable.
Data Availability Statement
All relevant data are included in this manuscript.
Acknowledgments
Elaine York of The Nature Conservancy was crucial in facilitating and supporting our research. We thank Vincent Tepedino of Utah State University and Bettina Schultz of the US Forest Service Shrub Sciences Laboratory for their input on conducting hand pollination studies. Sydney Houghton of Utah Valley University, Daniel Stephen of Utah Valley University, and Gary Marsden contributed significant and invaluable field support. Suzette Clement of the US Forest Service Shrub Sciences Laboratory conducted seed viability analysis, Eli Hartung of Utah Valley University helped with capsule evaluation, and Kody Rominger of Utah Valley University provided drone imagery.
Conflicts of Interest
The authors declare no conflict of interest. The funders had no role in the design of the study; in the collection, analyses, or interpretation of data; in the writing of the manuscript, or in the decision to publish the results.
Appendix A
Tables in the first section of this appendix provide statistical support for the results presented for the Shinob Kibe 2018 pollen manipulation experiment in Figure 1 and Figure 2 in the main text. Fruit set, seed viability, fertilization success, and filled seed proportion were analyzed as binomial variables using SAS 9.4 PROC GLIMMIX; seeds per capsule and seed mass were analyzed using SAS 9.4 (SAS Institute, Cary, NC, USA) PROC GLM. WDS refers to the White Dome salvage collection; this comparison is included when available.

Table A1.
Fruit Set (fruit number/flower number).
| Type III Tests of Fixed Effects | ||||||
|---|---|---|---|---|---|---|
| Effect | Num DF | Den DF | F Value | Pr > F | ||
| TREAT | 2 | 98 | 5.86 | 0.0039 | ||
| Differences of TREAT Least Squares Means | ||||||
| TREAT | _TREAT | Estimate | Standard Error | DF | t Value | Pr > |t| |
| Interpop | Control | 1.1734 | 0.3920 | 98 | 2.99 | 0.0035 |
| Interpop | Intrapop | 0.6309 | 0.4903 | 98 | 1.29 | 0.2011 |
| Control | Intrapop | −0.5424 | 0.3078 | 98 | −1.76 | 0.0812 |
Table A2.
Filled Seed Number per Capsule.
| Source | DF | Sum of Squares | Mean Square | F Value | Pr > F |
|---|---|---|---|---|---|
| Model | 3 | 118.654465 | 39.551488 | 1.53 | 0.2115 |
| Error | 109 | 2822.313311 | 25.892783 | ||
| Corrected Total | 112 | 2940.967775 | |||
| Least Squares Means Differences for Effect Treat Pr > |t| for H0: LSMean(i)= LSMean(j) Dependent Variable: Filled Seed Number | |||||
| i/j | Control | Interpop | Intrapop | WDS | |
| Control | 0.1320 | 0.0445 | 0.2450 | ||
| Interpop | 0.1320 | 0.6211 | 0.9935 | ||
| Intrapop | 0.0445 | 0.6211 | 0.6945 | ||
| WDS | 0.2450 | 0.9935 | 0.6945 | ||
Table A3.
Seed Mass.
| Source | DF | Sum of Squares | Mean Square | F Value | Pr > F |
|---|---|---|---|---|---|
| Model | 3 | 1.82539175 | 0.60846392 | 9.92 | <0.0001 |
| Error | 108 | 6.62135022 | 0.06130880 | ||
| Least Squares Means Differences for Effect Treat Pr > |t| for H0: LSMean(i) = LSMean(j) Dependent Variable: Seed Mass | |||||
| i/j | Control | Interpop | Intrapop | WDS | |
| Control | <0.0001 | <0.0001 | 0.6023 | ||
| Interpop | <0.0001 | 0.7025 | 0.0031 | ||
| Intrapop | <0.0001 | 0.7025 | 0.0072 | ||
| WDS | 0.6023 | 0.0031 | 0.0072 | ||
Table A4.
Seed Viability.
| Type III Tests of Fixed Effects | ||||||
|---|---|---|---|---|---|---|
| Effect | Num DF | Den DF | F Value | Pr > F | ||
| TREAT | 3 | 4 | 8.52 | 0.0327 | ||
| Differences of TREAT Least Squares Means | ||||||
| TREAT | _TREAT | Estimate | Standard Error | DF | t Value | Pr > |t| |
| Control | Interpop | 3.5184 | 1.0307 | 4 | 3.41 | 0.0269 |
| Control | Intrapop | 3.3691 | 1.0330 | 4 | 3.26 | 0.0310 |
| Control | WDS | 1.0883 | 1.1636 | 4 | 0.94 | 0.4026 |
| Interpop | Intrapop | −0.1493 | 0.3296 | 4 | −0.45 | 0.6741 |
| Interpop | WDS | −2.4301 | 0.6290 | 4 | −3.86 | 0.0181 |
| Interpop | WDS | −2.2809 | 0.6327 | 4 | −3.61 | 0.0227 |
Table A5.
Fertilization Success (fertilized ovules/total ovules).
| Type III Tests of Fixed Effects | ||||||
|---|---|---|---|---|---|---|
| Effect | Num DF | Den DF | F Value | Pr > F | ||
| TREAT | 3 | 109 | 3.62 | 0.0155 | ||
| Differences of treat Least Squares Means | ||||||
| TREAT | _TREAT | Estimate | Standard Error | DF | t Value | Pr > |t| |
| Control | Interpop | 0.09167 | 0.1053 | 109 | 0.87 | 0.3860 |
| Control | Intrapop | 0.1392 | 0.1050 | 109 | 1.33 | 0.1876 |
| Control | WDS | 0.4110 | 0.1260 | 109 | 3.26 | 0.0015 |
| Interpop | Intrapop | 0.04756 | 0.1100 | 109 | 0.43 | 0.6662 |
| Interpop | WDS | 0.3193 | 0.1302 | 109 | 2.45 | 0.0157 |
| Intrapop | WDS | 0.2718 | 0.1299 | 109 | 2.09 | 0.0388 |
Table A6.
Filled Seed Proportion (filled seeds/total ovules).
| Type III Tests of Fixed Effects | ||||||
|---|---|---|---|---|---|---|
| Effect | Num DF | Den DF | F Value | Pr > F | ||
| TREAT | 3 | 109 | 4.50 | 0.0051 | ||
| Differences of Treat Least Squares Means | ||||||
| TREAT | _TREAT | Estimate | Standard Error | DF | t Value | Pr > |t| |
| Control | Interpop | −0.01625 | 0.1040 | 109 | −0.16 | 0.8761 |
| Control | Intrapop | 0.04000 | 0.1037 | 109 | 0.39 | 0.7005 |
| Control | WDS | 0.4180 | 0.1255 | 109 | 3.33 | 0.0012 |
| Interpop | Intrapop | 0.05625 | 0.1091 | 109 | 0.52 | 0.6074 |
| Interpop | WDS | 0.4343 | 0.1300 | 109 | 3.34 | 0.0011 |
| Intrapop | WDS | 0.3780 | 0.1298 | 109 | 2.91 | 0.0043 |
ANOVA Table A7 through Table A16 provide support for in support of among-population comparisons for 2019 and 2020 presented in Figure 3 and Figure 4. The two study years were analyzed separately. BH = Beehive Dome, SK = Shinob Kibe, TQ = Tonaquint, WD = White Dome. SAS 9.4 (SAS Institute, Cary, NC, USA) Proc GLIMMIX was used for analysis of binomial variables; SAS Proc GLM was used for continuous variables.
Table A7.
2019 Four Population Fruit Set.
| Source | DF | Type III SS | Mean Square | F Value | Pr > F |
|---|---|---|---|---|---|
| Population | 3 | 0.03031437 | 0.01010479 | 4.64 | 0.0033 |
| Least Squares Means for Effect Population Pr > |t| for H0: LSMean(i) = LSMean(j) Dependent Variable: Fruit Set | |||||
| i/j | BH | SK | TQ | WD | |
| BH | 0.0368 | 0.0104 | 0.0003 | ||
| SK | 0.0368 | 0.6083 | 0.1123 | ||
| TQ | 0.0104 | 0.6083 | 0.2856 | ||
| WD | 0.0003 | 0.1123 | 0.2856 | ||
Table A8.
2019 Four Population Seed Number per Capsule.
| Source | DF | Type III SS | Mean Square | F Value | Pr > F |
|---|---|---|---|---|---|
| Population | 3 | 7864.505205 | 2621.501735 | 47.72 | <0.0001 |
| Least Squares Means for Effect Population Pr > |t| for H0: LSMean(i) = LSMean(j) Dependent Variable: Seed Number per Capsule | |||||
| i/j | BH | SK | TQ | WD | |
| BH | <0.0001 | <0.0001 | <0.0001 | ||
| SK | <0.0001 | 0.0383 | 0.0013 | ||
| TQ | <0.0001 | 0.0383 | <0.0001 | ||
| WD | <0.0001 | 0.0013 | <0.0001 | ||
Table A9.
2019 Four Population Seed Mass.
| Source | DF | Type III SS | Mean Square | F Value | Pr > F |
|---|---|---|---|---|---|
| Population | 3 | 0.00002216 | 0.00000739 | 14.48 | <0.0001 |
| Least Squares Means for Effect Population Pr > |t| for H0: LSMean(i) = LSMean(j) Dependent Variable: Seed Mass | |||||
| i/j | BH | SK | TQ | WD | |
| BH | 0.0150 | 0.0137 | <0.0001 | ||
| SK | 0.0150 | 0.9216 | <0.0001 | ||
| TQ | 0.0137 | 0.9216 | <0.0001 | ||
| WD | <0.0001 | <0.0001 | <0.0001 | ||
Table A10.
2020 Four Population Fruit Set.
| Type III Tests of Fixed Effects | ||||||
|---|---|---|---|---|---|---|
| Effect | Num DF | Den DF | F Value | Pr > F | ||
| Population | 3 | 110 | 32.57 | <0.0001 | ||
| Differences of Population Least Squares Means | ||||||
| Population | _Population | Estimate | Standard Error | DF | t Value | Pr > |t| |
| BD | SK | 0.7839 | 0.3138 | 110 | 2.50 | 0.0140 |
| BD | TQ | −0.03196 | 0.3576 | 110 | −0.09 | 0.9289 |
| BD | WD | 1.8912 | 0.2782 | 110 | 6.80 | <0.0001 |
| SK | TQ | −0.8158 | 0.3028 | 110 | −2.69 | 0.0082 |
| SK | WD | 1.1073 | 0.2030 | 110 | 5.45 | <0.0001 |
| TQ | WD | 1.9231 | 0.2657 | 110 | 7.24 | <0.0001 |
Table A11.
2020 Four Population Seed Number per Capsule.
| Type III Tests of Fixed Effects | ||||||
|---|---|---|---|---|---|---|
| Effect | Num DF | Den DF | F Value | Pr > F | ||
| Population | 3 | 115 | 4.48 | 0.0052 | ||
| Differences of Population Least Squares Means | ||||||
| Population | _Population | Estimate | Standard Error | DF | t Value | Pr > |t| |
| BD | SK | 5.1877 | 1.7400 | 115 | 2.98 | 0.0035 |
| BD | TQ | 5.9050 | 1.7400 | 115 | 3.39 | 0.0009 |
| BD | WD | 3.6571 | 1.7534 | 115 | 2.09 | 0.0392 |
| SK | TQ | 0.7173 | 1.6789 | 115 | 0.43 | 0.6700 |
| SK | WD | −1.5305 | 1.6928 | 115 | −0.90 | 0.3678 |
| TQ | WD | −2.2478 | 1.6928 | 115 | −1.33 | 0.1869 |
Table A12.
2020 Four Population Seed Mass.
| Type III Tests of Fixed Effects | ||||||
|---|---|---|---|---|---|---|
| Effect | Num DF | Den DF | F Value | Pr > F | ||
| Population | 3 | 110 | 5.08 | 0.0025 | ||
| Differences of Population Least Squares Means | ||||||
| Population | _Population | Estimate | Standard Error | DF | t Value | Pr > |t| |
| BD | SK | 0.1716 | 0.06172 | 110 | 2.78 | 0.0064 |
| BD | TQ | 0.06126 | 0.06222 | 110 | 0.98 | 0.3270 |
| BD | WD | 0.2163 | 0.06275 | 110 | 3.45 | 0.0008 |
| SK | TQ | −0.1104 | 0.06059 | 110 | −1.82 | 0.0713 |
| SK | WD | 0.04469 | 0.06114 | 110 | 0.73 | 0.4664 |
| TQ | WD | 0.1550 | 0.06164 | 110 | 2.52 | 0.0133 |
Table A13.
2019 Four Population Fertilization Success.
| Type III Tests of Fixed Effects | ||||||
|---|---|---|---|---|---|---|
| Effect | Num DF | Den DF | F Value | Pr > F | ||
| Population | 3 | 374 | 49.03 | <0.0001 | ||
| Differences of Population Least Squares Means | ||||||
| Population | _Population | Estimate | Standard Error | DF | t Value | Pr > |t| |
| BH | SK | −0.7460 | 0.06667 | 374 | −11.19 | <0.0001 |
| BH | TQ | −0.1050 | 0.07328 | 374 | −1.43 | 0.1528 |
| BH | WD | −0.3692 | 0.07168 | 374 | −5.15 | <0.0001 |
| SK | TQ | 0.6410 | 0.07107 | 374 | 9.02 | <0.0001 |
| SK | WD | 0.3769 | 0.06942 | 374 | 5.43 | <0.0001 |
| TQ | WD | −0.2642 | 0.07579 | 374 | −3.49 | 0.0005 |
Table A14.
2019 Four Population Filled Seed Proportion.
| Type III Tests of Fixed Effects | ||||||
|---|---|---|---|---|---|---|
| Effect | Num DF | Den DF | F Value | Pr > F | ||
| Population | 3 | 374 | 80.69 | <0.0001 | ||
| Differences of Population Least Squares Means | ||||||
| Population | _Population | Estimate | Standard Error | DF | t Value | Pr > |t| |
| BH | SK | 0.2358 | 0.05134 | 374 | 4.59 | <0.0001 |
| BH | TQ | 0.09845 | 0.05114 | 374 | 1.92 | 0.0550 |
| BH | WD | 0.7847 | 0.05286 | 374 | 14.84 | <0.0001 |
| SK | TQ | −0.1373 | 0.05484 | 374 | −2.50 | 0.0127 |
| SK | WD | 0.5489 | 0.05645 | 374 | 9.72 | <0.0001 |
| TQ | WD | 0.6862 | 0.05627 | 374 | 12.20 | <0.0001 |
Table A15.
2020 Four Population Fertilization Success.
| Type III Tests of Fixed Effects | ||||||
|---|---|---|---|---|---|---|
| Effect | Num DF | Den DF | F Value | Pr > F | ||
| Population | 3 | 115 | 23.28 | <0.0001 | ||
| Differences of Population Least Squares Means | ||||||
| Population | _Population | Estimate | Standard Error | DF | t Value | Pr > |t| |
| BD | SK | −0.9639 | 0.1251 | 115 | −7.70 | <0.0001 |
| BD | TQ | −0.1252 | 0.1032 | 115 | −1.21 | 0.2277 |
| BD | WD | −0.01607 | 0.09888 | 115 | −0.16 | 0.8712 |
| SK | TQ | 0.8387 | 0.1283 | 115 | 6.54 | <0.0001 |
| SK | WD | 0.9478 | 0.1248 | 115 | 7.59 | <0.0001 |
| TQ | WD | 0.1091 | 0.1029 | 115 | 1.06 | 0.2909 |
Table A16.
2020 Four Population Filled Seed Proportion.
| Type III Tests of Fixed Effects | ||||||
|---|---|---|---|---|---|---|
| Effect | Num DF | Den DF | F Value | Pr > F | ||
| Population | 3 | 115 | 4.90 | 0.0031 | ||
| Differences of Population Least Squares Means | ||||||
| Population | _Population | Estimate | Standard Error | DF | t Value | Pr > |t| |
| BD | SK | 0.02288 | 0.09125 | 115 | 0.25 | 0.8025 |
| BD | TQ | 0.2660 | 0.08987 | 115 | 2.96 | 0.0037 |
| BD | WD | 0.2436 | 0.08724 | 115 | 2.79 | 0.0061 |
| SK | TQ | 0.2431 | 0.09369 | 115 | 2.60 | 0.0107 |
| SK | WD | 0.2207 | 0.09117 | 115 | 2.42 | 0.0170 |
| TQ | WD | −0.02240 | 0.08978 | 115 | −0.25 | 0.8034 |
This section of the appendix provides statistical support for the flower number x interplant distance analysis across three populations (Beehive Dome, Tonaquint, White Dome) in 2019 (Figure 5 and Figure 7) and for Shinob Kibe in 2018 and 2019 (Figure 6). SAS 9.4 (SAS Institute, Cary, NC, USA) Proc GLIMMIX was used for analysis of binomial variables; SAS 9.4 (SAS Institute, Cary, NC, USA) Proc GLM was used for continuous variables.
Table A17.
The effect of maximum flower number and interplant distance on fruit set in the three-population study in 2019.
Table A17.
The effect of maximum flower number and interplant distance on fruit set in the three-population study in 2019.
| Type III Tests of Fixed Effects | ||||
|---|---|---|---|---|
| Effect | Num DF | Den DF | F Value | Pr > F |
| FLWNO | 1 | 267 | 0.18 | 0.6691 |
| DISTANCE | 1 | 267 | 0.15 | 0.6955 |
| FLWNO*DISTANCE | 1 | 267 | 0.06 | 0.8137 |
| POP | 2 | 267 | 2.13 | 0.1206 |
| FLWNO*POP | 2 | 267 | 0.34 | 0.7147 |
| DISTANCE*POP | 2 | 267 | 0.37 | 0.6894 |
| FLWNO*DISTANCE*POP | 2 | 267 | 0.19 | 0.8240 |
Table A18.
The effect of maximum flower number and interplant distance on fruit set at Shinob Kibe in 2018 and 2019.
Table A18.
The effect of maximum flower number and interplant distance on fruit set at Shinob Kibe in 2018 and 2019.
| Type III Tests of Fixed Effects | |||||
|---|---|---|---|---|---|
| Year | Effect | Num DF | Den DF | F Value | Pr > F |
| 2018 | MAXFLW | 1 | 30 | 1.70 | 0.2027 |
| DISTANCE | 1 | 30 | 0.04 | 0.8431 | |
| MAXFLW*DISTANCE | 1 | 30 | 0.00 | 0.9682 | |
| 2019 | MAXFLW | 1 | 95 | 0.21 | 0.6449 |
| DISTANCE | 1 | 95 | 0.00 | 0.9759 | |
| MAXFLW*DISTANCE | 1 | 95 | 0.15 | 0.7023 | |
Table A19.
The effect of maximum flower number and interplant distance on fertilization success across three populations in 2019 and for these three populations analyzed separately.
Table A19.
The effect of maximum flower number and interplant distance on fertilization success across three populations in 2019 and for these three populations analyzed separately.
| Type III Tests of Fixed Effects | |||||
|---|---|---|---|---|---|
| Population | Effect | Num DF | Den DF | F Value | Pr > F |
| Three-population | POP | 2 | 260 | 4.08 | 0.0180 |
| MAXFLW | 1 | 260 | 5.01 | 0.0261 | |
| MAXFLW*POP | 2 | 260 | 2.86 | 0.0590 | |
| DISTANCE | 1 | 260 | 0.37 | 0.5420 | |
| DISTANCE*POP | 2 | 260 | 0.13 | 0.8789 | |
| MAXFLW*DISTANCE | 1 | 260 | 1.02 | 0.3145 | |
| MAXFLW*DISTANCE*POP | 2 | 260 | 0.30 | 0.7384 | |
| Beehive Dome | MAXFLW | 1 | 89 | 0.04 | 0.8406 |
| DISTANCE | 1 | 89 | 1.03 | 0.3135 | |
| MAXFLW*DISTANCE | 1 | 89 | 1.11 | 0.2952 | |
| Tonaquint | MAXFLW | 1 | 86 | 10.19 | 0.0020 |
| DISTANCE | 1 | 86 | 0.13 | 0.7172 | |
| MAXFLW*DISTANCE | 1 | 86 | 1.21 | 0.2745 | |
| White Dome | MAXFLW | 1 | 85 | 0.22 | 0.6410 |
| DISTANCE | 1 | 85 | 0.00 | 0.9978 | |
| MAXFLW*DISTANCE | 1 | 85 | 0.00 | 0.9601 | |
Table A20.
The effect of maximum flower number and interplant distance on filled seed proportion across three populations in 2019 and for these three populations analyzed separately.
Table A20.
The effect of maximum flower number and interplant distance on filled seed proportion across three populations in 2019 and for these three populations analyzed separately.
| Type III Tests of Fixed Effects | |||||
|---|---|---|---|---|---|
| Population | Effect | Num DF | Den DF | F Value | Pr > F |
| Three-population | POP | 2 | 260 | 35.71 | <0.0001 |
| MAXFLW | 1 | 260 | 4.79 | 0.0295 | |
| MAXFLW*POP | 2 | 260 | 12.64 | <0.0001 | |
| DISTANCE | 1 | 260 | 18.70 | <0.0001 | |
| DISTANCE*POP | 2 | 260 | 3.63 | 0.0279 | |
| MAXFLW*DISTANCE | 1 | 260 | 1.23 | 0.2681 | |
| MAXFLW*DISTANCE*POP | 2 | 260 | 2.93 | 0.0554 | |
| Beehive Dome | MAXFLW | 1 | 89 | 8.74 | 0.0040 |
| DISTANCE | 1 | 89 | 5.94 | 0.0168 | |
| MAXFLW*DISTANCE | 1 | 89 | 8.61 | 0.0043 | |
| Tonaquint | MAXFLW | 1 | 86 | 4.56 | 0.0355 |
| DISTANCE | 1 | 86 | 14.79 | 0.0002 | |
| MAXFLW*DISTANCE | 1 | 86 | 3.25 | 0.0747 | |
| White Dome | MAXFLW | 1 | 85 | 13.00 | 0.0005 |
| DISTANCE | 1 | 85 | 1.61 | 0.2083 | |
| MAXFLW*DISTANCE | 1 | 85 | 1.58 | 0.2129 | |
Table A21.
The effect of maximum flower number and interplant distance on fertilization success at Shinob Kibe in 2018 and 2019.
Table A21.
The effect of maximum flower number and interplant distance on fertilization success at Shinob Kibe in 2018 and 2019.
| Type III Tests of Fixed Effects | |||||
|---|---|---|---|---|---|
| Year | Effect | Num DF | Den DF | F Value | Pr > F |
| 2018 | MAXFLW | 1 | 30 | 4.91 | 0.0345 |
| DISTANCE | 1 | 30 | 0.30 | 0.5888 | |
| MAXFLW*DISTANCE | 1 | 30 | 0.73 | 0.4008 | |
| 2019 | MAXFLW | 1 | 95 | 8.44 | 0.0046 |
| DISTANCE | 1 | 95 | 0.24 | 0.6232 | |
| MAXFLW*DISTANCE | 1 | 95 | 3.60 | 0.0609 | |
Table A22.
The effect of interplant distance and flower number on filled seed proportion at Shinob Kibe in 2018 and 2019.
Table A22.
The effect of interplant distance and flower number on filled seed proportion at Shinob Kibe in 2018 and 2019.
| Type III Tests of Fixed Effects | |||||
|---|---|---|---|---|---|
| Year | Effect | Num DF | Den DF | F Value | Pr > F |
| 2018 | MAXFLW | 1 | 30 | 4.80 | 0.0363 |
| DISTANCE | 1 | 30 | 0.18 | 0.6786 | |
| MAXFLW*DISTANCE | 1 | 30 | 0.24 | 0.6289 | |
| 2019 | MAXFLW | 1 | 95 | 0.86 | 0.3562 |
| DISTANCE | 1 | 95 | 0.07 | 0.7848 | |
| MAXFLW*DISTANCE | 1 | 95 | 0.21 | 0.6469 | |
References
- Potts, S.G.; Biesmeijer, J.C.; Kremen, C.; Neumann, P.; Schweiger, O.; Kunin, W.E. Global pollinator decline: Trends, impacts, and drivers. Trends Ecol. Evol. 2010, 25, 345–353. [Google Scholar] [CrossRef] [PubMed]
- Tepedino, V.J. The reproductive biology of rare rangeland plants and their vulnerability to insecticides. In Grasshopper Integrated Pest Management User Handbook; Tech. Bull. 1809; Department of Agriculture, Animal and Plant Health Inspection Service: Washington, DC, USA, 2000. [Google Scholar]
- Winfree, R.; Aguilar, R.; Vazquez, D.P.; LeBuhn, G.; Aizen, M.A. A meta-analysis of bees’ responses to anthropogenic disturbance. Ecology 2009, 90, 2068–2076. [Google Scholar] [CrossRef]
- Traveset, A.; Richardson, D.M. Biological invasions as disruptors of plant reproductive mutualisms. Trends Ecol. Evol. 2006, 21, 208–216. [Google Scholar] [CrossRef] [Green Version]
- Morales, C.L.; Saez, A.; Garibaldi, L.A.; Aizen, M.A. Disruption of pollination services by invasive pollinator species. In Impact of Biological Invasions on Ecosystem Services; Vila, M., Hulme, P.E., Eds.; Springer International Publishing: Charm, Switzerland, 2017; Volume 12, pp. 154–196. [Google Scholar]
- Schlaepfer, M.A.; Sax, D.F.; Olden, J.D. The potential conservation value of non-native species. Conserv. Biol. 2010, 3, 428–437. [Google Scholar] [CrossRef]
- Dohzono, I.; Yokoyama, J. Impacts of alien bees on native plant-pollinator relationships: A review with special emphasis on plant reproduction. Appl. Entomol. Zool. 2010, 45, 37–47. [Google Scholar] [CrossRef] [Green Version]
- Carneiro, L.T.; Martins, C.F. Africanized honey bees pollinate and preempt the pollen of Spondias mombin (Anacardiaceae) flowers. Apidologie 2012, 43, 474–486. [Google Scholar] [CrossRef] [Green Version]
- Russo, L. Positive and negative impacts of non-native bee species around the world. Insects 2016, 7, 69. [Google Scholar] [CrossRef] [Green Version]
- Griswold, T. New species of Perdita (Pygoperdita) Timberlake of the P. californica species group (Hymenoptera, Andrenidae). Pan-Pac. Entomol. 1993, 69, 183–189. [Google Scholar]
- Tripodi, A.D.; Tepedino, V.J.; Portman, Z.M. Timing of invasion by Africanized bees coincides with local extinction of a specialized pollinator or a rare poppy in Utah, USA. J. Apic. Sci. 2019, 63, 1–8. [Google Scholar] [CrossRef] [Green Version]
- Portman, Z.M.; Tepedino, V.J.; Tripodi, A.D.; Szalanski, A.L.; Durham, S.L. Local extinction of a rare plant pollinator in Southern Utah (USA) associated with invasion by Africanized honey bees. Biol. Invasions 2017, 20, 593–606. [Google Scholar] [CrossRef]
- Harper, K.T.; Van Buren, R.; Aanderud, Z.T. The influence of interplant distance and number of flowers on seed set in dwarf bear-poppy (Arctomecon humilis). In Southwestern Rare and Endangered Plants: Proceedings of the Third Conference, Flagstaff, Arizona, USA, 25–28 September 2000; Rocky Mountain Research Station: Ft Collins, CO, USA, 2001; pp. 105–109. [Google Scholar]
- Harper, K.T.; Van Buren, R. Dynamics of a dwarf bear-poppy (Arctomecon humilis) population over a sixteen-year period. West. N. Am. Nat. 2004, 64, 482–491. [Google Scholar]
- Tepedino, V.J.; Mull, J.; Griswold, T.L.; Bryant, G. Reproduction and pollination of the endangered dwarf bear-poppy Arctomecon humilis (Papaveraceae) across a quarter century: Unraveling of a pollination web? West. N. Am. Nat. 2014, 74, 311–324. [Google Scholar] [CrossRef] [Green Version]
- United States Fish and Wildlife Service. Endangered and threatened wildlife and plants: Rule to determine Arctomecon humilis is an endangered species. Fed. Regist. 1979, 44, 64250–64252. [Google Scholar]
- United States Fish and Wildlife Service. Dwarf Bear-Poppy. Arctomecon humilis Coville. Five-Year Review: Summary and Evaluation; US Fish and Wildife Service, Utah Field Office: Salt Lake City, UT, USA, 2016; pp. 1–55. [Google Scholar]
- Meyer, S.E.; Van Buren, R.; Searle, A. Plant Demography Study and Population Viability Analysis for the Endangered Dwarf Bear Poppy (Arctomecon humilis); Report on file; The Nature Conservancy, Salt Lake City Office: Salt Lake City, UT, USA, 2015. [Google Scholar]
- Rominger, K.R.; DeNittis, A.; Meyer, S.E. Using drone imagery analysis in rare plant demographic studies. J. Nat. Conserv. 2021, 62, 126020. [Google Scholar] [CrossRef]
- Ooi, M.; Auld, T.; Whelan, R. Comparison of the cut and tetrazolium tests for assessing seed viability: A study using Australian native Leucopogon species. Ecol. Manag. Restor. 2004, 5, 141–143. [Google Scholar] [CrossRef]
- Young, H.J.; Young, T.P. Alternative outcomes of natural and experimental high pollen loads. Ecology 1992, 73, 639–647. [Google Scholar] [CrossRef]
- Harrison, J.F.; Fewell, J.H.; Anderson, K.E.; Loper, G.M. Environmental physiology of the invasion of the Americas by Africanized honeybees. Integr. Comp. Biol. 2006, 46, 1110–1122. [Google Scholar] [CrossRef] [PubMed] [Green Version]
- Greenleaf, S.S.; Wiliams, N.M.; Winfree, R.; Kremen, C. Bee foraging ranges and their relationship to body size. Oecologia 2007, 153, 589–596. [Google Scholar] [CrossRef] [PubMed]
- Meyer, S.E. Seed Germination Ecology and Seed Bank Dynamics of Arctomecon Californica; Interim Report to The Nature Conservancy; USDA Forest Service, Intermountain Research Station, Shrub Sciences Laboratory: Provo, UT, USA, 2001; p. 9.
- Gill, N.S.; Sangermano, F. Africanized honeybee habitat suitability: A comparison between models for southern Utah and southern California. Appl. Geogr. 2016, 76, 14–21. [Google Scholar] [CrossRef]
- Lewis, M.B.; Schupp, E.W.; Monaco, T.A. Road dust correlated with decreased production of the endangered Utah shrub Hesperindanthus suffrutescens. West. N. Am. Nat. 2017, 77, 430–439. [Google Scholar] [CrossRef] [Green Version]
- Didham, R.K.; Tylianakis, J.M.; Hutchison, M.A.; Ewens, R.M.; Gemmell, N.J. Are invasive species the drivers of ecological change? Trends Ecol. Evol. 2005, 20, 470–474. [Google Scholar] [CrossRef]
- Santos, G.M.M.; Aguiar, C.M.L.; Genini, J.; Martins, C.F.; Zanella, F.C.V.; Mello, M.A.R. Invasive Africanized honeybees change the structure of native pollination networks in Brazil. Biol. Invasions 2012, 14, 2369–2378. [Google Scholar] [CrossRef]
- Portman, Z.M.; Tepedino, V.J.; Tripodi, A.D. Persistence of an imperiled specialist bee and its rare host plant in a protected area. Insect Conserv. Divers. 2018, 12, 183–192. [Google Scholar] [CrossRef]
- Loper, G.; Sammataro, D.; Finley-Short, J.; Cole, J. Feral honeybees in southern Arizona, 10 years after varroa infestation. Am. Bee J. 2006, 146, 521–524. [Google Scholar]
- National Research Council. Status of Pollinators in North America; The National Academies Press: Washington, DC, USA, 2007. [Google Scholar]
Figure 1.
Results of the pollen addition experiment at the Shinob Kibe population in 2018, showing the mean (A) fruit set (fruit to flower ratio), (B) filled seeds per capsule, (C) seed mass, and (D) seed viability based on tetrazolium testing [20] per treatment. Treatments are control (open-pollinated with no manipulation), intrapop (pollen added from the Shinob Kibe population), and interpop (pollen added from the White Dome population). Data from White Dome are included when available. For each response variable (fruit set, seed number per capsule, seed mass, and seed viability) bars that contain the same letter are not significantly different at p < 0.05. An asterisk indicates that data are not available. See Appendix A for full statistical analysis.

Figure 2.
Results of the pollen addition experiment at the Shinob Kibe population in 2018. Treatments are control (open-pollinated with no manipulation), intrapop (pollen added from the Shinob Kibe population), interpop (pollen added from the White Dome population) and White Dome (open-pollinated with no manipulation). Both fertilization success (filled + aborted seed proportion) and filled seed proportion were significantly lower at White Dome than at Shinob Kibe but were not significantly different among manipulation treatments. See Appendix A for full statistical analysis.

Figure 3.
Mean fruit set (A,B), filled seeds per fruit (C,D), and seed mass (E,F) for plants from four dwarf bear poppy populations in 2019 (panels A,C,E) and 2020 (panels B,D,F). Within a reproductive component and year, bars with the same letter are not significantly different at p < 0.05. BH = Beehive Dome, TQ = Tonaquint, SK = Shinob Kibe, WD = White Dome. See Appendix A for full statistical analysis.

Figure 4.
Ovule fates at four populations of dwarf bear poppy in (A) 2019 and (B) 2020. Within each year and response variable (designated by shading), bar sections with the same letter are not significantly different at p < 0.05. Note that the test for unfertilized ovule proportion is the same as a test for fertilization success. BH = Beehive Dome, TQ = Tonaquint, SK = Shinob Kibe, WD = White Dome. See Appendix A for full statistical analysis.

Figure 5.
Relationship of ovule fate to mean flower number per plant (A) across three populations and for (B) Beehive Dome, (C) Tonaquint, and (D) White Dome in 2019. Note that flower numbers are binned into categories for ease of interpretation but that flower number was not analyzed as binned categories (see Appendix A for full statistical analysis).

Figure 6.
The effect of flower number on ovule fate for open-pollinated unmanipulated plants at Shinob Kibe in (A) 2018 and (B) 2019. There was a significant negative effect of flower number on fertilization success in both years, while the negative effect on filled seed proportion was significant only in 2018. Note that flower numbers are binned into categories for ease of interpretation but that flower number was not analyzed as binned data. See Appendix A for full statistical analysis.

Figure 7.
The effect of interplant distance on ovule fate averaged across three dwarf bear poppy populations in 2019. There was no significant effect of interplant distance on fertilization success, but the negative effect on filled seed proportion was significant. Note that interplant distances are binned into categories for ease of interpretation but that interplant distance was a continuous variable in the analysis See Appendix A for full statistical analysis.

Table 1.
Study site information for pollen addition experiment in 2018 and reproductive output studies in 2019 and 2020. See [16] for further location data.
Table 1.
Study site information for pollen addition experiment in 2018 and reproductive output studies in 2019 and 2020. See [16] for further location data.
| Year Evaluated | Land Ownership | Main Population | Sample Area | Area (ha) |
|---|---|---|---|---|
| 2018–2020 | TNC 1 | Shinob Kibe | Shinob Kibe Preserve | 4.13 |
| 2018–2020 | TNC | White Dome | White Dome Preserve | 325 |
| 2019–2020 | BLM 2, SITLA 3 | Red Bluffs | Tonaquint Block | 166 |
| 2019–2020 | BLM | Beehive Dome | Beehive Dome ACEC | 75 |
1 The Nature Conservancy, 2 USDI Bureau of Land Management, 3 Utah State School Trust Lands.
Table 2.
Fruit set percentage data from reproductive output studies of Arctomecon humilis from 1988 through 2021.
Table 2.
Fruit set percentage data from reproductive output studies of Arctomecon humilis from 1988 through 2021.
| Population/Site | Study Year | ||||||||
|---|---|---|---|---|---|---|---|---|---|
| 1988 1 | 1989 1 | 1997 2 | 2000 2 | 2012 1 | 2016 3 | 2018 4 | 2019 4 | 2020 4 | |
| Atkinville | - | - | 31.1 | - | 70.0 | - | - | - | - |
| Beehive Dome | 100 | 97.2 | - | 91.6 | 100 | 81.2 | - | 99.4 | 99.4 |
| Red Bluffs | - | - | 93.9 | 82.0 | 77.5 | 63.4 | - | - | - |
| Red Bluffs ORV | - | - | - | - | 75.0 | - | - | - | - |
| Red Bluffs Tonaquint | - | - | - | - | - | - | - | 97.6 | 99.5 |
| Shinob Kibe | - | - | - | - | - | 12.1 | 84.6 | 98.0 | 98.8 |
| Warner Ridge | - | - | - | - | 72.5 | 29.7 | - | - | - |
| Webb Hill | - | - | - | - | 87.5 | - | - | - | - |
| White Dome | - | - | - | 87.5 | 77.5 | - | - | 96.9 | 96.4 |
| Mean | 100 | 97.2 | 62.5 | 88.5 | 80.0 | 46.6 | 84.6 | 98.0 | 98.5 |
Publisher’s Note: MDPI stays neutral with regard to jurisdictional claims in published maps and institutional affiliations. |
© 2021 by the authors. Licensee MDPI, Basel, Switzerland. This article is an open access article distributed under the terms and conditions of the Creative Commons Attribution (CC BY) license (https://creativecommons.org/licenses/by/4.0/).
Share and Cite
MDPI and ACS Style
DeNittis, A.M.; Meyer, S.E. Reproductive Success of an Endangered Plant after Invasive Bees Supplant Native Pollinator Services. Diversity 2022, 14, 1. https://0-doi-org.brum.beds.ac.uk/10.3390/d14010001
AMA Style
DeNittis AM, Meyer SE. Reproductive Success of an Endangered Plant after Invasive Bees Supplant Native Pollinator Services. Diversity. 2022; 14(1):1. https://0-doi-org.brum.beds.ac.uk/10.3390/d14010001
Chicago/Turabian StyleDeNittis, Alyson M., and Susan E. Meyer. 2022. "Reproductive Success of an Endangered Plant after Invasive Bees Supplant Native Pollinator Services" Diversity 14, no. 1: 1. https://0-doi-org.brum.beds.ac.uk/10.3390/d14010001
Note that from the first issue of 2016, this journal uses article numbers instead of page numbers. See further details here.