
Genetic Detection and a Method to Study the Ecology of Deadly Cubozoan Jellyfish


1
College of Science and Engineering, Bebegu Yumba Campus, James Cook University, Townsville, QLD 4814, Australia
2
ARC Centre of Excellence for Coral Reef Studies, Bebegu Yumba Campus, Townsville, QLD 4814, Australia
3
Tropical Futures Institute, James Cook University, Singapore 387380, Singapore
4
ARC Research Hub for Supercharging Tropical Agriculture through Genetic Solutions, Bebegu Yumba Campus, Townsville, QLD 4814, Australia
*
Author to whom correspondence should be addressed.
Diversity 2022, 14(12), 1139; https://0-doi-org.brum.beds.ac.uk/10.3390/d14121139
Submission received: 24 November 2022
/
Revised: 13 December 2022
/
Accepted: 14 December 2022
/
Published: 19 December 2022
(This article belongs to the Special Issue Advances in the Diversity and Ecology of Zooplankton)
Abstract
:Cubozoan jellyfish pose a risk of envenomation to humans and a threat to many businesses, yet crucial gaps exist in determining threats to stakeholders and understanding their ecology. Environmental DNA (eDNA) provides a cost-effective method for detection that is less labour intensive and provides a higher probability of detection. The objective of this study was to develop, optimise and trial the use of eDNA to detect the Australian box jellyfish, Chironex fleckeri. This species was the focus of this study as it is known to have the strongest venom of any cubozoan; it is responsible for more than 200 recorded deaths in the Indo-Pacific region. Further, its ecology is poorly known. Herein, a specific and sensitive probe-based assay, multiplexed with an endogenous control assay, was developed, and successfully utilised to detect the deadly jellyfish species and differentiate them from closely related taxa. A rapid eDNA decay rate of greater than 99% within 27 h was found with no detectable influence from temperature. The robustness of the technique indicates that it will be of high utility for detection and to address knowledge gaps in the ecology of C. fleckeri; further, it has broad applicability to other types of zooplankton.
1. Introduction
Jellyfish of the classes Scyphozoa (true jellyfish) and Cubozoa (box jellyfish) are generally the largest types of non-colonial zooplankton [1]. Furthermore, they are of ecological importance as predators of fish larvae and other plankton, as well as structures in the pelagic environment that attract small fish and invertebrates (e.g., Trachurus spp. with Desmonema chierchianum) [2]. Furthermore, some jellyfish have been vilified as pests [3,4], invasives [5,6] and for affecting industries such as aquaculture and fisheries [7,8,9]. Cubozoans are represented by about 50 species [10] and many are notorious for their ability to cause painful and in some cases potentially deadly stings. This class of zooplankton poses a threat to both human health and enterprise resulting in an array of socio-economic impacts [3,11]. This is especially true for the Australian box jellyfish, Chironex fleckeri, which has been responsible for more than 200 deaths in the Indo-Pacific region [12]. Despite this, considerable knowledge gaps exist surrounding the ecology of this species and most other cubozoans. These gaps are a result of the challenges associated with detecting and subsequently studying these animals in their natural environment, resulting from their spatial and temporal variability, transparency, cryptic nature and the fact that they commonly reside in waters of low visibility [13]. Multiple techniques have been utilised to detect jellyfish, including in situ visual observations [14,15], various styles/sizes of netting [16,17,18,19], light attraction techniques [19,20,21], acoustics [22,23], and most recently drones [24,25,26]. Each method has benefits and limitations, depending on the application and ambient conditions. However, all require considerable effort/resources to be undertaken and sometimes have low levels of detection where the target organisms are well dispersed. It has been highlighted [3] that new techniques and technologies are needed to study cubozoans and to improve levels of detection; genetic detection techniques may be the solution [27].
Environmental DNA (eDNA) has gained considerable interest in recent years as a method for the detection of rare and cryptic organisms in terrestrial, aquatic, and marine settings [28,29,30]. eDNA refers to extra-organismal genetic material which has been shed by organisms through various physiological, behavioural, reproductive and defensive responses into their surrounding environment [31]. This technique works by utilising species-specific DNA identifiers to isolate the genetic material, eDNA, of a particular species from collected water, air, or soil samples [28,32,33]. This allows for the determination of the presence/absence and potentially abundance of a target species based on the presence/absence of its genetic signature [28,33]. The major interest in the technique as a detection tool is due to not needing specialised skills of identification based on the morphology of species [30,34,35,36,37]. eDNA has been used successfully for the detection of numerous cryptic organisms [38,39,40,41] and more recently has been applied to jellyfish [42,43,44,45,46].
The eDNA technique has been used to successfully detect jellyfish. Minamoto et al. [43] and Gaynor et al. [42] were the first to examine its use on scyphozoans and found the technique could detect both medusa and free-swimming larval stages (planula larvae and ephyra). Minamoto et al. [43] reported that the distribution of the jellyfish’s eDNA in both surface waters corresponded with the presence of the jellyfish, highlighting the technique’s potential as an ecological survey tool. The technique has recently been used to detect cubozoans, with Bolte et al. [44] reporting that they could detect the medusoid stage of three species (Copula sivickisi, Carybdea xaymacana and C. fleckeri). Further, the polypoid stage of C. sivickisi was detected near the substratum outside of the jellyfish season, when medusa are not found. Thus, eDNA has passed the proof-of-concept phase for the detection of jellyfish and the study of their ecology [44,47]. To ensure both accurate detection and interpretation of the technique for answering ecological questions, the best available procedures and processes should be utilised.
Probe-based assays are the most specific and accurate means to detect single species via the eDNA approach [48,49]. This is due to the use of an additional eDNA identifier, a TaqMan probe [48,50]. Currently, only a SYBR green assay exists for C. fleckeri [44]. Probe-based assays allow for the quantification of the amount of eDNA present in a collected sample which can aid in interpreting detection results [48]. Probes also allow for multiplexed quantitative Polymerase Chain Reactions (qPCR), and hence the use of internal positive controls (IPCs) to test for inhibitors within samples or, better yet, the use of an endogenous control assay [51]. This positive control monitors for the presence of non-target eDNA in collected water samples, through the use of a generic primer assay, to ensure robustness of methodological procedures [51,52]. If non-target eDNA is absent from a collected water sample, it highlights potential issues with the sample. Either methodological errors have occurred in one of the workflow steps of the technique, PCR inhibitors are present in the sample, or, in the case of target species detection, contamination has occurred. This positive control therefore examines for false negative/false positive detection while allowing for enhanced quality control of the entire eDNA workflow [51,53]. On top of utilising the best available procedures and processes, an understanding surrounding C. fleckeri’s eDNA decay is also needed for accurate interpretation of detection results [36].
Understanding surrounding persistence of eDNA in the environment is critical for its use as a proxy of species presence [54,55]. Persistence times ranging from hours/days [56,57] to months [58] have been found for differing species, and as a result is needed to be investigated on a per species basis [54,59]. Persistence of eDNA in an environment is influenced by both microbial degradation and transportation, with degradation being the primary cause [54]. Multiple abiotic factors (temperature, salinity, UV radiation, water turbidity and pH) have also been reported to both promote and/or slow eDNA decay [36,55,60,61]. As a result, an understanding of the decay of a species’ eDNA is required for the precise interpretation of detection results [28].
The objective of this study was to develop a specific and sensitive eDNA assay for the detection and study of the ecology of the Australian box jellyfish, Chironex fleckeri. Specifically, this was undertaken through (1) developing and optimising a C. fleckeri specific detection assay, (2) multiplexing the assay with an endogenous control assay for enhanced quality control, (3) in situ testing of the multiplexed detection assay, and (4) determination of the decay rate of C. fleckeri eDNA at different temperatures.
2. Materials and Methods
2.1. Sequence Database Creation
A database of all currently available mitochondrial DNA 16S ribosomal RNA gene (16S) sequences for C. fleckeri and sympatric species (Table 1), from the GenBank nucleotide database (National Centre for Biotechnology Information, NCBI [62]), was assembled using Geneious Prime 2021.2.2 (Dotmatics, New Zealand, http://www.geneious.com) (accessed on 1 September 2020). The 16S gene was selected due to it consisting of highly conserved sequences interspersed with species-specific variable regions, making it ideal for species-specific assay design [63]. To supplement available sequences, genomic DNA (gDNA) was extracted from eight C. fleckeri medusae specimens collected from four geographically distinct locations across northern Australia (Figure 1), and from sympatric jellyfish species known to occur within C. fleckeri’s range (Table 1). Specimens were collected as part of previous work undertaken by the Reef and Ocean Ecology Laboratory (ROEL), James Cook University (JCU), shared by collaborators, or were captured and provided by Surf Life Saving Queensland (SLSQ) (Table 1). gDNA was extracted through use of the Qiagen DNeasy Blood and Tissue Kit (Qiagen, Venlo, The Netherlands) as per manufacturer’s protocol (exception of conducting overnight tissue lyse). An end-point PCR was then performed to isolate a 584 bp length of the 16S gene, through use of universal jellyfish 16S primers, as per Bolte et al. [44] (Table S1). PCR product, confirmed to be the desired sequence via visualisation on an agarose gel (1.5% gel, 60 V for 40 min against an Easy Ladder 1 and negative control), was then sent to the Australia Genome Research Facility (AGRF) for clean-up and bidirectional Sanger Sequencing. Returned sequences were Blast N searched, through use of the NCBI database, to verify their taxonomic identity, and finally all C. fleckeri and sympatric species sequences were aligned (MUSCLE with 10 iterations) with single nucleotide polymorphisms (SNPs) between individual C. fleckeri sequences being noted for consideration in assay design. A tree was also assembled utilising IQ-TREE v1.6.12 [64] (ultrafast bootstrap analysis; Hoang et al. [65]) to examine the intraspecific similarity of C. fleckeri sequences and interspecific divergence between C. fleckeri and sympatric species for the 16S gene. This tree displayed both sufficient intraspecific sequence similarity and interspecific divergence, confirming appropriate use of the 16S gene for primer and probe design (Figure S1).
2.2. Assay Design
To design candidate primers and probes (eDNA identifiers), the sequence database was analysed through use of Geneious Prime and Allele ID (Version 2021.2.2; Premier Biosoft, San Francisco, CA, USA). These bioinformatic programs suggest candidate identifiers, based upon several criteria (base-pair length, melting temperature, GC content, presence/absence of hairpins and GC clamps, occurrence of self- and hetero-dimer formation), which may be suitable for species-specific eDNA detection [48,70]. These suggested identifiers were also further assessed through use of OligoAnalyzer [71] and the Sequence Manipulation Suite [72]. Once candidate identifiers passed the above selection criteria, intraspecific sequence similarity, incorporating previously identified SNPs, was examined and inappropriate candidate identifiers were excluded from further assessment. Interspecific sequence divergence was then examined and candidate identifiers with significant mismatches in the 3′ end for primers and the ‘middle’ for probes to sympatric species sequences were kept for further in silico analysis. Finally, remaining candidate identifiers were checked for specificity to C. fleckeri through use of NCBI’s Primer-Blast [73] and Blast N [74] assessment tools. Candidate primers and a minor groove binding (MGB) TaqMan probe, which passed all in silico assessments, were ordered (Applied Biosystems, ThermoFisher Scientific Pty Ltd., Victoria, Australia) for in vitro validation and optimisation.
2.3. Assay Validation and Optimisation
The candidate C. fleckeri assay was examined to ensure that in silico specificity occurred in vitro. This was conducted via use of an exclusion qPCR. The assay was tested against ~80 ng of C. fleckeri and sympatric species gDNA in triplicate reactions using a QuantStudio 3 Real-Time PCR system (Applied Biosystems, ThermoFisher Scientific Pty Ltd., Victoria, Australia). Each reaction contained gDNA template, 5 μL of TaqMan Environmental Master Mix 2.0 (Life Technologies, Carlsbad, CA, USA), 0.7 μM sense and anti-sense primers and 0.25 μM TaqMan probe and was adjusted with MilliQ water to a final volume of 10 μL. A two-step cycling profile was utilised; 95 °C for 10 min, followed by 50 cycles of 95 °C for 15 s and 60 °C for 1 min. Any amplicons from sympatric species were sent to AGRF for clean-up and bidirectional Sanger sequencing for verification.
To ensure optimal working conditions of the C. fleckeri assay, optimisation trials concerning annealing temperature (Ta) and primer concentrations were undertaken. The optimal Ta of the assay was determined through use of an end-point temperature gradient PCR (primers only). This was centred ~5 °C below the predicted nearest neighbour melting temperature of the sense and anti-sense primers (65 °C), ranging from 50 °C to 65 °C, in triplicate reactions using an Eppendorf Mastercycler Nexus GSX1 (Eppendorf Pty Ltd., Hamburg, Germany) (thermocycling conditions: 95 °C for 3 min, followed by 50 cycles of 95 °C for 30 s, 60 °C for 30 s and 72 °C for 1 min, with final extension step of 72 °C for 10 min). Each reaction contained gDNA template, 2.5 μL X10 PCR buffer, 0.5 μL of dNTPs, 1.5 μL of MgCl2, 0.5 μM sense and anti-sense primers, 0.1 μL Taq polymerase and was adjusted with MilliQ water to a final volume of 25 μL. Optimal Ta was chosen based on the presence and intensity of a single band (no primer-dimer) as visualised on a 1.5% agarose gel (60 V for 40 min against an Easy Ladder 1 and a negative control). Optimal primer concentrations, which allowed for quickest amplification, were determined via a concentration gradient qPCR. Concentrations ranging from 200 to 900 nM at 100 nM increments, with a constant probe concentration of 250 nM, were tested in triplicate. Reaction and cycling conditions were as per the above exclusion qPCR. The optimal primer concentration was chosen based on reliable target amplification at the lowest number of quantification cycles.
2.4. Assay Efficiency and Sensitivity
Efficiency and sensitivity of the C. fleckeri specific TaqMan assay was assessed through use of standard curves. Synthetic DNA (sDNA; gBlocks—Integrated DNA Technologies Pty Ltd., New South Wales, Australia) of 200 bp in length, and designed with a 7 bp reverse complemented region (cross contamination control), was utilised as the standard for this assessment due to the ease of calculating copy number. The sDNA fragment was designed based on the 16S C. fleckeri consensus sequence utilised for assay design (See Section 3.1). sDNA was resuspended as per manufacturer instructions and concentration was quantified via use of a Quantus Fluorometer (Promega; Madison, WI, USA). The copy number was calculated through conversion of the determined concentration (10 ng μL−1) utilising Avogadro’s constant, double-stranded molecular weight and the known bp length of the sDNA sequence (as per manufacturer instructions). A 10-point standard curve using 10-fold serial dilutions of sDNA, ranging from a theoretical 1 billion to one copy μL−1, was utilised to examine assay efficiency. This was calculated using the QuantStudio Design and Analysis Software (Version 2.6.0, ThermoFisher Scientific Pty Ltd., Victoria, Australia). Standards ranging from a theoretical 1000 to 0.01 copies μL−1, again using 10-fold serial dilutions of sDNA, were further utilised to examine the assay’s Limit of Detection (LoD) and Quantification (LoQ). Nine replicates per standard were run. The Generic qPCR LOD calculator R script [75] was utilised to calculate these metrics. A Weibull type II two parameter function which an upper limit of one was selected as the best fitting model (lack of fit test: F (52, 4) = 0.056, p = 0.99) and was subsequently used to determine the effective LoD for each quantity of qPCR replicate.
2.5. Endogenous Control Assay and Multiplexed qPCR
To enhance quality control of this genetic tool, an endogenous control assay was multiplexed with the C. fleckeri assay. A 16S endogenous control assay developed by Furlan and Gleeson [51] (generic fish assay) was selected for use. In silico testing was undertaken to ensure the assay would also work for marine samples. It was tested against 16S and complete genome sequences of common marine fish species (obtained from the GenBank nucleotide database; NCBI [62]) which are known to reside in North Queensland, Australia (Table S2). The endogenous assay was further checked for hetero-dimer formation with the C. fleckeri assay and was assessed using NCBI’s Primer-Blast tool [73] to ensure it would not amplify C. fleckeri DNA. Following these in silico assessments, the C. fleckeri and endogenous control assays were multiplexed, and in vitro trials were undertaken.
Specificity of the species-specific assay was re-examined in the presence of the endogenous control assay to ensure it did not promote the amplification of other cubozoan species. This was again undertaken using a QuantStudio 3 Real-Time PCR system, in triplicate reactions. Each reaction contained gDNA template, 10 μL of TaqMan Environmental Master Mix 2.0, 0.7 μM sense and anti-sense C. fleckeri specific primers, 0.25 μM C. fleckeri specific TaqMan probe, 0.525 μM sense and anti-sense endogenous control primers and 0.25 μM endogenous control TaqMan probe, and was adjusted with MilliQ water to a final volume of 20 μL. A two-step cycling profile was again utilised (See Section 2.3). Any amplicons from sympatric species were sent to AGRF for clean-up and bidirectional Sanger sequencing for verification. The species-specific assay’s efficiency was also re-examined to ensure addition of the endogenous control assay had no influence upon it. Two five-point standard curves using 10-fold serial dilutions of sDNA, ranging from a theoretical 500 million to 50 thousand copies μL−1, with three replicate samples of each dilution, were undertaken. The first of the two standard curves examined efficiency of the C. fleckeri assay alone, with the second examining its efficiency when multiplexed with the endogenous control assay. The endogenous assay was used at 0.75× the concentration of the C. fleckeri specific assay to ensure it did not compete with the C. fleckeri assay for available reagents. Each assay also utilised differing fluorophores (C. fleckeri; FAM—495–520 nm. Endogenous; VIC—538–554 nm) which fluoresce at different wavelengths to ensure each was easily distinguishable from the other.
2.6. eDNA Collection and Preservation
Collection and handling of eDNA needed to be undertaken with utmost care due to the risk of both false negative and false positive detection [28,52,76,77]. Prior to entering the field, all equipment utilised to collect and filter eDNA samples was bleached (10% solution for 24 h), thoroughly rinsed with reverse osmosis (RO) water, and exposed to UV (1 h). This was to ensure any potential DNA contaminates were removed. The equipment was also appropriately packaged to further remove risk of contamination while sampling in the field.
For each collection site, duplicate 2 L water samples were collected. The 2 L volume was chosen due to previous successful detection [44]. This was undertaken through utilising sterile 2 L jars which were held windward of the boat with use of a ‘jar holder’, as a kind of advection current to limit potential contamination. Water samples were collected from the top 0.5 m of the water column and were filtered in the field immediately after collection (to limit potential eDNA decay and loss of sample). Samples were filtered through use of 300 mL MicroFunnel Filter Funnels (Pall, NY, USA), 5 µm nylon net filters (Merck, NJ, USA) and a peristaltic pump. Filters were rolled and cut in half, with each filter half being placed into separate 2 mL microtubes containing 1.5 mL of Longmires buffer. Longmires buffer is ideal for lengthy eDNA storage and transport at tropical ambient temperatures [78,79]. An equipment control, prior to sample collection, was also undertaken. This consisted of filtering 250 mL of MilliQ water to ensure that the equipment used (collection cup, forceps, and scissors) to collect the subsequent sample was not contaminated. New sterile equipment (collection cup, filter funnel, forceps and scissors) and gloves were used/worn for every replicate sample to inhibit potential contamination. All samples upon completion of field work were stored in temperatures of 4 °C until processed.
2.7. eDNA Extraction and Purification
To extract the collected eDNA from the filters, the PPLPP (preserve, precipitate, lyse, precipitate, and purify) method, developed by Edmunds et al. [78] and adapted for extraction from filter papers stored in 2 mL microtubes by Cooper et al. [38], was utilised. The PPLPP method first precipitates extracellular DNA via NaCl and isopropanol; a lysis step (chemical and mechanical) is then undertaken, followed by a second precipitation step utilising polyethylene glycol, and finally the extracted eDNA is washed twice in 75% ethanol and eluted in elution buffer (TE buffer). This extraction technique was utilised as, combined with the use of Longmires buffer to store samples, it was found to yield a significantly higher concentration of eDNA in comparison to the widely used Qiagen DNeasy extraction kit [38]. Following extraction of collected eDNA, it was purified through use of the Zymo One Step PCR Inhibitor Removal kit (Zymo IR; Zymo Research; Irvine, CA, USA), as per manufacturer’s instructions. Purified DNA was stored in −20 °C conditions until quantified.
2.8. Quantitative PCR
The multiplexed assays were utilised to detect, quantify, and interpret presence of C. fleckeri eDNA via qPCR. QuantStudio 3 and 5 Real-Time PCR systems (Applied Biosystems, ThermoFisher Scientific Pty Ltd., Victoria, Australia) were utilised for this purpose. Each reaction consisted of 2 μL of eDNA template, 10 μL of TaqMan Environmental Master Mix 2.0, 0.7 μM sense and anti-sense C. fleckeri primers, 0.525 μM sense and anti-sense endogenous control primers, and 0.25 μM of both C. fleckeri and endogenous control TaqMan MGB probes, and was adjusted with MilliQ water to a final volume of 20 μL. A two-step cycling profile was utilised; 95 °C for 10 min, followed by 50 cycles of 95 °C for 15 s and 60 °C for 1 min. Each replicate water sample had six technical replicates and each plate contained at least three negative controls, extraction blanks (negative control monitoring contamination during extraction procedures), a positive control (C. fleckeri gDNA template) and sDNA standards (10 thousand to one copy μL−1) which acted to ensure consistency among plates and allowed for quantification. qPCR plates were prepared in a laminar flow hood to minimise potential contamination. Positive detection of C. fleckeri for a water sample was reported with minimum amplification of a single technical replicate. Replicate samples were combined for reporting purposes. Any positive detection was confirmed to be C. fleckeri through clean up and bidirectional sanger sequencing of PCR product (undertaken by AGRF) and cross checking against reference sequences.
2.9. In Situ Validation of Multiplexed Assays
The aim of in situ sampling was to detect C. fleckeri medusae where they were known to be present and, therefore, to validate the multiplexed assay method. eDNA samples were collected from Horseshoe Bay on Magnetic Island (19°07′03″ S, 146°51′09″ E) and outside the Port of Weipa, Queensland, Australia (12°41′01″ S, 141°48′14″ E) during the 2020 jellyfish season (15 December and 1 December, respectively) (Figure 2). Sampling sites were chosen based on locations known to have, or have had, C. fleckeri medusae. At Horseshoe Bay, three shore sites (sites 2, 3, 4) were sampled, along with a site within the creek located within the bay (site 1). Two additional sites, one along the shore (site 6) and one within a creek (site 5), in neighbouring Maud Bay, were also sampled. SLSQ reported the presence of C. fleckeri medusae within Horseshoe Bay in the week prior to sampling. Near Weipa, two sites were sampled along the beach at the entrance to the port. Seine netting to catch medusae was utilised to ground truth any positive detections, with a single individual (2.5 cm IPD) being caught (site 2).
2.10. Effect of Temperature upon C. fleckeri eDNA Decay
2.10.1. Collection of Study Organisms
C. fleckeri medusae were collected at Port Musgrave, Mapoon in December of the 2020 jellyfish season (Figure 1). The animals (n = 18 medusae) were collected with a 40 m beach seine. All animals were collected in accordance with permit number 207,602 (Department of Agriculture and Fisheries, Queensland State Government) and captured medusae were transported in large drums to Weipa, Queensland, where experimentation was undertaken.
2.10.2. Experimental Design
Seawater from a ~1800 L tank containing C. fleckeri medusae (n = 18, average inter-pedalia distance (IPD) of 3.2 cm) was utilised to examine the species’ eDNA decay rate. All medusae were placed into the tank for a 2 h acclimation/shedding period to ensure sufficient and well dispersed C. fleckeri eDNA throughout the tank. The tank was continuously circulated (closed system) and maintained at an ambient temperature (27 °C), and 30 L of seawater, post acclimation, was then transferred into 24 individual tanks (closed systems). Four replicate 2 L samples were also taken from the large tank at this point to serve as time zero samples. The 24 tanks were randomly assigned a sampling time, approximately one (27 h), three (73 h) or six days (140 h) after removal from the tank (n = 8 samples per time), and half (n = 4 samples) were further randomly assigned to one of two temperature-controlled water baths. These baths were maintained at 26 °C and 28 °C, through use of Aqua Medic Titan 2000 cooling units. Tinytag TG-3100 data loggers were placed within each bath to confirm stable temperatures for the duration of the experiment (Figure S2), and the temperature of each experimental water replicate was checked daily until sampled. A positive control sample, from the large holding tank containing C. fleckeri individuals, was taken to confirm detection, or lack thereof, of C. fleckeri at each sampling time within the experimental water. All equipment used to transport and house experimental water was sterilised (10% bleach and UV) prior to use to ensure potential DNA contaminates were removed. A two-way analysis of variance (ANOVA) was utilised to examine differences in eDNA quantities with the factors times (a = 2) and temperature (b = 2); all factors were treated as fixed. Tukey’s a posteriori test was used to detect differences between treatments. Data were log transformed to satisfy the assumptions of the statistical test. Tests were conducted using R (Version 4.1.2, R Core Team, Vienna, Austria).
3. Results
3.1. Assay Design and In Vitro Validation
Sense and anti-sense primers and a 5′ FAM labelled TaqMan probe with a 3′ MGB nonfluorescent quencher molecule (NFQ) were identified and designed between base pairs 165 and 311 on the C. fleckeri 16S gene consensus sequence (Table 2 and Figure 3). Specific selection characteristics of the identifiers are provided (Table S3). Numerous base pair mismatches were observed between the identifiers and sympatric species’ 16S gene sequences (Figure 3). A minimum of 17 (A. alata), and a maximum of 33 (T. ohboya) total base pair differences were noted (Table S4). Subsequently, all exclusion qPCR tests revealed the TaqMan assay to amplify only the 147 bp 16S C. fleckeri target sequence, hence confirming the assay’s specificity.
All tests showed strong amplification of C. fleckeri synthetic DNA and genomic DNA from all four geographically distinct locations, covering the range of the species across northern Australia (Figure 1). Optimisation trails indicated an optimal Ta of 60 °C, which matched the Ta of the endogenous control assay (60 °C), and optimal primer concentrations of 700 nM with a probe concentration of 250 nM. All negative controls showed no amplification of either C. fleckeri or marine fish DNA in all in vitro trials.
3.2. Assay Efficiency and Sensitivity
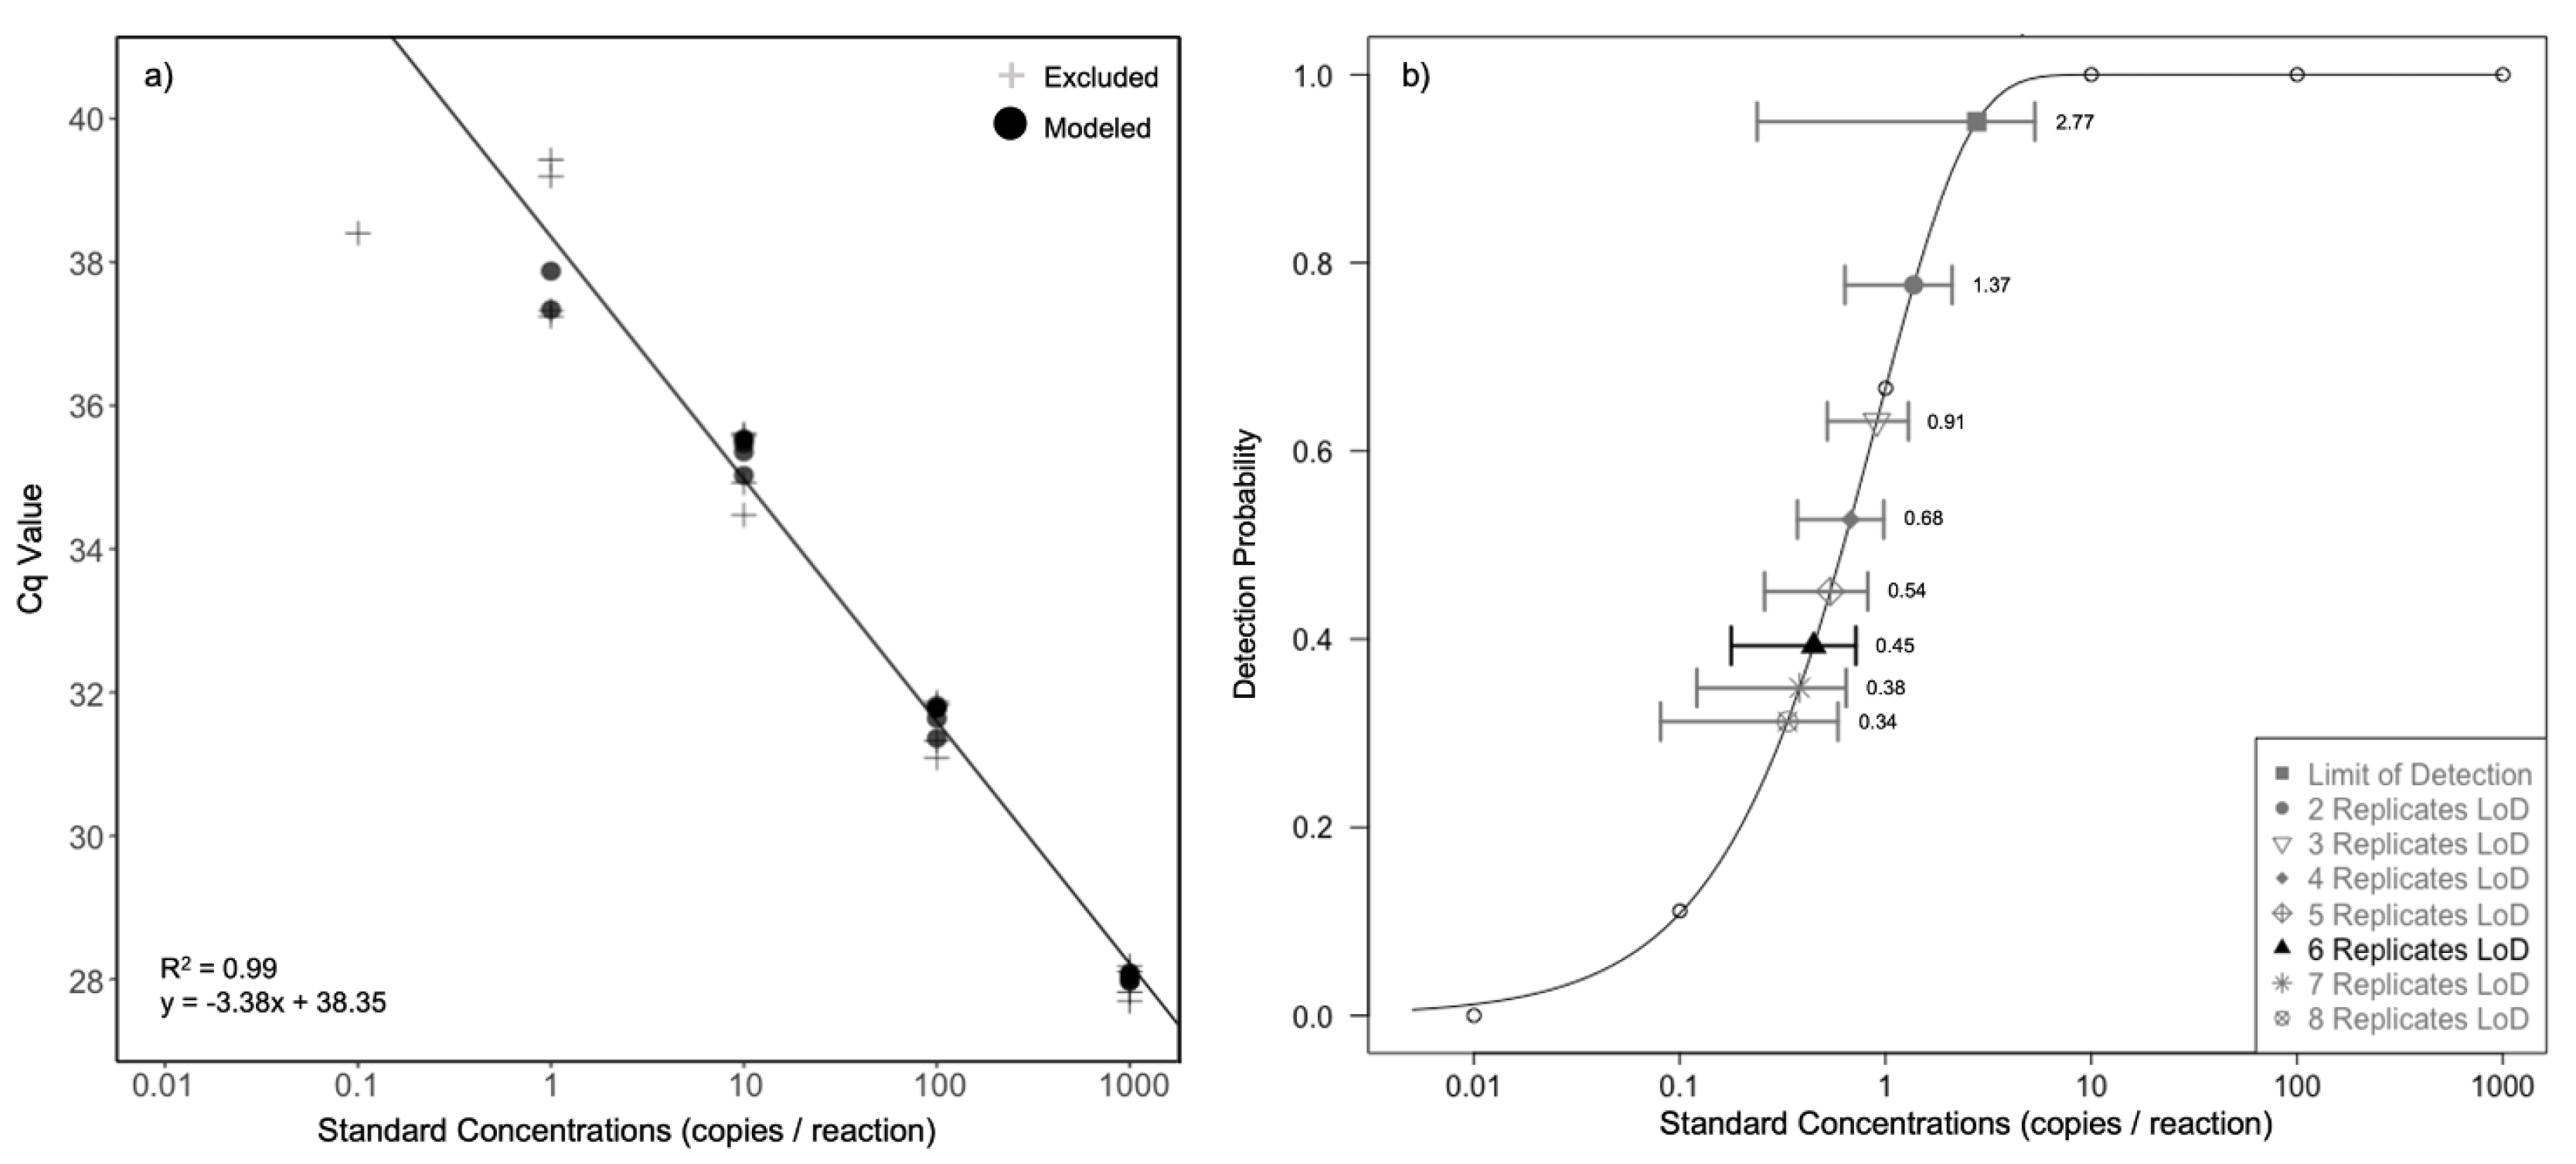
The C. fleckeri assay was found to have both a high efficiency and sensitivity. A 10-point standard curve using 10-fold serial dilutions of sDNA, ranging from a theoretical 1 billion to one copy μL−1, showed the C. fleckeri assay to have an appropriate efficiency (efficiency = 93.9%, slope = −3.47, R2 = 0.994). The assay was also found to have a high sensitivity with an effective LoD, using six technical replicates for each replicate water sample, of 0.45 copies/reaction, and a modelled LoQ of 6 copies/reaction (Figure 4).
3.3. Multiplexed qPCR Assays
The endogenous control assay was found to multiplex successfully with the C. fleckeri assay (Figure S3). Although the endogenous assay was designed to amplify freshwater fish species of Australia, in silico bioinformatic investigations found it to also detect numerous marine fish species common to northern Australia (Table S2). In addition, the endogenous assay was found to not amplify any cubozoan DNA (as per NCBI’s Primer-Blast tool, and subsequently in vitro testing), hence not affecting the specificity of the C. fleckeri assay. The efficiency of the C. fleckeri assay was also found to not be influenced by the presence of the endogenous control assay (Table S5).
3.4. In Situ Validation
Detection of C. fleckeri was found at all four sampling locations within Horseshoe Bay, Magnetic Island, and at both sites outside the Port of Weipa (Table 3). The amplified target sequences matched the C. fleckeri consensus sequence, thereby validating the use of the developed C. fleckeri assay to detect the jellyfish in situ. Further, all samples displayed amplification of non-target eDNA via the use of the endogenous control assay, ensuring appropriate methodological procedures, lack of inhibitors, and further validation of the detection technique. The Maud Bay sample sites at Magnetic Island showed no presence of C. fleckeri eDNA, indicating absence of the animal. SLSQ and seine net drags confirmed the physical presence of C. fleckeri at both Horseshoe Bay and Weipa, hence ground truthing positive detections. No jellyfish were collected in Maud Bay.
3.5. Chironex fleckeri eDNA Decay and the Influence of Temperature
The eDNA signal of C. fleckeri decayed rapidly within the first 27 h of the experiment, representing a loss of 99%. This change in eDNA quantity, between time zero and the first sampling time (27 h), was found to be significant for both temperature treatments (p ≤ 0.0001). In addition, eDNA quantity was found to be less than 1% of the initial quantity at this sampling time for both the 26 °C and 28 °C temperature treatments (0.94 and 0.28%, respectively) (Figure 5).
The decay rate constants for the two temperature treatments were estimated to be 0.068 h−1 and 0.057 h−1. The eDNA quantities between the two temperature treatments were not significantly different (F = 1.11, df = 1, p = 0.30, Figure 5). Further, no significant difference was found between them at each sampling time (p = 0.90–27 h; p = 0.63–73 h; p = 0.74–140 h). Accordingly, all data points from both treatments were combined and the decay rate constant of these points was estimated as 0.060 h−1, with a corresponding half-life of 11.47 h. Positive controls (n = 3) from the holding tank contained C. fleckeri eDNA, in high quantities at each sampling time, verifying that decay of the species’ eDNA was occurring within experimental tanks. The temperatures of the baths were consistent throughout the experiment (26 °C; 26.17 ± 0.21, 28 °C; 28.19 ± 0.31) and daily monitoring showed consistent temperatures of the experimental water.
4. Discussion
In this study, we have developed and successfully utilised a specific and sensitive eDNA assay for detecting Chironex fleckeri. This genetic tool was designed to meet development criteria, and was undertaken with optimised collection, extraction, and best practice control procedures and processes. This ensured the reliability of both positive and negative detection results. A rapid eDNA decay rate (0.060 h−1), with no detectable temperature influence, was also shown. Accordingly, the technique is robust in providing crucial information on the spatial and temporal presence of medusae within three days of the jellyfish being present. The method can help to determine the risk of envenomation and provide a tool for ecological studies.
4.1. Assay Development and Informative Controls
High performing eDNA assays are critical for the detection of cryptic and especially dangerous organisms due to the risk of false positive and false negative detection [29,80]. If an assay fails to be specific to the target species, or fails to be sensitive enough to detect low copy target DNA, errors in detection can occur [29,80]. As a result of this, this study undertook a thorough design and validation process to ensure the suitability of the developed eDNA detection assay [48,75]. Firstly, the assay was designed to be specific to only C. fleckeri and to detect the species across its range in northern Australia. The ability of the technique to be utilised throughout its range and not just at a single study location is essential for its wide-use application as a detection tool. Locations where the species is known to occur outside of Australia were not considered in this process due to the unavailability of reference specimens. To ensure assay specificity, the eDNA primer and probe sequences were designed to contain extensive mismatches with sympatric species sequences. A minimum of five mismatches across all three eDNA identifiers, and a minimum of three specifically in the probe, is sufficient for the exclusion of non-target species [38,48]. For the developed C. fleckeri assay, total mismatches ranged from 17 to 33, with a minimum of five in each primer and six in the probe, exceeding the minimal recommended mismatches considerably [38,48]. The assay was designed to contain extensive mismatches to ensure and safeguard specificity. Secondly, the C. fleckeri assay was found to be highly sensitive. This is critical for the detection of cryptic and spatially disperse species as their eDNA is likely to be of low quantities in the environment [29]. Understanding assay sensitivity is also crucial for appropriate interpretation of detection results, and hence was determined through modelling detection (LoD) and quantification (LoQ) limits [75]. The developed assay was found to be highly sensitive (0.45 copies/reaction) and of similar or greater sensitivity to numerous published eDNA detection assays [29,38,39,75]. The high specificity and sensitivity of the C. fleckeri assay, in addition to the use of optimised collection and extraction methods for filter-based eDNA detection of cryptic species [38,39,78], provides assurance of a powerful and reliable tool for detection of the jellyfish.
In addition to high performing eDNA assays, multiple control measures are required to ensure accuracy of the technique [52]. Failure to implement adequate controls to monitor the assay’s quality and success leave it susceptible to error [51,52]. An endogenous control assay was multiplexed with the C. fleckeri assay and was critical to identify and exclude vulnerability to false negative detection. Furlan and Gleeson [51] highlighted the inadequate use of in situ positive controls, subsequently leaving the technique vulnerable to false negative detection. For most studies, positive controls are only utilised to monitor the PCR amplification step, leaving potential methodological errors occurring in previous workflow steps undetected [51]. Monitoring the success of all steps is crucial for confirming both positive and negative detection results. The endogenous control assay developed by Furlan and Gleeson [51] was utilised successfully here for marine samples and is an ‘all-in-one package’ for monitoring method success and inhibitor presence. The benefits of this control outweigh the additional development and operational costs. Accordingly, we concur with Furlan and Gleeson [51], and encourage the implementation of this additional assay to probe-based workflows, particularly when the technique is being utilised to inform management decisions or investigate ecological hypotheses.
4.2. eDNA Decay and Temperature Influence
A rapid decay rate for C. fleckeri eDNA (0.060 h−1) was found in this study. This rate is comparable to those found for both Chrysaora pacifica and Copula sivickisi (Table 4), further adding to the evidence of rapid eDNA decay for jellyfish [43,44]. The rate found for C. fleckeri is further comparable to that of multiple marine fish species [81], marine invertebrates [82,83], and falls within the 10–50 h half-life range found for the majority of marine organism eDNA [55] (Table 4). The rapid eDNA decay of C. fleckeri suggests that positive detections of the animal represent their close proximity. This is especially because they are found in weak nearshore currents and often have limited movements [84]. Further, in the present study, the rate of decay was quantified in a mesocosm and is probably conservative due to additional unexamined in situ factors, such as transport [54], diffusion [85] and geochemical adsorption [86]. These are known to further decrease persistence of eDNA in the environment [54]. Ely et al. [57] undertook a study examining this through introducing foreign eDNA (414 g of homogenised Ctenopharyngodon idella muscle tissue) into a protected bay and found the signal to be undetectable after 7.5 h compared to the multi-day persistence found in mesocosm studies. Chironex fleckeri’s rapid eDNA decay rate is ideal for the technique’s use as a proxy for the jellyfish’s presence, and is beneficial for its potential use as a management and ecological survey tool.
Understanding the influence of abiotic factors upon eDNA persistence in the environment is critical for understanding the technique’s capabilities [54,55]. It is essential to determine which factors may promote or slow eDNA decay, especially if sampling across differing environments [55]. This study examined the influence of temperature upon the decay rate of C. fleckeri eDNA; however, despite temperature being extensively reported to have influence [58,60,87,88], no effect was found under our experimental temperatures. Similar findings were also reported for Crown-of-Thorns starfish (Acanthaster spp.), where a similar temperature range was examined [82]. Minor temperature changes, as a result, are unlikely to influence eDNA persistence in the environment. As water temperature varies by only a few degrees Celsius at any one time across C. fleckeri’s range in northern Australia [89], it is unlikely to be a factor affecting persistence of the jellyfish’s signal and subsequently its interpretation. It should be noted, however, that if sampling in areas where water temperatures between sites/seasons vary on a larger scale (10s of degrees Celsius), temperature likely will have an influence as multiple studies [58,90] have reported significantly longer persistence times in colder (5 °C) waters. The influence of the remaining abiotic factors should also be examined to further explore the capabilities of the technique, specifically the influence of salinity, as C. fleckeri commonly reside in estuarine environments. Higher salinities have been reported to decrease eDNA persistence times [55]. In addition, understanding eDNA dynamics will play a critical role in utilising the eDNA technique in a quantitative manner, which subsequently may allow for quantification of target species’ abundances [54,91].
4.3. Application and Implications of Cubozoan Detection with eDNA
This study successfully detected the presence and absence of the medusa stage of C. fleckeri at two locations and further displays the successful use of eDNA to detect jellyfish [42,43,44,45]. Further, the technique can be utilised to detect C. fleckeri across its range in northern Australia. The assay may also work across the species entire range [47]; however, further in silico testing is needed. eDNA provides a means to overcome the challenges associated with jellyfish detection while being both cost effective and less labour-intensive. Additionally it allows for an increased probability of detection as eDNA disperses into the local surrounding environment [27]. There is potential to determine eDNA dispersal, hence the distance of detection from the target species, with biophysical modelling [92]. In addition to traditional methods, eDNA provides an extra tool for detection, which can be utilised for all species and in any environment. The technique also removes the need to handle highly venomous jellyfish species, and makes sampling in environments where other dangerous organisms (e.g., estuarine crocodiles) reside safer. eDNA overall allows for a more efficient and sensitive detection tool.
eDNA clearly has the potential to be utilised as a tool to address critical knowledge gaps surrounding cubozoan ecology and other plankton. It provides a spatially explicit detection tool, which is key for investigating and exploring species distributions and multi spatial scale population structures [47]. Considerable evidence exists showing cubozoan stocks being of small spatial scales [47,84,93,94], and eDNA may be utilised to further explore this, in addition to traditional genetic approaches [47]. Minamoto et al. [43] found a correlation between eDNA distribution and the visual presence of C. pacifica medusae. This and mounting evidence of limited eDNA dispersal [92,95,96], and rapid jellyfish eDNA decay rates, display eDNA’s potential to examine cubozoan spatial and temporal distributions. Further, the potential use of eDNA as a proxy for species abundance/biomass has been demonstrated in the literature for numerous species [97,98,99,100,101,102]. Minamoto et al. [43] found a direct correlation between eDNA concentration and the number of C. pacifica individuals in surface waters, highlighting the potential of this for jellyfish. To determine if eDNA can be utilised in this matter for cubozoans, in situ trials and mesocosm experimentation are needed. The ability to gain both distribution and abundance data on cubozoans via eDNA would significantly increase our ability to investigate cubozoan population dynamics.
As most cubozoan jellyfish have both benthic and pelagic life history stages, occurring at differing times, it may be possible to identify source locations (polyp beds) when medusae are absent from waters. Bolte et al. [44] used eDNA to successfully detect C. sivickisi polyps when medusae were absent and the only source of eDNA could be from polyps. The ability to locate sources of polyp beds would be ‘game-changing’. Both understanding on ecology and subsequent management of cubozoans would significantly benefit. There is also potential for the technique to be utilised to monitor potential range expansions of deadly species, which is a concern held by scientists with the oncoming of climate change [13,103,104,105]. The technique has also already been utilised to determine species responsible for stings via swabbing sting sites on victims, and so may also increase accuracy in data surrounding jellyfish envenomations [106]. Further, Ames et al. [45] demonstrated the ability of this technique to be utilised in a field-based manner, and so there is potential for its use to provide real-time detection data to better inform coastal managers.
5. Conclusions
Cubozoan jellyfish are medium to large zooplankters that often pose a threat to humans and business; furthermore, crucial gaps exist in our understanding of their ecology [3,11,13]. This study has demonstrated the potential for a highly specific and sensitive detection tool, environmental DNA (eDNA), for the dangerous cubozoan species, C. fleckeri. Utilisation of optimised methodologies [38,39], a species-specific probe-based and endogenous control assay [51] provided an effective means for cubozoan detection. The study also assessed critical aspects of C. fleckeri eDNA dynamics and found a rapid eDNA decay rate (99% in 27 h) that was consistent at different temperatures. This indicates that medusae would have to be in close proximity for detection, and with knowledge of decay rates, biophysical calculation on the sources of eDNA could be undertaken. The eDNA technique is an effective means for cubozoan detection, to address knowledge gaps in their ecology, and has broad applicability to other types of zooplankton.
Supplementary Materials
The following supporting information can be downloaded at: https://0-www-mdpi-com.brum.beds.ac.uk/article/10.3390/d14121139/s1, Table S1: Primers used to isolate 584 bp length of jellyfish mt 16S rRNA gene; Figure S1: Intraspecific similarity of Chironex fleckeri sequences and interspecific divergence between C. fleckeri and sympatric species for the mt 16S rRNA gene. Bootstrap values greater than 50% are displayed above the branch nodes. The tree was maximum likelihood generated utilising the substitution models GTR + F + I + G4 with sequence regions ranging from ≤418 to ≥763 bp; Table S2: List of marine fish species NCBI accession numbers and country of origin for all existing mt 16S rRNA/complete genome sequences used for in silico testing of the endogenous control assay; Figure S2: Tinytag TG-3100 data logger temperature data for duration of the C. fleckeri eDNA decay experiment. (a) Logger 1–26 °C bath, (b) Logger 2–26 °C bath, (c) Logger 3–28 °C bath, (d) Logger 4–28 °C bath; Table S3: Primer selection characteristics; Figure S3: Amplification Plot of Multiplexed Assay showing amplification of FAM dye-labelled Chironex-specific assay (red) and VIC dye-labelled endogenous control assay (blue); Table S4: Base pair (bp) differences between Chironex fleckeri identifiers and sympatric jellyfish species; Table S5: Efficiencies of the Chironex fleckeri specific detection assay when independent and multiplexed with the endogenous control assay.
Author Contributions
Conceptualisation, S.J.M., D.R.J. and M.J.K.; writing—original draft preparation, S.J.M.; writing—review and editing, S.J.M., D.R.J. and M.J.K.; data collection, S.J.M.; analysis, S.J.M. All authors have read and agreed to the published version of the manuscript.
Funding
This project was partly funded by funds to S.J.M. from the Australian Lions Foundation for Scientific and Medical Research on Marine Species Dangerous to Humans, funds to S.J.M. from the ER Walker Bequest Bursary and funds to M.J.K. from the ARC Centre of Excellence for Coral Reef Studies.
Institutional Review Board Statement
Not applicable.
Informed Consent Statement
Not applicable.
Data Availability Statement
The data that support this study will be shared upon reasonable request to the corresponding author.
Acknowledgments
The authors thank Julie Goldsbury, Mark O’Callaghan, Kynan Hartog-Burnett, Sam Kingsford, Nadia Bieri and Cecilia Villacorta Rath for assistance with field work and logistics, sharing protocols and for valuable information and advice. Thanks also to the Department of Agriculture and Fisheries, Queensland State Government, for use of their facilities in Weipa, Qld to undertake decay trials. The authors also thank the reviewers for commenting on drafts of this manuscript. Finally, the authors acknowledge the traditional owners (past, present and emerging) of the lands where this project was carried out.
Conflicts of Interest
The authors declare no conflict of interest.
References
- Castellani, C.; Edwards, M. Marine Plankton: A Practical Guide to Ecology, Methodology, and Taxonomy; Oxford University Press: Oxford, UK, 2017. [Google Scholar]
- Kingsford, M. Biotic and abiotic structure in the pelagic environment: Importance to small fishes. Bull. Mar. Sci. 1993, 53, 393–415. [Google Scholar]
- Kingsford, M.J.; Becken, S.; Bordehore, C.; Fuentes, V.L.; Pitt, K.A.; Yangihara, A.A. Empowering stakeholders to manage stinging jellyfish: A perspective. Coast. Manag. 2018, 46, 1–18. [Google Scholar] [CrossRef]
- Decker, M.B.; Cieciel, K.; Zavolokin, A.; Lauth, R.; Brodeur, R.D.; Coyle, K.O. Population Fluctuations of jellyfish in the Bering Sea and their ecological role in this productive shelf ecosystem. In Jellyfish Blooms; Springer: Cham, Switzerland, 2014; pp. 153–183. [Google Scholar]
- Lynam, C.P.; Gibbons, M.J.; Axelsen, B.E.; Sparks, C.A.; Coetzee, J.; Heywood, B.G.; Brierley, A.S. Jellyfish overtake fish in a heavily fished ecosystem. Curr. Biol. 2006, 16, R492–R493. [Google Scholar] [CrossRef] [PubMed] [Green Version]
- Graham, W.M.; Martin, D.L.; Felder, D.L.; Asper, V.L.; Perry, H.M. Ecological and economic implications of a tropical jellyfish invader in the Gulf of Mexico. In Marine Bioinvasions: Patterns, Processes and Perspectives; Springer: Cham, Switzerland, 2003; pp. 53–69. [Google Scholar]
- Brodeur, R.D.; Sugisaki, H.; Hunt, G.L., Jr. Increases in jellyfish biomass in the Bering Sea: Implications for the ecosystem. Mar. Ecol. Prog. Ser. 2002, 233, 89–103. [Google Scholar] [CrossRef] [Green Version]
- Uye, S.-I. The giant jellyfish Nemopilema nomurai in East Asian marginal seas. In Jellyfish Blooms; Springer: Cham, Switzerland, 2014; pp. 185–205. [Google Scholar]
- Bosch-Belmar, M.; Milisenda, G.; Basso, L.; Doyle, T.K.; Leone, A.; Piraino, S. Jellyfish impacts on marine aquaculture and fisheries. Rev. Fish. Sci. Aquac. 2020, 29, 242–259. [Google Scholar] [CrossRef]
- Collins, A.G.; Jarms, G. WoRMS Cubozoa: World list of Cubozoa (version 2018-04-01). In Species 2000 & ITIS Catalogue of Life, 2018 Annual Checklist; Roskov, Y., Abucay, L., Orrell, T., Nicolson, D., Bailly, N., Kirk, P.M., Bourgoin, T., DeWalt, R.E., Decock, W., De Wever, A., et al., Eds.; Naturalis: Leiden, The Netherlands, 2018; Available online: www.catalogueoflife.org/annual-checklist/2018 (accessed on 1 September 2022).
- Crowley-Cyr, L.; Gershwin, L.-A. Protecting the public from hazardous jellyfish: A wicked problem for regulators and operators? The cnidaria: Only a problem or also a resource? In Marine and Freshwater Biology; Nova Science Publishers, Inc.: Hauppauge, NY, USA, 2021; pp. 99–122. [Google Scholar]
- Gershwin, L.A.; Richardson, A.J.; Winkel, K.D.; Fenner, P.J.; Lippmann, J.; Hore, R.; Avila-Soria, G.; Brewer, D.; Kloser, R.J.; Steven, A.; et al. Biology and ecology of Irukandji jellyfish (Cnidaria: Cubozoa). In Advances in Marine Biology; Academic Press: Washington, DC, USA, 2013; Volume 66, pp. 1–85. [Google Scholar]
- Kingsford, M.J.; Mooney, C.J. The ecology of box jellyfishes (Cubozoa). In Jellyfish Blooms; Springer: Cham, Switzerland, 2014; pp. 267–302. [Google Scholar]
- Brown, T.W. Chironex Fleckeri: Distribution and Movements Around Magnetic Island, North Queensland; TW Brown: Brooks, GA, USA, 1973. [Google Scholar]
- Pitt, K.; Kingsford, M. Geographic separation of stocks of the edible jellyfish Catostylus mosaicus (Rhizostomeae) in New South Wales, Australia. Mar. Ecol. Prog. Ser. 2000, 196, 143–155. [Google Scholar] [CrossRef] [Green Version]
- Hartwick, R. Distributional ecology and behaviour of the early life stages of the box-jellyfish Chironex fleckeri. In Coelenterate Biology: Recent Research on Cnidaria and Ctenophora; Springer: Cham, Switzerland, 1991; pp. 181–188. [Google Scholar]
- Gordon, M.; Hatcher, C.; Seymour, J. Growth and age determination of the tropical Australian cubozoan Chiropsalmus sp. Hydrobiologia 2004, 530, 339–345. [Google Scholar]
- Bordehore, C.; Fuentes, V.L.; Atienza, D.; Barberá, C.; Fernandez-Jover, D.; Roig, M.; Acevedo-Dudley, M.J.; Canepa, A.J.; Gili, J.M. Detection of an unusual presence of the cubozoan Carybdea marsupialis at shallow beaches located near Denia, Spain (south-western Mediterranean). In Marine Biodiversity Records; Cambridge University Press: Cambridge, UK, 2011; Volume 4. [Google Scholar]
- Kingsford, M.; Seymour, J.; O’Callaghan, M. Abundance patterns of cubozoans on and near the Great Barrier Reef. In Jellyfish Blooms IV; Springer: Cham, Switzerland, 2012; pp. 257–268. [Google Scholar]
- Barnes, J. Studies on Three Venomous cubomedusae. The Cnidaria and Their Evolution: Symposium of the Zoological Society of London; Academic Press: London, UK, 1966. [Google Scholar]
- Llewellyn, L.; Bainbridge, S.; Page, G.; O’Callaghan, M.; Kingsford, M. StingerCam: A tool for ecologists and stakeholders to detect the presence of venomous tropical jellyfish. Limnol. Oceanogr. Methods 2016, 14, 649–657. [Google Scholar] [CrossRef]
- Zhang, Y.; Li, G.; Zhang, M.; Jiang, Y. (Eds.) A method of jellyfish detection based on high resolution multibeam acoustic image. In MATEC Web of Conferences; EDP Sciences: Les Ulis, France, 2019. [Google Scholar]
- Lee, K.-H.; Kim, I.-O.; Yoon, W.-D.; Shin, J.-K.; An, H.-C. A study on vertical distribution observation of giant jellyfish (Nemopilema nomurai) using acoustical and optical methods. J. Korean Soc. Fish. Ocean. Technol. 2007, 43, 355–361. [Google Scholar] [CrossRef] [Green Version]
- Rowley, O.C.; Courtney, R.L.; Browning, S.A.; Seymour, J.E. Bay watch: Using unmanned aerial vehicles (UAV’s) to survey the box jellyfish Chironex fleckeri. PLoS ONE 2020, 15, e0241410. [Google Scholar] [CrossRef]
- Schaub, J.; Hunt, B.P.; Pakhomov, E.A.; Holmes, K.; Lu, Y.; Quayle, L. Using unmanned aerial vehicles (UAVs) to measure jellyfish aggregations. Mar. Ecol. Prog. Ser. 2018, 591, 29–36. [Google Scholar] [CrossRef]
- Rowe, C.E.; Figueira, W.F.; Kelaher, B.P.; Giles, A.; Mamo, L.T.; Ahyong, S.T.; Keable, S.J. Evaluating the effectiveness of drones for quantifying invasive upside-down jellyfish (Cassiopea sp.) in Lake Macquarie, Australia. PLoS ONE 2022, 17, e0262721. [Google Scholar] [CrossRef] [PubMed]
- Beng, K.C.; Corlett, R.T. Applications of environmental DNA (eDNA) in ecology and conservation: Opportunities, challenges and prospects. Biodivers. Conserv. 2020, 29, 2089–2121. [Google Scholar] [CrossRef]
- Rees, H.C.; Maddison, B.C.; Middleditch, D.J.; Patmore, J.R.; Gough, K.C. The detection of aquatic animal species using environmental DNA–a review of eDNA as a survey tool in ecology. J. Appl. Ecol. 2014, 51, 1450–1459. [Google Scholar] [CrossRef]
- Wilcox, T.M.; McKelvey, K.S.; Young, M.K.; Jane, S.F.; Lowe, W.H.; Whiteley, A.R.; Schwartz, M.K. Robust detection of rare species using environmental DNA: The importance of primer specificity. PLoS ONE 2013, 8, e59520. [Google Scholar] [CrossRef] [PubMed] [Green Version]
- Jerde, C.L.; Mahon, A.R.; Chadderton, W.L.; Lodge, D.M. “Sight-unseen” detection of rare aquatic species using environmental DNA. Conserv. Lett. 2011, 4, 150–157. [Google Scholar] [CrossRef]
- Shaw, J.L.; Weyrich, L.; Cooper, A. Using environmental (e) DNA sequencing for aquatic biodiversity surveys: A beginner’s guide. Mar. Freshw. Res. 2017, 68, 20–33. [Google Scholar] [CrossRef]
- Clare, E.L.; Economou, C.K.; Faulkes, C.G.; Gilbert, J.D.; Bennett, F.; Drinkwater, R.; Littlefair, J.E. eDNAir: Proof of concept that animal DNA can be collected from air sampling. PeerJ 2021, 9, e11030. [Google Scholar] [CrossRef]
- Thomsen, P.F.; Kielgast, J.; Iversen, L.L.; Møller, P.R.; Rasmussen, M.; Willerslev, E. Detection of a diverse marine fish fauna using environmental DNA from seawater samples. PLoS ONE 2012, 7, e41732. [Google Scholar] [CrossRef]
- Evans, N.T.; Shirey, P.D.; Wieringa, J.G.; Mahon, A.R.; Lamberti, G.A. Comparative cost and effort of fish distribution detection via environmental DNA analysis and electrofishing. Fisheries 2017, 42, 90–99. [Google Scholar]
- Sigsgaard, E.E.; Carl, H.; Møller, P.R.; Thomsen, P.F. Monitoring the near-extinct European weather loach in Denmark based on environmental DNA from water samples. Biol. Conserv. 2015, 183, 46–52. [Google Scholar] [CrossRef] [Green Version]
- Barnes, M.A.; Turner, C.R. The ecology of environmental DNA and implications for conservation genetics. Conserv. Genet. 2016, 17, 1–17. [Google Scholar]
- Smart, A.S.; Weeks, A.R.; van Rooyen, A.R.; Moore, A.; McCarthy, M.A.; Tingley, R. Assessing the cost-efficiency of environmental DNA sampling. Methods Ecol. Evol. 2016, 7, 1291–1298. [Google Scholar] [CrossRef] [Green Version]
- Cooper, M.K.; Huerlimann, R.; Edmunds, R.C.; Budd, A.M.; Le Port, A.; Kyne, P.M.; Jerry, D.R.; Simpfendorfer, C.A. Improved detection sensitivity using an optimal eDNA preservation and extraction workflow and its application to threatened sawfishes. Aquat. Conserv. Mar. Freshwat. Ecosyst. 2021, 31, 2131–2148. [Google Scholar]
- Budd, A.M.; Cooper, M.K.; Le Port, A.; Schils, T.; Mills, M.S.; Deinhart, M.E.; Huerlimann, R.; Strugnell, J.M. First detection of critically endangered scalloped hammerhead sharks (Sphyrna lewini) in Guam, Micronesia, in five decades using environmental DNA. Ecol. Indic. 2021, 127, 107649. [Google Scholar] [CrossRef]
- Villacorta-Rath, C.; Espinoza, T.; Cockayne, B.; Schaffer, J.; Burrows, D. Environmental DNA analysis confirms extant populations of the cryptic Irwin’s turtle within its historical range. BMC Ecol. Evol. 2022, 22, 1–14. [Google Scholar] [CrossRef] [PubMed]
- Rose, A.; Fukuda, Y.; Campbell, H.A. Using environmental DNA to detect estuarine crocodiles, a cryptic-ambush predator of humans. Hum. Wildl. Interact. 2020, 14, 11. [Google Scholar]
- Gaynor, J.J.; Bologna, P.A.; Restaino, D.J.; Barry, C.L. qPCR detection of early life history stage Chrysaora quinquecirrha (sea nettles) in Barnegat Bay, New Jersey. J. Coast. Res. 2017, 78 (Suppl. 1), 184–192. [Google Scholar] [CrossRef]
- Minamoto, T.; Fukuda, M.; Katsuhara, K.R.; Fujiwara, A.; Hidaka, S.; Yamamoto, S.; Takahashi, K.; Masuda, R. Environmental DNA reflects spatial and temporal jellyfish distribution. PLoS ONE 2017, 12, e0173073. [Google Scholar] [CrossRef] [Green Version]
- Bolte, B.; Goldsbury, J.; Huerlimann, R.; Jerry, D.; Kingsford, M. Validation of eDNA as a viable method of detection for dangerous cubozoan jellyfish. Environ. DNA 2021, 3, 769–779. [Google Scholar] [CrossRef]
- Ames, C.L.; Ohdera, A.H.; Colston, S.M.; Collins, A.G.; Fitt, W.K.; Morandini, A.C.; Erickson, J.S.; Vora, G.J. Fieldable environmental DNA sequencing to assess jellyfish biodiversity in Nearshore Waters of the Florida Keys, United States. Front. Mar. Sci. 2021, 8, 369. [Google Scholar] [CrossRef]
- Mychek-Londer, J.G.; Balasingham, K.D.; Heath, D.D. Using environmental DNA metabarcoding to map invasive and native invertebrates in two Great Lakes tributaries. Environ. DNA 2020, 2, 283–297. [Google Scholar] [CrossRef] [Green Version]
- Kingsford, M.J.; Schlaefer, J.A.; Morrissey, S.J. Population structures and levels of connectivity for scyphozoan and cubozoan jellyfish. Diversity 2021, 13, 174. [Google Scholar] [CrossRef]
- Klymus, K.E.; Dannise, V.R.R.; Thompson, N.L.; Richter, C.A. Development and testing of species-specific quantitative PCR assays for environmental DNA applications. J. Vis. Exp. JOVE 2020, 165, e61825. [Google Scholar] [CrossRef]
- Coster, S.S.; Dillon, M.N.; Moore, W.; Merovich, G.T., Jr. The update and optimization of an eDNA assay to detect the invasive rusty crayfish (Faxonius rusticus). PLoS ONE 2021, 16, e0259084. [Google Scholar] [CrossRef]
- ThermoFisher. Design and Optimization of SYBR Green Assays; ThermoFisher: Waltham, MA, USA, 2018. [Google Scholar]
- Furlan, E.M.; Gleeson, D. Improving reliability in environmental DNA detection surveys through enhanced quality control. Mar. Freshw. Res. 2016, 68, 388–395. [Google Scholar] [CrossRef]
- Darling, J.A.; Mahon, A.R. From molecules to management: Adopting DNA-based methods for monitoring biological invasions in aquatic environments. Environ. Res. 2011, 111, 978–988. [Google Scholar] [CrossRef]
- Vuong, N.-M.; Villemur, R.; Payment, P.; Brousseau, R.; Topp, E.; Masson, L. Fecal source tracking in water using a mitochondrial DNA microarray. Water Res. 2013, 47, 16–30. [Google Scholar] [CrossRef]
- Harrison, J.B.; Sunday, J.M.; Rogers, S.M. Predicting the fate of eDNA in the environment and implications for studying biodiversity. Proc. R. Soc. B 2019, 286, 20191409. [Google Scholar] [CrossRef]
- Collins, R.A.; Wangensteen, O.S.; O’Gorman, E.J.; Mariani, S.; Sims, D.W.; Genner, M.J. Persistence of environmental DNA in marine systems. Commun. Biol. 2018, 1, 1–11. [Google Scholar] [CrossRef] [Green Version]
- Seymour, M.; Durance, I.; Cosby, B.J.; Ransom-Jones, E.; Deiner, K.; Ormerod, S.J.; Colbourne, J.; Wilgar, G.; Carvalho, G.R.; de Bruyn, M.; et al. Acidity promotes degradation of multi-species environmental DNA in lotic mesocosms. Commun. Biol. 2018, 1, 1–8. [Google Scholar] [CrossRef] [PubMed] [Green Version]
- Ely, T.; Barber, P.H.; Man, L.; Gold, Z. Short-lived detection of an introduced vertebrate eDNA signal in a nearshore rocky reef environment. PLoS ONE 2021, 16, e0245314. [Google Scholar] [CrossRef] [PubMed]
- Strickler, K.M.; Fremier, A.K.; Goldberg, C.S. Quantifying effects of UV-B, temperature, and pH on eDNA degradation in aquatic microcosms. Biol. Conserv. 2015, 183, 85–92. [Google Scholar] [CrossRef]
- Andruszkiewicz Allan, E.; Zhang, W.G.; CLavery, A.; FGovindarajan, A. Environmental DNA shedding and decay rates from diverse animal forms and thermal regimes. Environ. DNA 2021, 3, 492–514. [Google Scholar] [CrossRef]
- Barnes, M.A.; Turner, C.R.; Jerde, C.L.; Renshaw, M.A.; Chadderton, W.L.; Lodge, D.M. Environmental conditions influence eDNA persistence in aquatic systems. Environ. Sci. Technol. 2014, 48, 1819–1827. [Google Scholar] [CrossRef]
- Lamb, P.D.; Fonseca, V.G.; Maxwell, D.L.; Nnanatu, C.C. Systematic review and meta-analysis: Water type and temperature affect environmental DNA decay. Mol. Ecol. Resour. 2022, 22, 2494–2505. [Google Scholar] [CrossRef] [PubMed]
- Coordinators, N.R. Database resources of the National Center for Biotechnology Information. Nucleic Acids Res. 2015, 44, D7–D19. [Google Scholar]
- Deagle, B.E.; Jarman, S.N.; Coissac, E.; Pompanon, F.; Taberlet, P. DNA metabarcoding and the cytochrome c oxidase subunit I marker: Not a perfect match. Biol. Lett. 2014, 10, 20140562. [Google Scholar] [CrossRef] [Green Version]
- Trifinopoulos, J.; Nguyen, L.-T.; von Haeseler, A.; Minh, B.Q. W-IQ-TREE: A fast online phylogenetic tool for maximum likelihood analysis. Nucleic Acids Res. 2016, 44, W232–W235. [Google Scholar] [CrossRef] [Green Version]
- Hoang, D.T.; Vinh, L.S.; Flouri, T.; Stamatakis, A.; von Haeseler, A.; Minh, B.Q. MPBoot: Fast phylogenetic maximum parsimony tree inference and bootstrap approximation. BMC Evol. Biol. 2018, 18, 1–11. [Google Scholar] [CrossRef] [Green Version]
- Bentlage, B.; Cartwright, P.; Yanagihara, A.A.; Lewis, C.; Richards, G.S.; Collins, A.G. Evolution of box jellyfish (Cnidaria: Cubozoa), a group of highly toxic invertebrates. Proc. R. Soc. B Biol. Sci. 2010, 277, 493–501. [Google Scholar] [CrossRef] [PubMed] [Green Version]
- Mooney, C.; Kingsford, M. Sources and movements of Chironex fleckeri medusae using statolith elemental chemistry. In Jellyfish Blooms IV; Springer: Cham, Switzerland, 2012; pp. 269–277. [Google Scholar]
- Acevedo, M.J.; Straehler-Pohl, I.; Morandini, A.C.; Stampar, S.N.; Bentlage, B.; Matsumoto, G.I.; Yanagihara, A.; Toshino, S.; Bordehore, C.; Fuentes, V.L. Revision of the genus Carybdea (Cnidaria: Cubozoa: Carybdeidae): Clarifying the identity of its type species Carybdea marsupialis. Zootaxa 2019, 4543, 515–548. [Google Scholar] [CrossRef] [PubMed]
- Collins, A.G.; Bentlage, B.; Gillan, W.; Lynn, T.H.; Morandini, A.C.; Marques, A.C. Naming the Bonaire banded box jelly, Tamoya ohboya, n. sp. (Cnidaria: Cubozoa: Carybdeida: Tamoyidae). Zootaxa 2011, 2753, 53–68. [Google Scholar] [CrossRef] [Green Version]
- Prediger, E. How to Design Primers and Probes for PCR and qPCR. Integrated DNA Technologies. 2013. Available online: https://www.idtdna.com/pages/education/decoded/article/designing-pcr-primers-and-probes (accessed on 1 June 2020).
- Owczarzy, R.; Tataurov, A.V.; Wu, Y.; Manthey, J.A.; McQuisten, K.A.; Almabrazi, H.G.; Pedersen, K.F.; Lin, Y.; Garretson, J.; McEntaggart, N.O.; et al. IDT SciTools: A suite for analysis and design of nucleic acid oligomers. Nucleic Acids Res. 2008, 36 (Suppl. 2), W163–W169. [Google Scholar] [CrossRef] [PubMed]
- Stothard, P. The sequence manipulation suite: JavaScript programs for analyzing and formatting protein and DNA sequences. BioTechniques 2000, 28, 1102–1104. [Google Scholar] [CrossRef] [PubMed] [Green Version]
- Ye, J.; Coulouris, G.; Zaretskaya, I.; Cutcutache, I.; Rozen, S.; Madden, T.L. Primer-BLAST: A tool to design target-specific primers for polymerase chain reaction. BMC Bioinform. 2012, 13, 1–11. [Google Scholar] [CrossRef] [PubMed] [Green Version]
- Altschul, S.F.; Gish, W.; Miller, W.; Myers, E.W.; Lipman, D.J. Basic local alignment search tool. J. Mol. Biol. 1990, 215, 403–410. [Google Scholar] [CrossRef]
- Klymus, K.E.; Merkes, C.M.; Allison, M.J.; Goldberg, C.S.; Helbing, C.C.; Hunter, M.E.; Jackson, C.A.; Lance, R.F.; Mangan, A.M.; Monroe, E.M.; et al. Reporting the limits of detection and quantification for environmental DNA assays. Environ. DNA 2020, 2, 271–282. [Google Scholar] [CrossRef] [Green Version]
- Roussel, J.M.; Paillisson, J.M.; Treguier, A.; Petit, E. The downside of eDNA as a survey tool in water bodies. J. Appl. Ecol. 2015, 52, 823–826. [Google Scholar] [CrossRef]
- Xiong, W.; Li, H.; Zhan, A. Early detection of invasive species in marine ecosystems using high-throughput sequencing: Technical challenges and possible solutions. Mar. Biol. 2016, 163, 139. [Google Scholar] [CrossRef]
- Edmunds, R.C.; Burrows, D. Got glycogen?: Development and multispecies validation of the novel preserve, precipitate, lyse, precipitate, purify (PPLPP) workflow for environmental DNA extraction from Longmire’s preserved water samples. J. Biomol. Tech. JBT 2020, 31, 125. [Google Scholar] [CrossRef] [PubMed]
- Cooper, M.K.; Villacorta-Rath, C.; Burrows, D.; Jerry, D.R.; Carr, L.; Barnett, A.; Huveneers, C.; Simpfendorfer, C.A. Practical eDNA sampling methods inferred from particle size distribution and comparison of capture techniques for a Critically Endangered elasmobranch. Environ. DNA 2022, 4, 1011–1023. [Google Scholar] [CrossRef]
- Langlois, V.S.; Allison, M.J.; Bergman, L.C.; To, T.A.; Helbing, C.C. The need for robust qPCR-based eDNA detection assays in environmental monitoring and species inventories. Environ. DNA 2021, 3, 519–527. [Google Scholar] [CrossRef]
- Sassoubre, L.M.; Yamahara, K.M.; Gardner, L.D.; Block, B.A.; Boehm, A.B. Quantification of environmental DNA (eDNA) shedding and decay rates for three marine fish. Environ. Sci. Technol. 2016, 50, 10456–10464. [Google Scholar] [CrossRef] [PubMed]
- Kwong, S.L.; Villacorta-Rath, C.; Doyle, J.; Uthicke, S. Quantifying shedding and degradation rates of environmental DNA (eDNA) from Pacific crown-of-thorns seastar (Acanthaster cf. solaris). Mar. Biol. 2021, 168, 1–10. [Google Scholar] [CrossRef]
- Wood, S.A.; Biessy, L.; Latchford, J.L.; Zaiko, A.; von Ammon, U.; Audrezet, F.; Cristescu, M.E.; Pochon, X. Release and degradation of environmental DNA and RNA in a marine system. Sci. Total Environ. 2020, 704, 135314. [Google Scholar] [CrossRef] [PubMed]
- Schlaefer, J.A.; Wolanski, E.; Kingsford, M.J. Swimming behaviour can maintain localised jellyfish (Chironex fleckeri: Cubozoa) populations. Mar. Ecol. Prog. Ser. 2018, 591, 287–302. [Google Scholar] [CrossRef]
- Shogren, A.J.; Tank, J.L.; Andruszkiewicz, E.A.; Olds, B.; Jerde, C.; Bolster, D. Modelling the transport of environmental DNA through a porous substrate using continuous flow-through column experiments. J. R. Soc. Interface 2016, 13, 20160290. [Google Scholar] [CrossRef] [Green Version]
- Cai, P.; Huang, Q.; Zhang, X.; Chen, H. Adsorption of DNA on clay minerals and various colloidal particles from an Alfisol. Soil. Biol. Biochem. 2006, 38, 471–476. [Google Scholar] [CrossRef]
- Jo, T.; Murakami, H.; Yamamoto, S.; Masuda, R.; Minamoto, T. Effect of water temperature and fish biomass on environmental DNA shedding, degradation, and size distribution. Ecol. Evol. 2019, 9, 1135–1146. [Google Scholar] [CrossRef] [Green Version]
- Tsuji, S.; Ushio, M.; Sakurai, S.; Minamoto, T.; Yamanaka, H. Water temperature-dependent degradation of environmental DNA and its relation to bacterial abundance. PLoS ONE 2017, 12, e0176608. [Google Scholar] [CrossRef] [PubMed]
- Australian Institute of Marine Science (AIMS). AIMS Sea Water Temperature Observing System (AIMS Temperature Logger Program). 2017. Available online: https://apps.aims.gov.au/metadata/view/4a12a8c0-c573-11dc-b99b-00008a07204e (accessed on 1 June 2020).
- Eichmiller, J.J.; Best, S.E.; Sorensen, P.W. Effects of temperature and trophic state on degradation of environmental DNA in lake water. Environ. Sci. Technol. 2016, 50, 1859–1867. [Google Scholar] [CrossRef] [PubMed]
- Deiner, K.; Bik, H.M.; Mächler, E.; Seymour, M.; Lacoursière-Roussel, A.; Altermatt, F.; Creer, S.; Bista, I.; Lodge, D.M.; De Vere, N.; et al. Environmental DNA metabarcoding: Transforming how we survey animal and plant communities. Mol. Ecol. 2017, 26, 5872–5895. [Google Scholar] [CrossRef] [PubMed]
- Ellis, M.R.; Clark, Z.; Treml, E.A.; Brown, M.S.; Matthews, T.G.; Pocklington, J.B.; Stafford-Bell, R.E.; Bott, N.J.; Nai, Y.H.; Miller, A.D.; et al. Detecting marine pests using environmental DNA and biophysical models. Sci. Total Environ. 2022, 816, 151666. [Google Scholar] [CrossRef]
- Mooney, C.J.; Kingsford, M.J. Discriminating populations of medusae (Chironex fleckeri, Cubozoa) using statolith microchemistry. Mar. Freshw. Res. 2017, 68, 1144–1152. [Google Scholar] [CrossRef]
- Mooney, C.J.; Kingsford, M.J. Statolith morphometrics can discriminate among taxa of cubozoan jellyfishes. PLoS ONE 2016, 11, e0155719. [Google Scholar] [CrossRef] [PubMed] [Green Version]
- Port, J.A.; O’Donnell, J.L.; Romero-Maraccini, O.C.; Leary, P.R.; Litvin, S.Y.; Nickols, K.J.; Yamahara, K.M.; Kelly, R.P. Assessing vertebrate biodiversity in a kelp forest ecosystem using environmental DNA. Mol. Ecol. 2016, 25, 527–541. [Google Scholar] [CrossRef]
- Kelly, R.P.; Gallego, R.; Jacobs-Palmer, E. The effect of tides on nearshore environmental DNA. PeerJ 2018, 6, e4521. [Google Scholar] [CrossRef] [Green Version]
- Takahara, T.; Minamoto, T.; Yamanaka, H.; Doi, H.; Kawabata, Z. Estimation of fish biomass using environmental DNA. PLoS ONE 2012, 7, e35868. [Google Scholar] [CrossRef] [Green Version]
- Thomsen, P.F.; Kielgast, J.; Iversen, L.L.; Wiuf, C.; Rasmussen, M.; Gilbert, M.T.P.; Orlando, L.; Willerslev, E. Monitoring endangered freshwater biodiversity using environmental DNA. Mol. Ecol. 2012, 21, 2565–2573. [Google Scholar] [CrossRef]
- Pilliod, D.S.; Goldberg, C.S.; Arkle, R.S.; Waits, L.P. Estimating occupancy and abundance of stream amphibians using environmental DNA from filtered water samples. Can. J. Fish. Aquat. Sci. 2013, 70, 1123–1130. [Google Scholar] [CrossRef]
- Lacoursière-Roussel, A.; Côté, G.; Leclerc, V.; Bernatchez, L. Quantifying relative fish abundance with eDNA: A promising tool for fisheries management. J. Appl. Ecol. 2016, 53, 1148–1157. [Google Scholar] [CrossRef] [Green Version]
- Wilcox, T.M.; McKelvey, K.S.; Young, M.K.; Sepulveda, A.J.; Shepard, B.B.; Jane, S.F.; Whiteley, A.R.; Lowe, W.H.; Schwartz, M.K. Understanding environmental DNA detection probabilities: A case study using a stream-dwelling char Salvelinus fontinalis. Biol. Conserv. 2016, 194, 209–216. [Google Scholar] [CrossRef] [Green Version]
- Yamamoto, S.; Minami, K.; Fukaya, K.; Takahashi, K.; Sawada, H.; Murakami, H.; Tsuji, S.; Hashizume, H.; Kubonaga, S.; Horiuchi, T.; et al. Environmental DNA as a ‘snapshot’of fish distribution: A case study of Japanese jack mackerel in Maizuru Bay, Sea of Japan. PLoS ONE 2016, 11, e0149786. [Google Scholar]
- Richardson, A.J.; Bakun, A.; Hays, G.C.; Gibbons, M.J. The jellyfish joyride: Causes, consequences and management responses to a more gelatinous future. Trends Ecol. Evol. 2009, 24, 312–322. [Google Scholar] [CrossRef]
- Madin, E.M.; Ban, N.C.; Doubleday, Z.A.; Holmes, T.H.; Pecl, G.T.; Smith, F. Socio-economic and management implications of range-shifting species in marine systems. Glob. Environ. Change 2012, 22, 137–146. [Google Scholar] [CrossRef]
- Orellana, E.R.; Collins, A.G. First report of the box jellyfish Tripedalia cystophora (Cubozoa: Tripedaliidae) in the continental USA, from Lake Wyman, Boca Raton, Florida. Mar. Biodivers. Rec. 2011, 4, e54. [Google Scholar] [CrossRef] [Green Version]
- Sathirapongsasuti, N.; Khonchom, K.; Poonsawat, T.; Pransilpa, M.; Ongsara, S.; Detsri, U.; Bungbai, S.; Lawanangkoon, S.-A.; Pattanaporkrattana, P.W.; Trakulsrichai, S. Rapid and accurate species-specific PCR for the identification of lethal chironex box jellyfish in Thailand. Int. J. Environ. Res. Public Health 2021, 18, 219. [Google Scholar] [CrossRef]
Figure 1.
Map displaying the range of C. fleckeri in northern Australia (light grey) and collection locations of reference specimens (Darwin—n = 1, Weipa—n = 3, Townsville—n = 2 and Mackay—n = 2).
Figure 1.
Map displaying the range of C. fleckeri in northern Australia (light grey) and collection locations of reference specimens (Darwin—n = 1, Weipa—n = 3, Townsville—n = 2 and Mackay—n = 2).

Figure 2.
Map displaying in situ sampling sites (black dots—numbered to identify sample site) located at Weipa, Queensland (a) and Horseshoe Bay, Magnetic Island (b) for in situ validation.
Figure 2.
Map displaying in situ sampling sites (black dots—numbered to identify sample site) located at Weipa, Queensland (a) and Horseshoe Bay, Magnetic Island (b) for in situ validation.

Figure 3.
Alignment highlighting base pair similarities (grey) and differences (black) between the Chironex fleckeri eDNA identifiers and sympatric jellyfish species. The anti-sense primer is illustrated as the reverse complement of the sequence. (Chironex fleckeri; OP877024, Copula sivickisi; OP877032, Carukia barnesi; OP877033, Alatina alata; OP877035, Carybdea xaymacana; OP877034, Tamoya ohboya; HQ824528). Base pair start and end position of each identifier on the consensus sequences is indicated below each alignment.

Figure 4.
Chironex fleckeri assay sensitivity. (a) Standard curve plot from a six point ten-fold serial dilution of synthetic DNA, from theoretical 1000 to 0.01 copies μL−1. Grey pluses (+) are replicates which fall outside the middle two quartiles for standards or are standards with less than 50% detection, both of which were excluded from linear regression calculations. (b) Effective Limit of Detection (LoD) for each quantity of technical replicates as determined via a Weibull type II two parameter function which has an upper limit of one. Effective LoDs are plotted with 95% confidence intervals (n = 8) and open circles represent the detection rates of each standard.

Figure 5.
Decay of Chironex fleckeri eDNA under two temperature treatments (26 °C and 28 °C), displaying log average quantity (copies μL−1) over a 140 h period, and percentage (%) of total eDNA remaining.
Figure 5.
Decay of Chironex fleckeri eDNA under two temperature treatments (26 °C and 28 °C), displaying log average quantity (copies μL−1) over a 140 h period, and percentage (%) of total eDNA remaining.


Table 1.
Cubozoan sequence database utilised for assay design, with NCBI accession numbers and country of origin, for both existing (E) and new (N) 16S sequences (ROEL—Reef and Ocean Ecology Laboratory, SLSQ—Surf Life Saving Queensland).
Table 1.
Cubozoan sequence database utilised for assay design, with NCBI accession numbers and country of origin, for both existing (E) and new (N) 16S sequences (ROEL—Reef and Ocean Ecology Laboratory, SLSQ—Surf Life Saving Queensland).
| Species | Accession No. | Country of Origin | Source |
|---|---|---|---|
| Chironex fleckeri | GQ849101 (E) | Darwin, Australia | [66] |
| GQ849102 (E) | Weipa, Australia | [66] | |
| GQ849103 (E) | Weipa, Australia | [66] | |
| OP877024 (N) | Townsville, Australia | SLSQ | |
| OP877025 (N) | Townsville, Australia | SLSQ | |
| OP877026 (N) | Weipa, Australia | [67] | |
| OP877027 (N) | Weipa, Australia | [67] | |
| OP877028 (N) | Weipa, Australia | SLSQ | |
| OP877029 (N) | Mackay, Australia | [67] | |
| OP877030 (N) | Mackay, Australia | [67] | |
| OP877031 (N) | Darwin, Australia | [67] | |
| Carukia barnesi | GQ849097 (E) | Cairns, Australia | [66] |
| GQ849098 (E) | Cairns, Australia | [66] | |
| OP877033 (N) | Palm Cove, Australia | Sample provided by Jamie Seymour to ROEL | |
| Alatina alata | GQ506980 (E) | Osprey Reef, Australia | [66] |
| OP877035 (N) | Waikiki, Hawaii | Sample provided by Lisa Gershwin to ROEL | |
| Carybdea xaymacana | KT288254 (E) | Puerto Rico, Caribbean | [68] |
| GQ849114 (E) | Panama, Caribbean | [66] | |
| GQ849115 (E) | Panama, Caribbean | [66] | |
| GQ849118 (E) | Panama, Caribbean | [66] | |
| OP877034 (N) | Townsville, Australia | ROEL | |
| Copula sivickisi | GQ849113 (E) | Cairns, Australia | [66] |
| OP877032 (N) | Townsville, Australia | ROEL | |
| Tamoya ohboya | HQ824528 (E) | Bonaire, Caribbean Netherlands | [69] |
Table 2.
Species-specific and endogenous control assays used to detect Chironex fleckeri and as technical controls.
Table 2.
Species-specific and endogenous control assays used to detect Chironex fleckeri and as technical controls.
| Assay | Label | Sequence (5′-3′) | Target Sequence Length (bp) |
|---|---|---|---|
| Species-specific Assay—C. fleckeri | Chironex_16S_F | ATCTTCCACTGTCTCAGCTTTACC | 147 |
| Chironex_16S_R | CCTCAGTACTCGTGTCTCCCTA | ||
| Chironex_16S_P | (FAM)-CTCGTCCTTCCAAGTATAAG-(MGB) | ||
| Endogenous Control Assay—Generic Fish | Fish_16S_F | GACCTCGATGTTGGATCA | 87–88 |
| Fish_16S_R | CTCAGATCACGTAGGACTTTA | ||
| Fish_16S_probe | (VIC)-ACATCCTAWTGGTGC-(MGB) |
Table 3.
Amplification results for in situ validation samples from Weipa, Queensland and Horseshoe and Maud Bay, Magnetic Island. Results for duplicate replicates combined.
Table 3.
Amplification results for in situ validation samples from Weipa, Queensland and Horseshoe and Maud Bay, Magnetic Island. Results for duplicate replicates combined.
| Location | Site | C. fleckeri Assay | Endogenous Control Assay |
|---|---|---|---|
| Weipa | 1 | 7/12 | 12/12 |
| Weipa | 2 | 6/12 | 12/12 |
| Horseshoe Bay | 1 | 2/12 | 12/12 |
| Horseshoe Bay | 2 | 1/12 | 12/12 |
| Horseshoe Bay | 3 | 5/12 | 12/12 |
| Horseshoe Bay | 4 | 3/12 | 12/12 |
| Maud Bay | 5 | 0/12 | 12/12 |
| Maud Bay | 6 | 0/12 | 12/12 |
Table 4.
Reported Decay Rates of Other Jellyfish and Marine Organisms.
| Species | Decay Constant | Time to Decay | Experimental Temperature | Source |
|---|---|---|---|---|
| Chironex fleckeri | 0.060 h−1 | 27 h (99% decay) | 26–28 °C | Present study |
| Chrysaora pacifica | 0.033 h−1 | 4 days (90% decay) | 17.1–20 °C | [43] |
| Copula sivickisi | 0.034 h−1 | 9 days (99% decay) | 20 °C | [44] |
| Engraulis mordax | 0.101 h−1 | 3–4 days (detection limit) | 22 °C | [81] |
| Sardinops sagax | 0.068 h−1 | 3–4 days (detection limit) | 18.7 °C | [81] |
| Scomber japonicas | 0.070 h−1 | 3–4 days (detection limit) | 18.7 °C | [81] |
| Acanthaster spp. | 0.048 h−1 | 96 h (99% decay) | 24–28 °C | [82] |
| Styela clava | 0.104 h−1 | 94 h (detection limit) | 19 °C | [83] |
| Sabella spallanzanii | 0.248 h−1 | 42 h (detection limit) | 19 °C | [83] |
Publisher’s Note: MDPI stays neutral with regard to jurisdictional claims in published maps and institutional affiliations. |
© 2022 by the authors. Licensee MDPI, Basel, Switzerland. This article is an open access article distributed under the terms and conditions of the Creative Commons Attribution (CC BY) license (https://creativecommons.org/licenses/by/4.0/).
Share and Cite
MDPI and ACS Style
Morrissey, S.J.; Jerry, D.R.; Kingsford, M.J. Genetic Detection and a Method to Study the Ecology of Deadly Cubozoan Jellyfish. Diversity 2022, 14, 1139. https://0-doi-org.brum.beds.ac.uk/10.3390/d14121139
AMA Style
Morrissey SJ, Jerry DR, Kingsford MJ. Genetic Detection and a Method to Study the Ecology of Deadly Cubozoan Jellyfish. Diversity. 2022; 14(12):1139. https://0-doi-org.brum.beds.ac.uk/10.3390/d14121139
Chicago/Turabian StyleMorrissey, Scott J., Dean R. Jerry, and Michael J. Kingsford. 2022. "Genetic Detection and a Method to Study the Ecology of Deadly Cubozoan Jellyfish" Diversity 14, no. 12: 1139. https://0-doi-org.brum.beds.ac.uk/10.3390/d14121139
Note that from the first issue of 2016, this journal uses article numbers instead of page numbers. See further details here.