Article

Structural Organization of Zooplankton Communities in Different Types of River Mouth Areas

1
Laboratory of Water Ecosystems, Department of Ecology, Institute of Biology and Biomedicine, Lobachevsky State University, 603022 Nizhny Novgorod, Russia
2
Department of Hydrology, Faculty of Geography, Lomonosov Moscow State University, 119991 Moscow, Russia
3
Faculty of Biotechnology and Fisheries, Moscow State University of Technologies and Management (FCU), 109004 Moscow, Russia
*
Author to whom correspondence should be addressed.
Submission received: 30 November 2022 / Revised: 28 January 2023 / Accepted: 29 January 2023 / Published: 1 February 2023
(This article belongs to the Special Issue Advances in the Diversity and Ecology of Zooplankton)

Abstract

:
The gradients of hydrological, hydrophysical, and hydrochemical conditions form the transition zones in river mouth areas. These areas are considered ecotones in the presence of the edge effect. Our research aimed to identify the main patterns in the structural organization of zooplankton communities in different types of river mouth areas in lowland reservoir tributaries within the Middle Volga basin. A cluster analysis was performed to structure and determine the zooplankton communities. The identified zooplankton communities were characterized by the noticeable heterogeneity in the species structure. We analyzed the spatial distribution of the structural indicators of zooplankton communities and, on the basis of RDA, determined the factors that significantly affect the organization of the ecotone community. An ecotone was found in all types of river mouth areas where the highest density, biomass, diversity, species, and functional richness of zooplankton were noted, as compared to bordering zooplankton communities. As the morphological structure of the mouth areas became more complex, the values of the main structural parameters of zooplankton communities increased. It was demonstrated that conditions in the ecotones are favorable to the development of zooplankton alien species. The major factors determining the species structure of the ecotone zooplankton community were water electrical conductivity (R2 = 21.07%, p-value = 0.001), dissolved oxygen content (R2 = 10.33%, p-value = 0.003), and water transparency (R2 = 9.77 %, p-value = 0.001).

1. Introduction

River systems are complex natural systems in terms of the functioning and spatial distribution of the aquatic organisms associated with them. The most notable river area is the mouth. The mouth areas of both sea tributaries [1] and plain reservoirs are dynamic systems; however, their transition zones are often considered a stable component of this system [2]. Transition zones are often characterized by the edge effect. In such cases, they correspond to ecotones. Ecotones are transitional zones between distinct boundary areas, which, being homogeneous themselves, can be characterized by the high structural and spatial diversity of different hydrobionts [3]. This concept was very popular at the end of the 20th century [4,5,6]. At the beginning of the 21st century, interest in the ecotones of freshwater ecosystems was reflected in a number of works by Russian researchers [7,8,9,10]. The river ecotones represent regions of significant plankton species diversity and numerical variability [11,12,13,14] due to the variance in environmental gradients (mineralization, nutrient content, temperature, etc.), which leads to a high level of ecological heterogeneity in the river landscape [15]. However, the question of the presence of an ecotone in various types of aquatic ecosystems remains relevant.
In order to obtain adequate knowledge about the structural organization of the biotic communities of mouth areas, detailed studies of the main connecting links in aquatic ecosystems are needed. Zooplankton, as an integral part of the food web in water bodies, plays an important role in the structure and functioning of aquatic ecosystems [16,17]. This group of planktonic organisms is responsible for the self-purification of different water ecosystems and serves as a nutrition base for many fish species [18,19,20,21]. At the same time, zooplankton communities can undergo significant restructuring in river–reservoir systems due to the rapid transformation from a lotic environment into a limnetic one [22]. Therefore, the ecotone zone functions as a barrier system [23], as well as a source for the replenishment of zooplankton fauna in lowland reservoirs [22,24].
In recent decades, alien species (introduced outside their natural past or present distribution) have become integral components of zooplankton communities in many water bodies around the world, including water bodies of the Volga River basin. The dispersal of species under changing climatic conditions and as a result of human activity, is an increasingly visible phenomenon, reflected in a large number of scientific studies [25,26,27,28,29,30,31,32,33]. More frequent finds of alien species in rivers and mouth areas attract additional attention to this problem. An analysis of alien species’ distribution may be part of the larger patterns of structural organization of plankton communities in the mouth areas of lowland reservoir tributaries.
Most studies are devoted to marine estuary ecosystems, while few studies are focused on freshwater mouth areas. The aim of this research is to characterize the structural organization of zooplankton communities in different types of tributary mouth areas in the Gorky, Cheboksary, and Kuybyshev reservoirs (Volga River basin). We assume that: (1) during a period of hydrological stability, in all types of tributary mouth areas in lowland reservoirs, the presence of an ecotone will be noted, regardless of the river’s morphometric parameters (length and basin area); (2) quantitative development, richness, and diversity of zooplankton in ecotones increase in mouth areas with more complex morphology; (3) ecotones can provide optimal conditions for alien zooplankton species.

2. Materials and Methods

2.1. Study Area and Sample Collection

We investigated zooplankton communities in the mouth areas of eight tributaries of lowland reservoirs within the Middle Volga basin. The studied mouth areas belong to different morphometric types: simple, estuary, and estuary–deltaic (Table 1 and Figure 1). The Mera (57°29′44″ N, 42°16′52″ E), Shirmaksha (56°57′17″ N, 43°20′5″ E), and Troca (56°42′29″ N, 43°10′45″ E) are tributaries of the Gorky Reservoir; the Uzola (56°31′22″ N, 43°36′52″ E), Sura (56°5′58″ N, 46°2′27″ E), and Vetluga (56°23′10″ N, 46°19′14″ E) are tributaries of the Cheboksary Reservoir; the Bol’shoj Civil’ (56°6′23″ N, 47°34′48″ E) and Sviyaga (55°43′52″ N, 48°38′2″ E) are tributaries of the Kuybyshev Reservoir.
Zooplankton sampling was carried out during the summer low-water period of 2021. We investigated the mouth areas of tributary rivers during a period of hydrological stability, in the absence of released or increased water flow through the hydroelectric power station. Twelve sampling sites were established in each mouth area (except the Bol’shoj Civil’ River mouth area, with 9 sampling sites), located with the same distance between them. A total of 93 zooplankton samples were collected. Depending on the scale of the mouth area, the stations were located every 500 m (Uzola River, Bol’shoj Civil’ River, Shirmaksha River), 1000 m (Troca River, Mera River, Sviyaga River), or 2000 m (Sura River, Vetluga River). The first station was always located at the front of the river mouth section (fMSR); the last two stations were located in the mouth area of the reservoir (MAR) (Figure 1).
Zooplankton samples were collected by towing a plankton net (70 µm mesh) from the bottom to the water surface. At each station, 150 L of water was filtered. The samples were concentrated to 100 mL and were fixed to a final concentration of 4% formalin solution. All collected samples were stored in the collection of the Laboratory of Water Ecosystems, Department of Ecology, Institute of Biology and Biomedicine, Lobachevsky State University (Nizhny Novgorod, Russia).

2.2. Species Identification

Samples were analyzed using light microscopy to identify, count, and measure organisms, determine zooplankton density, and calculate dry-weight biomass. Zooplankton specimens were examined using a Zeiss Stemi 2000C stereomicroscope (Carl Zeiss Microscopy, Munich, Germany), and a detailed morphological analysis was performed using an Olympus CX43 light microscope (Olympus Corporation, Tokyo, Japan). When specifying the taxonomic affiliation of zooplankton, we used proper manuals and guides [35,36,37,38].

2.3. Environmental Indicators

Environmental parameters were measured at all the zooplankton sampling sites. The concentration of chlorophyll-a (Chl_a) was measured using a YSI ProDSS hydrochemical probe (YSI Inc., Yellow Springs, OH, USA); the amount of dissolved oxygen (DO) was measured by a YSI ProODO hydrochemical probe (YSI Inc., USA); the pH, temperature (WT), and electrical conductivity (EC) of water were measured using a YSI Pro1030 hydrochemical probe (YSI Inc., USA). Water transparency (SD) was determined using a Secchi disk. The total phosphorus (TP) content in water was determined by photometric methods. The total phosphorus content in the samples was determined by the Morphy–Riley method, while the mineralization of all forms of phosphorus to phosphates was carried out under the influence of ammonium persulfate when the sample was heated [39].
The trophic state index (TSI) was calculated based on chlorophyll (Chl_a) and total phosphorus (TP), using the relationships described in [40]:
T S I C h l _ a = 9.81 × ln ( C h l _ a ) + 30.6
T S I T P = 14.42 × ln ( T P ) + 4.15
In accordance with Carlson, waters with TSI < 40 were considered oligotrophic, those with 40–50 were considered mesotrophic, those with 50–70 were eutrophic, and those with TSI > 70 were hypertrophic.

2.4. Data Analysis

We analyzed the structural indicators: zooplankton density (ind./m3) and biomass (g/m3), which were calculated using plankton network parameters, individual weights, and number of organisms detected in the sample. Species richness, represented as the number of species, diversity, and evenness, was analyzed using the Shannon Diversity (H′) and the Pielou Evenness indices (J′) [41]:
H = i = 1 R p i × l n × p i
J = H l n ( S )
where pi is the proportion of individuals of i-th species in a whole community; S is the total number of species.
To calculate functional richness, a database of the functional traits of freshwater zooplankton in the Middle Volga basin was used [42]. Functional richness quantifies the size of the community functional niches and reflects the degree of spatial resource utilization by communities, characterized by the Functional Richness Index (FRic):
F R i c = S F i c R c
where SFic represents the ecological niche space occupied by the community, while Rc represents the ecological niche space occupied by trait C in the community.
For cluster analysis, the matrix of distances between samples, formed on the basis of the cosine of the angle between species vectors, served as the initial data. The averages connection method was used to calculate the distances between groups of samples. The silhouette width analysis and binary cluster membership matrices, based on the Mantel correlation coefficients, were used to choose the optimal number of clusters [43,44,45]. Shapiro–Wilk and Lilliefors goodness-of-fit tests were used to determine deviations from the normal distribution. To determine significant differences in the structural indicators in different zooplankton communities, as well as in different types of mouth areas, analysis of variance (ANOVA) was applied [41]. Redundancy analysis (RDA) was used to test correlations between environmental indicators and species structure of zooplankton communities in the different mouth-area types. The significance of the RDA models was verified using a permutation test (1000 permutations). All analyses were performed using R open-source software (packages “ggplot2”, “cluster”, “vegan”, “FD”) [44,46].

3. Results

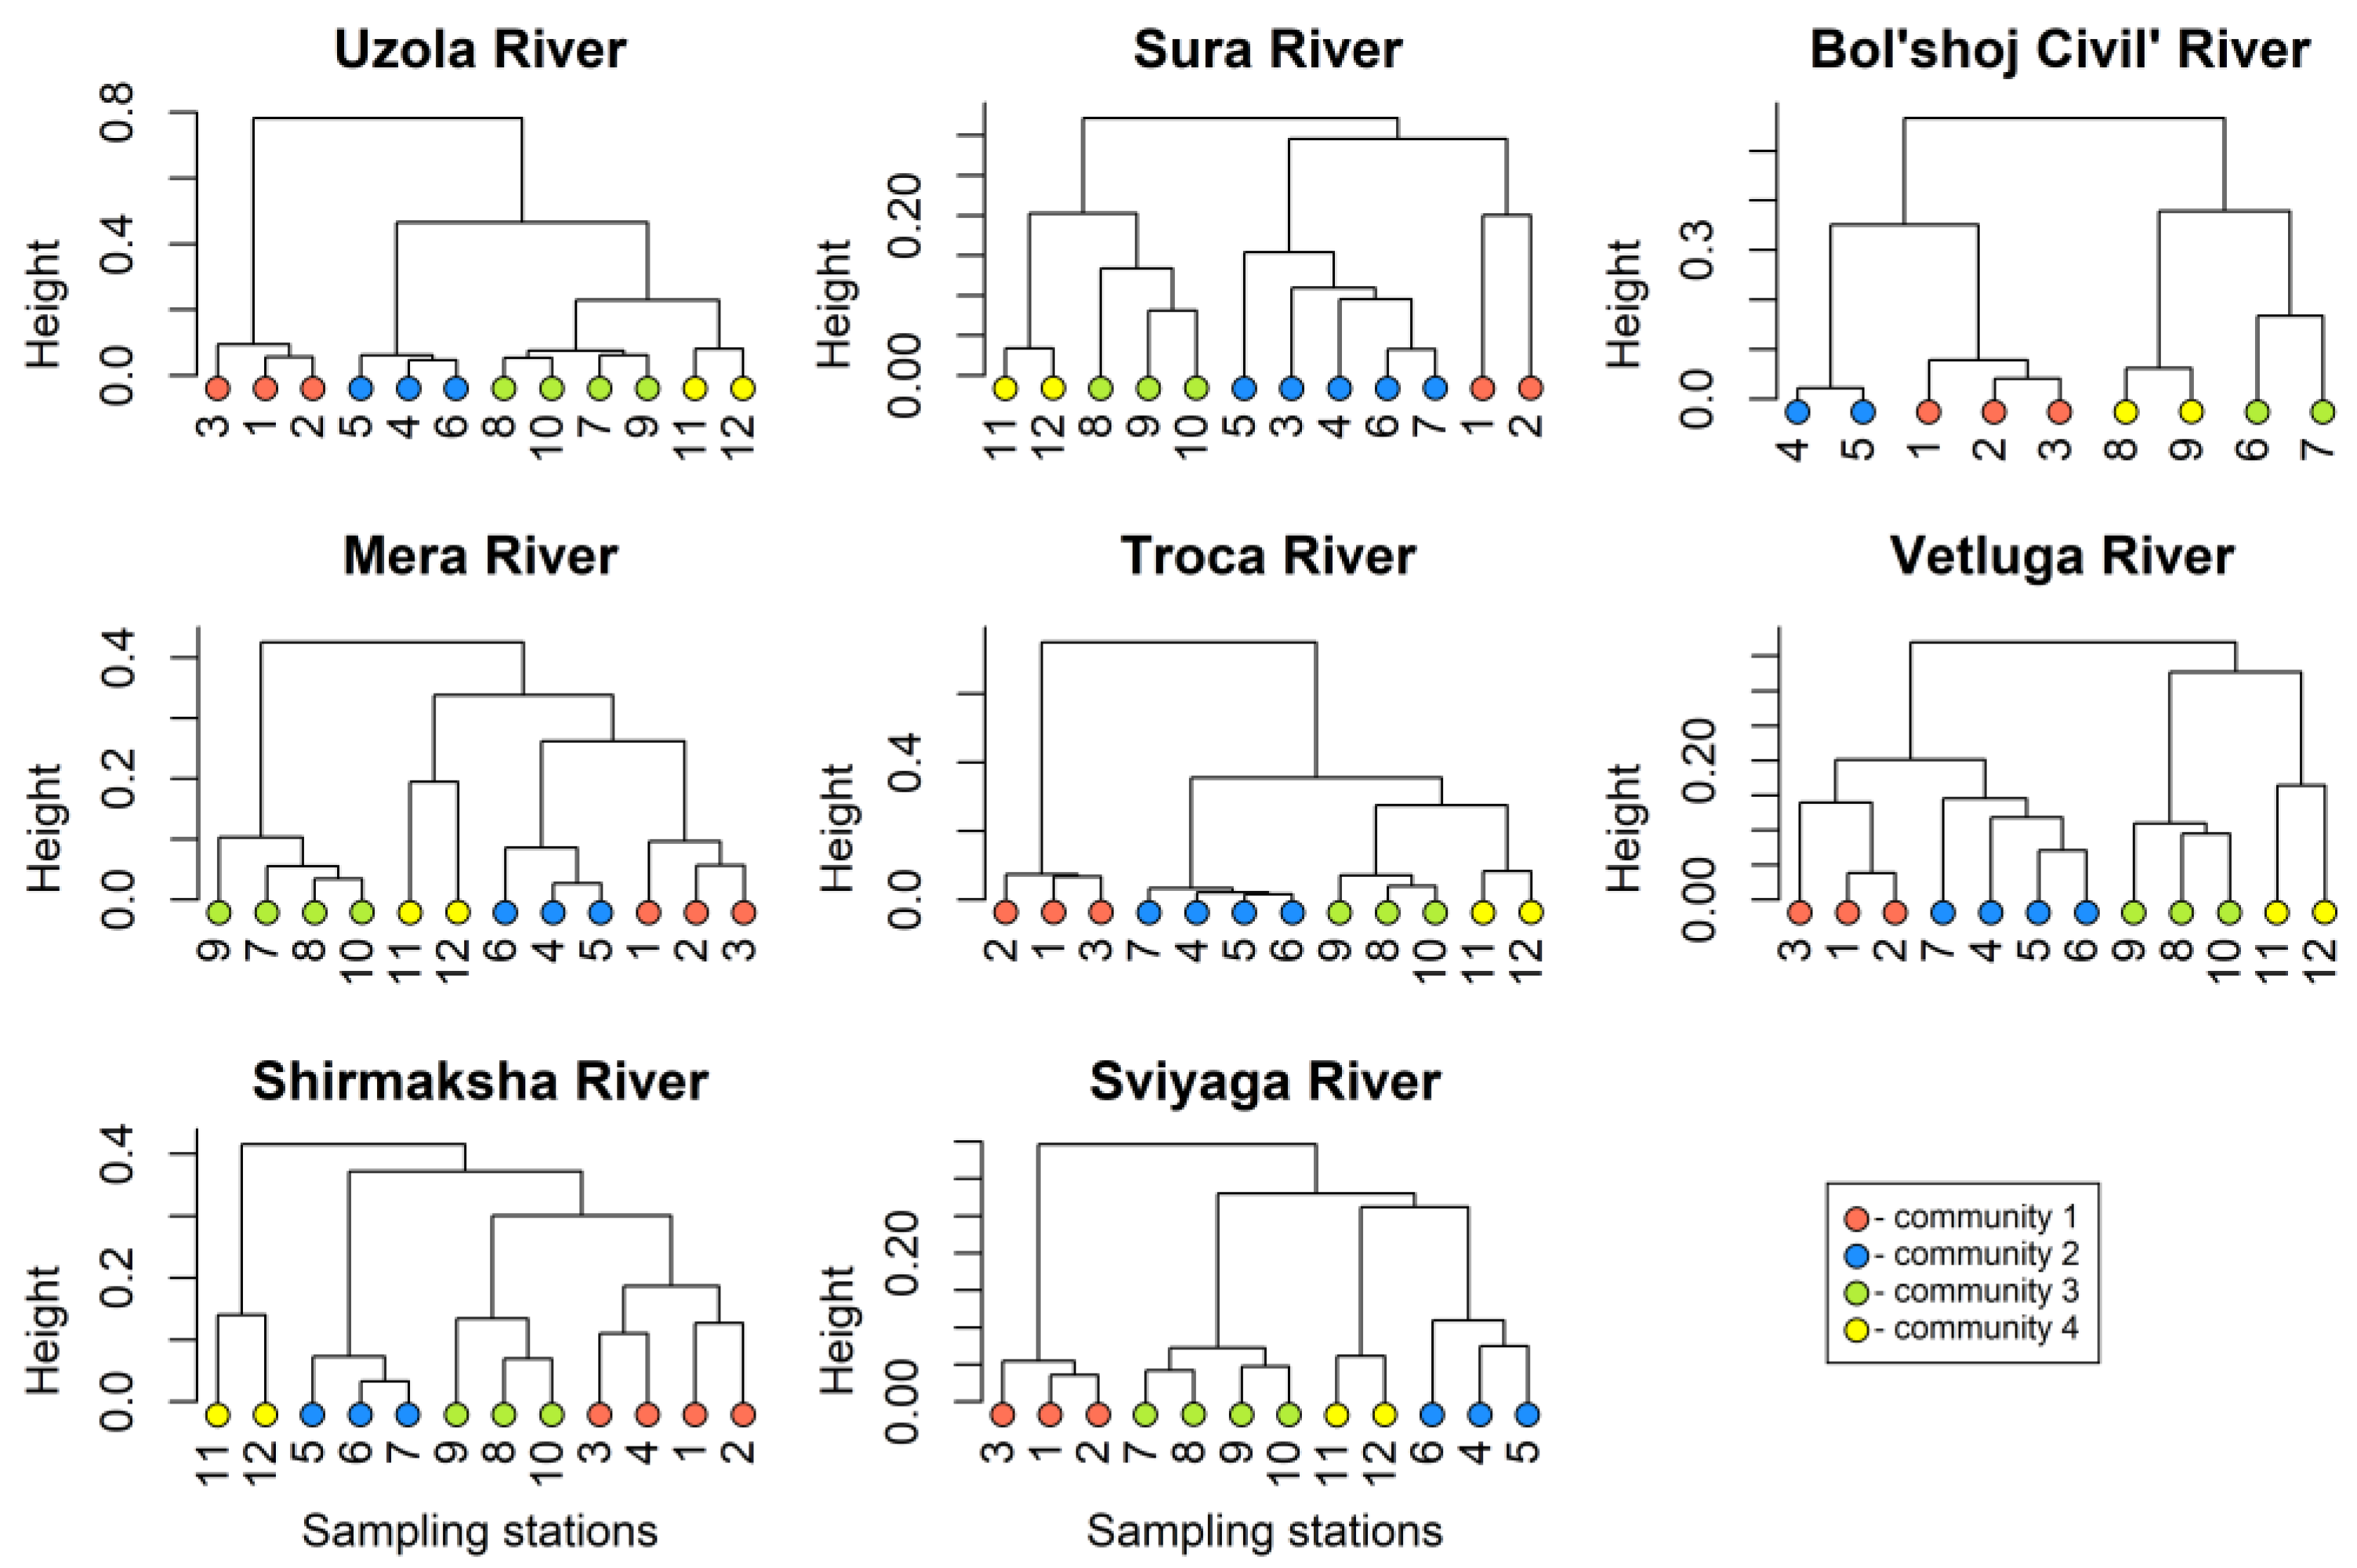
3.1. Zooplankton Communities

In the lower course of the studied rivers, their mouth areas, and the near-confluence areas of the Middle Volga reservoirs, 143 zooplankton taxa were identified and determined to the species rank. Several hybrid forms were found: the cladoceran predator Bythotrephes brevimanus Lilljeborg, 1901 and B. cederströmii Schödler, 1877, as well as the cladoceran filter feeder Daphnia (D.) galeata Sars, 1863 and D. (D.) cucullata Sars, 1862. In addition, four morphotypes of the cladoceran Bosmina (Eubosmina) coregoni Baird, 1857 were identified, namely B. (E.) cf. crassicornis Lilljeborg, 1887; B. (E.) cf. berolinensis Imhof, 1888; B. (E.) cf. cederströmi Schödler, 1866, and B. (E.) cf. gibbera Schoedler, 1863. Most of the found species were cosmopolitan and widespread in the Middle Volga basin.
Most of the identified species belonged to rotifers. Their share of the total species richness averaged 49%. The proportion of cladocerans was 35%, and the smallest group was copepods, at 16%.
The distribution of zooplankton along the longitudinal profile of the tributaries’ mouth areas was not uniform. Some areas had a similar species structure and strongly differed from the adjacent zones. In general, the heterogeneity in the mouth areas was rather high. According to the samples’ hierarchical clustering, based on the zooplankton species abundance, we determined the optimal cluster numbers with different species structures. In each of the three mouth area types, we identified four clusters, which were considered to be the different zooplankton communities (Figure 2).
Despite the heterogeneity of the studied tributaries, the samples in each tributary could be divided into four clusters, which were considered different zooplankton communities. We combined the data on the discovered communities, and constructed diversity, evenness, functional, and species richness boxplots for each community (C1, C2, C3, C4), as well as boxplots for the density and biomass of zooplankton (Figure 3). It was found that, except for the Pielou Evenness Index, the structural indicators of all the identified zooplankton clusters/communities were statistically significantly higher in community 2 (ANOVA, p-value ≤ 0.05).
According to Figure 3, community 2 significantly stands out on a number of structural indicators. The values of the structural parameters of zooplankton communities (diversity, taxonomic and functional richness, density, and biomass) allowed us to characterize community 2 (C2) as an ecotone community. Its localization slightly differed in different types of mouth areas (Figure 4).
We categorized structural indicators of the ecotone community (C2) according to mouth-area type (Figure 5). All the structural indicators (diversity, evenness, functional, and species richness, as well as the density and biomass of zooplankton) statistically significantly (ANOVA, p-value ≤ 0.05) decreased as the mouth area morphometry was simplified. The minimum values of the structural indicators were observed in simple mouth areas, and the maximum values were observed in the estuarine–deltaic mouth areas.

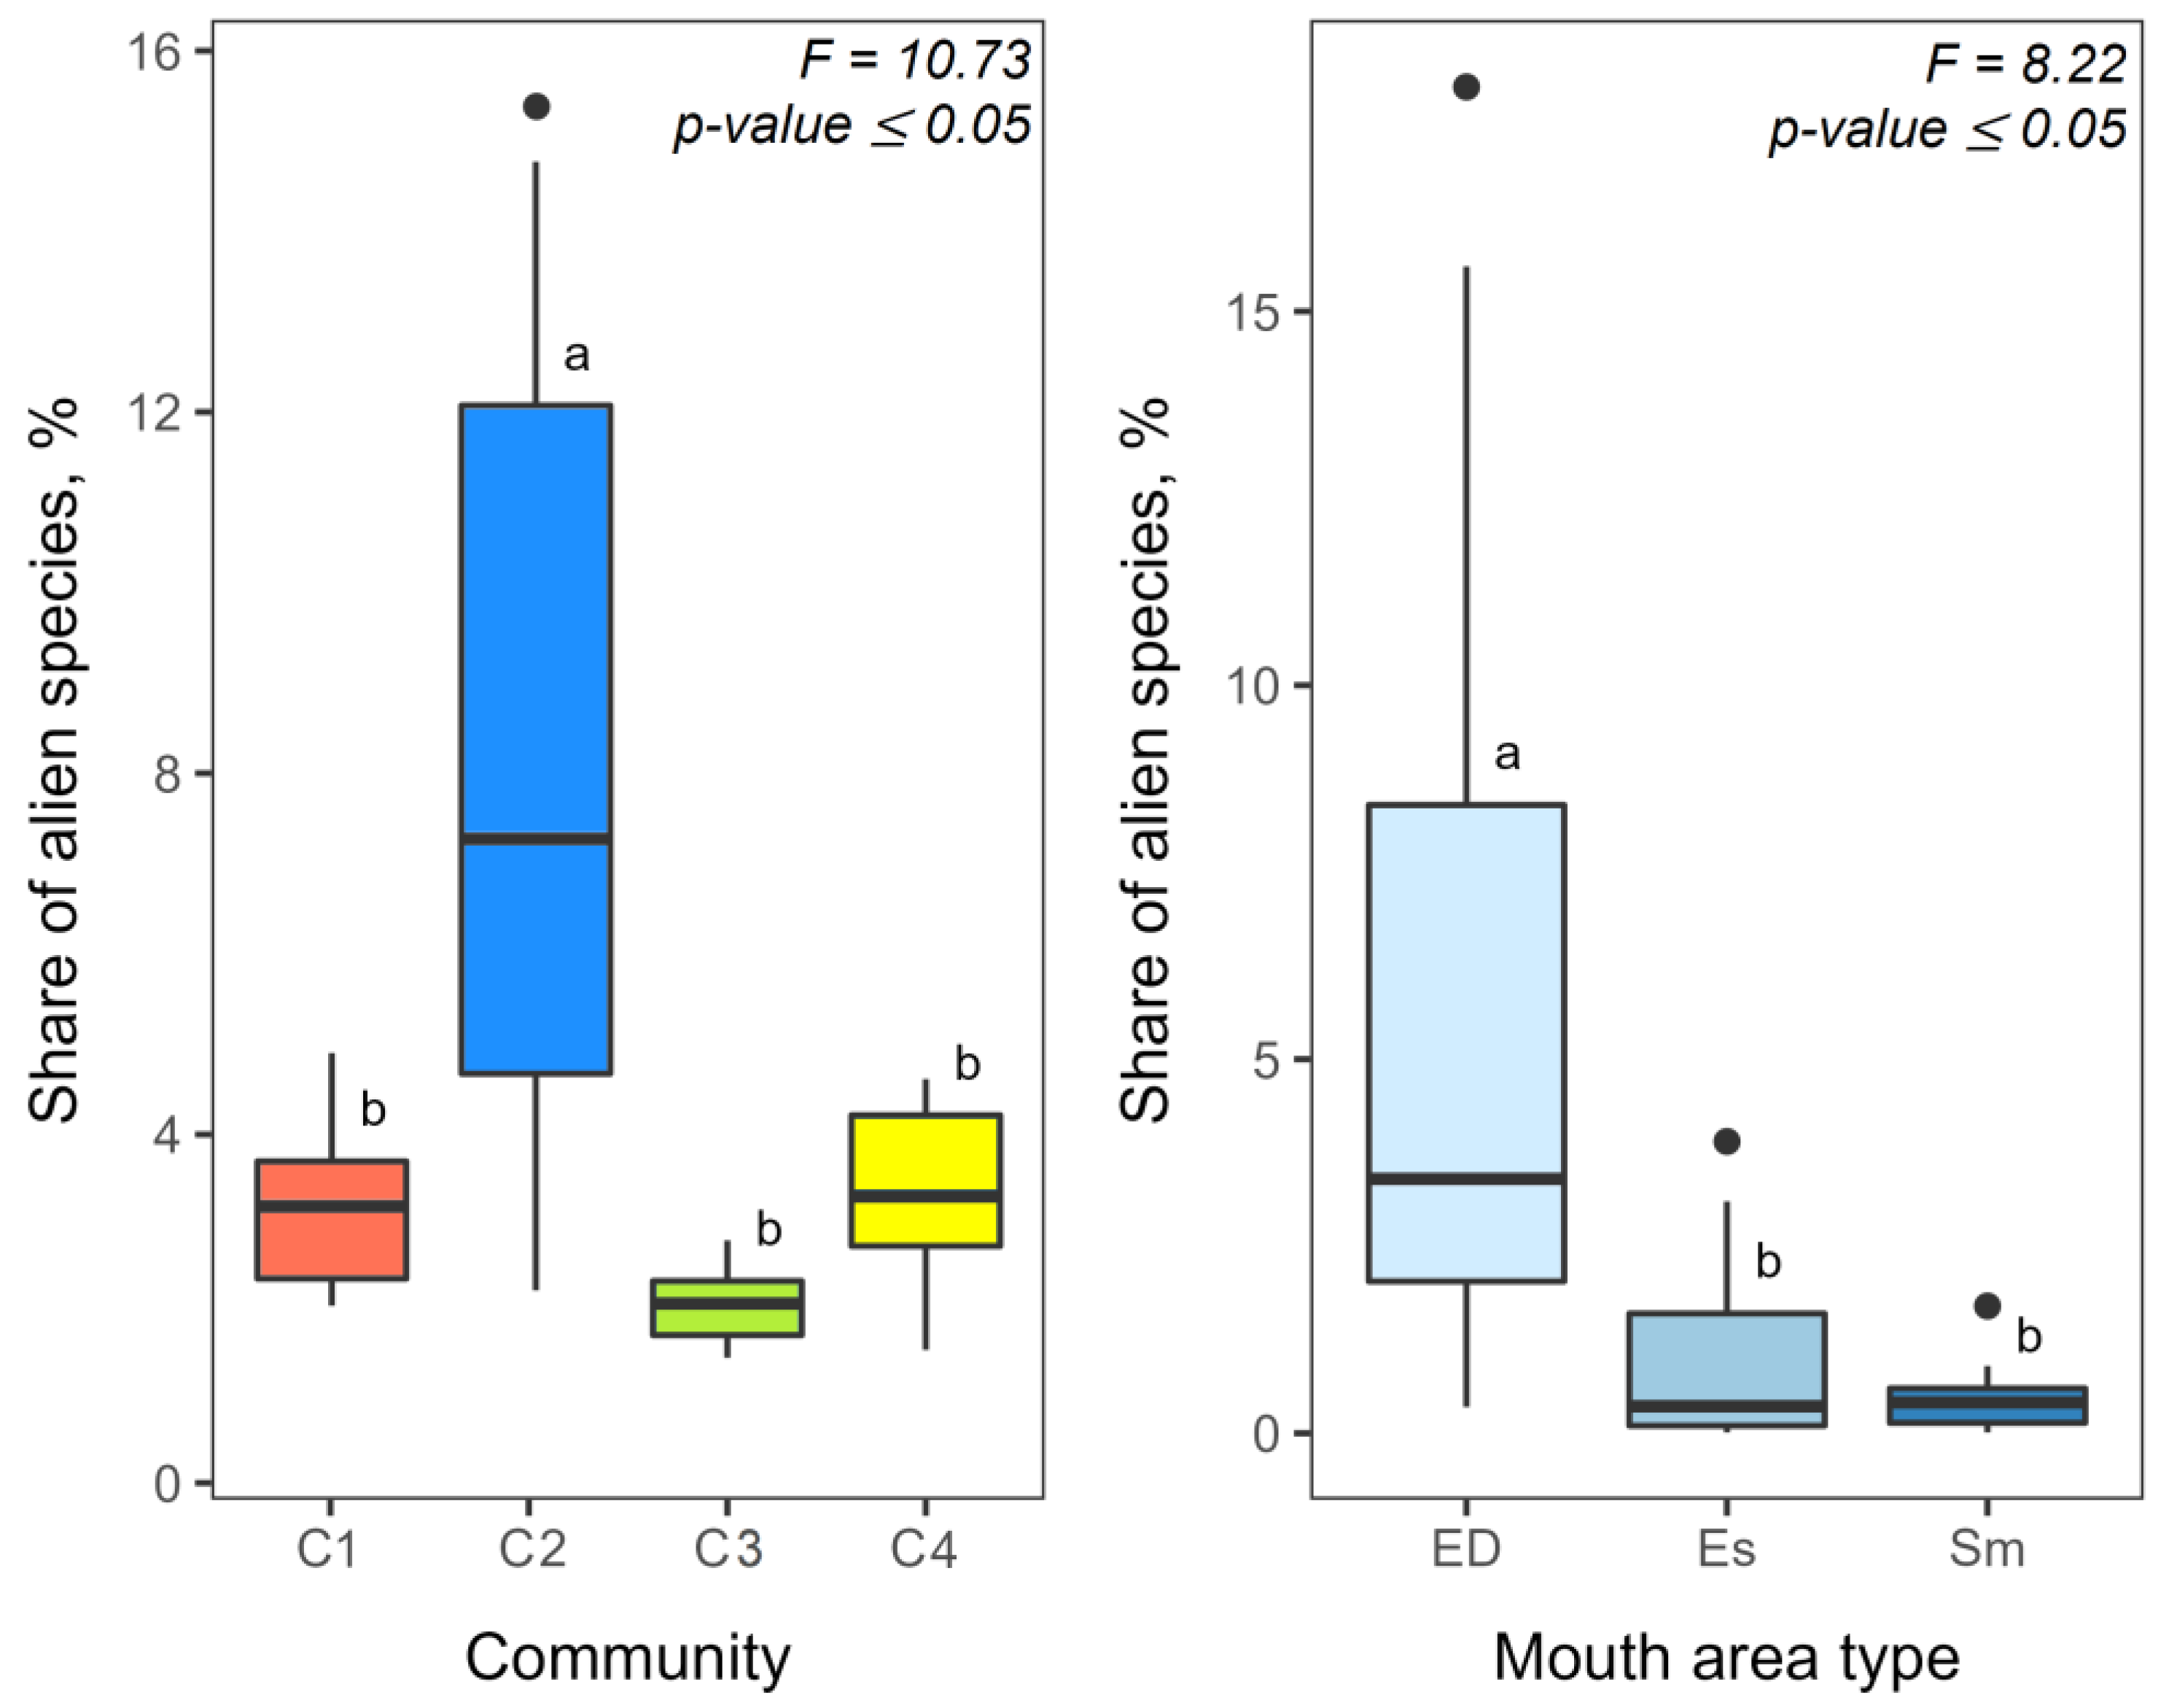
3.2. Alien Species and Its Share in Zooplankton Communities

Eight alien species were identified in the zooplankton fauna of the studied water bodies. All alien species can be divided into three groups. First, transcontinental alien species included rotifer Kellicottia bostoniensis (Rousselet, 1908) and copepod Acanthocyclops americanus (Marsh, 1893). The native habitat of these species is North America. Second, representatives of the Ponto–Caspian complex of alien species were found, namely copepods Eurytemora caspica Sukhikh and Alekseev, 2013, E. velox (Lilljeborg, 1853) and Heterocope caspia Sars G.O., 1897. Finally, Asian tropical species were found in the plankton of the studied water bodies: copepods Thermocyclops taihokuensis Harada, 1931, T. vermifer Lindberg, 1960, and the rotifer Keratella tropica (Apstein, 1907).
Of all the alien species that were found, only two were dominant species at some sampling stations, namely the copepod A. americanus (Sura River) and T. taihokuensis (Sviyaga River). The density of these species in the total zooplankton in some areas reached 15%. The highest density (community 2, 8560.0 ± 2230.0 ind./m3) was recorded for copepod tropical crustacean T. taihokuensis, which mainly developed in the mouth area of the Sviyaga River and its mouth area in the Kuybyshev Reservoir. The maximum densities of rotifer K. bostoniensis and copepods A. americanus, T. taihokuensis, and T. vermifer were observed in community 2 (Table 2). Ponto-Caspian copepods E. caspica, E. velox, and H. caspia were not found in community 1 (Table 2), and their density was low in other communities.
Analysis of the boxplots for the shares of alien species (Figure 6) of zooplankton showed a statistically significant increase (ANOVA, p-value ≤ 0.05) in community 2. The maximum share of alien zooplankton species was recorded in the most morphologically complex estuary–delta mouth areas (ANOVA, p-value ≤ 0.05) (Figure 6).

3.3. RDA of the Species Structure of Community 2

A strong variability in environmental factors was found in the water area of zooplankton community 2 (Table 3). Maximum chlorophyll-a, dissolved oxygen, and water temperature values were recorded in estuarine mouth areas. The maximum pH and water transparency values were recorded in simple mouth areas. In estuarine–deltaic mouth areas, the highest water conductivity, total phosphorus content, and trophic state index values were observed (Table 3).
In estuarine mouth areas, the pH, water conductivity, total phosphorus concentration, and trophic state index values were minimal. Chlorophyll-a concentration, water temperature, and transparency were the lowest in estuarine–deltaic mouth areas. Only the concentration of dissolved oxygen was minimal in simple mouth areas (Table 3).
We used redundancy analysis (RDA) to test each factor independently, to observe its connection with the species structure of zooplankton community 2 in the researched mouth areas (Table 4). All tested factors significantly explained the changes in the structure of plankton communities (p-value < 0.05). Electrical conductivity was the main factor, explaining 21.07% of the total variance in the species structure of zooplankton community 2. The other most significant factors were dissolved oxygen (10.33%) and water transparency (9.77%). Other factors influenced the structure of plankton communities much less.
The full model, including all factors, significantly explained 55.09% of the total variance (Figure 7). Samples of each mouth-area type were located along the horizontal axis of the RDA plot (showing 21.4% of the variance, p-value < 0.05), which correlated with the water transparency and electrical conductivity factors. The simple mouth areas had higher transparency values, and estuarine mouth areas and estuary–deltaic mouth areas were characterized by higher electrical conductivity values. The vertical axis (15.3%, p-value < 0.05) correlated with the pH, dissolved oxygen, trophic state index, and water temperature, and the location of the samples along the axis was associated with differences in the structure of communities in different mouth areas.
We also added the vectors for the dominant species to the RDA plot (Figure 7). This shows that plankton communities of both estuarine and estuary–deltaic mouth areas had approximately the same species structure, with crustaceans predominating: Daphnia cucullata, Diaphanosoma orghidani, nauplius Copepoda, and copepodite stages. The main dominant species in the simple mouth areas in community 2 were much more diverse, so its species structure was very dissimilar in different mouth areas (Figure 7), and included different crustacean species (Moina micrura, Chydorus sphaericus, Diaphanosoma brachyurum, and Bosmina longirostris), as well as rotifers (Conochilus unicornis, Euchlanis dilatata, Asplanchna sieboldi, and Filinia longiseta).

4. Discussion

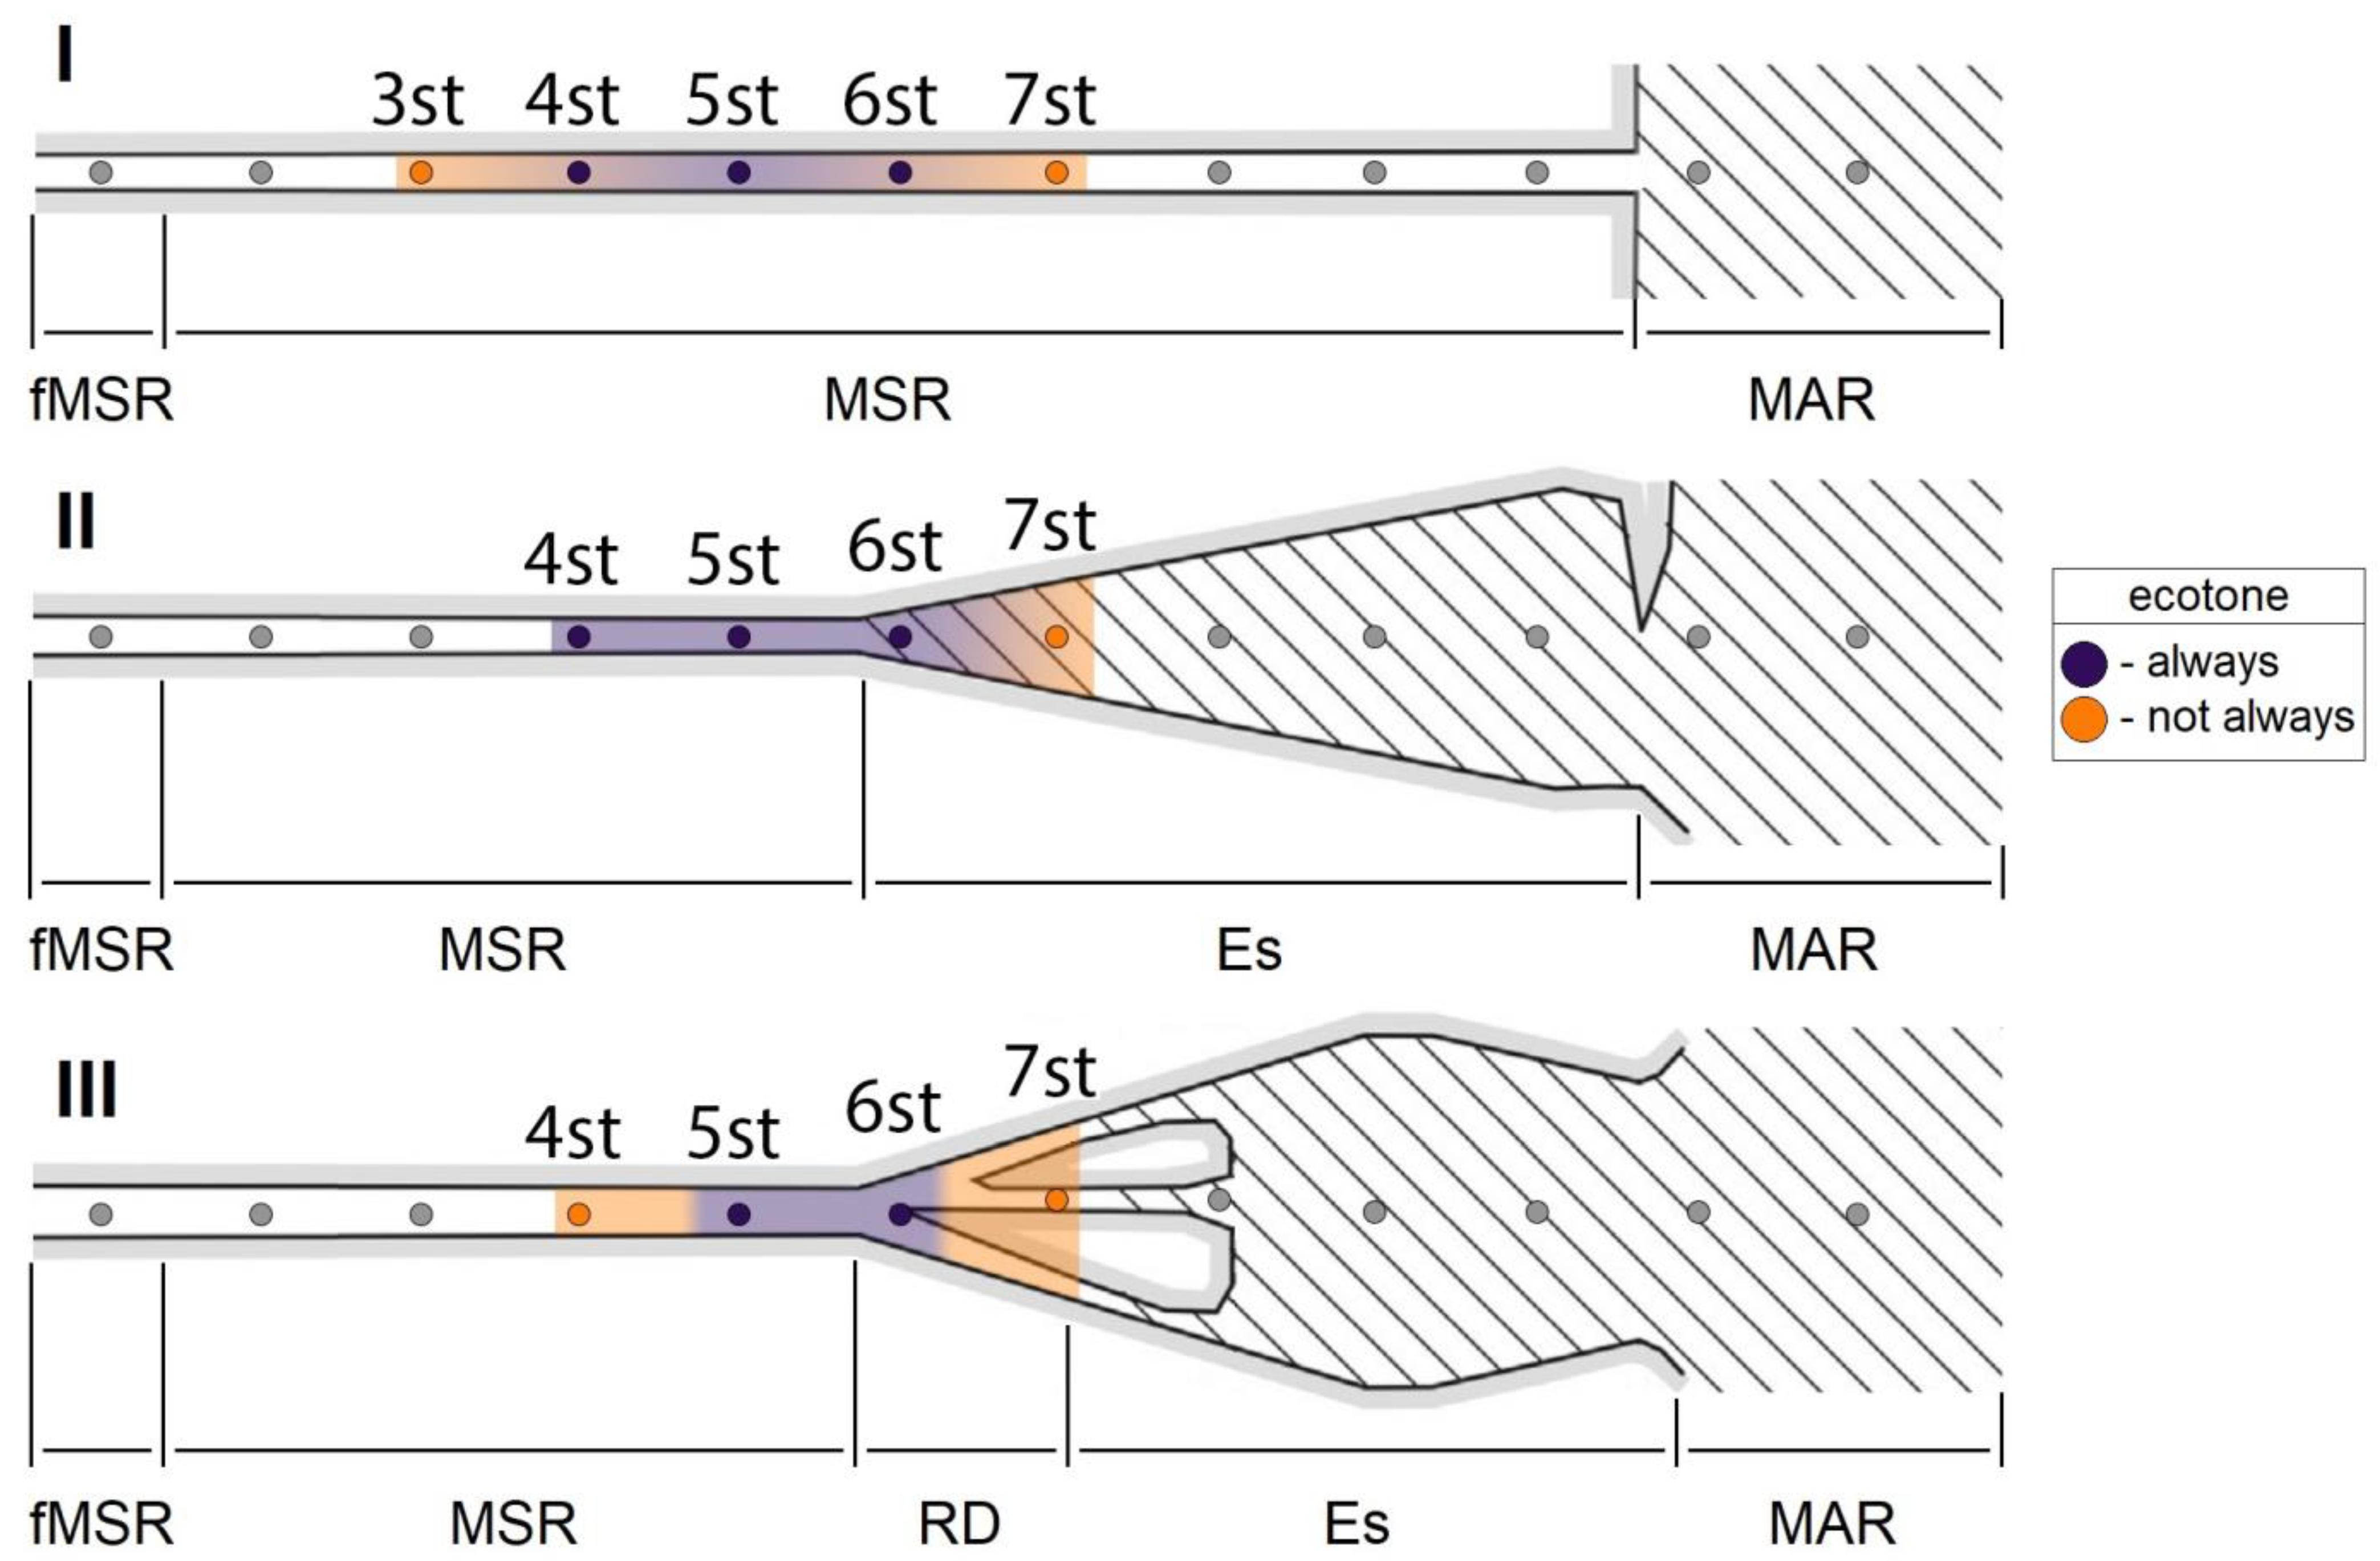
4.1. Structural Organization of Zooplankton Communities in Mouth Areas

Plankton communities in the tributary mouth areas of the lowland reservoirs are characterized by a rather high variability in their structural indicators. During the hydroecological zoning of small river mouth areas (estuarine type), A.V. Krylov and colleagues [7,8,9] identified specific zones within these river sections based on the electrical conductivity of water, namely, the free-flow zone of the river, the transition zone of the tributary, the frontal zone, the transition zone of the receiver, and the direct receiver zone. Upon further investigation, the authors found the highest structural indicators for aquatic communities in the frontal zone. Based on the hydroecological zoning of A.V. Krylov and S.E. Bolotov [10], the frontal zone of the estuary mouth area of the lowland reservoir’s small tributary can be defined as an ecotone—transition area between two communities, with increasing quantitative development and richness of fauna.
In our study, based on the species structure of zooplankton in all the studied mouth areas, despite the size of the tributaries (small, medium, and large) and the morphometry of the mouth areas (simple, estuarine, and estuary–deltaic), we were able to identify four clusters, corresponding to zooplankton communities with different species structures. Community 2 (C2), which is considered an ecotone community, corresponds with the frontal zone in the studies of A.V. Krylov and colleagues [10]. In our study, an ecotone was first found in simple and estuarine–deltaic mouth areas. The ecotone, as a transition zone with increased richness and the quantitative development of zooplankton, forms in small, medium, and large rivers.
An increase in the diversity, taxonomic richness, and quantitative development of zooplankton in the ecotone zone has been noted by various authors [47,48,49,50]. This was then used as a criterion for its determination. In our study, it was first revealed that, in the ecotone zone, the indicators of zooplankton functional richness (FRic) also increased, similar to the parameters mentioned above. Functional richness measures the volume of a functional space that is occupied by a particular species group [51,52]. In the ecotone, the number of species with different functional traits becomes more significant. This pattern indicates that individual species in an ecotone play unique ecological roles; therefore, they have low ecological redundancy. Several species perform different functions, supporting the structure and functioning of ecotones.
The research of V.N. Mikhailov [53] suggested that the simple mouth area is the most primitive in terms of both its morphological structure and biotope variation, while the estuary–deltaic mouth area is the most complex. The estuarine mouth area can be considered an intermediate example in terms of complexity. The typification of mouth areas is well-developed and covered in the works of Russian scientists [10,54], while information on this issue in international publications is extremely scarce [55,56,57].
Our results show that, as the morphological structure of the estuarine zone simplified, the zooplankton species structure indicators, including functional richness, decreased, which may indicate that some of the potential community resources (alpha niches) are not used. Similar patterns were noted by O.L. Petchey [58]. In this case, the lower functional richness found in the ecotones of simple mouth areas implies that, under favorable combinations of environmental factors, species that could take advantage of these conditions may not be present, leading to a simplification of the zooplankton communities in these types of mouth area [59].
Due to the high dynamism of mouth-area ecosystems, an intensive drift in fauna occurs in both the longitudinal riverbed profile and the horizontal profile extending from the ripal to the medial and back [60,61,62]. In this regard, the ecotone in the estuarine–deltaic estuarine areas is a highly productive system, with the highest richness, diversity, and quantitative development of zooplankton, as confirmed by the studies of A.V. Krylov and colleagues [7,8,9,10].

4.2. Alien Species of Zooplankton in Mouth Areas

The species’ expansion processes that occur under changing climate conditions and as a result of human activities are an increasingly noticeable phenomenon, as reflected in a high number of scientific studies [25,26,27,28,29,30,31,32,33]. Findings of alien species are a consequence not only of global climate change but also of active human activity in inland waterways [30].
The quantitative development of zooplankton alien species in the investigated mouth areas was relatively low, with the exception of the copepod T. taihokuensis, which had high density values. This species has been actively spreading in the Middle Volga basin since 2019. It was first found in the mouth area of the Sura River [27]. In the present study, high density values of this species were also noted in the mouth area of the Sviyaga River (downstream of the Volga River, Kuybyshev Reservoir). As mentioned above, the ecotone is a highly productive zone, where the quantitative and qualitative development of zooplankton increases. This was confirmed by S. Kark [50] and J. Ejsmont-Karabin [23].
In addition, a comparative analysis of zooplankton alien species’ contribution to the total density indicators showed that they were more prominent in the mouth areas with the most complex morphological structure. In general, the patterns obtained during the analysis of the species structure of zooplankton communities can also be seen at lower levels, including the group of alien species. The mouth areas of lowland reservoir tributaries, as a system of conjugation between a river and a reservoir, are unique in their heterogeneity and mixture of habitats and can be sources of the distribution of alien species of zooplankton [25,27,28,29,33], acting as acclimatization biotopes and natural refugia.

4.3. Environmental Factors Regulating the Ecotone Community

The electrical conductivity of water showed a significant degree of correlation with the species structure of the ecotone community of estuarine and estuary–deltaic mouth areas. A similar pattern is often observed in habitats with strong gradients regarding this environmental parameter [63,64,65].
For one ecotone community (Figure 7), the degree of eutrophication was an important factor. Many studies note the important role that eutrophication plays in the formation of plankton communities’ species structure [66,67,68,69]. It is clear that ecotone communities are no exception, and their species structure, especially in highly eutrophic waters, is closely related to the degree of eutrophication.
Our studies showed that water transparency and dissolved oxygen content correlated well with the species structure of ecotone communities in simple mouth areas. This is primarily due to the hydrological regime. A high flow velocity and high transparency can be seen in simple mouth areas. A. Rajwa and colleagues [70] pointed out that good enrichment of water with oxygen is often observed as a result of strong turbulence.
An analysis of the dominant species in the ecotone communities of the studied mouth areas showed that in the estuary–deltaic and estuarine mouth areas, crustaceans formed the only dominant complex. The ecotone in mouth areas of this type is most often located closer to the water area of the reservoir, which means it undergoes a more intensive exchange with the reservoir fauna, where limnetic crustaceans traditionally dominate [71,72,73]. In our studies on the ecotone community of simple estuarine areas, the dominant complex contained both rotifers and crustaceans. The dominant complex of ecotone communities in simple mouth areas was largely formed of fauna from the free flow of the river. N. Phan et al. [74] and E. Ko et al. [75] showed an area in which rheophilic plankton and rotifers are most dominant.

5. Conclusions

The tributary mouth areas of lowland reservoirs, due to their morphological and hydrophysical features, are characterized by the noticeable heterogeneity in the species structure of the zooplankton communities associated with these zones. In our work, we were able to confirm some assumptions. During periods of hydrological stability in all morphological mouth-area types of the studied lowland reservoir tributaries, which differed in length and basin, an ecotone was distinguished. In these ecotones, a noticeable increase in the density, biomass, diversity, species, and functional richness of zooplankton was noted. As the morphological structure of the mouth areas became more complex, all the structural indicators of zooplankton increased. The emerging conditions in ecotones are favorable to the development of alien zooplankton species. The main factors determining the species structure of zooplankton communities in ecotones were the electrical conductivity, the dissolved oxygen content, and the transparency of the water.

Author Contributions

V.Z. substantially contributed to the study’s conception, data acquisition, and analysis; I.K. performed statistical analysis and translation of the manuscript; D.G. substantially contributed to data acquisition; E.V. contributed to the translation of the manuscript; O.E. and M.T. carried out hydrochemical analyses and general consulting; G.S. substantially contributed to drafting the manuscript. All authors have read and agreed to the published version of the manuscript.

Funding

Most of the fieldwork for this study was supported by the Russian Geographical Society («The Floating University of the Volga Basin», projects No. 17/2021-P and 17-2022-P). This study was supported by the Russian Foundation for Basic Research (project No. 20-34-90097).

Institutional Review Board Statement

Not applicable.

Data Availability Statement

The datasets generated and/or analyzed during the current study are available from the corresponding author upon request.

Conflicts of Interest

The authors declare no conflict of interest.

References

  1. Novoselov, A.P.; Imant, E.N.; Artem’ev, S.N.; Matveev, N.Y.; Matveeva, A.D. Current State of Planktonic and Benthic Communities in the Mouth Part of the Northern Dvina River. Russ. J. Ecol. 2022, 53, 212–220. [Google Scholar] [CrossRef]
  2. Zalewski, M.; Frankiewicz, P.; Nowak, M. Biomanipulation by ecotone management in lowland reservoir. Hydrobiologia 1995, 303, 49–60. [Google Scholar] [CrossRef]
  3. Di Castri, F.; Hansen, A.J.; Holland, M.M. A new look at ecotones: Emerging international projects on landscape boundaries. Biol. Int. 1988, 17, 163. [Google Scholar]
  4. Hansen, A.J.; Castri, F. Landscape Boundaries; Springer: New York, NY, USA, 1992; p. 452. [Google Scholar]
  5. Risser, P.G. The status of the science examining ecotones. BioScience 1995, 45, 318–325. [Google Scholar] [CrossRef]
  6. Lachavanne, J.B.; Juge, R. Biodiversity in Land-Inland Water Ecotones; Taylor & Francis: New York, NY, USA, 1977; p. 308. [Google Scholar]
  7. Krylov, A.V.; Tsvetkov, A.I.; Malin, M.I.; Romanenko, S.A.; Poddubnii, S.A.; Otjukova, N.G. Communities of hydrobionts and the physical-chemical characteristics of the estuary area of inflow of a flat water basin. Inland Water Biol. 2010, 3, 59–69. [Google Scholar] [CrossRef]
  8. Bolotov, S.E.; Krylov, A.V.; Eskov, V.M.; Kozlova, V.V.; Mukhortova, O.V. Comparative Analysis of Ecological Structure and Parameters of the Chaotic Organization of Zooplankton in the Outfall of a Tributary of a Flatland Water Reservoir. Proc. Samara Sci. Cent. Russ. Acad. Sci. 2014, 16, 223–226. [Google Scholar]
  9. Bolotov, S.E.; Tsvetkov, A.I.; Krylov, A.V. Zooplankton in the zones of confluence of unregulated rivers. Inland Water Biol. 2012, 5, 184–191. [Google Scholar] [CrossRef]
  10. Hydroecology of Lowland Water Reservoir Tributaries’ Mouth; Filigran: Yaroslavl, Russia, 2015; p. 466.
  11. Naiman, R.J.; Décamps, H.; Pastor, J.; Johnston, C.A. The Potential Importance of Boundaries of Fluvial Ecosystems. J. N. Am. Benthol. Soc. 1988, 7, 289–306. [Google Scholar] [CrossRef]
  12. Kozuharov, D.; Evtimova, V.; Zaharieva, D. Long-term changes of zooplankton and dynamics of eutrophication in the polluted system of Strouma River—Pchelina Reservoir (South-western Bulgaria). Acta Zool. Bulg. 2007, 59, 191–202. [Google Scholar]
  13. Traykov, I.; Boyanovsky, B.; Zivkov, M. Composition and abundance of Zooplankton in Kardzhaly reservoir. Bulg. J. Agric. Sci. 2011, 4, 501–511. [Google Scholar]
  14. Mieczan, T.; Adamczuk, M.; Nawrot, D. Effect of water chemistry on the planktonic communities and relationships among food web components across a freshwater ecotone. Arch. Biol. Sci. 2013, 4, 1491–1504. [Google Scholar] [CrossRef]
  15. Ward, J.V.; Tockner, K.; Schiemer, F. Biodiversity of floodplain river ecosystems: Ecotones and connectivity. Regul. Rivers Res. Manag. 1999, 15, 125–139. [Google Scholar] [CrossRef]
  16. Lampert, W.; Sommer, U. Limnoecology: The Ecology of Lakes and Streams; Oxford University Press: North York, ON, Canada, 1997; p. 400. [Google Scholar]
  17. Moss, B. Ecology of Freshwater; Wiley-Blackwell: Hoboken, NJ, USA, 1988; p. 352. [Google Scholar]
  18. Sharma, R.C. Habitat ecology and diversity of freshwater zooplankton of Uttarakhand Himalaya, India. Biodivers. Int. J. 2020, 5, 188–196. [Google Scholar]
  19. Andronikova, I.N. Structural and Functional Organization of Zooplankton in Lake Ecosystems of Different Trophic Types; Nauka: St. Petersburg, Russia, 1996; p. 189. [Google Scholar]
  20. Krylov, A.V. Zooplankton of Lowland Small Rivers; Nauka: Moscow, Russia, 2005; p. 263. [Google Scholar]
  21. Shurganova, G.V. Dynamics of Species Structure of Zooplanktocenoses during Their Formation and Development (by the Example of Reservoirs in the Middle Volga: Gorki and Cheboksary); Extended Abstract of Doctoral (Biol.) Dissertation; Cyberleninka: Nizhny Novgorod, Russia, 2007; p. 48. [Google Scholar]
  22. Grabowska, M.; Ejsmont-Karabin, J.; Karpowicz, M. Reservoir-river relationships in lowland, shallow, eutrophic systems: An impact of zooplankton from hypertrophic reservoir on river zooplankton. Pol. J. Ecol. 2013, 4, 759–768. [Google Scholar]
  23. Ejsmont-Karabin, J. Is sandy beach of the lake an ecotone? Psammon rotifera in a mesotrophic Lake Kuc (Masurian Lakeland, Northern Poland). Pol. J. Ecol. 2003, 2, 219–224. [Google Scholar]
  24. Ilyin, M.Y. Composition and Structure of Zooplankton Communities of Water Bodies of Specially Protected Natural Areas (by Example of the Nizhny Novgorod Region); Extended Abstract of Doctoral (Biol.) Dissertation; Cyberleninka: Nizhny Novgorod, Russia, 2016; p. 36. [Google Scholar]
  25. Gavrilko, D.E.; Zhikharev, V.S.; Ruchkin, D.S.; Zolotareva, T.V.; Shurganova, G.V. Cladocerans in the higher aquatic plant thickets in European Russia, the inflows of the Gorkovsky and Cheboksarky reservoirs taken as examples. Zoo. J. 2020, 99, 146–156. [Google Scholar]
  26. Podshivalina, V.N.; Sheveleva, N.G. First record of Sinodiaptomus sarsi (Copepoda: Calanoida) from the East European Plain. Zoosyst. Ross. 2020, 29, 60–69. [Google Scholar] [CrossRef]
  27. Zhikharev, V.S.; Gavrilko, D.E.; Shurganova, G.V. A record of the tropical species Thermocyclops taihokuensis Harada, 1931 (Copepoda: Cyclopoida) in European Russia. Biol. Bull. 2020, 47, 1347–1350. [Google Scholar] [CrossRef]
  28. Zhikharev, V.S.; Neretina, A.N.; Zolotareva, T.V.; Gavrilko, D.E.; Shurganova, G.V. Ilyocryptus spinifer Herrick 1882 (Crustacea, Branchiopoda, Cladocera): The first record of the species in the european fauna. Biol. Bull. 2020, 47, 930–936. [Google Scholar] [CrossRef]
  29. Zhikharev, V.S.; Sinev, A.Y.; Shurganova, G.V. New record of non-indigenous cladoceran Pleuroxus denticulatus Birge, 1879 (Cladocera: Chydoridae) in the European Russia. Invertebr. Biol. 2022, 19, 317–323. [Google Scholar] [CrossRef]
  30. Alekseev, V.R. Confusing Invader: Acanthocyclops americanus (Copepoda: Cyclopoida) and Its Biological, Anthropogenic and Climate-Dependent Mechanisms of Rapid Distribution in Eurasia. Water 2021, 13, 1423. [Google Scholar] [CrossRef]
  31. Fefilova, E.B. Records of the Siberian–Beringian Genus Nordodiaptomus (Copepoda, Calanoida) from the European Part of Russia. Biol. Bull. 2020, 48, 1231–1235. [Google Scholar] [CrossRef]
  32. Kotov, A.A.; Karabanov, D.P.; Van Damme, K. Non-indigenous Cladocera (Crustacea: Branchiopoda): From a few notorious cas58es to a potential global faunal mixing in aquatic ecosystems. Water 2022, 14, 2806. [Google Scholar] [CrossRef]
  33. Lazareva, V.I.; Zhdanova, S.M.; Sabitova, R.Z. The spread of east asian copepod Thermocyclops taihokuensis (Crustacea, Copepoda) in the Volga River basin. Inland Water Biol. 2022, 15, 139–148. [Google Scholar] [CrossRef]
  34. Mikhailov, V.N.; Mikhailova, M.V.; Magritsky, D.V. Fundamentals of the Hydrology of River Mouths: A Textbook; Triumf: Moscow, Russia, 2018; p. 314. [Google Scholar]
  35. Hudec, I. Anomopoda, Ctenopoda, Haplopoda, Onychopoda (Crustacea: Branchiopoda). Fauna Slovenska III; VEDA: Bratislava, Slovakia, 2010; p. 496. [Google Scholar]
  36. Błędzki, L.A.; Rybak, J.I. Freshwater Crustacean Zooplankton of Europe: Cladocera & Copepoda (Calanoida, Cyclopoida) Key to Species Identification, with Notes on Ecology, Distribution, Methods and Introduction to Data Analysis; Springer: Cham, Switzerland, 2016; p. 918. [Google Scholar]
  37. Rogers, D.C.; Thorp, J.H. Keys to Palaearctic Fauna. Thorp and Covich’s Freshwater. Invertebrates; Academic Press: Oxford, UK, 2019; Volume IV, p. 920. [Google Scholar]
  38. Korovchinsky, N.M.; Kotov, A.A.; Sinev, A.Y.; Neretina, A.N.; Garibyan, P.G. Cladocera (Crustacea: Cladocera) of Northern Eurasia; KMK Scientific Press Ltd.: Moscow, Russia, 2021; Volume II, p. 544. [Google Scholar]
  39. Sapozhnikov, V.V.; Agatova, A.I.; Arzhanova, N.V.; Mordasova, N.V.; Lapina, N.M.; Zubarevich, V.L. Guidelines for Chemical Analysis of Marine and Fresh Waters in Environmental Monitoring of Fishery Waters and Fishery Prospective Areas of the World Ocean; VNIRO: Moscow, Russia, 2003; p. 202. [Google Scholar]
  40. Carlson, R.E. A trophic state index for lakes. Limnol. Oceanogr. 1977, 22, 361–369. [Google Scholar] [CrossRef]
  41. Legendre, P.; Legendre, L. Numerical Ecology; Elsevier: Oxford, UK, 2012; p. 990. [Google Scholar]
  42. Gavrilko, D.E.; Shurganova, G.V.; Kudrin, I.A.; Yakimov, B.N. Identification of Freshwater Zooplankton Functional Groups Based on the Functional Traits of Species. Biol. Bull. 2021, 48, 1849–1856. [Google Scholar] [CrossRef]
  43. Rousseeuw, P.J. Silhouettes: A graphical aid to the interpretation and validation of cluster analysis. J. Comp. Appl. Math. 1987, 20, 53–65. [Google Scholar] [CrossRef]
  44. Borcard, D.; Gillet, F.; Legendre, P. Numerical Ecology with R; Springer: New York, NY, USA, 2011; p. 306. [Google Scholar]
  45. Yakimov, B.N.; Shurganova, G.V.; Cherepennikov, V.V.; Kudrin, I.A.; Il’in, M.I. Methods for comparative assessment of the results of cluster analysis of hydrobiocenoses structure (by the example of zooplankton communities of the Linda River, Nizhny Novgorod region). Inland Water Biol. 2016, 2, 200–208. [Google Scholar] [CrossRef]
  46. R Core Team. R: A Language and Environment for Statistical Computing. 2020. Available online: http://www.R–project.org/ (accessed on 30 November 2022).
  47. Holland, M.; Risser, P.; Naiman, R. Ecotones; Springer: New York, NY, USA, 1991; p. 142. [Google Scholar]
  48. Janauer, G.A. Macrophytes, hydrology, and aquatic ecotones: A GIS-supported ecological survey. Aquat. Bot. 1997, 58, 379–391. [Google Scholar] [CrossRef]
  49. Kent, M.; Gill, W.J.; Weaver, R.E.; Armitage, R.P. Landscape and plant community boundaries in biogeography. Prog. Phys. Geogr. 1997, 21, 315–353. [Google Scholar] [CrossRef]
  50. Kark, S. Chapter 9. Ecotones and Ecological Gradients/Ecological Systems: Selected Entries from the Encyclopedia of Sustainability Science and Technology; Springer: New York, NY, USA, 2013; pp. 147–160. [Google Scholar]
  51. Mason, N.W.H.; Mouillot, D.; Lee, W.G.; Bastow-Wilson, J. Functional richness, functional evenness and functional divergence: The primary components of functional diversity. Oikos 2005, 111, 112–118. [Google Scholar] [CrossRef]
  52. Mouillot, D.; Villéger, S.; Scherer-Lorenzen, M.; Mason, N.W.H. Functional Structure of Biological Communities Predicts Ecosystem Multifunctionality. PLoS ONE 2011, 6, e17476. [Google Scholar] [CrossRef]
  53. Mikhailov, V.N.; Gorin, S.L. New definitions, regionalization, and typification of river mouth areas and estuaries as their parts. Water Resour. 2012, 39, 243–257. [Google Scholar] [CrossRef]
  54. Shkolny, D.I.; Aibulatov, D.N. Types of River Mouth Sites of the Southern Island (The Novaya Zemlya Archipelago). Vestn. Mosk. Universiteta. Seriya 5 Geogr. 2016, 6, 50–58. [Google Scholar]
  55. Bhattacharya, J. Deltas and Estuaries. Sedimentology; Springer: Berlin, Germany, 1978; pp. 145–152. [Google Scholar]
  56. Bianchi, T.S.; Allison, M.A. Large-river delta-front estuaries as natural “recorders” of global environmental change. Proc. Natl. Acad. Sci. USA 2009, 106, 8085–8092. [Google Scholar] [CrossRef] [PubMed]
  57. Kennish, M.J. Ecology of Estuaries; CRC Press: Boca Raton, FL, USA, 1986; p. 272. [Google Scholar]
  58. Petchey, O.L. Integrating methods that investigate how complementarity influences ecosystem functioning. Oikos 2003, 101, 323–330. [Google Scholar] [CrossRef]
  59. Tilman, D. Biodiversity: Population versus ecosystem stability. Ecology 1996, 77, 350–363. [Google Scholar] [CrossRef]
  60. Ward, J.V.; Wiens, J.A. Ecotones of riverine ecosystems: Role and typology, spatiotemporal dynamics, and river regulation. Ecohyd. Hydrob. 2001, 1, 25–36. [Google Scholar]
  61. Patrick, C.J. Macroinvertebrate communities of ecotones between the boundaries of streams, wetlands, and lakes. Fundam. Appl. Limnol. 2014, 185, 223–233. [Google Scholar] [CrossRef]
  62. Huang, X.; Hu, B.; Wang, P.; Chen, X.; Xu, B. Microbial diversity in lake–river ecotone of Poyang Lake, China. Environ. Earth Sci. 2016, 75, 965. [Google Scholar] [CrossRef]
  63. Toruan, R.L.; Coggins, L.X.; Ghadouani, A. Response of Zooplankton Size Structure to Multiple Stressors in Urban Lakes. Water 2021, 13, 2305. [Google Scholar] [CrossRef]
  64. Florescu, L.I.; Moldoveanu, M.M.; Catană, R.D.; Păceșilă, I.; Dumitrache, A.; Gavrilidis, A.A.; Iojă, C.I. Assessing the Effects of Phytoplankton Structure on Zooplankton Communities in Different Types of Urban Lakes. Diversity 2022, 14, 231. [Google Scholar] [CrossRef]
  65. Zhang, S.; Lu, W.; Zhou, Z.; Chen, W. Spatial Differences in Zooplankton Community Structure between Two Fluvial Lakes in the Middle and Lower Reaches of the Yangtze River: Effects of Land Use Patterns and Physicochemical Factors. Diversity 2022, 14, 908. [Google Scholar] [CrossRef]
  66. Sługocki, Ł.; Czerniawski, R. Trophic state (TSISD) and mixing type significantly influence pelagic zooplankton biodiversity in temperate lakes (NW Poland). PeerJ 2018, 6, e5731. [Google Scholar] [CrossRef]
  67. Mamun, M.; Kim, J.Y.; An, K. Trophic Responses of the Asian Reservoir to Long-Term Seasonal and Interannual Dynamic Monsoon. Water 2020, 12, 2066. [Google Scholar] [CrossRef]
  68. Lu, X.; Liu, Y.; Fan, Y. Diatom Taxonomic Composition as a Biological Indicator of the Ecological Health and Status of a River Basin under Agricultural Influence. Water 2020, 12, 2067. [Google Scholar] [CrossRef]
  69. Xia, M.; Xiong, F.; Li, X.; Li, D.; Wang, Z.; Zhai, D.; Liu, H.; Chen, Y.; Yu, J.; Wang, Y. Different Assembly Patterns of Planktonic and Sedimentary Bacterial Community in a Few Connected Eutrophic Lakes. Water 2022, 14, 723. [Google Scholar] [CrossRef]
  70. Rajwa, A.; Bialik, R.J.; Karpiński, M.; Luks, B. Dissolved Oxygen in Rivers: Concepts and Measuring Techniques; Springer: Cham, Switzerland, 2014; pp. 337–350. [Google Scholar]
  71. Kruzhylina, S.V.; Buzevych, I.Y.; Rudyk-Leuska, N.Y.; Khyzhniak, M.I.; Didenko, A.V. Changes in the structure and dominance of the zooplankton communityof the Kremenchuk Reservoir under the effect of climate changes. Biosystems Diversity 2021, 29, 217–224. [Google Scholar] [CrossRef]
  72. Banerjee, A.; Rakshit, N.; Chakrabarty, M.; Sinha, S.; Ghosh, S.; Ray, S. Zooplankton community of Bakreswar reservoir: Assessment and visualization of distribution pattern using self-organizing maps. Ecol. Inform. 2022, 72, 101837. [Google Scholar] [CrossRef]
  73. Xiong, M.; Li, R.; Zhang, T.; Liao, C.; Yu, G.; Yuan, J.; Liu, J.; Ye, S. Zooplankton Compositions in the Danjiangkou Reservoir, a Water Source for the South-to-North Water Diversion Project of China. Water 2022, 14, 3253. [Google Scholar] [CrossRef]
  74. Phan, N.; Duong, Q.H.; Tran-Nguyen, Q.A.; Trinh-Dang, M. The Species Diversity of Tropical Freshwater Rotifers (Rotifera: Monogononta) in Relation to Environmental Factors. Water 2021, 13, 1156. [Google Scholar] [CrossRef]
  75. Ko, E.; Kim, D.; Jung, E.; Heo, Y.; Joo, G.; Kim, H. Comparison of Zooplankton Community Patterns in Relation to Sediment Disturbances by Dredging in the Guemho River, Korea. Water 2020, 12, 3434. [Google Scholar] [CrossRef]
Figure 1. Scheme of mouth area types and zones. (I)—simple mouth area; (II)—estuarine mouth area; (III)—estuary–deltaic mouth areas. Mouth area zones: fMSR—front of mouth section river; MSR—mouth section river; RD—river delta; Es—estuary; MAR—mouth area of the reservoir. The mixing zone of river and reservoir water masses is highlighted with a shading line. The scheme is based on that of V. Mikhailov et al. [34].
Diversity 15 00199 g001
Figure 2. Hierarchical clustering dendrograms of zooplankton samples for the studied water bodies, built using the cosine of the angle between the species abundance vectors as a similarity metric. The station numbers correspond to the numbering in Figure 1.
Diversity 15 00199 g002
Figure 3. Boxplots of the structural indicators of zooplankton communities in the studied mouth areas. C1, C2, C3, and C4 represent communities 1, 2, 3, and 4. Compact letter displays were added to indicate significant differences. A breakdown of the zooplankton communities and colour coding is shown in Figure 2.
Diversity 15 00199 g003
Figure 4. Location of the ecotone (community 2) in different types of mouth areas in the studied tributaries. The mixing zone of water masses of the river and the reservoir is highlighted with a shading line. The scheme is based on that of V.N. Mikhailov et al. [34]. Always—stations in which all (not all) rivers were part of the ecotone (community 2); not always—stations in which not all rivers were part of the ecotone (community 2). (I)—simple mouth area; (II)—estuarine mouth area; (III)—estuary–deltaic mouth areas. The names of the zones are shown in Figure 1.
Diversity 15 00199 g004
Figure 5. Boxplots of the structural indicators for zooplankton community 2 in the estuary–deltaic mouth areas (ED), estuarine mouth areas (Es), and simple mouth areas (Sm). Compact letter displays were added to indicate significant differences.
Diversity 15 00199 g005
Figure 6. Boxplots of the alien species’ shares in different zooplankton communities and different mouth-area types (for zooplankton community 2): estuary–deltaic mouth areas (ED), estuarine mouth areas (Es), and simple mouth areas (Sm). Compact letter displays were added to indicate significant differences. Colour coding is shown in Figure 2.
Diversity 15 00199 g006
Figure 7. Redundancy analysis (RDA) plot for zooplankton community 2. ED—estuary–deltaic mouth areas; Es—estuarine mouth areas; Sm—simple mouth areas. Dominant species: Bos. long.Bosmina longirostris; Dia. bra.Diaphanosoma brachyurum; Nauplii Cop.—Nauplii Copepoda; Daph. cuc.Daphnia cucullata; Dia. orgh.Diaphanosoma orghidani; Cop. Juv.—Copepodit Juv.; Asp. sieb.Asplanchna sieboldi; Con. unic.Conochilus unicornis; Euch. dil.Euchlanis dilatata; Chyd. sph.Chydorus sphaericus; Mo. micr.Moina micrura; Fil. long.Filinia longiseta.
Diversity 15 00199 g007
Table 1. Some morphometric parameters of the studied water bodies.
Water BodiesLength, kmBasin Area, km2Mouth Area/Reservoir Type
Uzola River1471920simple (Sm)
Sura River84167,500simple (Sm)
Bol’shoj Civil’ River1724690simple (Sm)
Mera River1522380estuarine (Es)
Troca River22217estuarine (Es)
Vetluga River88939,400estuarine (Es)
Shirmaksha River28205estuary–deltaic (ED)
Sviyaga River37516,700estuary–deltaic (ED)
Gorky Reservoir4401590lowland
Cheboksary Reservoir3412190lowland
Kuybyshev Reservoir5006450lowland
Table 2. Average (mean ± SD) density (ind./m3) of alien zooplankton species in the studied water bodies, categorized according to the identified zooplankton communities.
Alien SpeciesCommunity 1Community 2Community 3Community 4
Kellicottia bostoniensis (Rousselet, 1908)10.0 ± 7.010.0 ± 1.0
Keratella tropica (Apstein, 1907)50.010.0 ± 2.0
Acanthocyclops americanus (Marsh, 1893)1040.0 ± 1000.02230 ± 460.01380.0 ± 70.0230.0 ± 90.0
Thermocyclops taihokuensis (Harada, 1931)2910.0 ± 820.08560.0 ± 2230.04780.0 ± 390.020.0 ± 4.0
Thermocyclops vermifer (Lindberg, 1960)10.0 ± 2.01130.0 ± 300.010.020.0
Eurytemora caspica (Sukhikh & Alekseev, 2013)30.0 ± 20.0
Eurytemora velox (Lilljeborg, 1853)40.0 ± 10.00.05
Heterocope caspia (Sars G.O., 1897)10.070.0 ± 30.0
Table 3. Factors (mean ± SD) measured for zooplankton community 2.
FactorSmEsED
Chlorophyll-a, mg/L (Chl_a)11.48 ± 3.0012.73 ± 0.7110.37 ± 1.97
Dissolved oxygen, mg/L (DO)7.30 ± 0.6311.12 ± 1.009.25 ± 1.18
pH8.80 ± 0.128.22 ± 0.178.56 ± 0.02
Water temperature, °C (WT)24.75 ± 0.2925.72 ± 0.3524.65 ± 0.37
Electrical conductivity, μS/cm (EC)480.40 ± 90.01245.50 ± 16.32508.00 ± 181.85
Water transparency, m (SD)1.14 ± 0.131.08 ± 0.100.78 ± 0.09
Total phosphorus, µg/L (TP)0.23 ± 0.050.08 ± 0.0030.24 ± 0.05
Trophic state index (TSI)55.58 ± 4.6552.65 ± 0.5359.40 ± 2.79
Sm—simple mouth areas; Es—estuarine mouth areas; ED—estuary–deltaic mouth areas.
Table 4. Permutation test results for RDA models, constructed for each variable.
FactorR2Pseudo-FP
Water transparency (SD)9.77%7.800.001 *
Dissolved oxygen (DO)10.33%7.990.003 *
Trophic state index (TSI)5.08%1.360.024 *
Electrical conductivity (EC)21.07%8.910.001 *
Water temperature (WT)4.10%5.240.048 *
pH6.93%7.600.008 *
R2—the adjusted proportion of variability explaining each factor; pseudo-F—the test statistic of permutation test; P—probability of random influence of a factor; *—significant factors, p-value < 0.05. The table only lists factors that have a statistically significant effect.
Disclaimer/Publisher’s Note: The statements, opinions and data contained in all publications are solely those of the individual author(s) and contributor(s) and not of MDPI and/or the editor(s). MDPI and/or the editor(s) disclaim responsibility for any injury to people or property resulting from any ideas, methods, instructions or products referred to in the content.

