1. Introduction
How species coexist in the same geographic area has been a central question in ecology since the beginning of the science [
1,
2,
3]. The question of coexistence is centred on the concept of the ecological niche (one of the cornerstone concepts in ecology [
4]), i.e., the habitat occupied and resources used by the organism. Organisms that occur in the same place that use similar resources must overlap in their niche in some way. Under a classic deterministic view, competition for resources will drive these organisms to become less similar in their resource use, thus reducing the size of their niche and therefore promoting their coexistence by limiting their similarities [
2,
5] (i.e., niche packing). On the other hand, in species-rich systems, coexistence can also occur via ecological equivalence resulting in stochastic determination of species composition and abundance [
5,
6,
7]. Despite evidence that supports both of these hypotheses, coexistence theory remains divisive and inconclusive [
7].
Stable isotopes of carbon and nitrogen found in consumers are commonly used to characterize trophic niches [
8,
9,
10]. Surprisingly, this tool has seldom been applied to test coexistence theory. When applying the concepts of coexistence to trophic niches observed in species assemblages, we would predict that species should coexist via highly differentiated niches and niche packing, or be trophically equivalent and coexist via a lottery-type mechanism [
11,
12,
13]. However, there is no current quantifiable framework for how to assess whether trophic niches are equivalent or differentiated among species for trophic niches derived from stable isotope analysis. We developed methods for resampling stable isotope data to test whether co-occurring species exhibit trophic niches consistent with a deterministic niche packing model, or a stochastic lottery model.
Rockfish (genus
Sebastes) are a group of marine fishes that are primarily distributed in the northeast Pacific [
14]. They are often found in syntopic assemblages that exhibit high species richness with other congeners. Within these assemblages, rockfish are divided into sub-assemblages based on habitat use and are characterized as pelagic or demersally oriented species [
14]. Rockfish are also some of the longest lived vertebrates with one species having an individual with an estimated age of 205 years [
15]. Additionally, rockfish are fished commercially and recreationally and are a species of conservation concern [
16]. Despite their conservation concerns, rockfish are relatively poorly studied in general, especially in regard to their trophic relationships. The studies that have focused on the trophic relationships of rockfish have used stable isotopes or diet studies to characterize the trophic relationships of a few species [
17,
18,
19,
20,
21,
22,
23,
24], but none of these studies have included the trophic relationships among an entire assemblage. Studying rockfish in their assemblages also removes confounding effects from widely disparate phylogenetic groupings due to their congeneric relationships. Therefore, rockfish are an ideal group to understand mechanisms and niche patterns associated with coexistence.
Null models can provide an expected distribution when patterns result from stochastic processes. Null models generate patterns by randomizing or resampling ecological data and should be designed to represent what would be expected without the presence of specific ecological pressures [
25,
26]. Ecological null models hold certain variables constant while allowing others to behave stochastically [
25]. For our purposes, we resampled stable isotope data from a syntopic assemblage of rockfish to serve as a null model to test against models of community composition. Our null model assumes that all rockfish are equivalent in their trophic niches within their sub-assemblages (i.e., pelagic, or demersal) and are organized by stochastic processes. As trophic equivalents, there should be no differentiation in the forage among species so we expect that trophic niches would be general and should appear similar in their trophic niche parameters. As such, we expect that an assemblage organized through stochastic processes will have trophic niches with similar positions in isotopic space, large trophic niche size, and high levels of trophic niche overlap among species. We expect that if this rockfish assemblage follows a lottery model, the niche size and position of the actual community will be predicted by and thus be indistinguishable from the trophic niche metrics of the null model. If, on the other hand, an assemblage is organized through deterministic species interactions of competition and predation, then we would expect niche position to be differentiated among species, niche sizes to be relatively small compared to all of occupied isotope space of the assemblage, and overlap to be relatively low between species. As such the observed trophic niche metrics would be significantly different from those predicted by the null model.
Both external and internal sources of variation can influence position, size, and overlap of trophic niches. Variation among years may show that trophic niche metrics are temporally specific whereas ontogenetic changes in trophic niches may change the trophic niche metrics based on the size of the organisms that were sampled. Ontogenetic changes in the trophic niche have been addressed in other studies that use stable isotopes to study species assemblages [
27,
28,
29]. To test observed niche metrics against those predicted by our null models, we need to account for these other sources of variation in the trophic niche and understand their influence on niche metrics.
To determine if coexisting species of rockfish exhibit patterns in trophic niche characteristic most like a deterministic niche packing model, or a stochastic lottery model, we describe trophic niches and quantitatively test for differences in patterns of position, size, and overlap of trophic niches among ten rockfish species. We characterized trophic niches of rockfish using δ13C and δ15N stable isotope analysis. We applied resampling techniques to the stable isotope data of the rockfish assemblage and used this as a null model that assumed trophic equivalence to test if deterministic or stochastic processes are the mechanisms that are organizing this assemblage. In addition, we evaluated variation among years and across sizes to determine how these sources of variation affected our trophic niche metrics. We also illustrate our null model of trophic niche characteristics as a new method for evaluating community assembly rules in species-rich systems.
2. Materials and Methods
Our study area consisted of the marine environment within 15 km of 56°59′9.82″ N 134°9′3.35″ W. We collected fish samples (
n = 712) during June-August from 2013–2018 (
Table 1). We used hook and line sampling techniques to collect fish. All fish were caught at a depth no greater than 100 m. We collected ten species of rockfish:
Sebastes brevispinis,
S. caurinus,
S. ciliatus,
S. flavidus,
S, maliger,
S. melanops,
S. nebulosus,
S. nigrocinctus,
S. ruberrimus, and
S. variabilis. We only used samples for
S. ciliatus and
S. variabilis from 2016–2018 because we did not differentiate between species before 2016.
We identified all fish to species and measured for total length to the nearest mm. Approximately 1 cm3 of tissue was sampled from the dorsal epaxial muscle (samples were comprised of muscle only). We froze all samples at −20 °C in the field and we transported them frozen to Brigham Young University where we stored them at −80 °C before we used them for stable isotope analysis. We prepared samples for analysis by oven-drying them at 60 °C for at least 48 h. Once desiccated, we ground samples to a homogeneous powder using a mortar and pestle then encapsulated them in a 4 × 6 mm tin capsule. Samples weighed between 0.6–1.2 mg. We shipped the samples to the Colorado Plateau Stable Isotope Laboratory at Northern Arizona University (Flagstaff, AZ, USA) for stable isotope analysis. Samples were analysed using a Delta V Advantage Mass Spectrometer (Thermo Electron Corporation, Bremen, Germany) and configured using a CONFLO III (Thermo Fisher Scientific, Waltham, MA, USA) and a Carlo Erba NC2100 Elemental Analyzer (Thermo Fisher Scientific, Waltham, MA, USA).
Carbon (δ
13C) and nitrogen (δ
15N) were expressed in permil (‰) using delta notation [
30]. δ
13C and δ
15N were calculated using the equation:
where
R represents the ratio of
13C/
12C or
15N/
14N and their associated international standard (carbon = Vienna Pee Dee Belemnite, nitrogen = atmospheric nitrogen; [
31]).
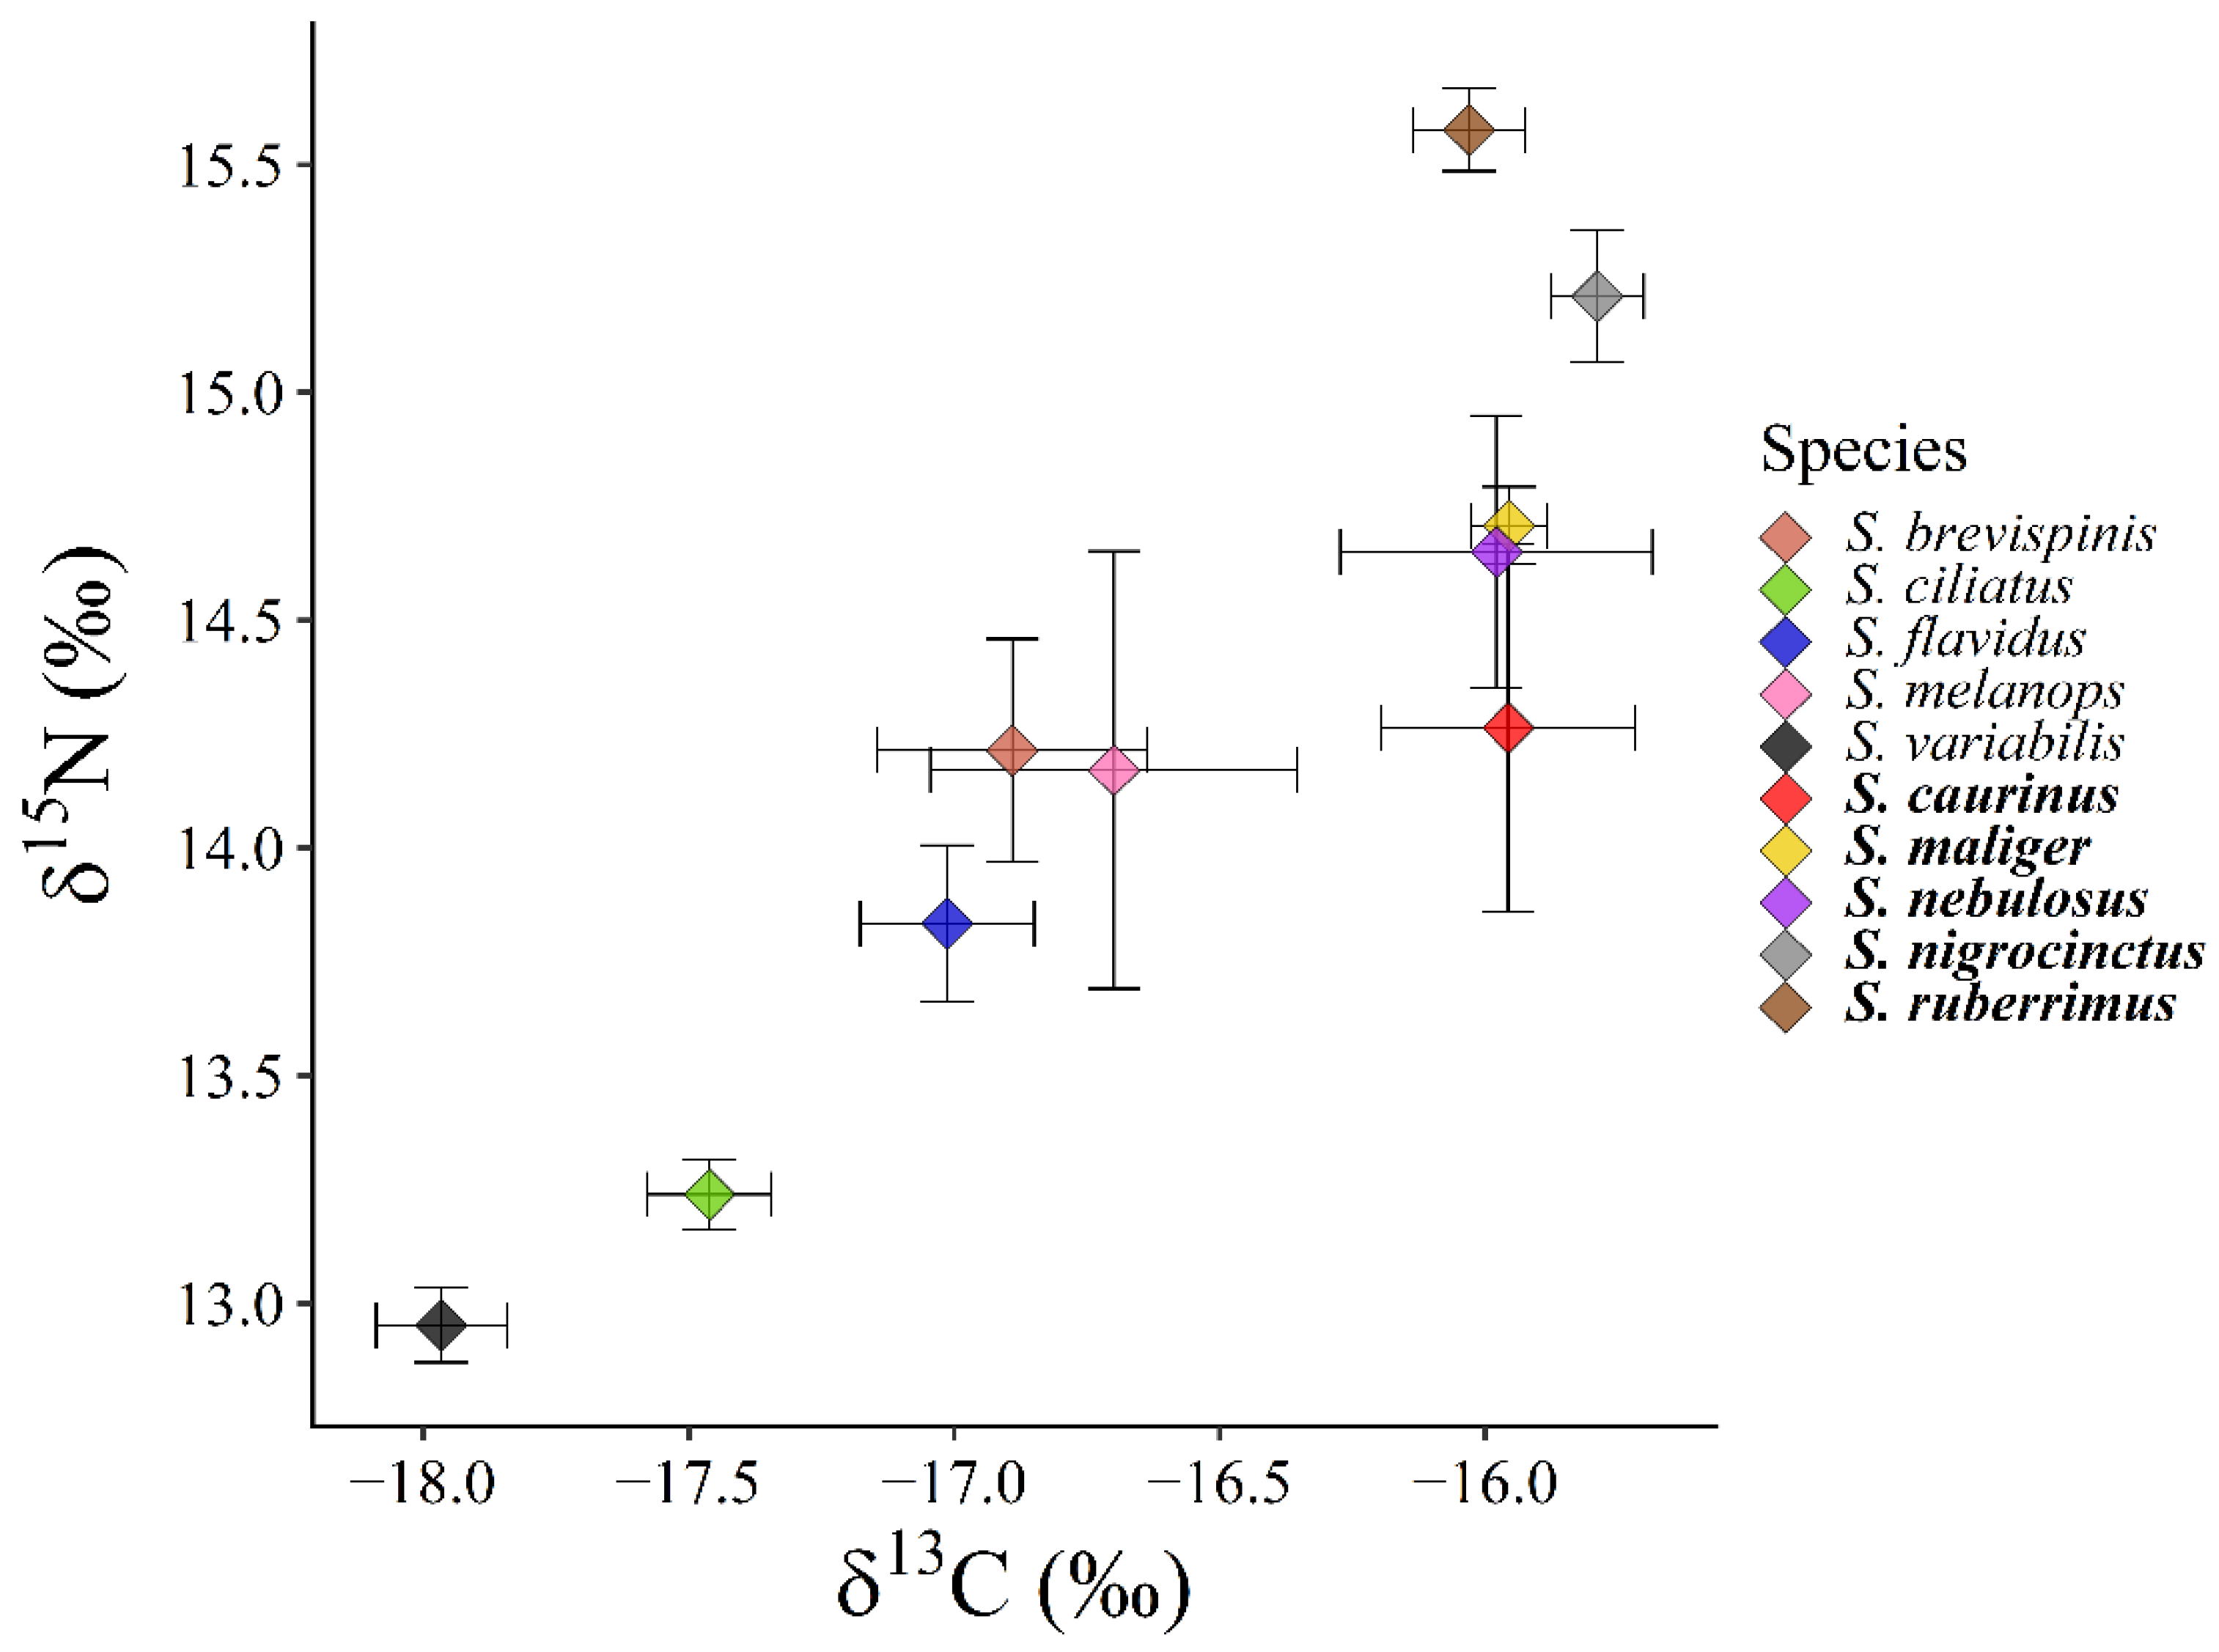
We tested for differences in mean δ13C and δ15N ratios among pelagic and demersal rockfish to determine differences in trophic niche position among rockfish. We used two analysis of variance (ANOVA) tests for each sub assemblage to test for differences in δ13C and δ15N trophic niche axes. We structured these two ANOVA tests with species as the explanatory variable and δ13C or δ15N as dependent variables. We verified the assumptions of the parametric test by inspection of a residual plot to check for normality and constant variance. We compared means with 95% confidence intervals in a pairwise manner as a post hoc test to determine which species’ mean trophic niche positions differed within pelagic and demersal rockfish species. We determined that mean position differed if the mean δ13C or δ15N value did not overlap with the 95% confidence intervals of another species.
We used the package Stable Isotope Bayesian Ellipse in R (SIBER) to model niche size and overlap for each rockfish species [
32,
33]. We generated standard ellipses which are the bivariate equivalent of univariate standard deviations [
9]. We used these standard ellipses as a representation of each species’ trophic niche size. For comparison in niche size, we calculated standard ellipse area (SEA) which was expressed in permil squared (‰
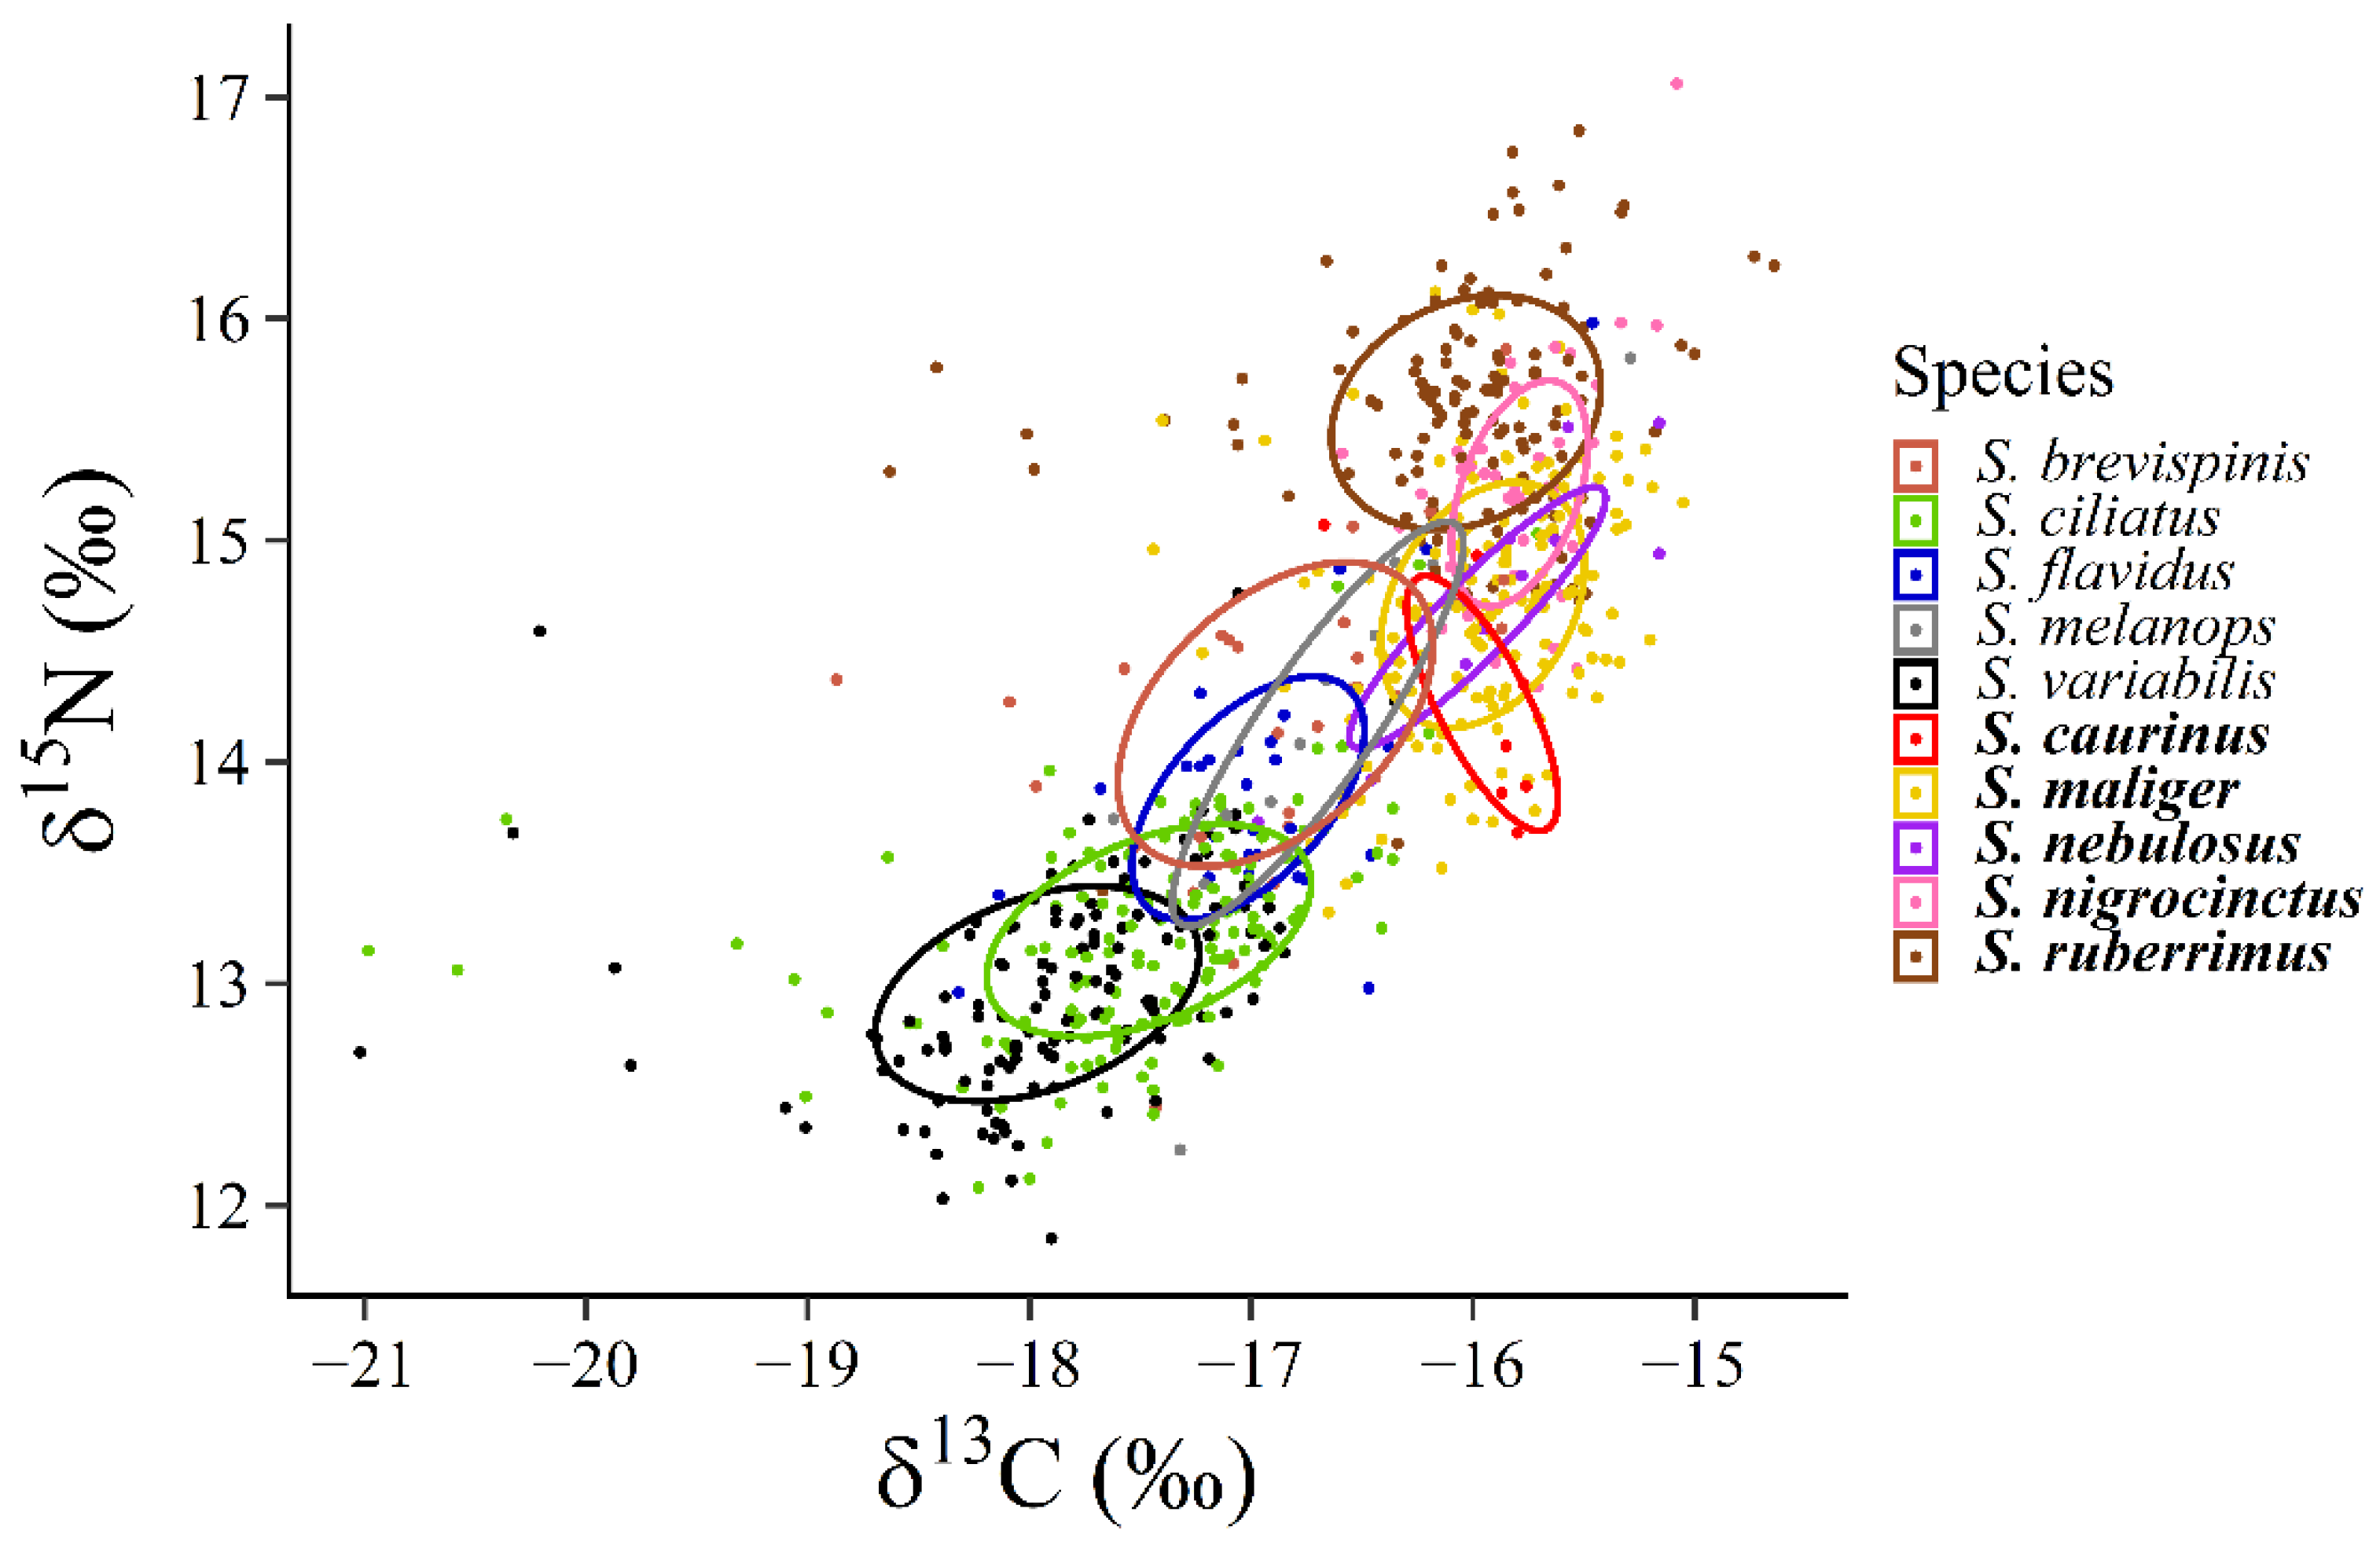
2) for each rockfish species. We used the standard ellipse area to perform a pairwise comparison among rockfish species to quantify trophic niche overlap. We did this by calculating what percentage of the standard ellipse area of any given species was overlapping with any other rockfish species. All pairwise percent overlap estimates were rounded to the nearest whole percent. We took the sum of all these pairwise percent overlap estimates to be used as a metric that represents the total trophic niche overlap for each rockfish species. For example, a species with no trophic niche overlap would have a cumulative percent overlap of 0% while a complete niche overlap of four species on a fifth species would result in a cumulative percent overlap of 400%.
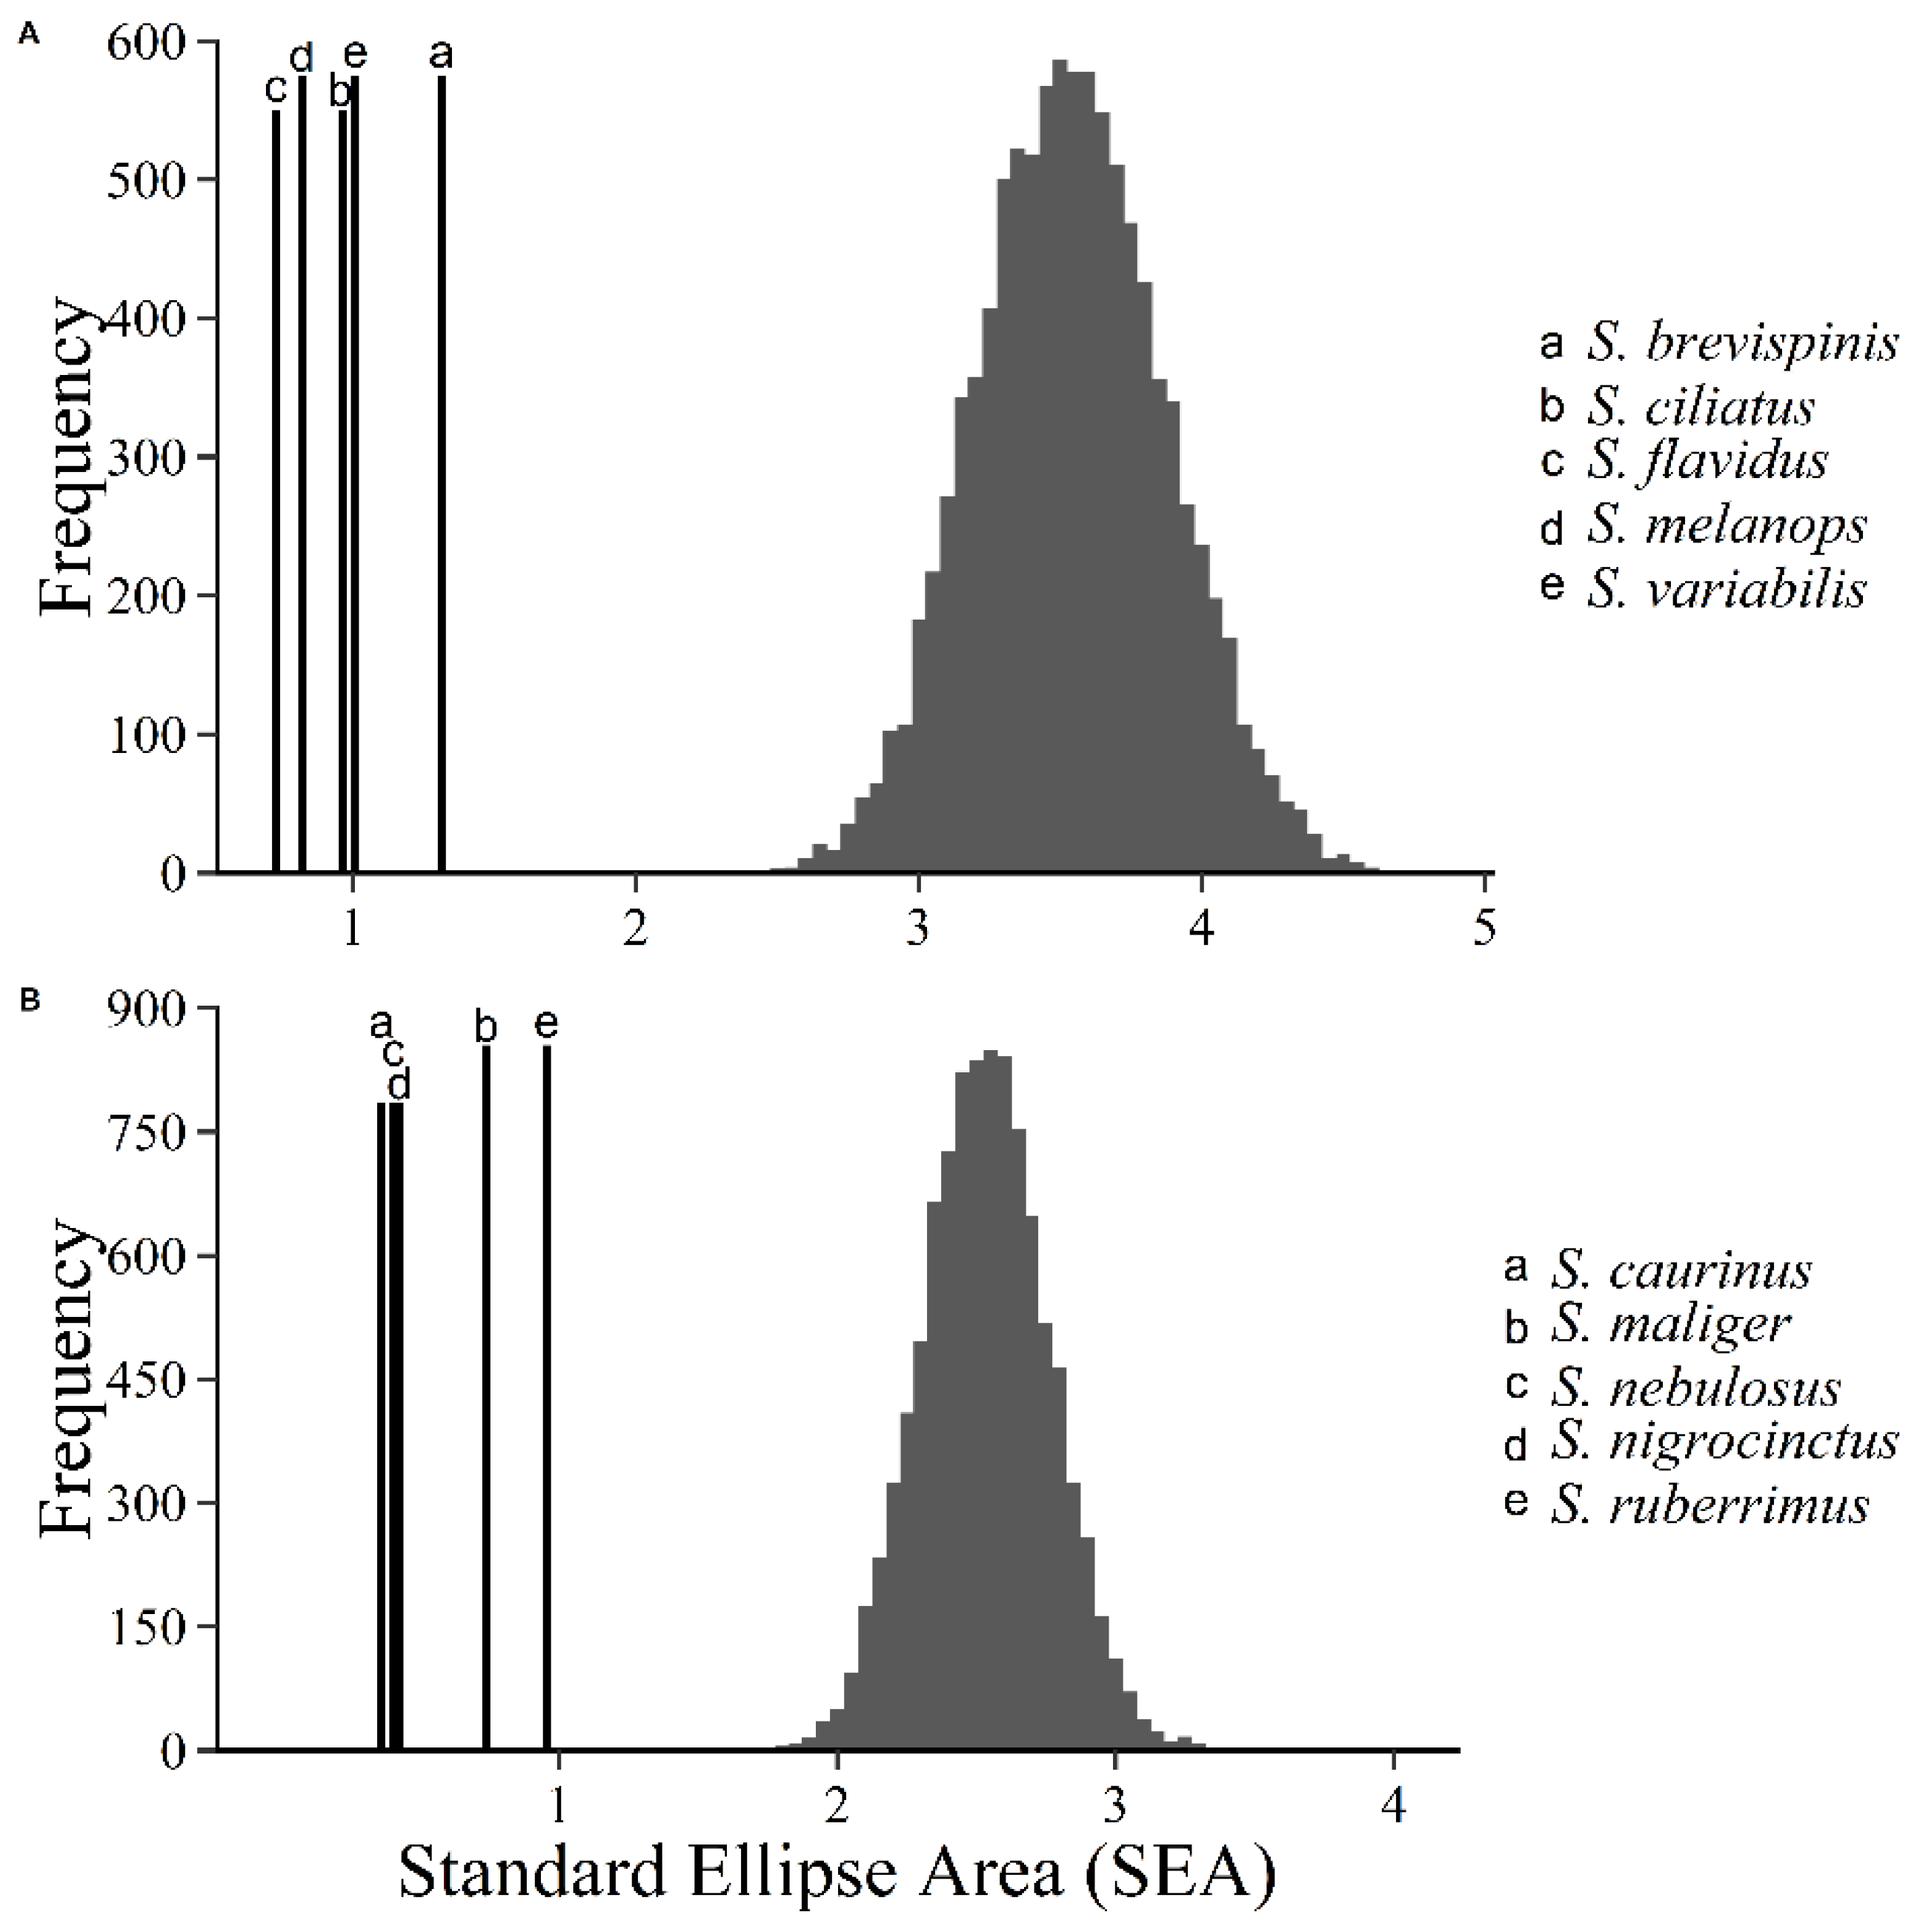
There is no way to quantitatively compare standard ellipse area because there is no error associated with the ellipse. To overcome this, we calculated Bayesian standard ellipses (SEA
B) using a Markov-chain Monte Carlo simulation at 10,000 iterations using normal priors [
9]. Bayesian standard ellipses also contains the same properties of small sample size corrected standard ellipses for species with small samples sizes [
9]. We compared these statistically by calculating the probability that the SEA
B for a given rockfish was greater than the SEA
B of another given rockfish. We used the equation:
where the numerator is the sum of all instances where the SEA
B of species
i is greater than the SEA
B of species
j and the denominator is the total number of iterations ran in the Bayesian analysis. This returns a value we called
p which is the probability that the Bayesian standard ellipse area of species
i is greater than species
j. We used these pairwise probabilities to determine if the trophic niche of a given rockfish was larger than that of any other given rockfish at a level of α = 0.05. We then provided a ranked list, with ties, of all species that characterized the position of each species’ trophic niche size from largest to smallest.
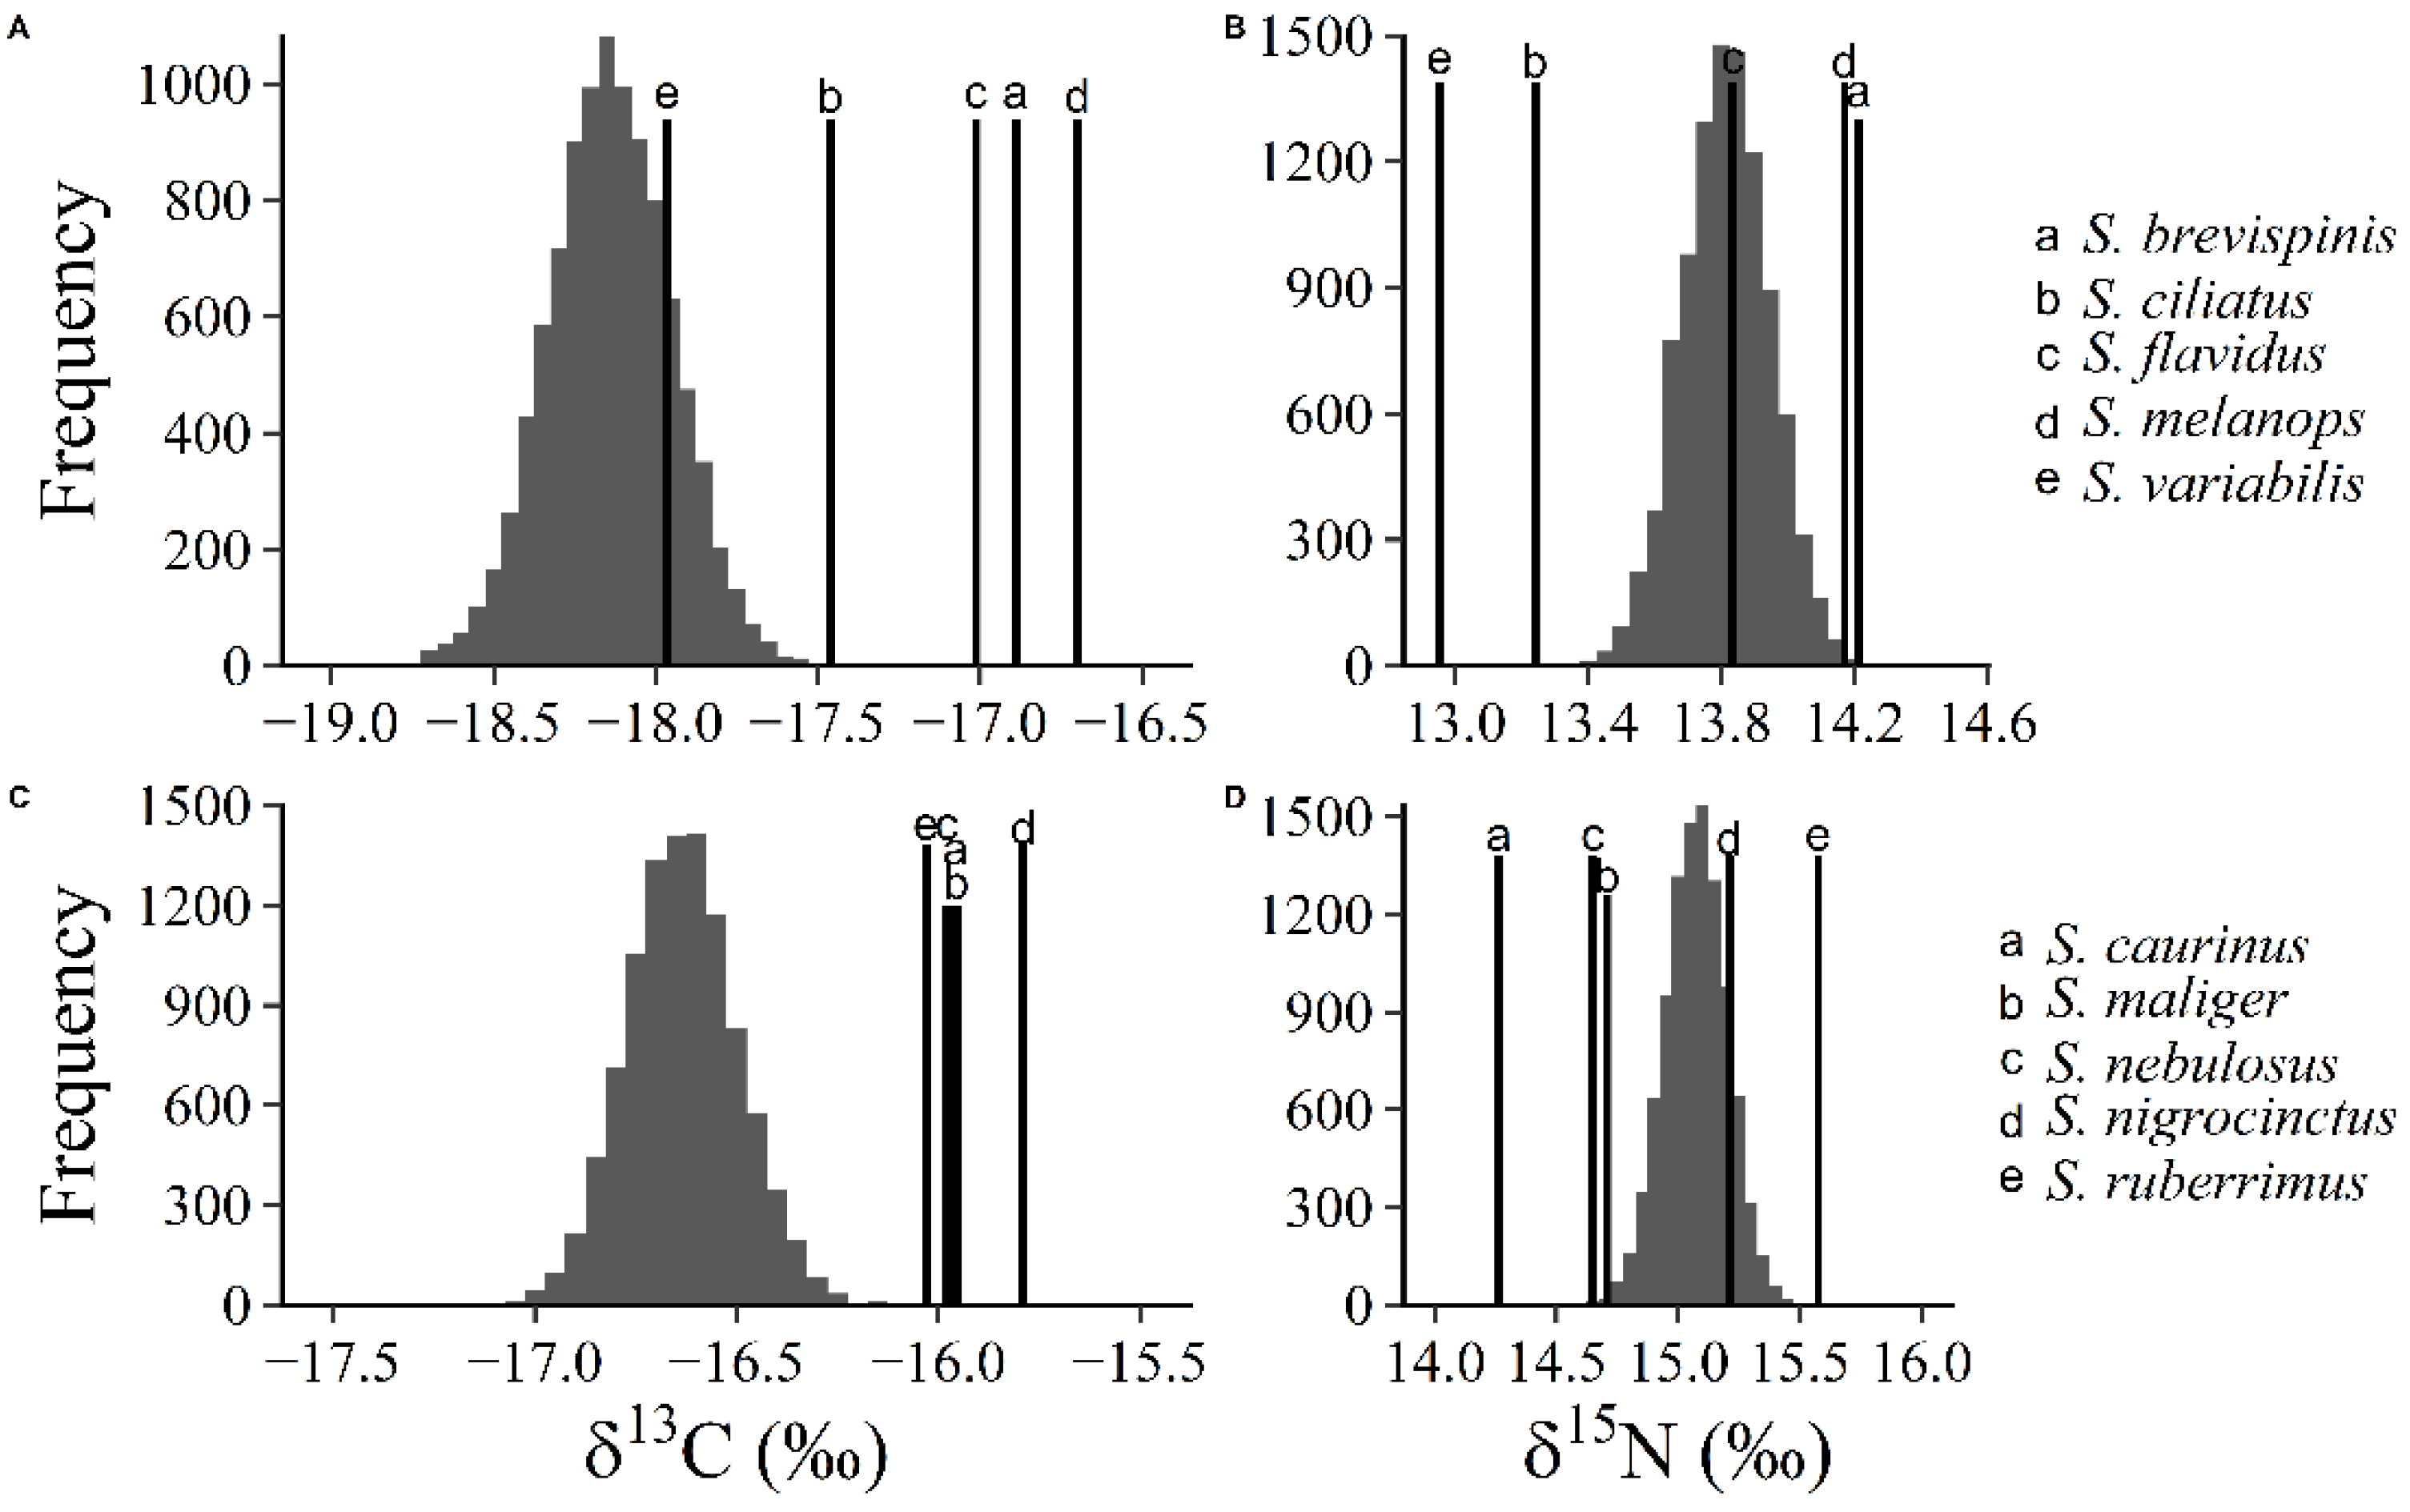
We applied resampling techniques to the stable isotope data of pelagic and demersal rockfish as a null model that predicts what we would expect if the rockfish assemblage was organized based on a stochastic lottery model. We used the convex hull of the stable isotope distribution, which is a polygon defined by the most extreme isotopic observations of each of the pelagic and demersal rockfish sub-assemblages. The convex hull of each sub-assemblage then represented the resource spectrum available to each rockfish species within each sub-assemblage. We took 10,000 random bivariate samples with replacement of n = 50 from within the convex hull for pelagic rockfish or demersal rockfish. We calculated the standard trophic niche metrics (i.e., mean trophic niche position, trophic niche size, and trophic niche overlap) from these randomized data, which we used as our null model. We compared the observed niche metrics from the rockfish assemblage to the null model to test if the rockfish assemblage is organized stochastically or deterministically.
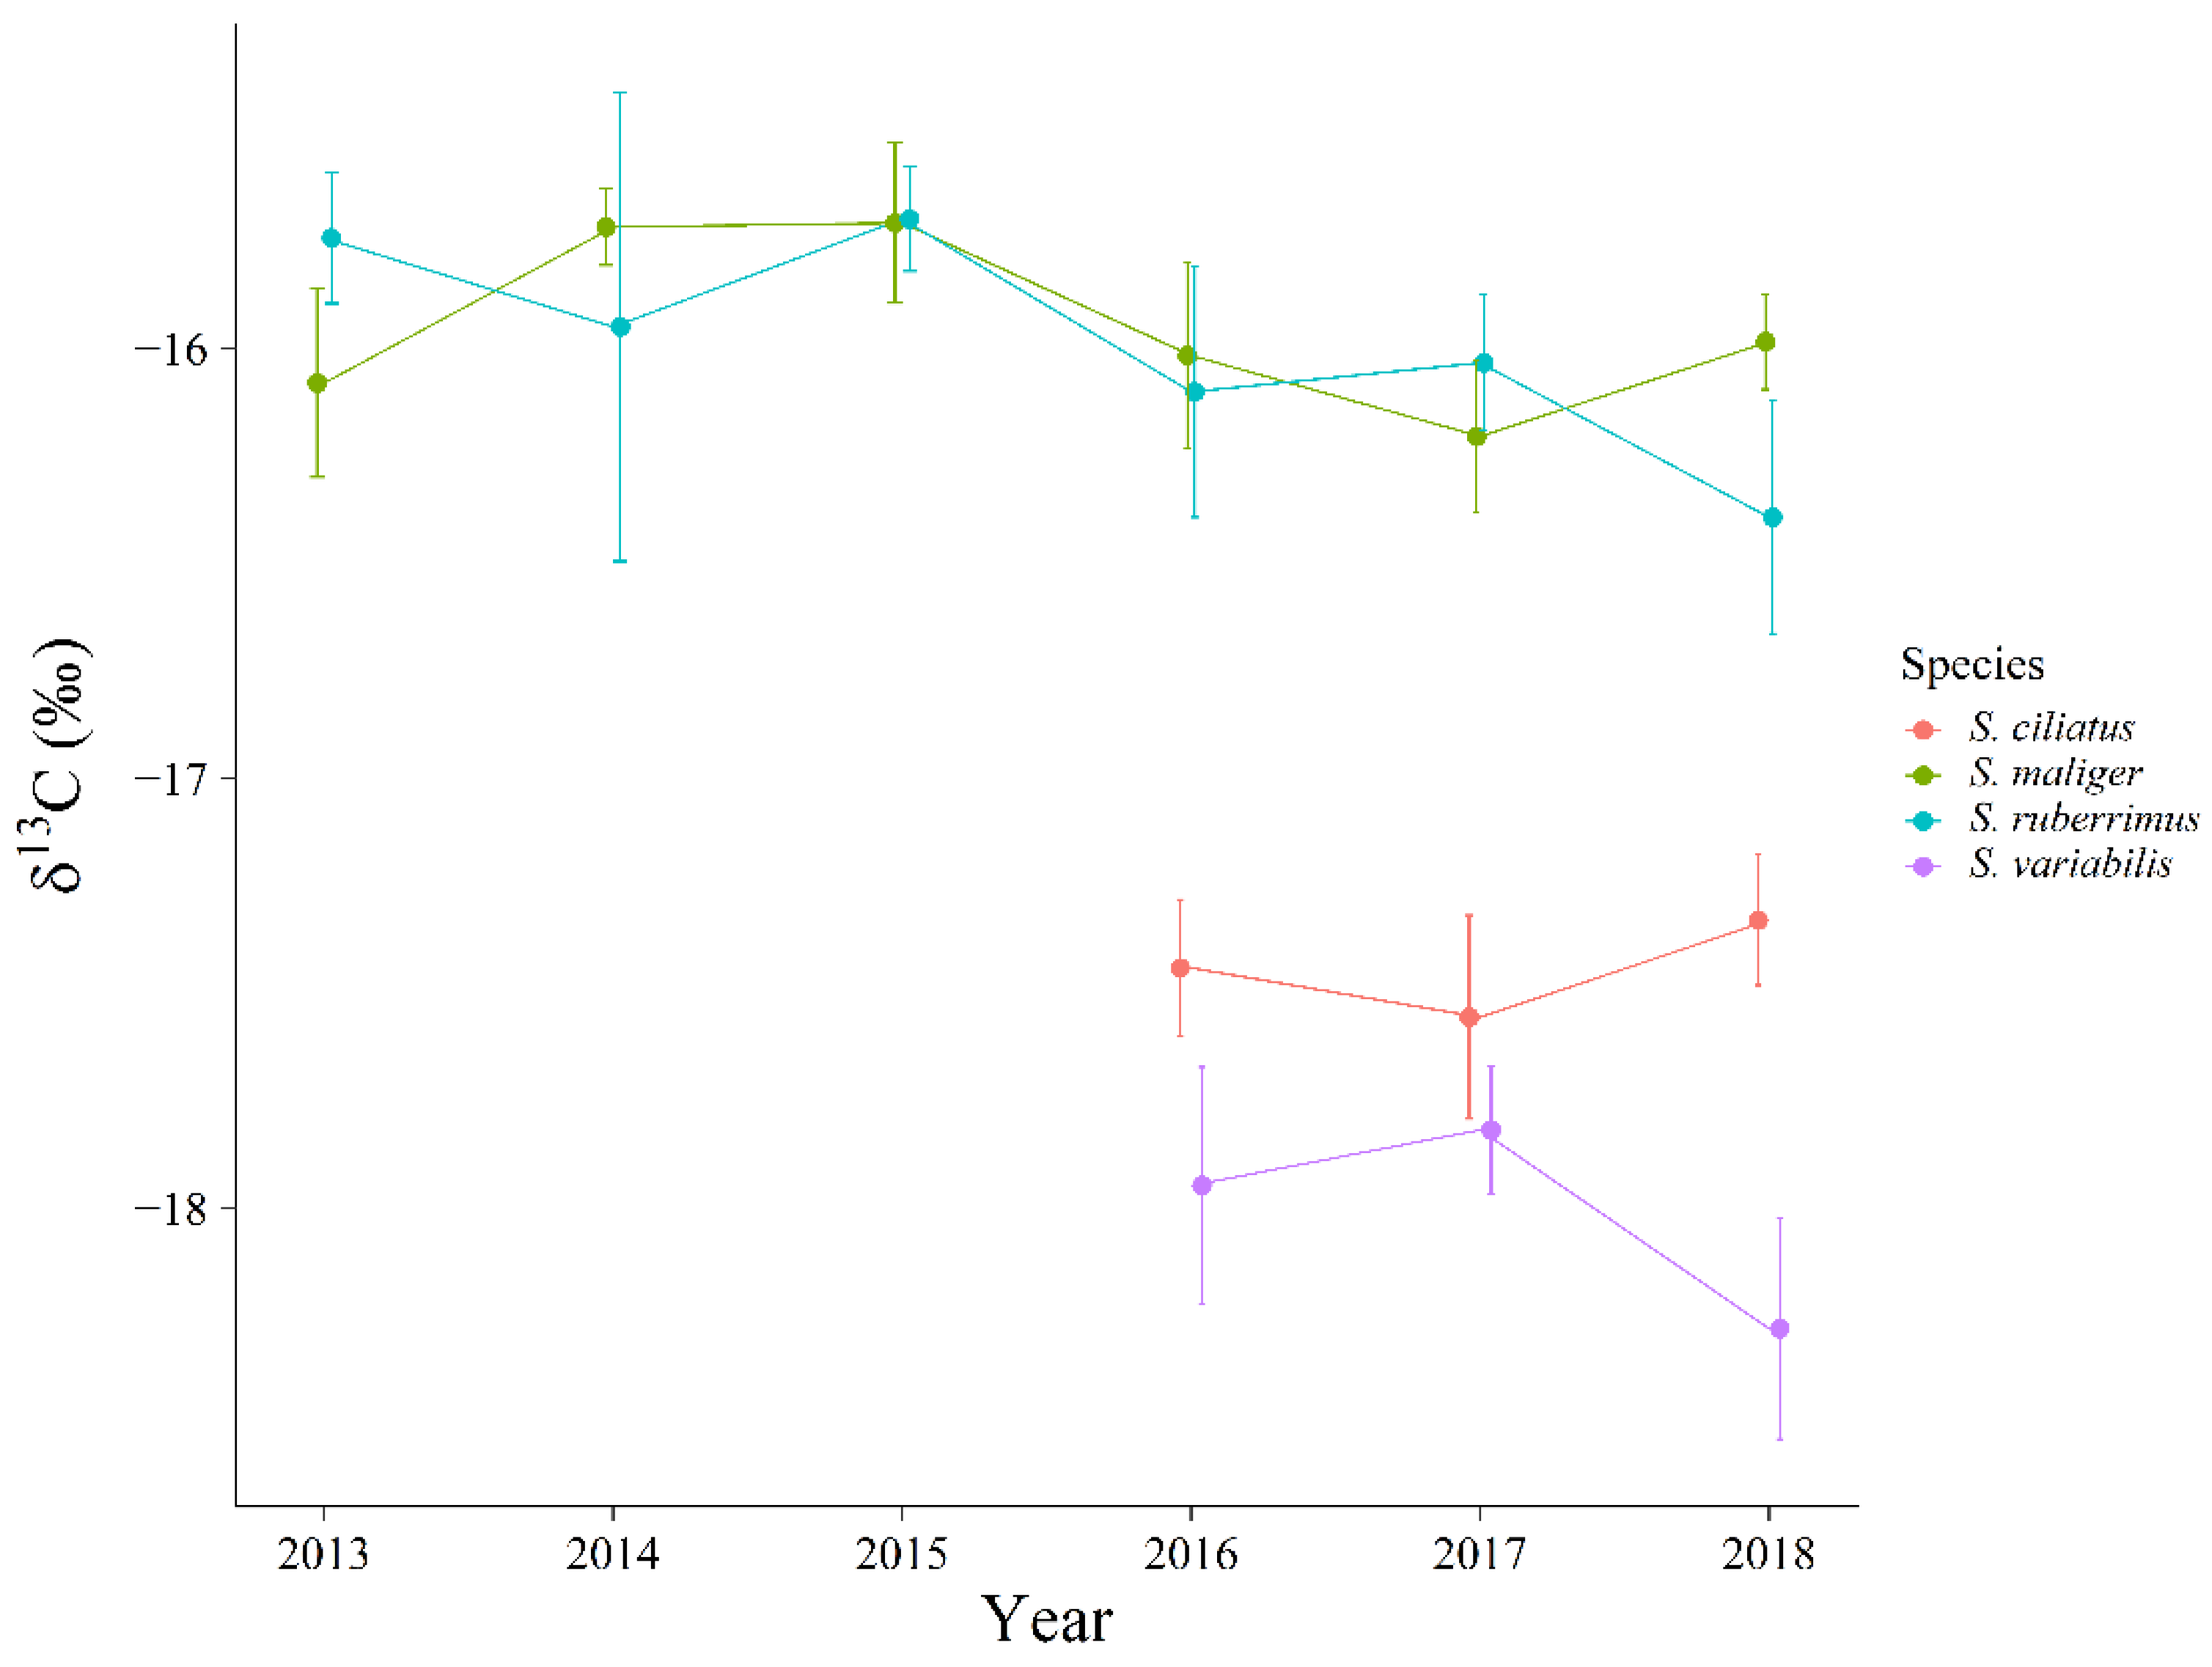
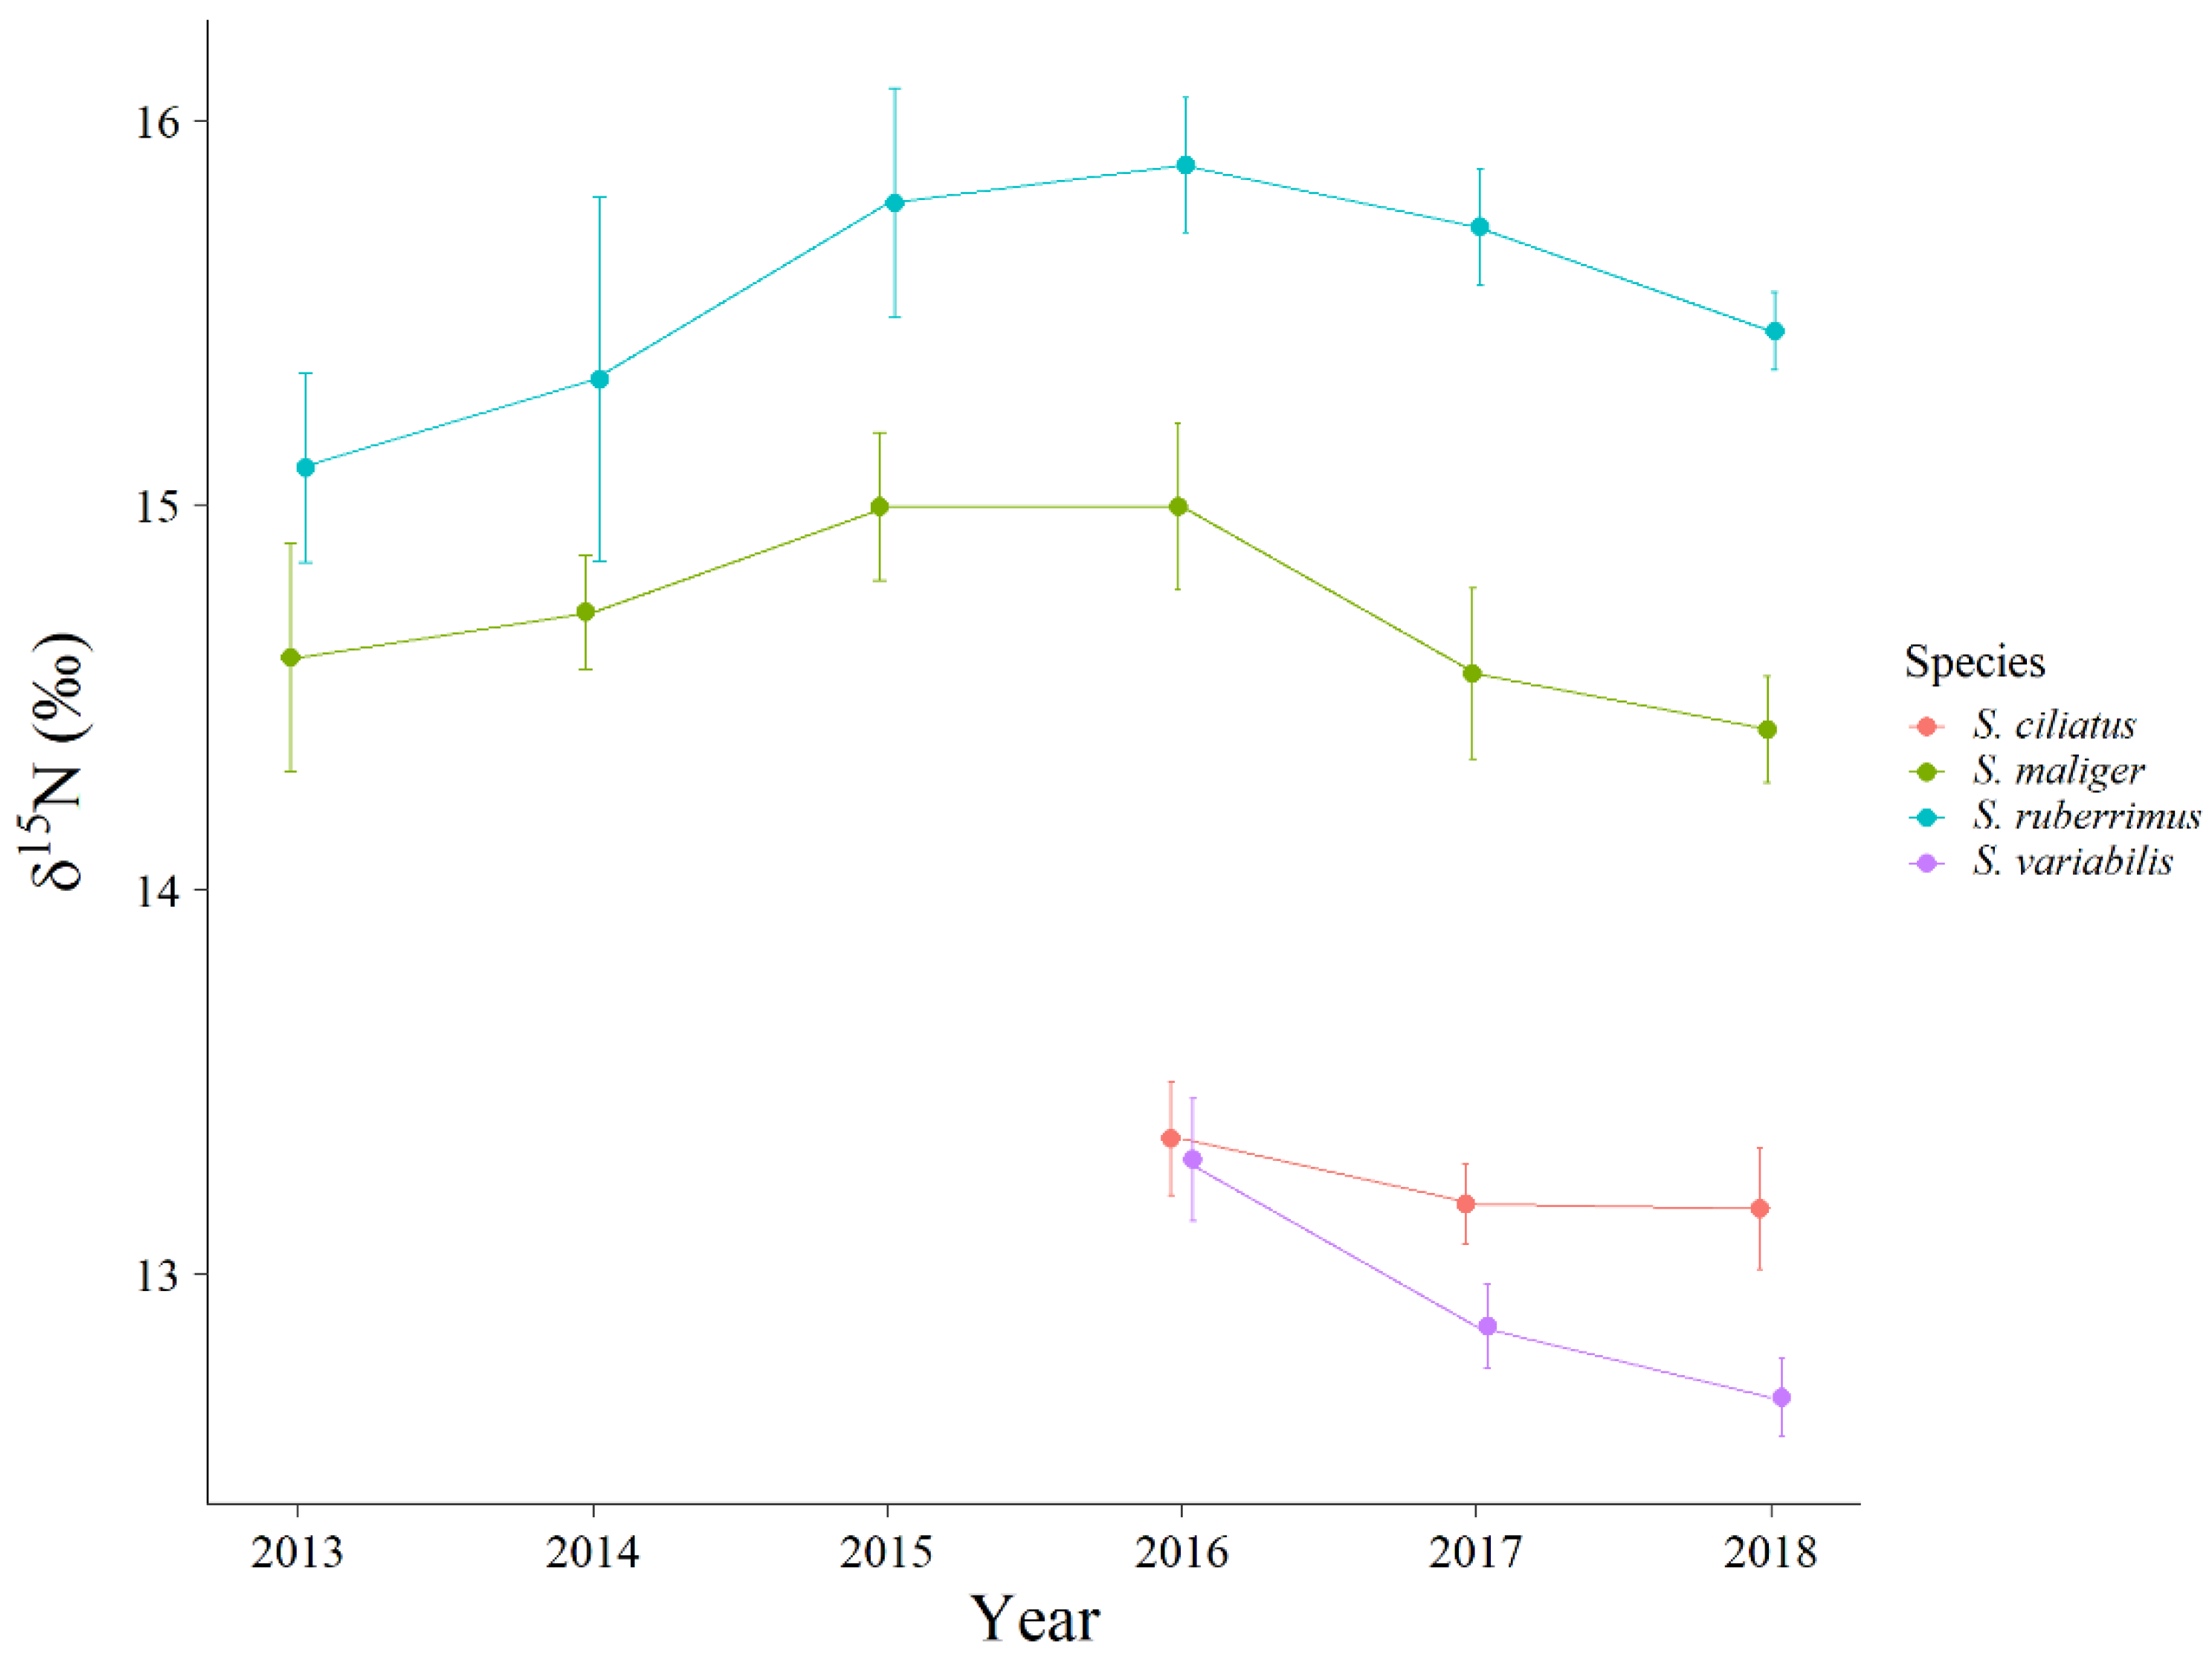
We also tested for interannual differences in stable isotope ratios across the six years of our study. We used analysis of variance (ANOVA) to determine if the mean δ
13C or δ
15N ratios differed in at least one of the years of our study. We used isotopic values from
S. ciliatus,
S. maliger,
S. ruberrimus, and
S. variabilis because we had large sample sizes across multiple years in the study (
Table 1). We performed two ANOVA tests for each of these four species of rockfish. The dependent variable was either δ
13C or δ
15N measured in permil and the explanatory variable was year. We verified the assumptions of the parametric test by inspection of a residual plot to check for normality and constant variance.
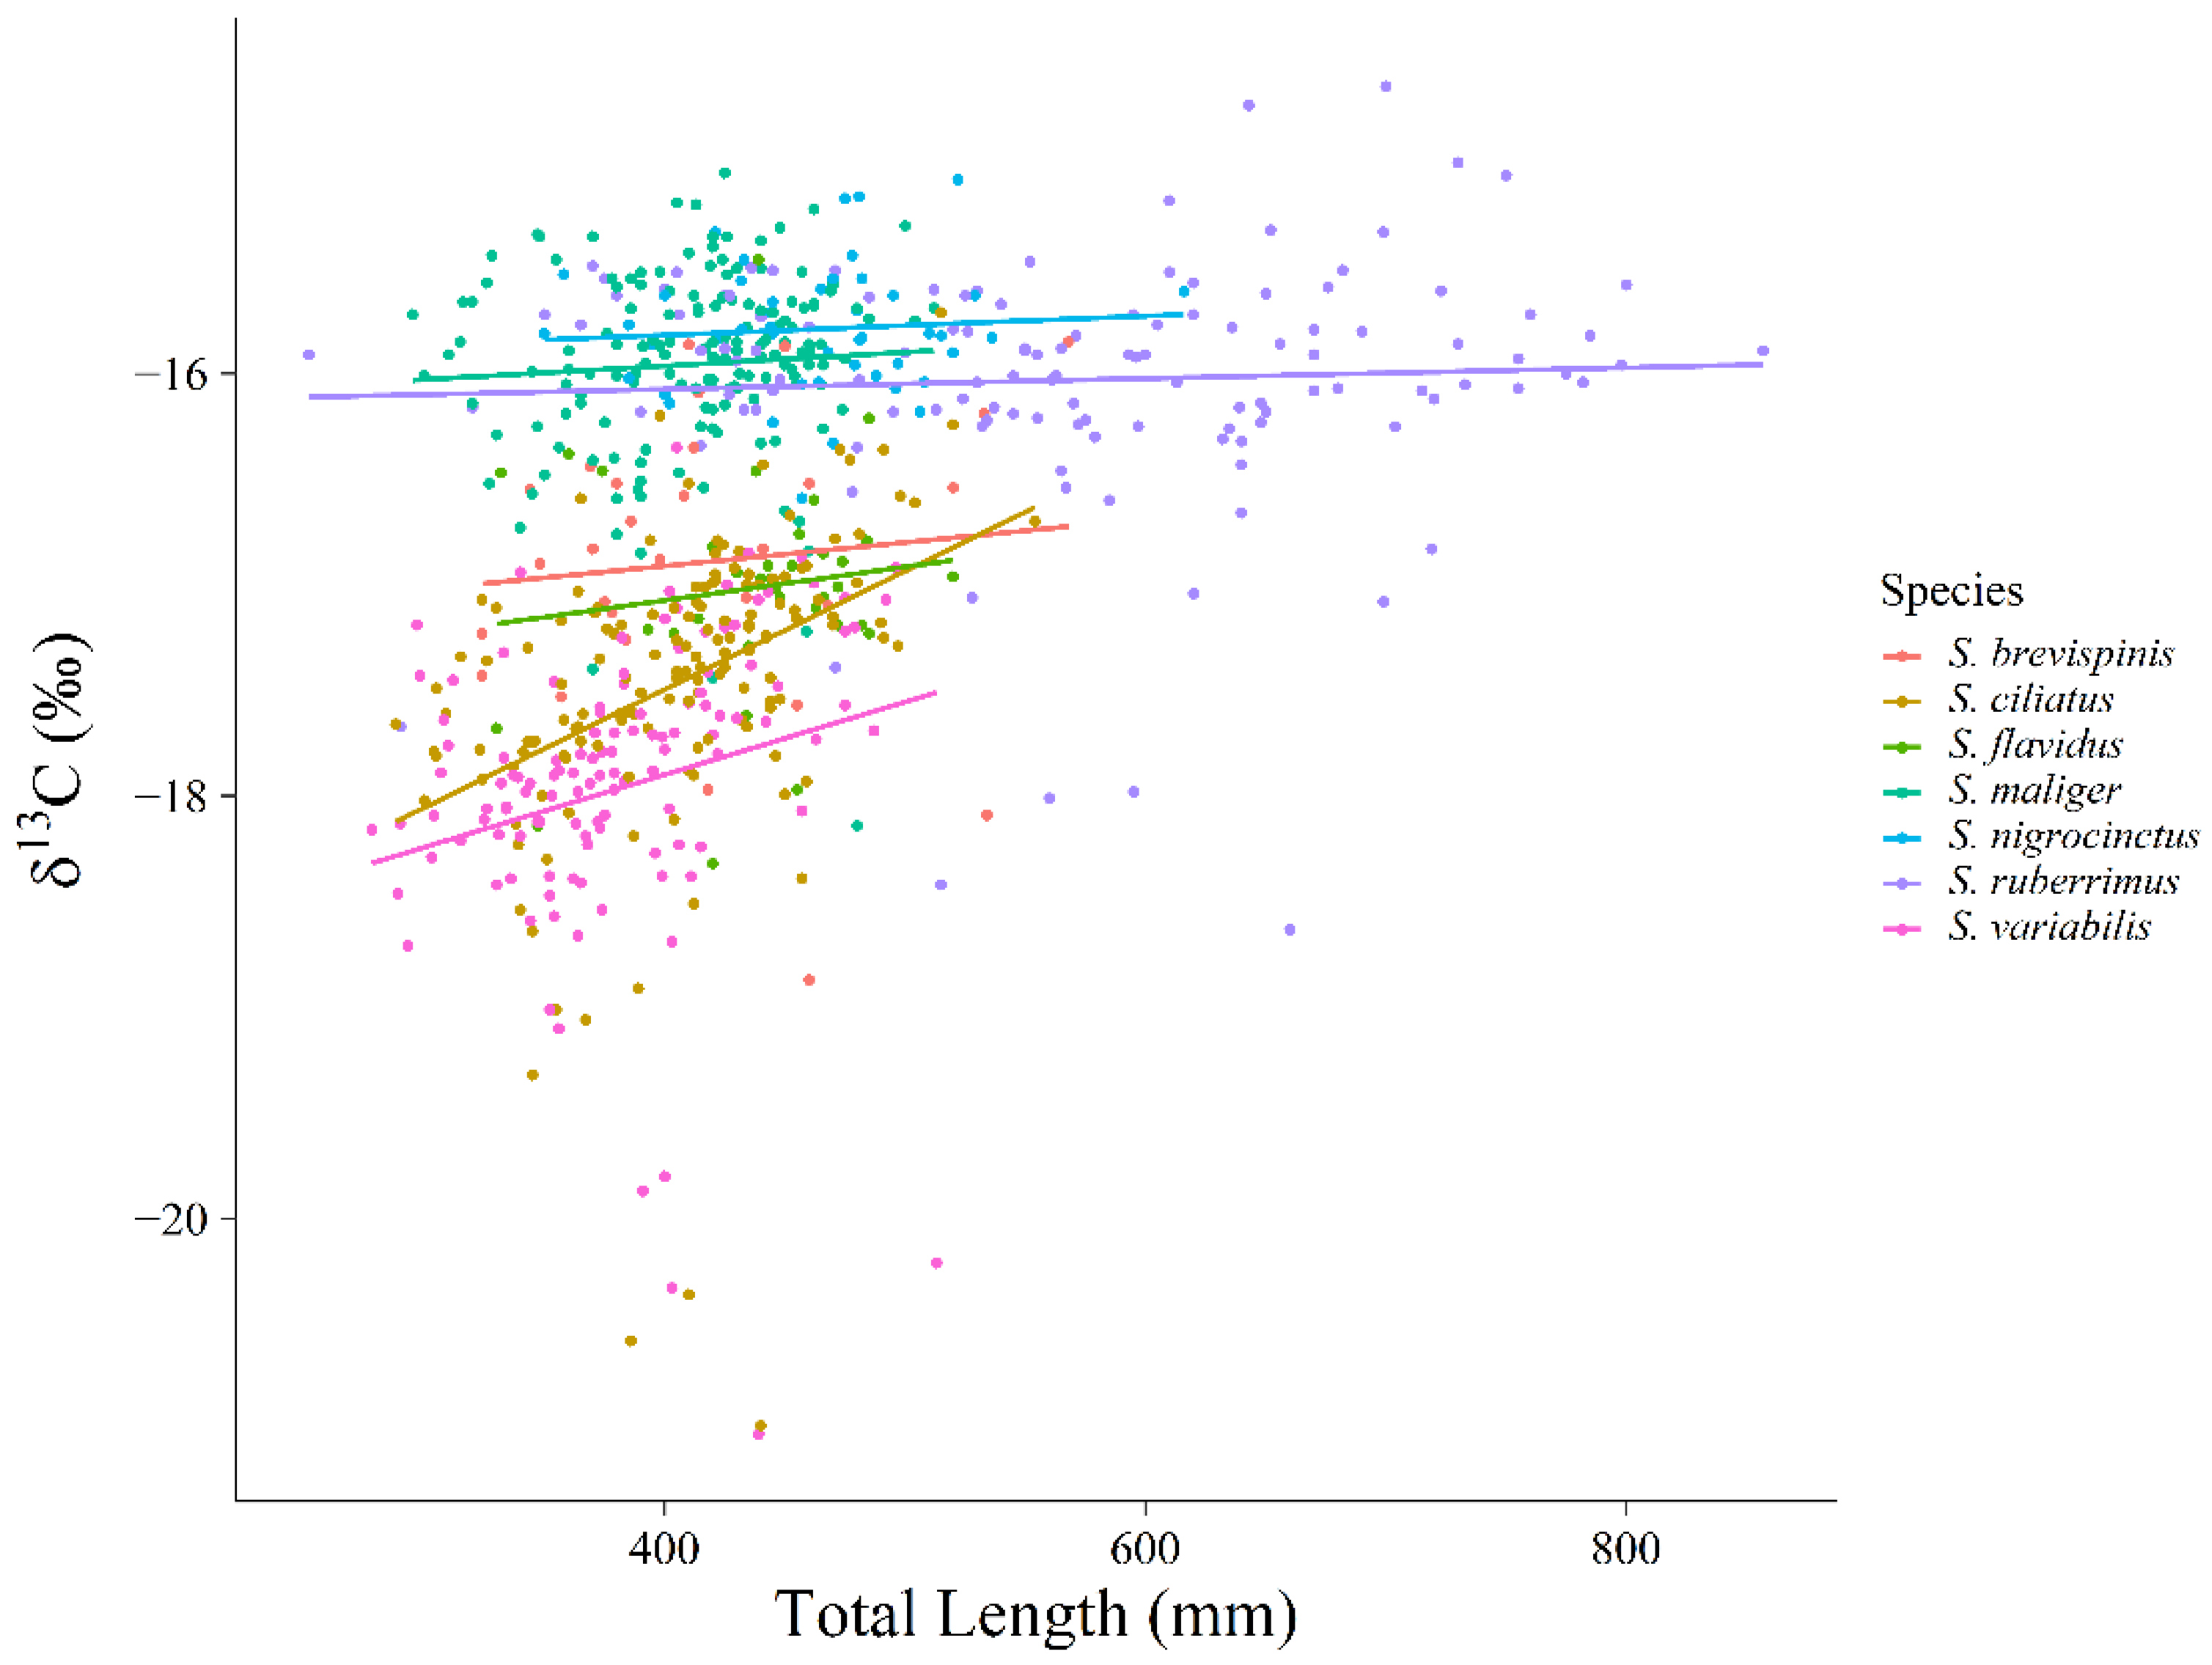
We quantified ontogenetic shifts in isotope ratios by testing for changes in δ
13C and δ
15N by total length among seven species of rockfish. We used simple linear regression models for each rockfish species to determine if there was an ontogenetic shift in δ
13C or δ
15N. Species were determined to exhibit ontogenetic shifts if their regression had a non-zero slope. We compared slopes and 95% confidence intervals in a pairwise manner to determine which species’ ontogenetic changes in δ
13C or δ
15N differed from each other. We had sufficient samples sizes to test for ontogenetic relationships in seven rockfish species:
S. brevispinis,
S. ciliatus,
S. flavidus,
S. maliger,
S. nigrocinctus,
S. ruberrimus, and
S. variabilis (
Table 1). We verified the assumptions of the parametric test by inspection of a residual plot to check for normality and constant variance.
4. Discussion
Questions about the distribution and co-occurrence of species and resulting community composition have been at the centre of ecological study for decades [
1,
2,
5,
34]. Development of the ideas of competition, limiting similarity, and niche differentiation have led to the concept of niche packing based on resource partitioning resulting in a deterministic model of community composition [
2,
3]. We use the term deterministic to mean that if the community were experimentally allowed to assemble many times with the same beginning species, the resulting community would converge on about the same result because persistence in the community is determined by species traits and niche parameters. The basic argument being that co-occurring species will be adapted to perform best in a certain part of the available niche space. The concepts of diffuse competition, apparent competition, mixed competition/predation interactions, and size-structured interactions, all provide elaborations on the potential for different interactions to shape community composition, but the basic deterministic model is the same—an assemblage should consist of a certain number of co-occurring species that each occupy a somewhat differentiated niche allowing them to persist in the community in the face of competition from other species in the community [
5].
Beginning in the 1970′s, an alternative model of community composition was developed, the lottery or neutral models of species coexistence. These models were usually invoked to explain species-rich systems where resource partitioning seemed to be insufficient to account for the large number of co-occurring species [
6,
11,
12,
13]. Lottery models assume that interacting species are ecologically equivalent in their ability to use resources, and that coexistence is facilitated by demographic processes of recruitment to newly available niche space such that stochastic processes determine patterns of co-occurrence rather than resource partitioning and deterministic competition [
5,
35]. Although these two models are often considered discrete and exclusive possibilities to explain community composition, it is acknowledged that they may represent end-points on a continuum [
36,
37,
38]. In addition, the scale of studies that address coexistence and community composition seldom incorporate many potentially interacting species with corresponding measures of niche space. Thus, classifying entire communities, or even subsets of the community such as assemblages or guilds, as conforming to deterministic resource partitioning models, or stochastic lottery dynamics models, is difficult and oversimplifies the system.
An alternative to classifying communities as following either deterministic or stochastic models is to focus on characteristics of the niche for a group of co-occurring species where ecological interactions should be strong, i.e., assemblages or guilds [
39]. Although niche characteristics arising from either deterministic or stochastic models of coexistence have received little attention, mechanisms, and assumptions of these two models should produce niches with substantially different characteristics. Niches can be characterized by their position in niche space (isotopic space in our example), their size (i.e., how much area of suitable, available niche space they occupy), and overlap of niche space with co-occurring species. We predicted that niches arising from a deterministic resource partitioning model (1) would occupy unique positions in niche space, (2) would be relatively small because of niche packing, and (3) would exhibit relatively little overlap among species. In contrast, niches arising from a stochastic lottery dynamics model (1) would occupy similar positions in niche space, (2) would be relatively large compared to available niche space, and (3) would exhibit a large percentage overlap with other co-occurring species. Based on these niche characteristics we found some support for both models in our characterization of trophic niches of ten co-occurring and similar (morphologically and ecologically) species of Pacific rockfishes from a syntopic site in southeast Alaska, USA.
In every trophic niche metric we measured, this rockfish assemblage appears to follow a deterministic resource partitioning model of species coexistence. There were significant differences in the mean trophic niche position among demersal rockfish in the δ
15N axis and in both the δ
15N and δ
13C axes for pelagic rockfish (
Figure 1). The mean position was different than the null model for both δ
13C and δ
15N (
Figure 2) in both sub-assemblages we sampled. There were differences in niche size among rockfish species (
Table 2), but overall niche sizes were substantially smaller than those predicted by the null model for both pelagic and demersal rockfish groups (
Figure 4). Finally, there was relatively little niche overlap among rockfish species and no niche overlaps exceeded a two-fold overlap with all other rockfish species (
Table 3). The null model predicted that trophic niche overlap should on average be about 350%, and always exceed about 250%. Thus, at this scale of investigation (i.e., among ten species), all niche characteristics we measured suggest that this assemblage is organized by resource partitioning processes resulting in niche packing characteristic of the deterministic model of community composition. Given the relatively large number of similar coexisting species in this assemblage, and the small total amount of niche space occupied by this assemblage (i.e., about one trophic level on the δ
15N axis, 3‰, and about 3‰ on the δ
13C axis), we found it surprising that each species occupied a relatively distinct part of trophic niche space.
Extrinsic sources of variation in trophic niche, such as year-to-year variation and intrinsic sources of variation such as size-varying or ontogenetic changes in diet could increase the size and overlap of observed niches. If extrinsic and intrinsic sources of variation are large, we might erroneously conclude that niches are relatively large and exhibit high overlap and thus conform more closely to a stochastic model of species coexistence. However, even though we identified both year-to-year variation (
Figure 6 and
Figure 7), and size-based variation in our data (
Figure 8 and
Figure 9), neither of those effects were sufficient to create large niches that would conform to those we observed in the null model (i.e., stochastic model). We found that δ
13C varied by less than 0.5‰ and δ
15N varied by less than 1‰ among years, and similarly, the largest ontogenetic change in δ
15N was by
S. brevispinis which changed by approximately 1.5‰. This ontogenetic change in
S. brevispinis probably contributed to the relatively large niche size observed for this species, but we note that resulting cumulative overlap for this species was still relatively low at 121% compared to that expected from a lottery-type model. Additionally, the size range of the fish that are sampled directly affects the ontogenetic shift that is observed. We sampled 80% of the size range of
S. brevispinis, 55% of the size range of
S. maliger, and 87% of the size range of
S. ruberrimus [
14,
40]. We sampled 50% of the entire size range for
S. ciliatus, S. flavidus, and
S. variabilis. Size at maturity has not been published for
S. nigrocinctus. We suggest that when using niche characteristics to differentiate between different models of community composition and species coexistence, it is important to quantify potential sources of variation in the measured niche metrics that might inflate estimates.
The scale of observation and sampling relative to all species in the assemblage could lead to a different interpretation of our results. If we focus on smaller groups of species, we find examples of species that appear to function as ecological equivalents (or, at least, trophic equivalents). For example,
S. maliger and
S. nebulosus from the demersal group were quite similar in their trophic niches as measured by position, size, and overlap; and
S brevispinis,
S. melanops, and
S. flavidus from the pelagic group were very similar in their niche characteristics and overlap. If we had considered either of these smaller sets of species, we might conclude that they exhibit characteristics consistent with a stochastic lottery dynamics model of coexistence, and there is no reason that those types of dynamics might not occur among a limited number of species within the larger assemblages. In the classic paper by Peter Sale [
11] that has been extensively cited as an example of lottery dynamics in species-rich assemblages, detailed measurements of space occupancy were made for three species of pomacentrid fishes. Such studies suggest that niche characteristics among a few species may support a different model of species coexistence compared to niche characteristics observed among a larger number of species.
Before the development of stable isotope ecology, previous studies would have had to quantify stomach contents to compare trophic metrics. However, stable isotopes have been shown to be a reliable form of trophic niche metric which requires far less time and resources to characterize trophic relationships [
41,
42] than observing stomach contents. Additionally, stable isotopes can be more accurate than traditional diet studies because they only take into account assimilated and not just ingested forage [
8]. Our results are also strengthened by the properties of stable isotope analysis. The δ
13C stable isotope ratios of the consumer reflect that of their forage and are not enriched trophically [
41,
43,
44]; whereas δ
15N stable isotope ratios enrich at predictable increments in the food chain [
31,
41,
43,
45]. Because of these properties, similarities in stable isotope ratios of consumers can appear to come from the same source if multiple sources exhibit similar isotopic values. Thus, similarities in stable isotope ratios may not actually represent real similarities in diet if two species are using different prey resources that result in similar isotopic compositions. If this occurs, we could assume equivalence in trophic niches when in fact diets are taxonomically different. However, our results are somewhat conservative relative to this point because we found isotopic differences in trophic niche position among most species. In the few cases noted above where two or three species have similar niches, it is possible that these similarities may result from taxonomically different, but isotopically similar prey. If this is the case, our support for the deterministic species coexistence model is strengthened. In future studies, it would be important to quantify and determine isotopic signatures of prey species along with the target assemblage.
The resource diversity hypothesis suggests that niche breadth is a function of the variety of local forage items [
46,
47]. The observed trophic niche size was variable among species and pelagic rockfish had the highest trophic niche sizes while the demersal rockfish had generally smaller trophic niches (
Table 2). It is possible that the differences in the trophic niche size can also be related to the trophic niche position. As the pelagic rockfish can differentiate their trophic niche on the δ
13C axis in addition to the δ
15N axis, there may be additional forage items that allow them to have a larger niche breadth. While there has been evidence of this in South American amphibians, it appears that rockfish exhibit a pattern that would warrant additional studies to see if rockfish niche breadth is affected by prey diversity.
Coexistence and community organization are still fundamental questions in community ecology. While our paper provides insight into community organization for a rockfish assemblage, there are still other systems where community composition models go untested. By testing models of community composition in other systems and on other species, we increase our understanding of how coexistence and community organization occur on a broader scale. The methods used in this paper are applicable anywhere community composition models can be tested using trophic metrics from stable isotopes. We encourage future research to use these methods on other species and in other systems.


