
Seasonal Abundance, Density and Distribution of Cetaceans in the Bulgarian Black Sea Shelf in 2017
 , ,
, ,
Abstract
:
1. Introduction
2. Materials and Methods
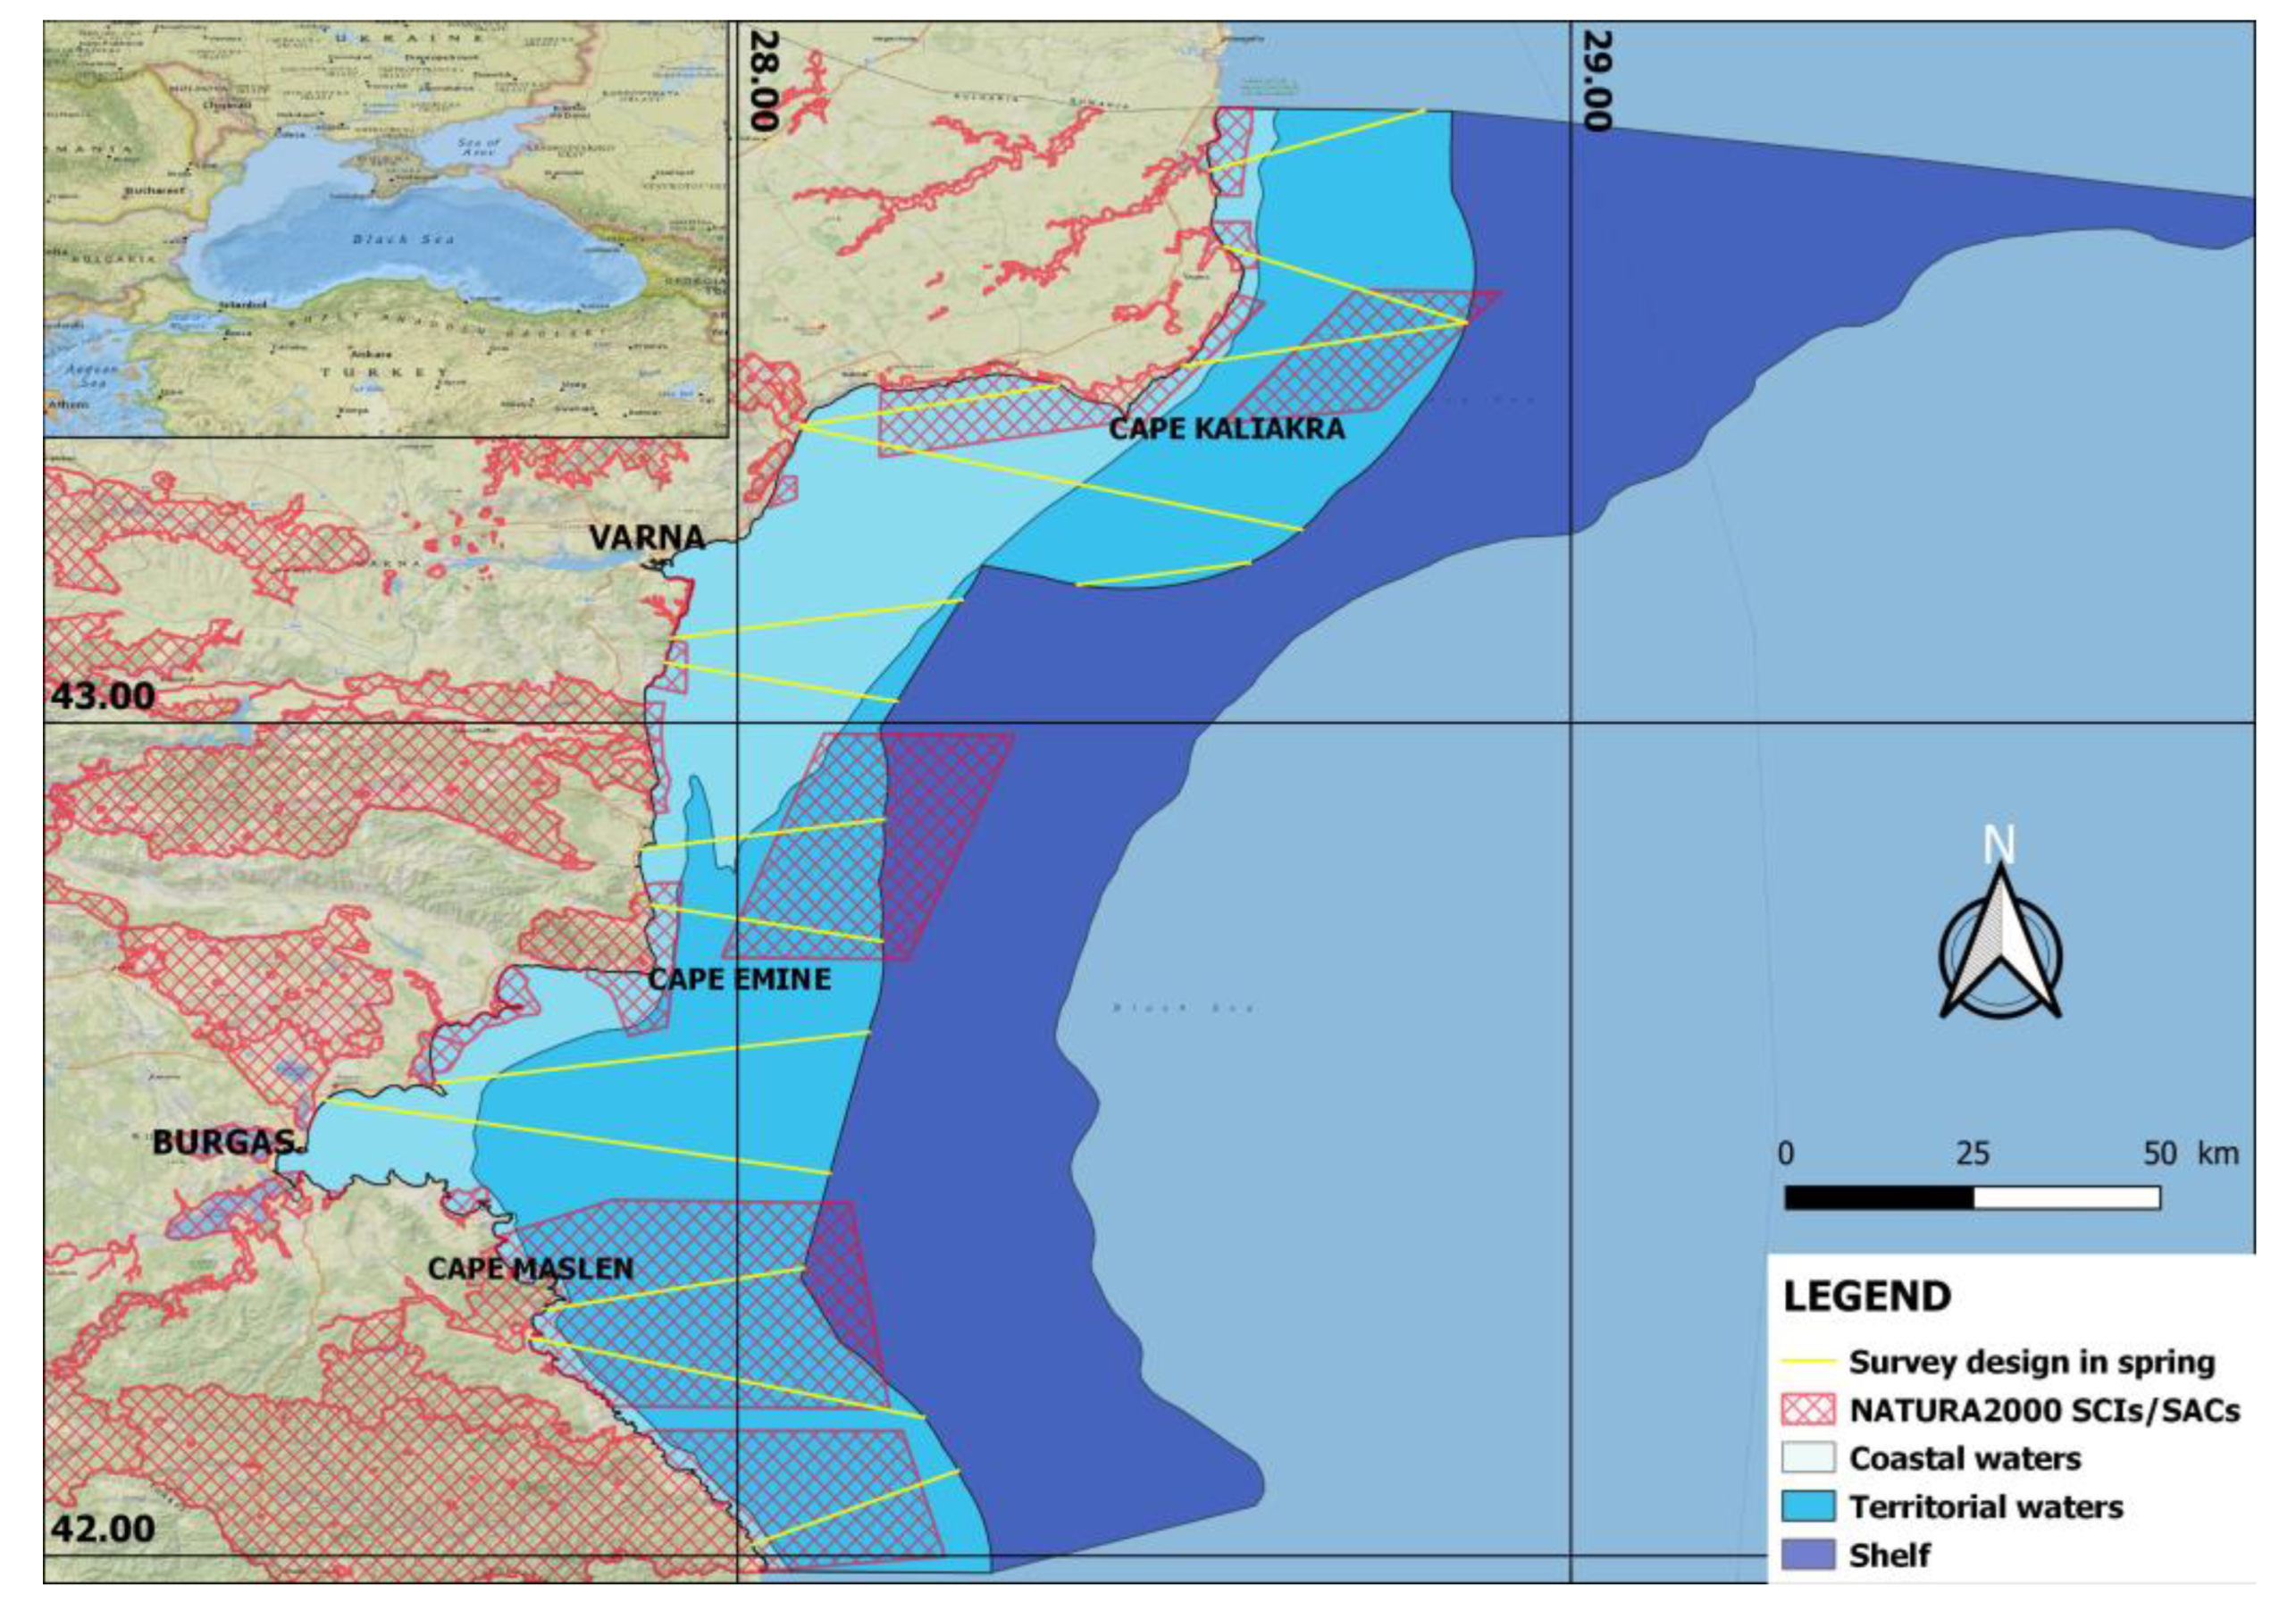
2.1. Study Area
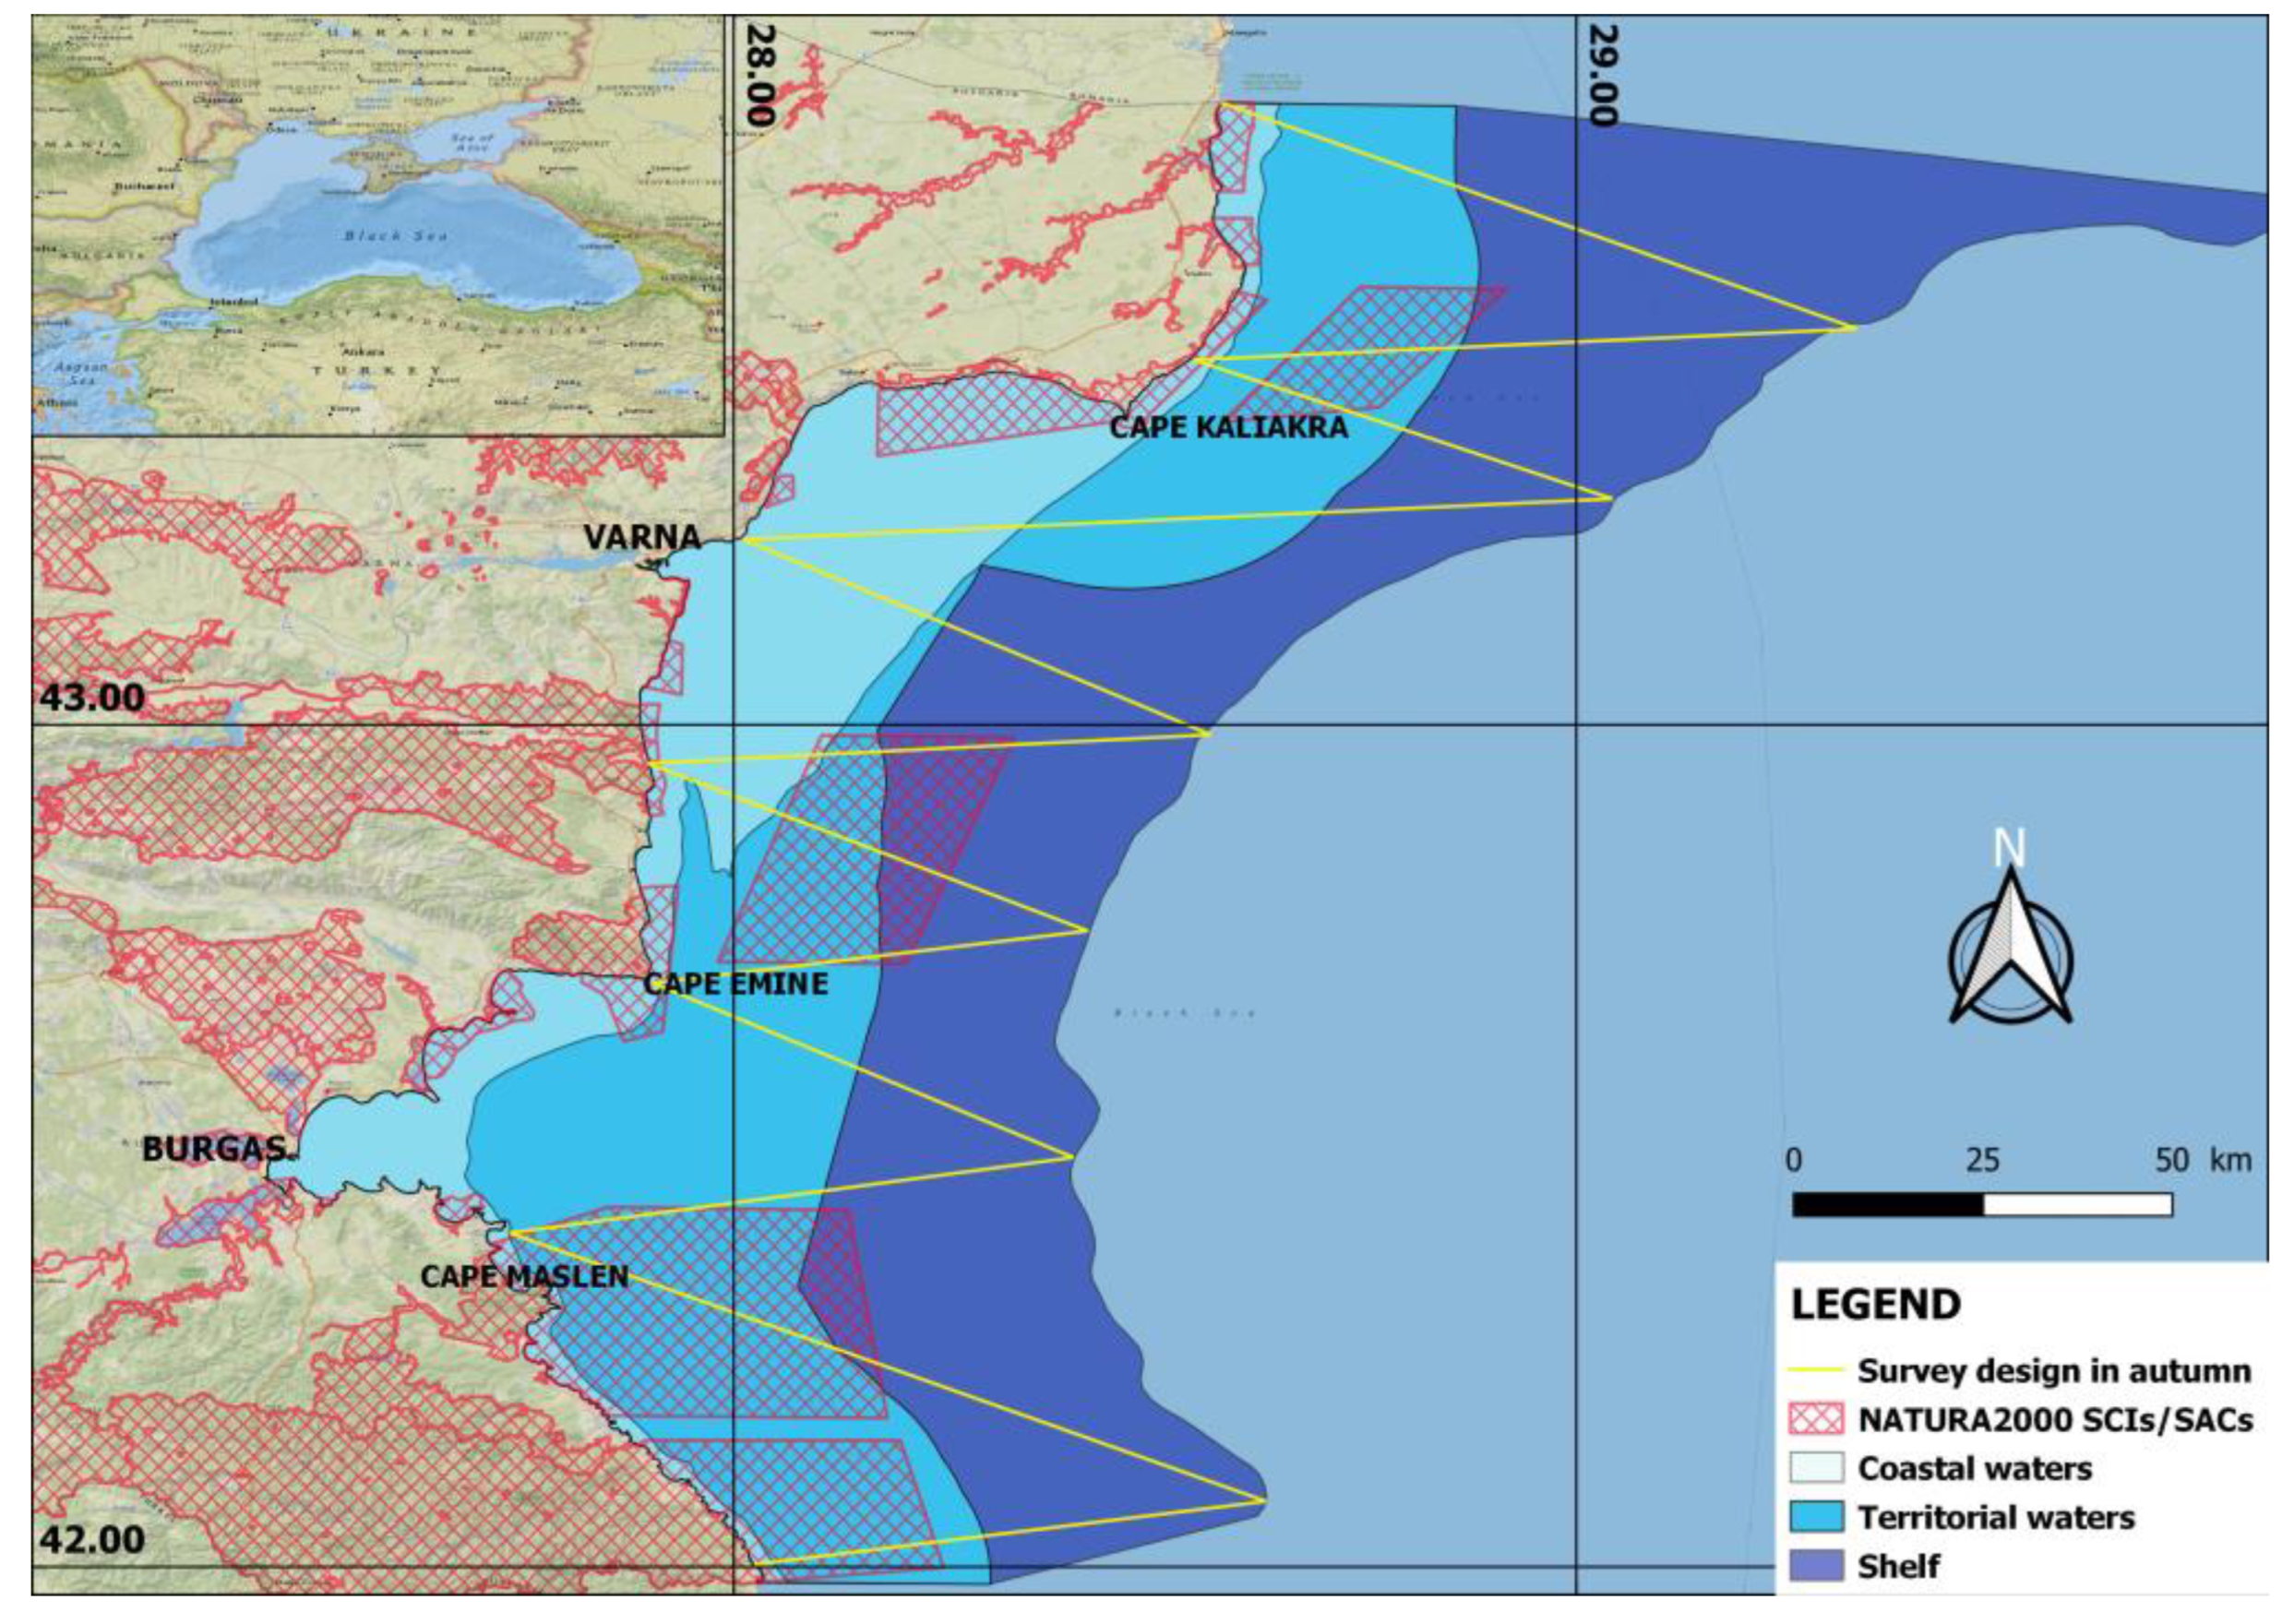
2.2. Survey Design
2.3. Data Collection
2.4. Data Analysis
3. Results
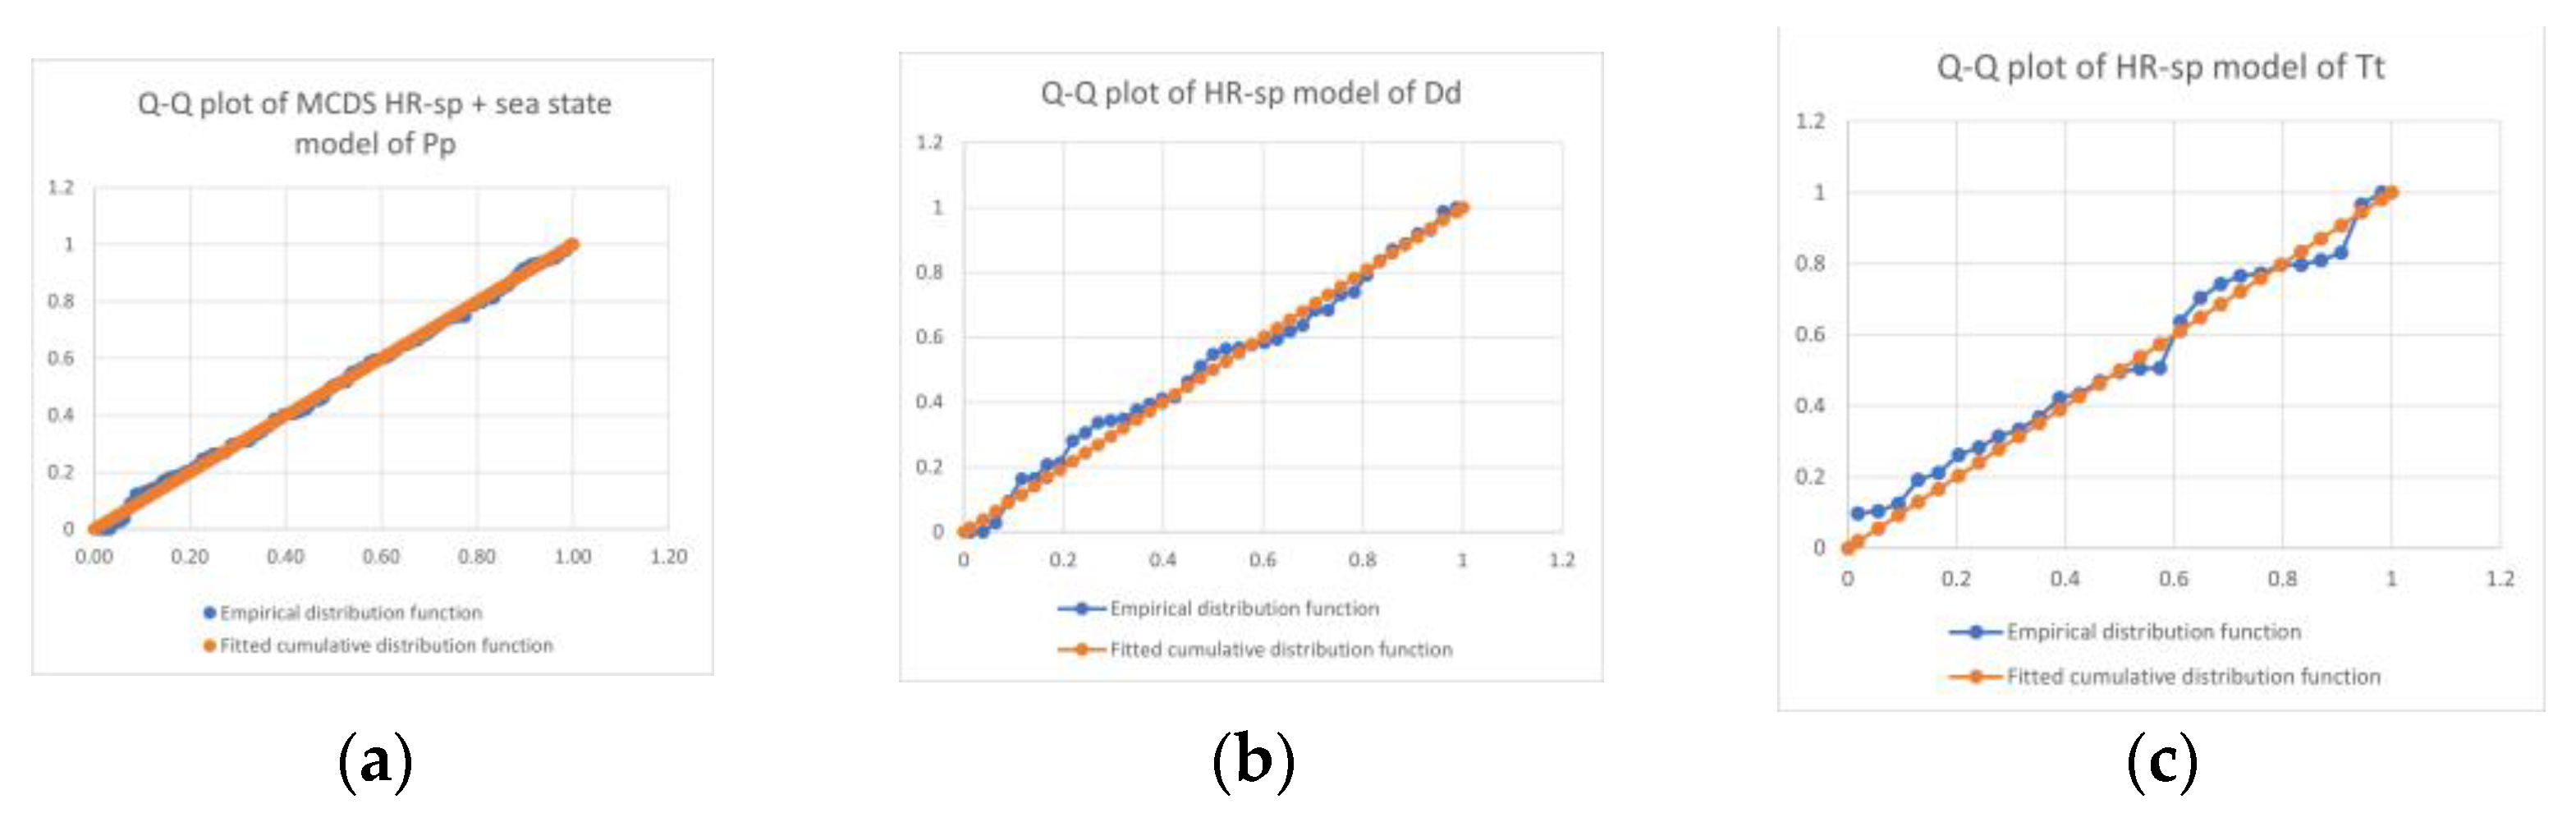
3.1. Spring Survey in June 2017
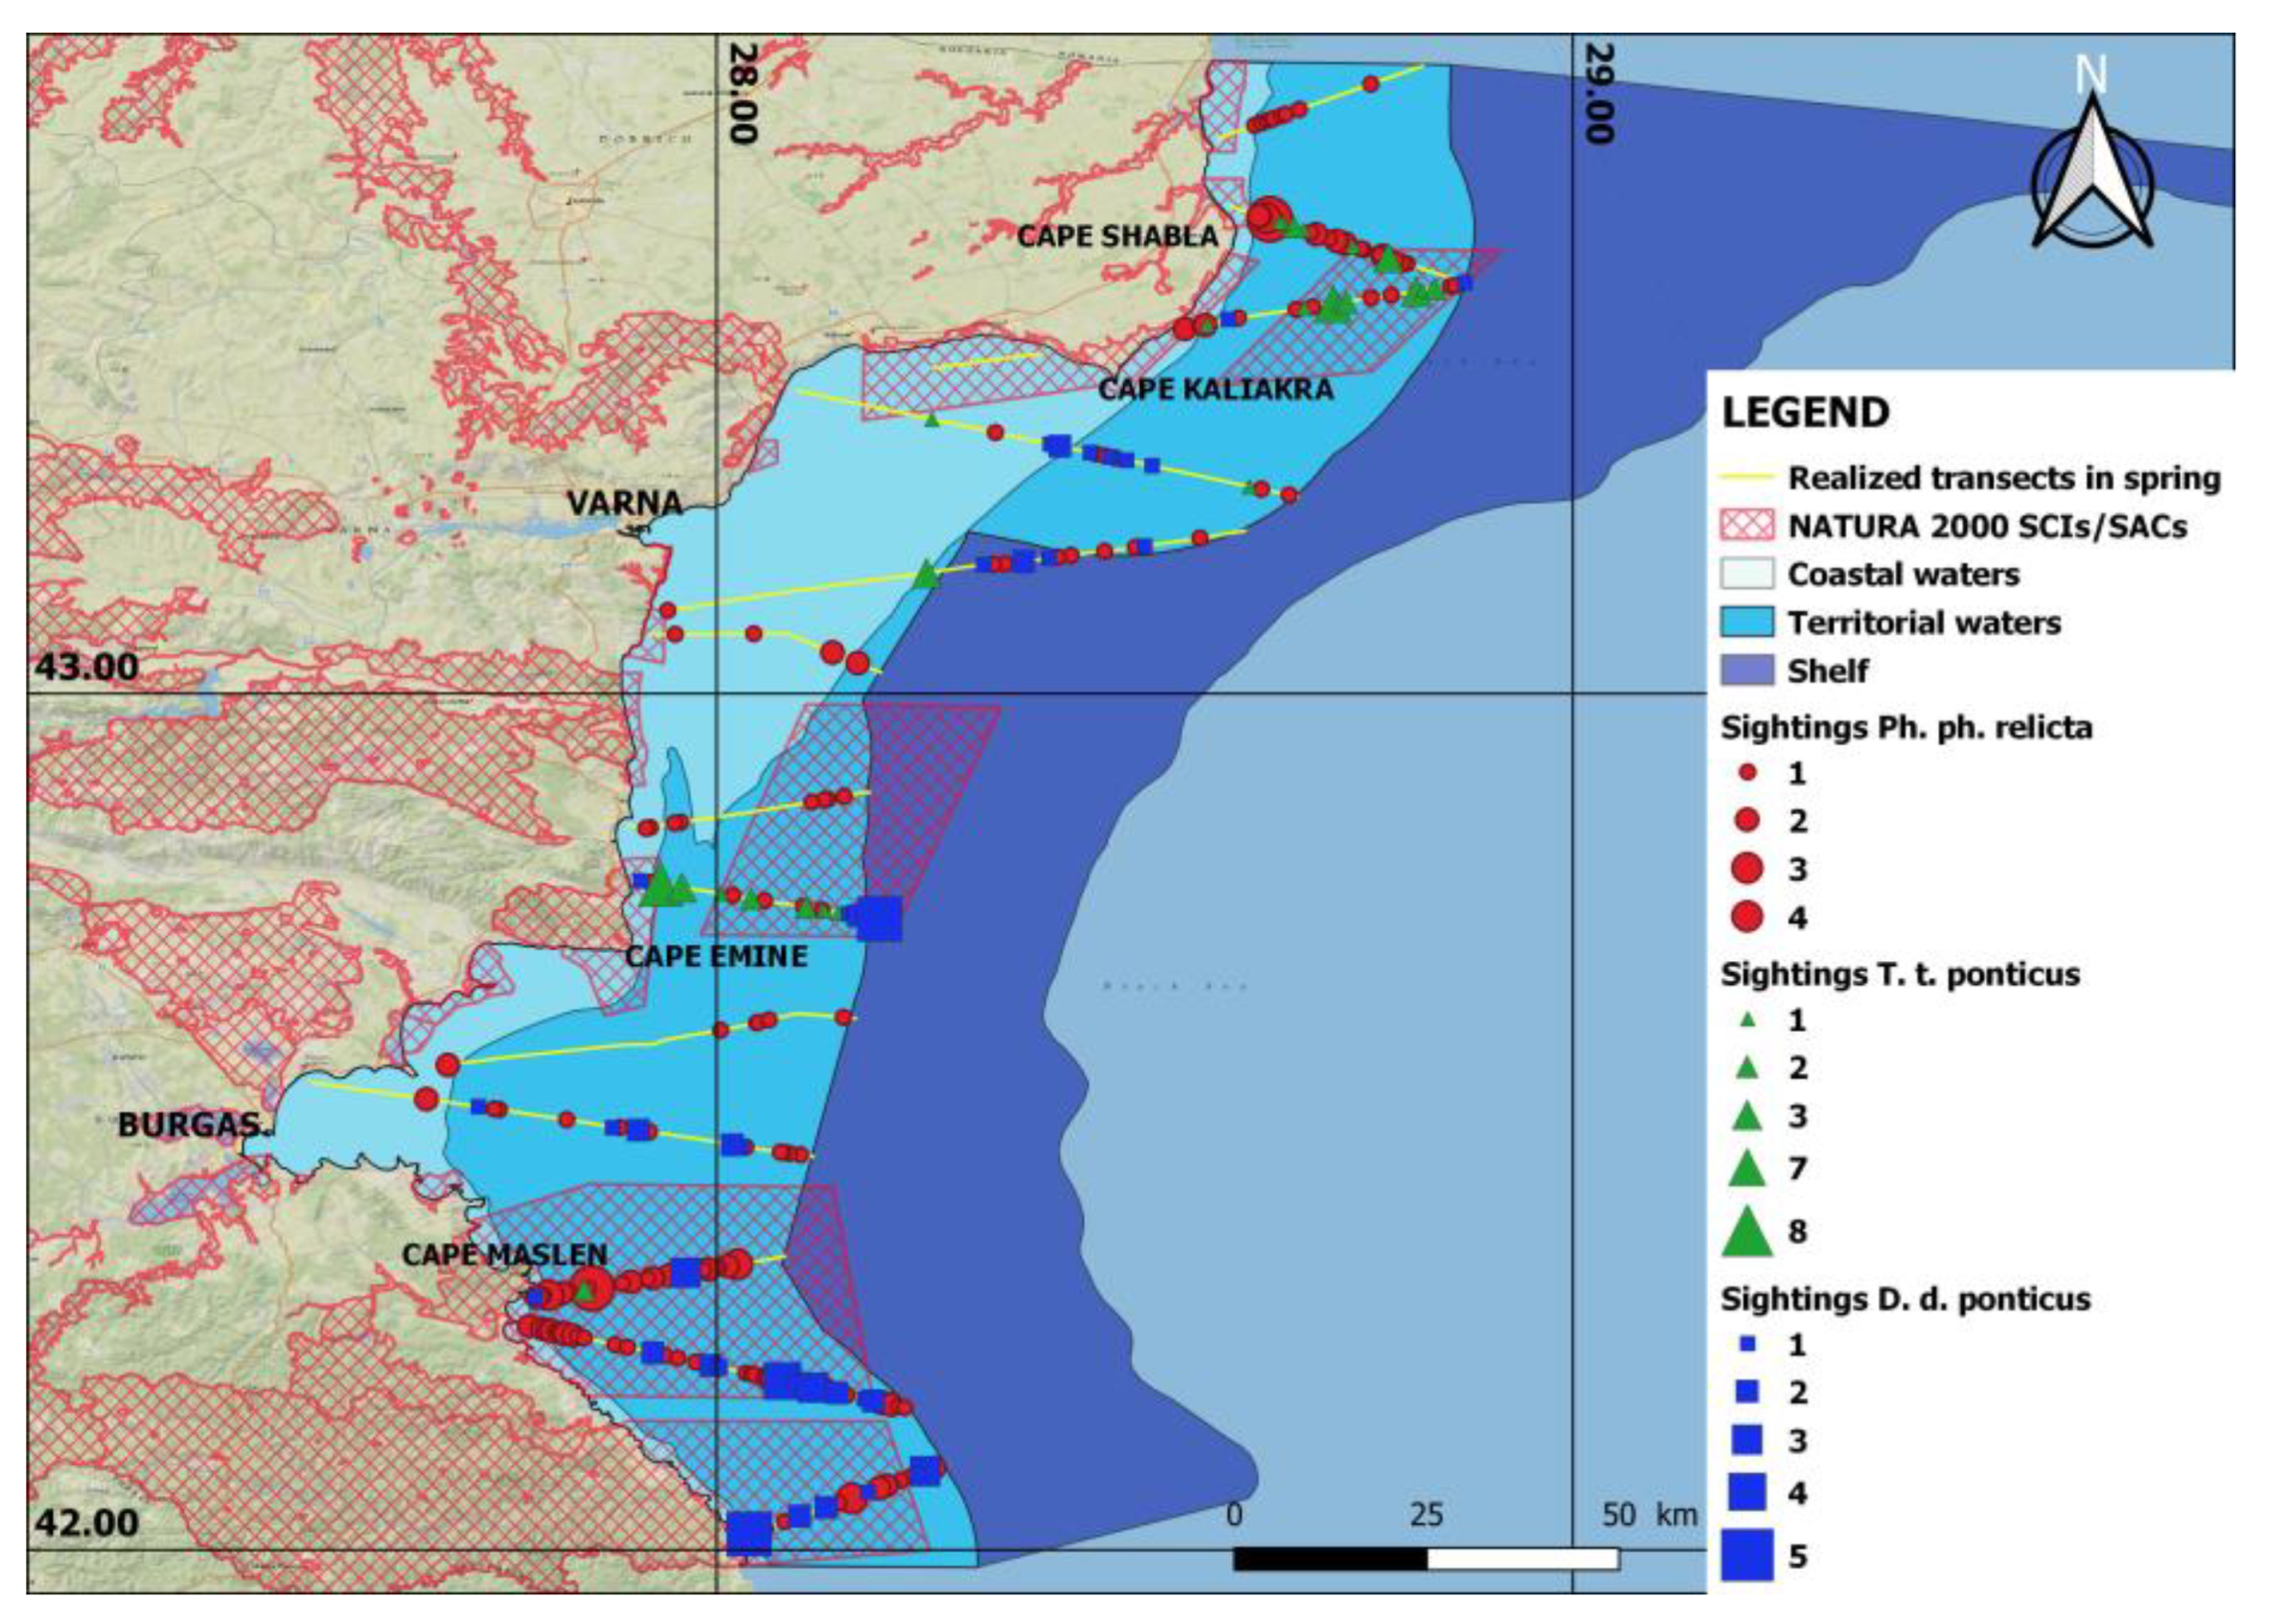
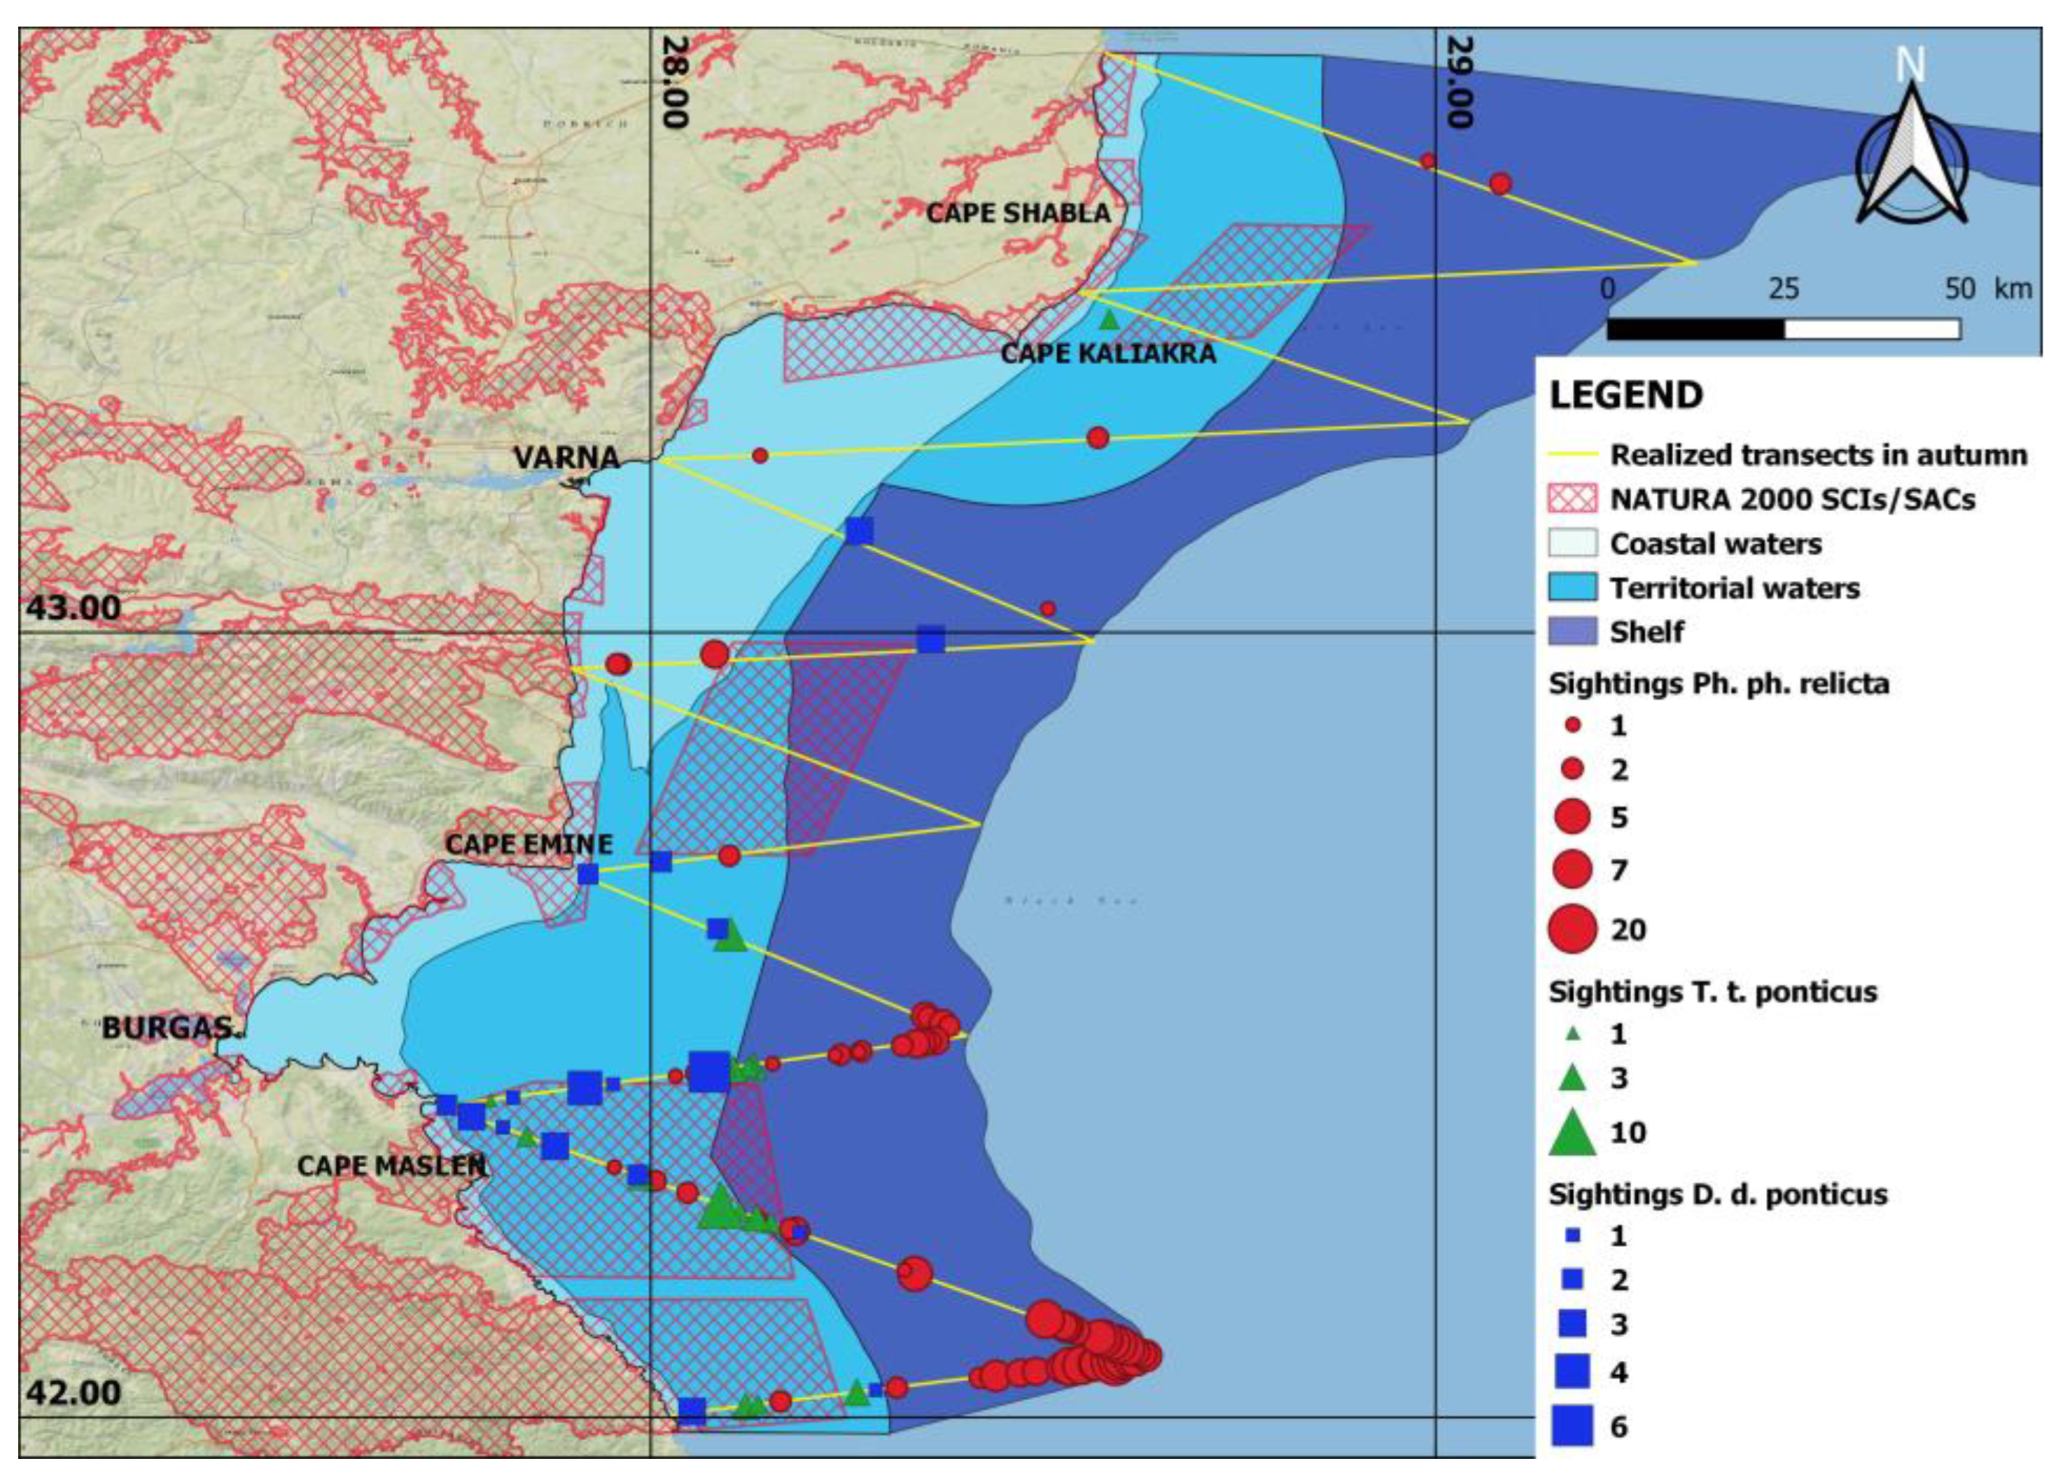
3.1.1. Sightings
3.1.2. Density, Abundance and Encounter Rate
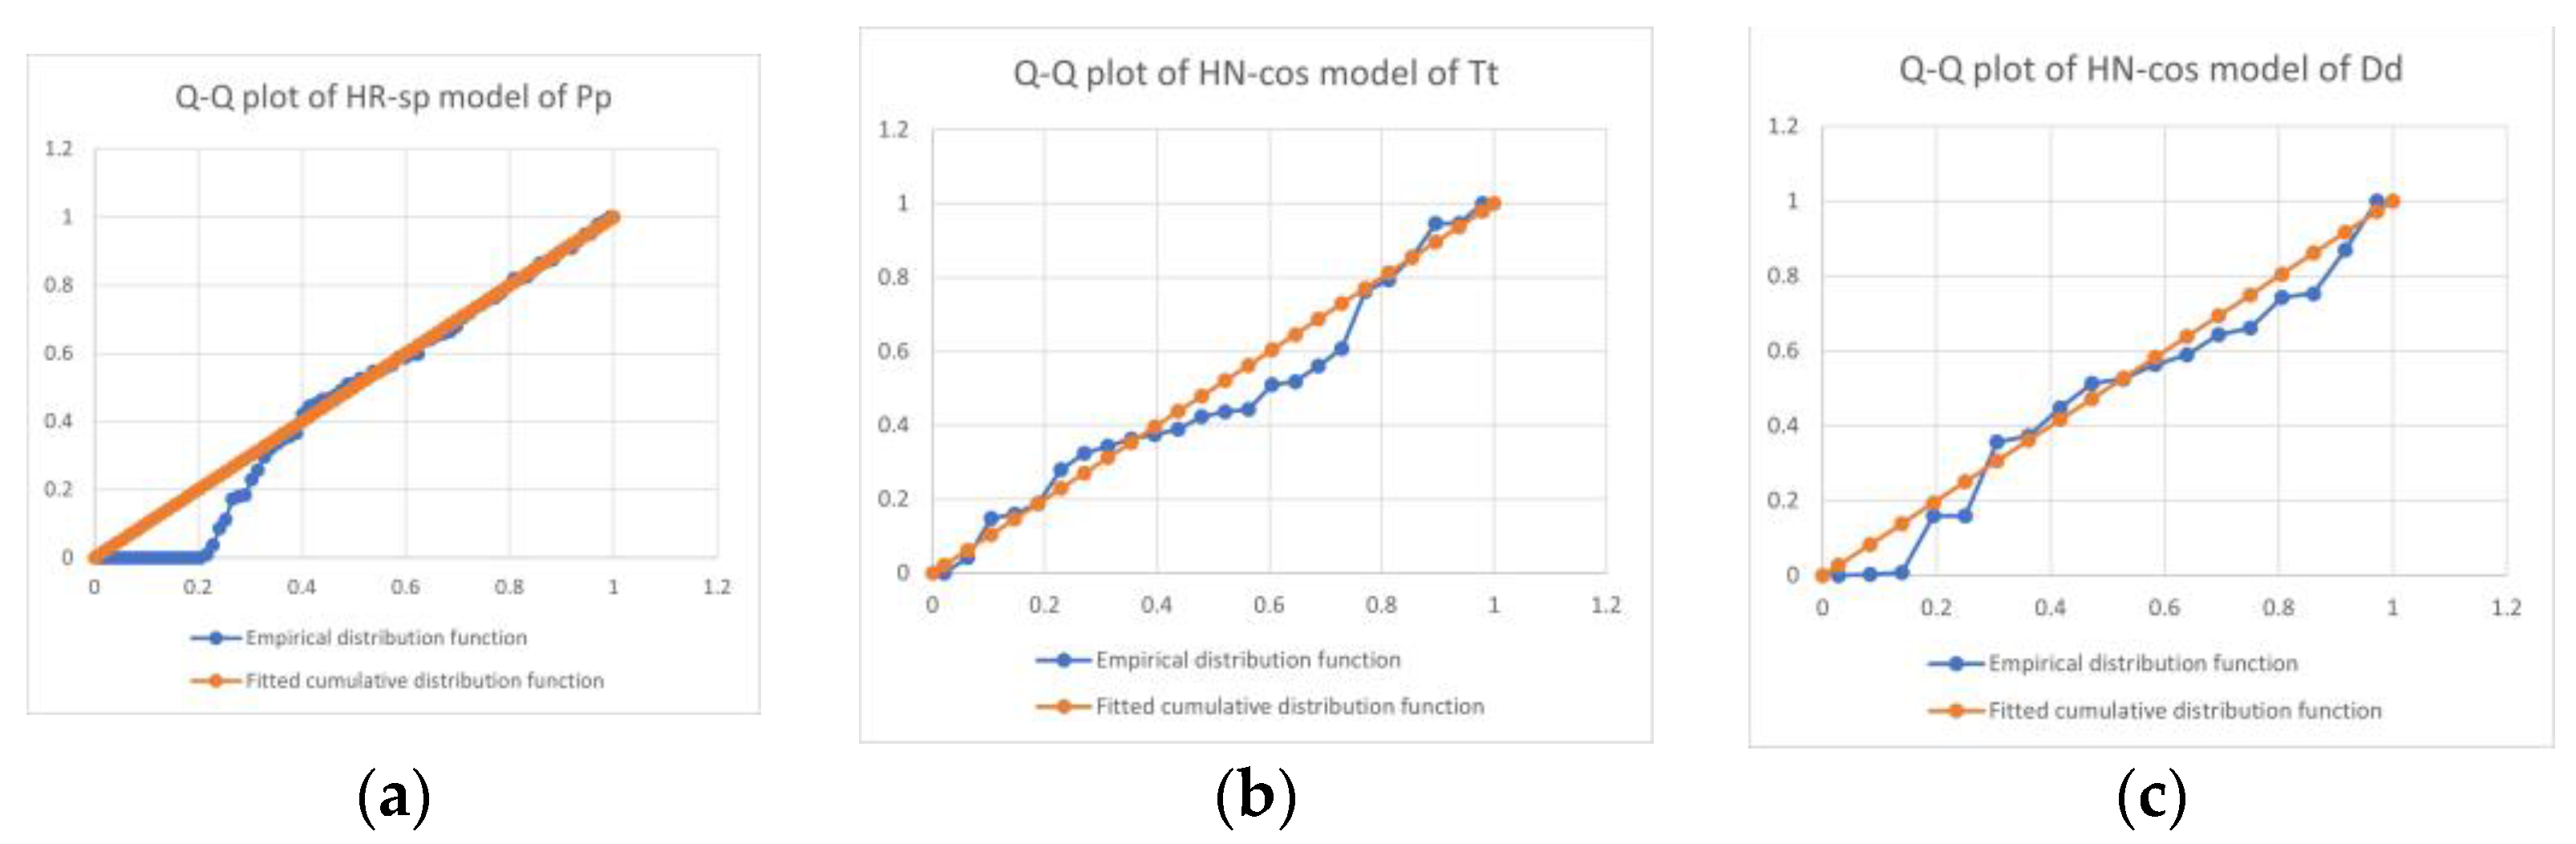
3.2. Autumn Survey in November–December 2017
3.2.1. Sightings
3.2.2. Density, Abundance and Encounter Rate
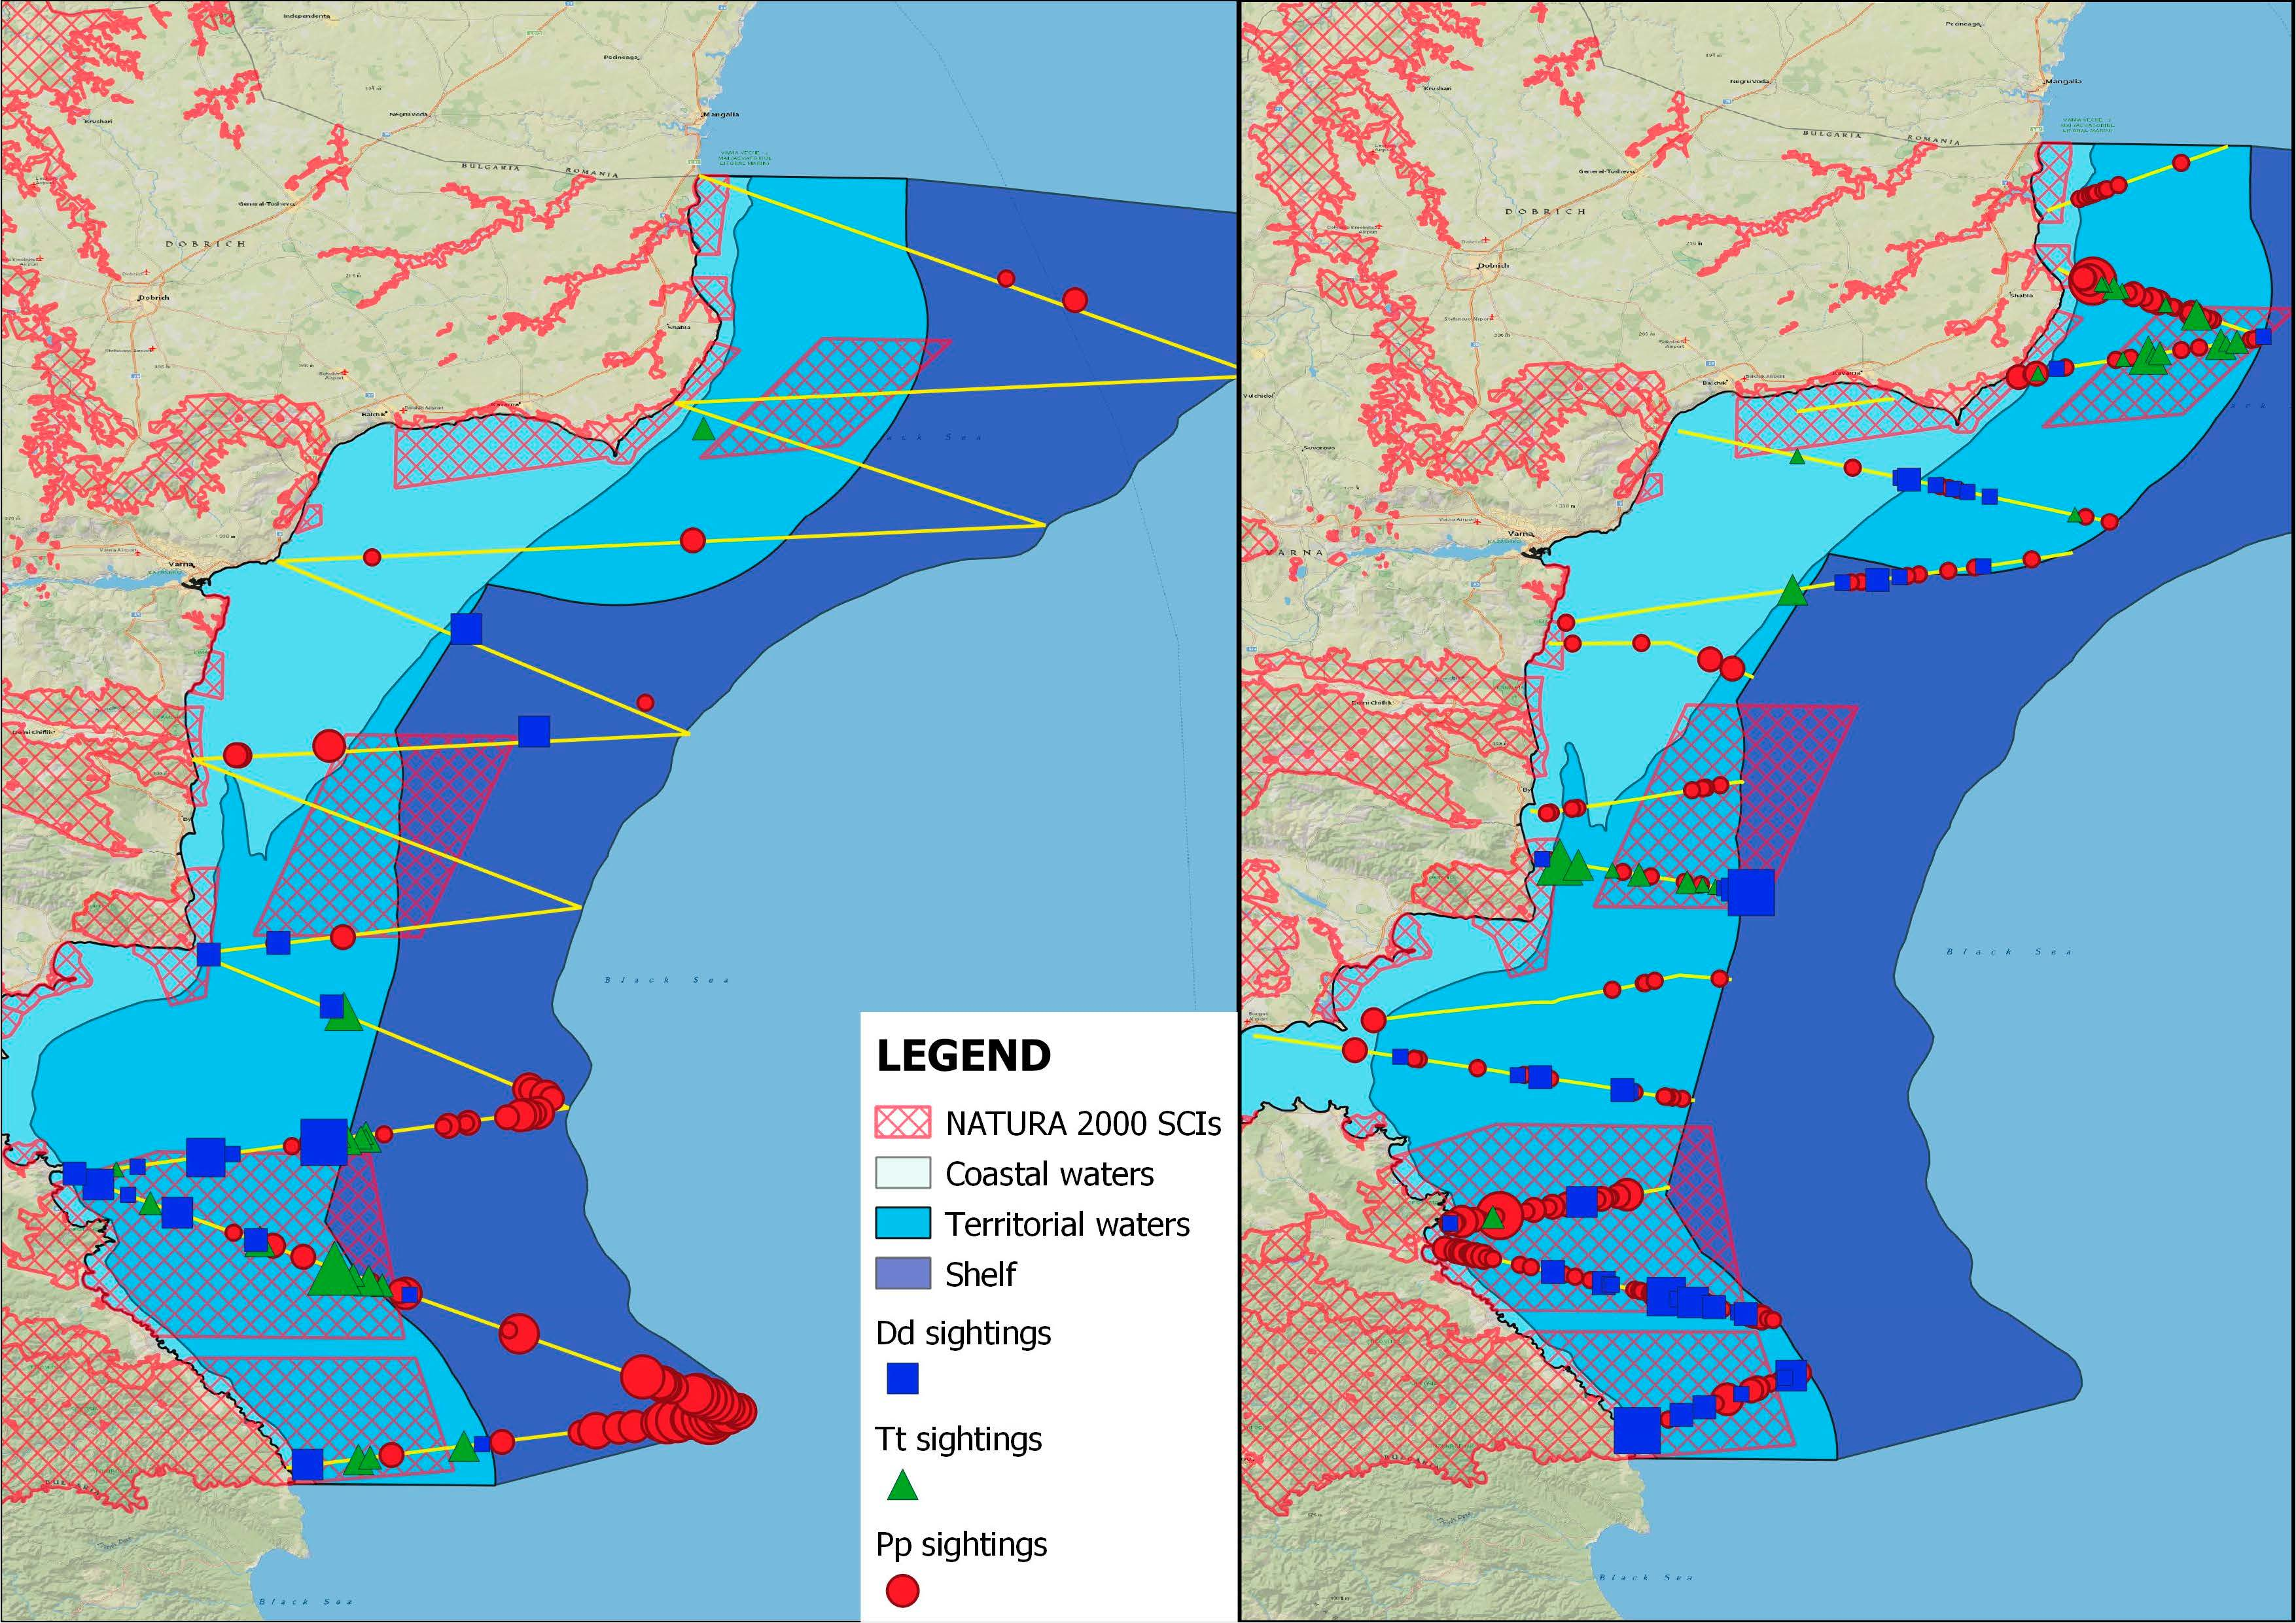
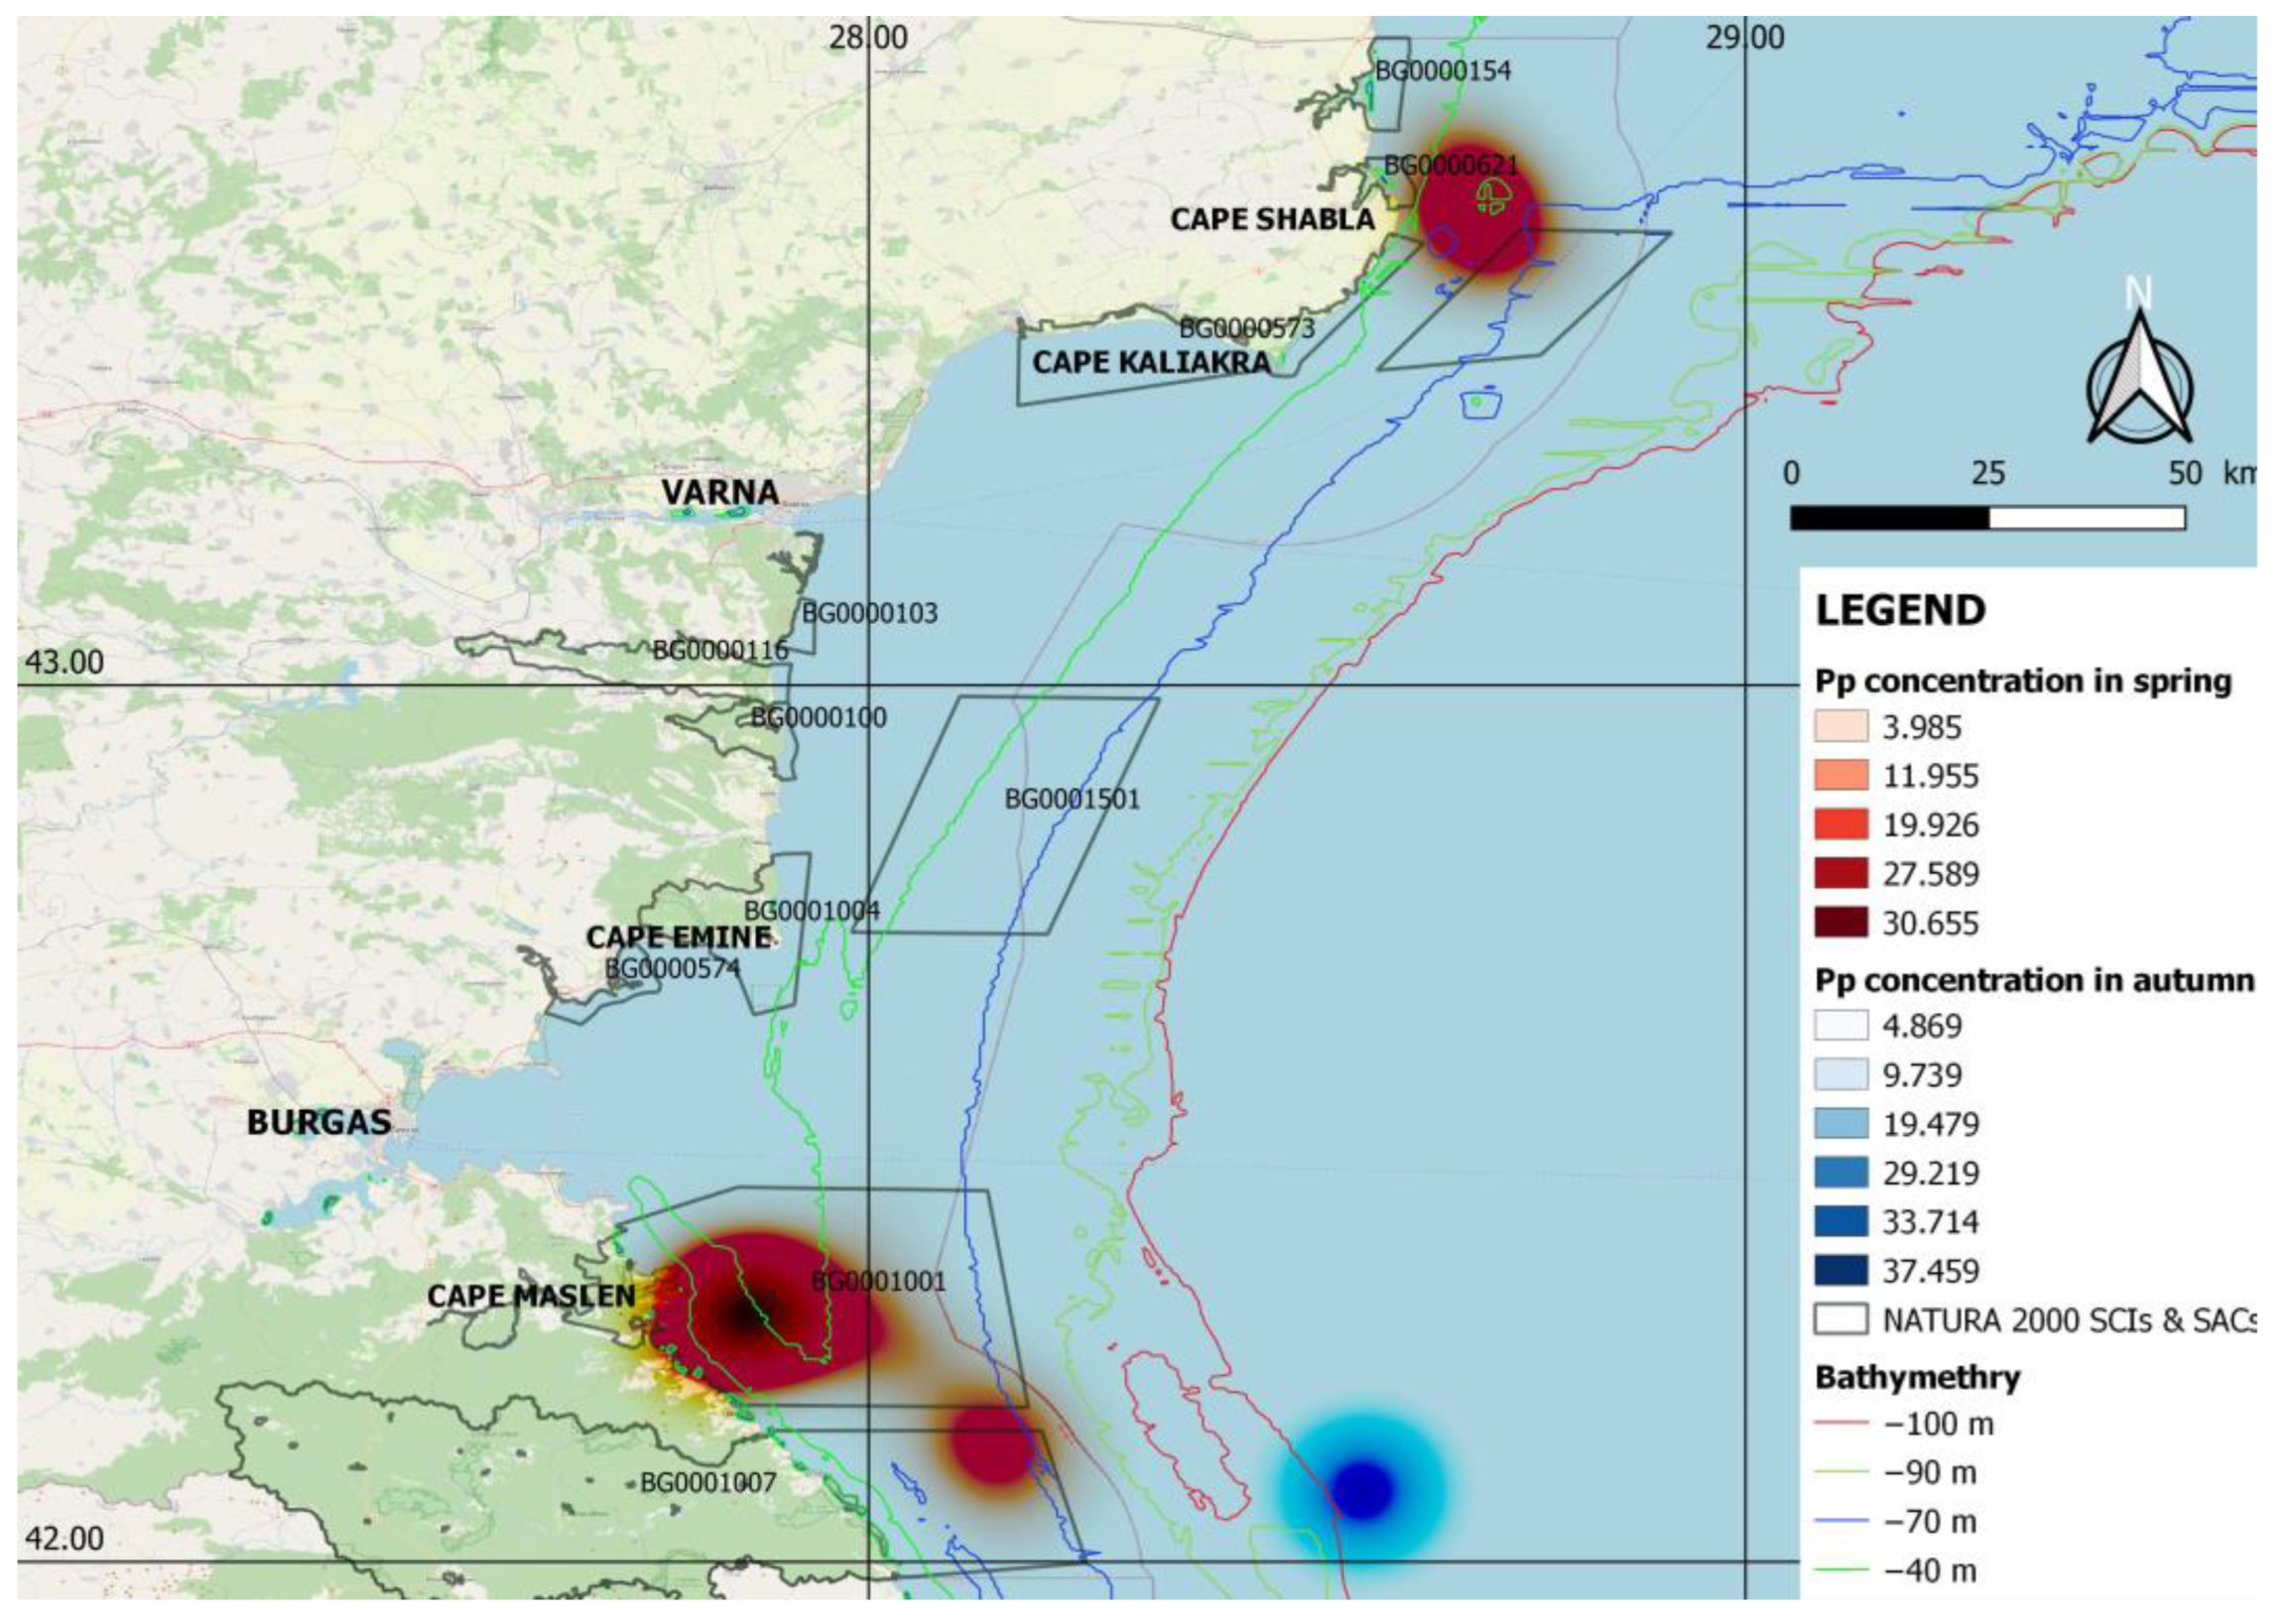
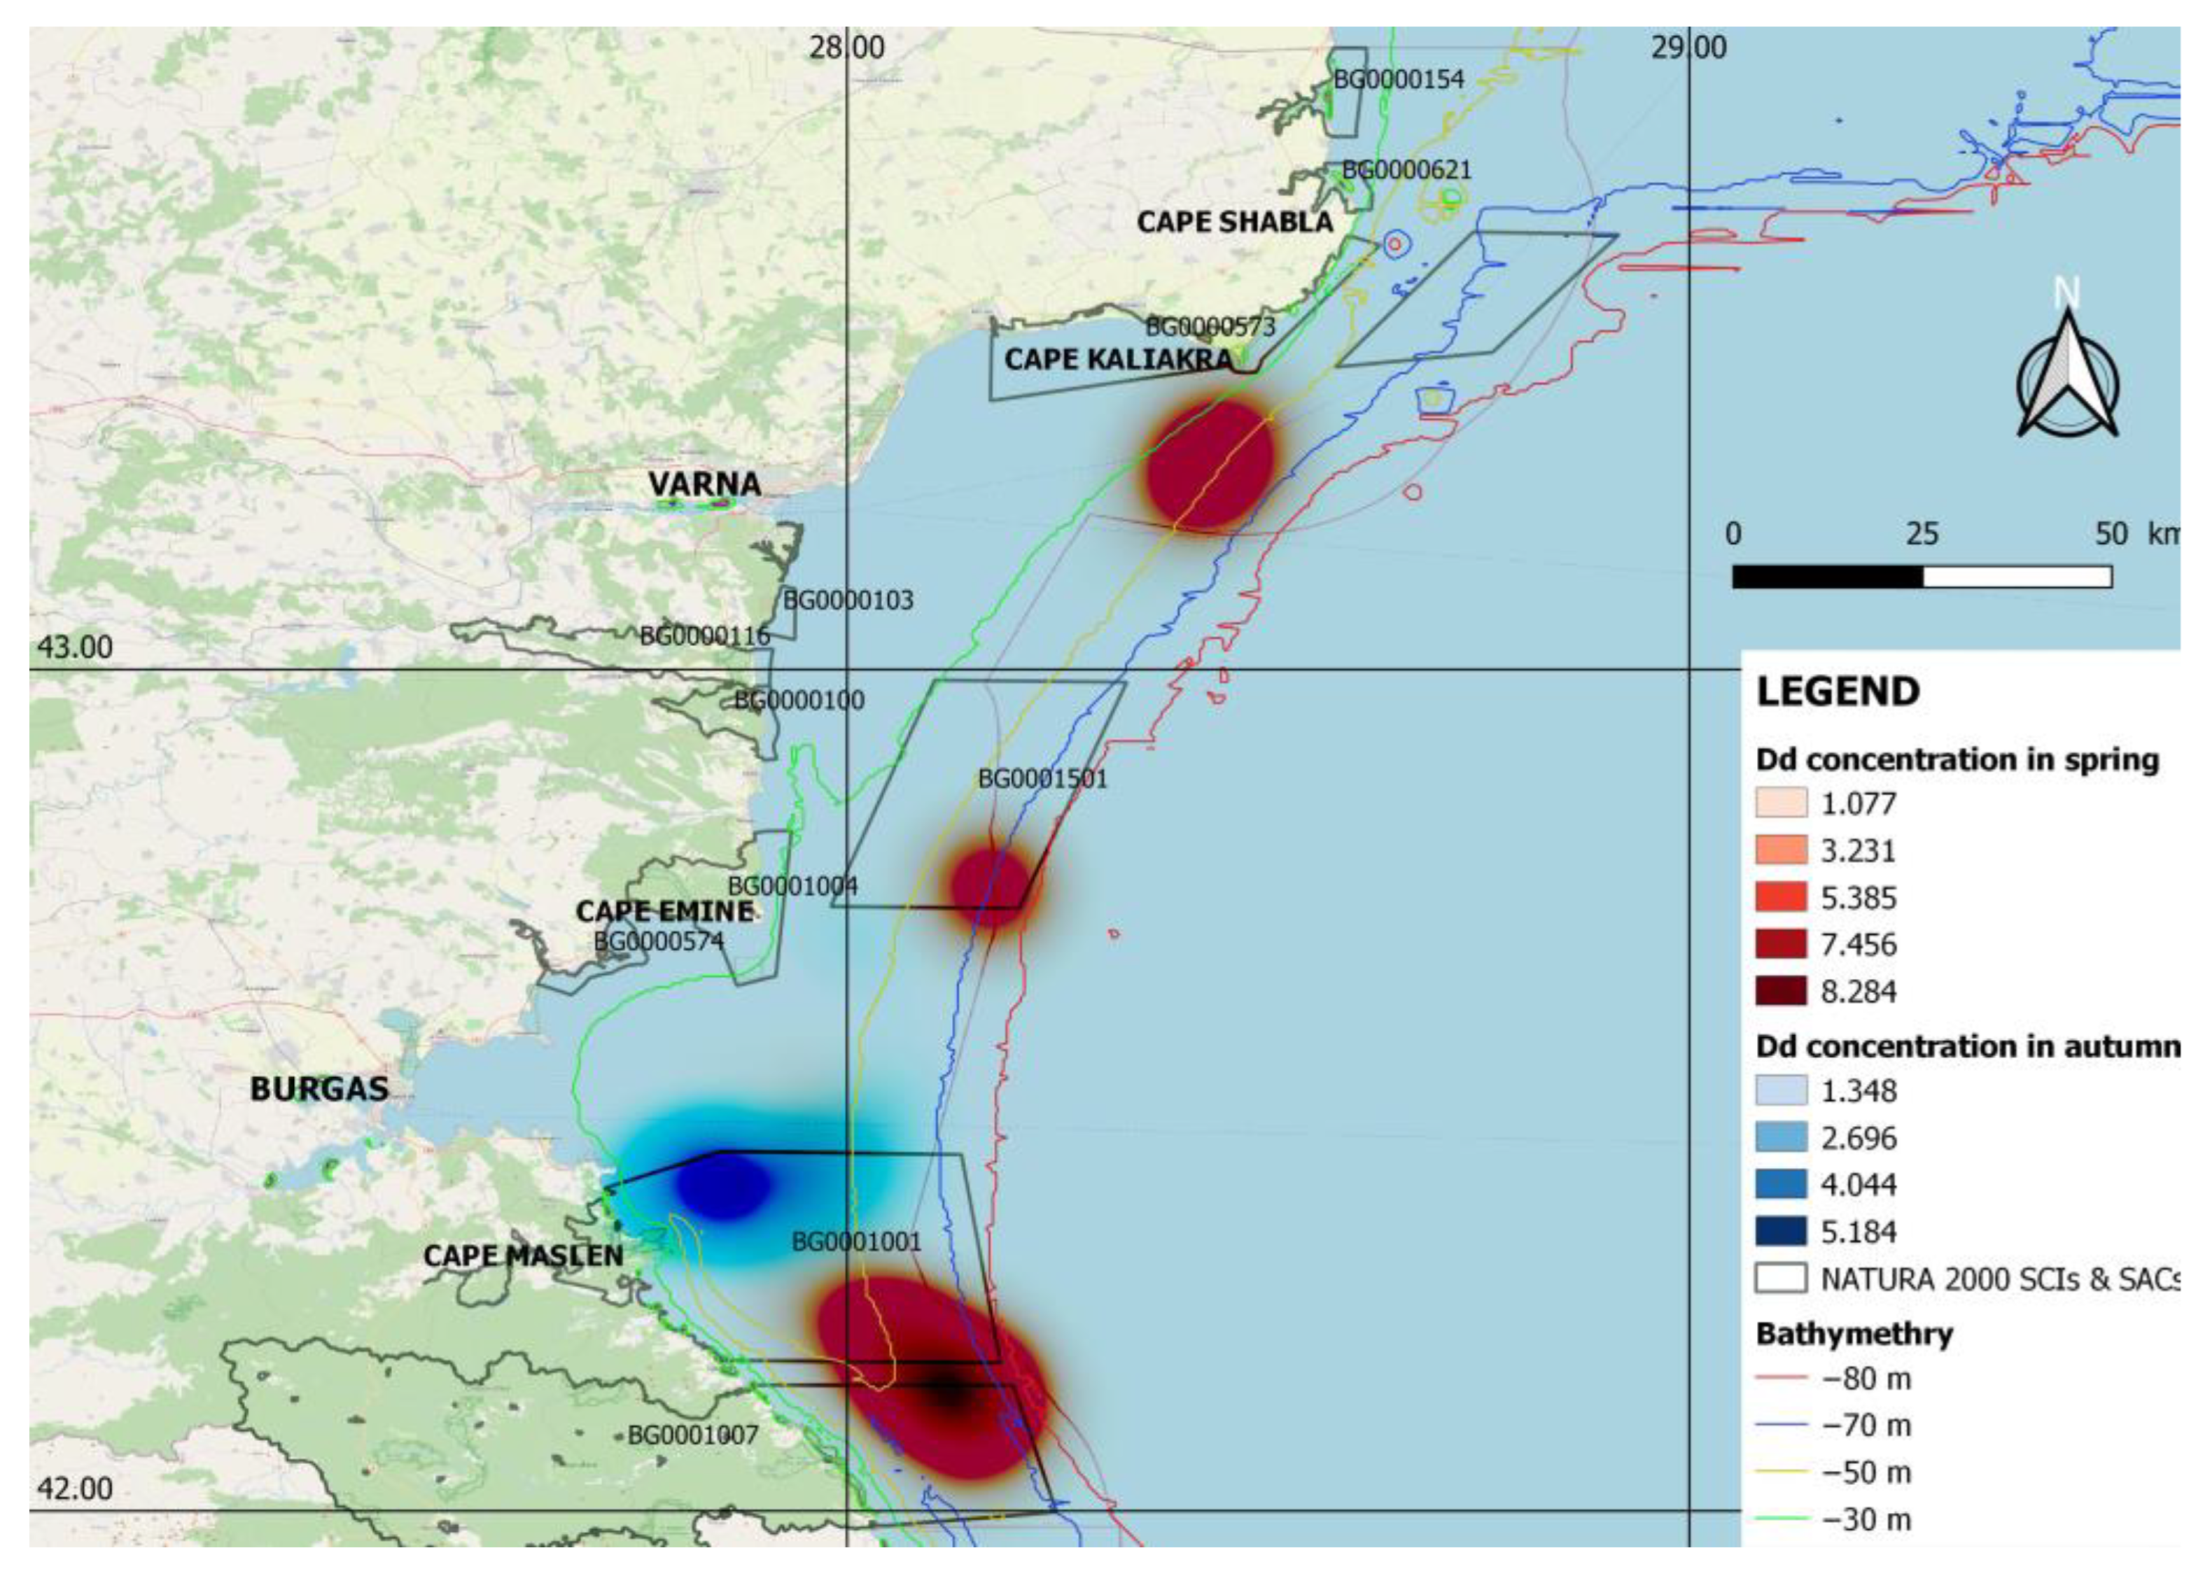
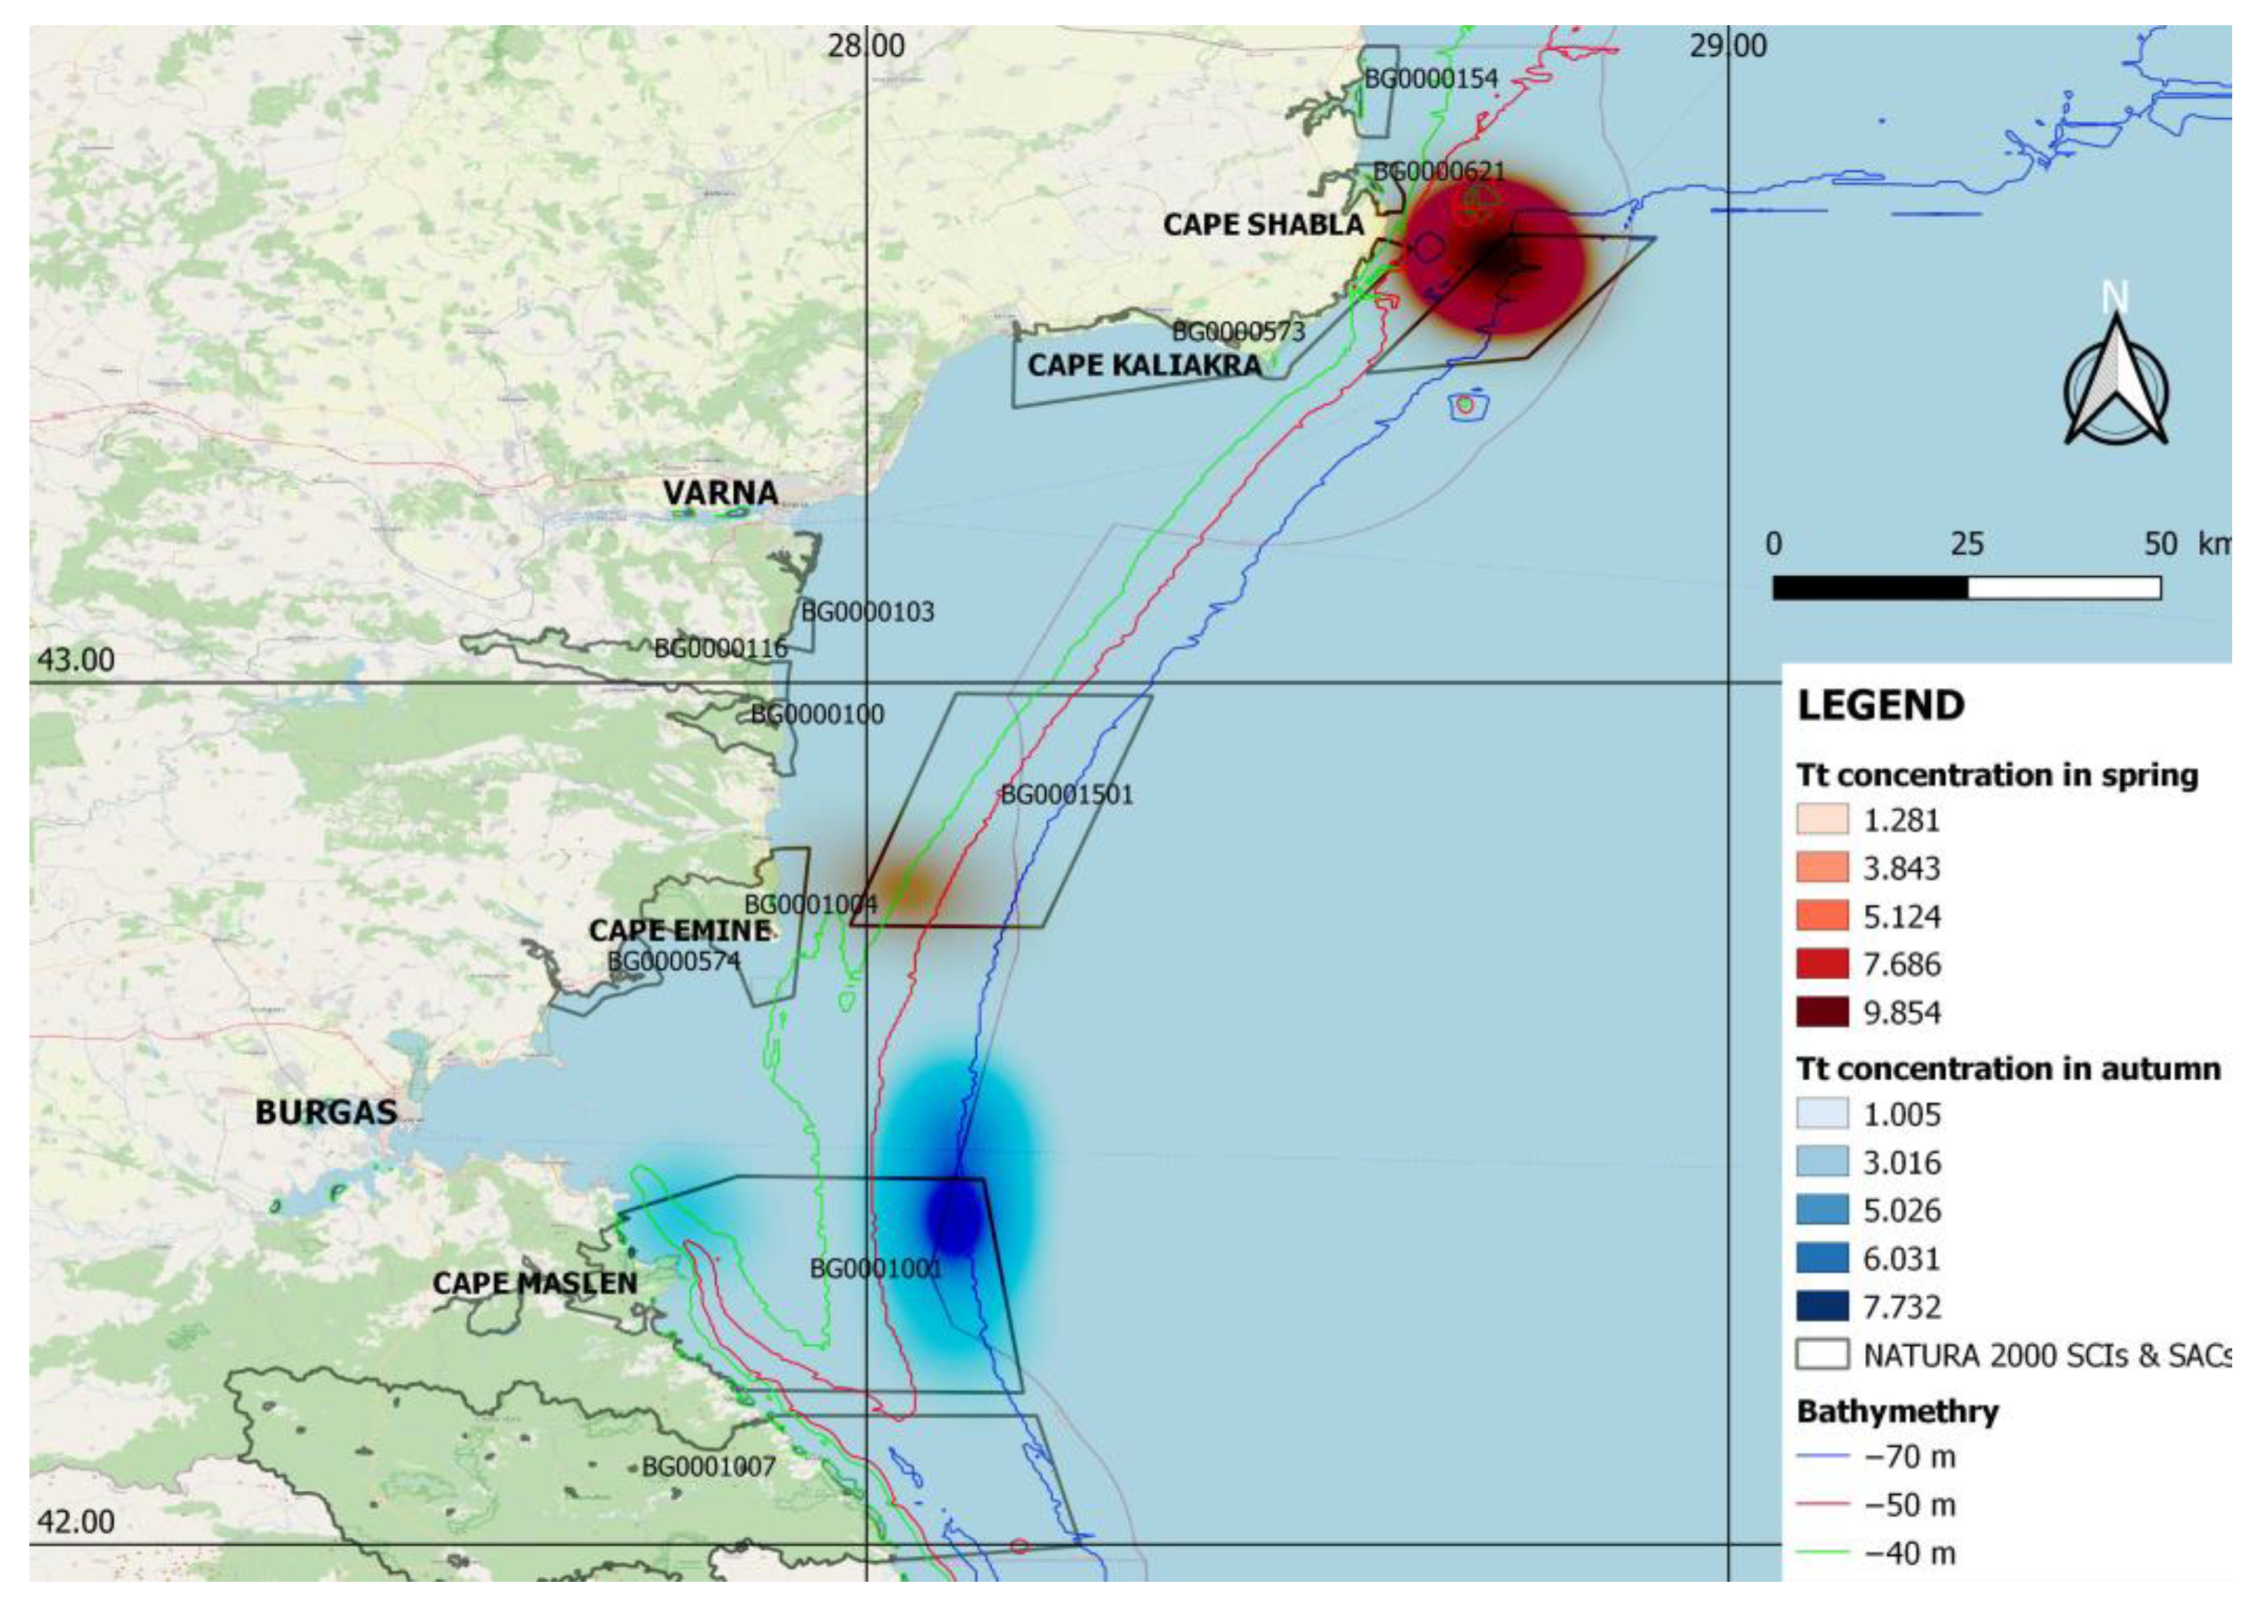
3.3. Distribution and Hotspots in Spring and Autumn
4. Discussion
4.1. Black Sea Harbour Porpoise
4.2. Black Sea Common Dolphin
4.3. Black Sea Bottlenose Dolphin
5. Conclusions
Author Contributions
Funding
Institutional Review Board Statement
Data Availability Statement
Acknowledgments
Conflicts of Interest
References
- Borysova, O.; Kondakov, A.; Paleari, S.; Rautalahti-Miettinen, E.; Stolberg, F.; Daler, D. Impact assessment and Causal chain analysis. In Eutrophication in the Black Sea Region; University of Kalmar: Kalmar, Sweden, 2005. [Google Scholar]
- Birkun, A.A., Jr.; Frantzis, A. Phocoena phocoena ssp. relicta.The IUCN Red List of Threatened Species. 2008. e.T17030A6737111. Available online: https://0-dx-doi-org.brum.beds.ac.uk/10.2305/IUCN.UK.2008.RLTS.T17030A6737111.en (accessed on 10 December 2022).
- Birkun, A. Tursiops truncatus ssp. ponticus. The IUCN Red List of Threatened Species. 2012. E.T133714A17771698. Available online: https://0-dx-doi-org.brum.beds.ac.uk/10.2305/IUCN.UK.2012.RLTS.T133714A17771698.en (accessed on 10 December 2022).
- Birkun, A.A., Jr. Delphinus delphis ssp. ponticus. The IUCN Red List of Threatened Species. 2008. E.T133729A3875256. Available online: https://0-dx-doi-org.brum.beds.ac.uk/10.2305/IUCN.UK.2008.RLTS.T133729A3875256.en (accessed on 10 December 2022).
- Birkun, A., Jr. Interaction between Cetaceans and Fisheries: Black Sea. In Cetaceans of the Mediterranean and Black Seas: State of Knowledge and Conservation Strategies; Notarbartolo di Sciara, G., Ed.; ACCOBAMS Secretariat: Monaco, 2002; pp. 98–107. Available online: https://www.vliz.be/imisdocs/publications/228865.pdf (accessed on 10 December 2022).
- Birkun, A., Jr.; Northridge, S.P.; Willsteed, E.A.; James, F.A.; Kilgour, C.; Lander, M.; Fitzgerald, G.D. Studies for carrying out the Common Fisheries Policy: Adverse fisheries impacts on cetacean populations in the Black Sea; Final report to the European Commission; European Commission: Brussels, Belgium, 2014; pp. 1–347.
- Gol’din, P.; Vishnyakova, K.; Popov, D.; Paiu, R.M.; Tonay, A.M.; Düzgüneş, E.; Timofte, C.; Meshkova, G.; Panayotova, M.; Amaha Öztürk, A. CeNoBS. Detailed Report of the Pilot(s) on Bycatch Monitoring, Including Recommendations to Further Develop D1C1 Criterion; CeNoBS Project: Odesa, Ukraine, 2021; pp. 1–52. [Google Scholar]
- ACCOBAMS. Conserving Whales, Dolphins and Porpoises in the Mediterranean Sea, Black Sea and Adjacent Areas: An ACCOBAMS Status Report; Notarbartolo di Sciara, G., Tonay, A.M., Eds.; ACCOBAMS: Monaco, 2021; pp. 95–103. Available online: https://accobams.org/wp-content/uploads/2022/03/ACCOBAMS_ConservingWDP_web_2022.pdf (accessed on 10 December 2022).
- Nikolov, D. Catch and distribution of dolphins’ groups in front of Bulgarian coast. Pros. Cent. Res. Inst. Aqua. Fish. 1963, III, 183–197. [Google Scholar]
- Eremeev, V.N.; Zuyev, G.V. Commercial Fishery Impact on the Modern Black Sea Ecosystem: A Review. Turk. J. Fish. Aquat. Sci. 2007, 82, 75–82. [Google Scholar]
- Panayotova, M.; Todorova, V. Distribution of three cetacean species along the Bulgarian Black Sea coast in 2006-2013. J. Black Sea/Med. Environ. 2015, 21, 45–53. [Google Scholar]
- Panayotova, M.; Todorova, V. Using opportunistic sightings to assess the distribution of small cetaceans in the Bulgarian Black Sea in 2012. Acta Zool. Bulg. 2015, 67, 421–427. [Google Scholar]
- Panayotova, M.; Marinova, V.; Slavova, K.; Popov, D. Studying of the distribution and abundance of marine mammals in the Bulgarian Black Sea area by combination of visual and acoustic observations. Proc. Inst. Fish. Resour. (IFR)—Varna 2017, 28, 34–40. [Google Scholar]
- Popov, D.; Meshkova, G.; Hristova, P.; Miteva, A.; Ilieva, T.; Dimitrov, H. Pilot line transect surveys of cetaceans in a Bulgarian MPA-BG0001007 Strandzha SCI. Acta Zool. Bulg. 2020, 15, 243–248. [Google Scholar]
- Popov, D.; Meshkova, G.; Hristova, P.; Miteva, A.; Ilieva, T.; Dimitrov, H. Line transect surveys of abundance and density of cetaceans in the marine area of the Bulgarian Natura 2000 BG0001001 Ropotamo Site of Community Importance, Black Sea. Acta Zool. Bulg. 2021, 73, 297–304. [Google Scholar]
- Panayotova, M.; Bekova, R.; Prodanov, B. Assessment of marine cetacean populations in Bulgarian Black Sea in 2017 according to indicators of the EU Marine Strategy Framework Directive. Ecol. Balk. 2020, 3, 73–83. [Google Scholar]
- Buckland, S.T. Advanced Distance Sampling: Estimating Abundance of Biological Populations; Oxford University Press: New York, NY, USA, 2004. [Google Scholar]
- Buckland, S.T.; Anderson, D.R.; Burnham, K.P.; Laake, J.L.; Borchers, D.L.; Thomas, L. Introduction to Distance Sampling: Estimating Abundance of Biological Populations (New Edition); OUP Oxford, Oxford: New York, NY, USA, 2001. [Google Scholar]
- Thomas, L.; Buckland, S.T.; Rexstad, E.A.; Laake, J.L.; Strindberg, S.; Hedley, S.L.; Bishop JR, B.; Marques, T.A.; Burnham, K.P. Distance software: Design and analysis of distance sampling surveys for estimating population size. J. Appl. Ecol. 2010, 47, 5–14. [Google Scholar] [CrossRef] [PubMed]
- Buckland, S.T.; Rexstad, E.A.; Marques, T.A.; Oedekoven, C.S. Distance Sampling: Methods and Applications; Springer International Publishing: Cham, Switzerland, 2015. [Google Scholar]
- Akaike, H. A new look at the statistical model identification. IEEE Trans. Autom. Control 1974, 19, 716–723. [Google Scholar] [CrossRef]
- Bushuev, S.G. Depletion of forage reserve as a factor limiting population size of Black Sea dolphins. In Ecological Safety of Coastal and Shelf Areas and a Composite Utilization of Shelf Resources; Proceedings of Marine Hydrophysical Institute: Sevastopol, Ukraine, 2000; pp. 437–452. (In Russian) [Google Scholar]
- Kopaliani, N.; Gurielidze, Z.; Devidze, N.; Ninua, L.; Dekanoidze, D.; Javakhishvili, Z.; Paposhvili, N.; Qerdikoshvili, N. Monitoring of Black Sea cetaceans in Georgian waters. In Study Supported by Kolkheti National Fund. Report to Ministry of Natural Resources and Environment Protection of Georgia; Ilia State University: Tbilisi, Georgia, 2015. [Google Scholar]
- Paiu, R.M.; Olariu, B.; Paiu, A.I.; Mirea Candea, M.E.; Gheorghe, A.M.; Murariu, D. Cetaceans in the coastal waters of southern Romania: Initial assessment of abundance, distribution, and seasonal trends. J. Black Sea/Mediterr. Environ. 2019, 25, 266–279. [Google Scholar]
- Krivokhizhin, S.; Birkun, A., Jr.; Radygin, G. Seasonal variations in distribution and abundance of cetaceans along the coast of south-eastern Crimea. Contemporary Fishing and Ecological Problems in Azov-Black Sea Region. In Proceedings of the 7th International Conference, Kerch, Crimea, 20–23 June 2012; YugNIRO: Odessa, Ukraine, 2012; pp. 115–119. [Google Scholar]
- Mikhalev, Y.A. Characteristics of distribution of the common dolphins, Delphinus delphis (Cetacea), in the Black Sea. Vestn. Zool. 2008, 42, 325–337. [Google Scholar]
- Gladilina, E.; Gol’din, P. Abundance and summer distribution of a local stock of Black Sea bottlenose dolphins, Tursiops truncatus (Cetacea, Delphinidae), in coastal waters near Sudak. Vestn. Zool. 2016, 50, 49–56. [Google Scholar] [CrossRef]
- Gladilina, E.; Vishnyakova, K.; Neprokin, O.; Ivanchikova, Y.; Derkacheva, T.; Kryukova, A.; Savenko, O.; Gol’din, P. Linear transect surveys of abundance and density of cetaceans in the area near the Dzharylgach Island in the North-Western Black Sea. Vestn. Zool. 2017, 514, 335–342. [Google Scholar] [CrossRef] [Green Version]
- Paiu, R.M.; Panigada, S.; Cañadas, A.; Gol`din, P.; Popov, D.; David, L.; Amaha Ozturk, A.; Panayotova, M.; Mirea-Candera, M. Deliverable 2.2.2. Detailed Report on cetacean populations distribution and abundance in the Black Sea, including proposal for threshold values. In CeNoBS Project—Contract No 110661/2018/794677/SUB/ENV.C2; Mare Nostrum NGO: Constanta, Romania, 2021; pp. 1–96. [Google Scholar]


| Species | Number of Sightings | Number of Individuals |
|---|---|---|
| Tursiops truncatus ponticus | 27 | 54 |
| Delphinus delphis ponticus | 39 | 67 |
| Phocoena phocoena relicta | 166 | 218 |
| Unidentified cetacean | 4 | 4 |
| Total | 236 | 343 |
| Parameter | Species | ||
|---|---|---|---|
| T. t. ponticus | P. p. relicta | D. d. ponticus | |
| Goodness-of-fit, CvM, p-value | >0.8 | >0.9 | >0.9 |
| Coefficient of variation (CV) % | 28.67 | 24.19 | 30.26 |
| 95% Confidence Interval (CI) | 0.01979–0.0622 | 0.235–0.663 | 0.049–0.177 |
| Effective strip width (ESW), m | 304.27 | 182.00 | 203.7 |
| Coefficient of variation (CV) % | 17.85 | 6.95 | 18.46 |
| 95% Confidence Interval (CI) | 211.29–438.16 | 158.70–208.72 | 140.58–295.16 |
| Estimate of density of clusters/groups (DS) | 0.105 | 1.083 | 0.227 |
| Coefficient of variation (CV) % | 49.34 | 25.17 | 35.45 |
| 95% Confidence Interval (CI) | 0.039–0.284 | 0.637–1.843 | 0.111–0.464 |
| Estimate of density of animals (D, individuals/km2) | 0.211 | 1.423 | 0.391 |
| Coefficient of variation (CV) % | 52.15 | 25.40 | 36.84 |
| 95% Confidence Interval (CI) | 0.076–0.587 | 0.834–2.427 | 0.187–0.814 |
| Estimate of number of animals in the surveyed area (N) | 1340 | 9045 | 2484 |
| Coefficient of variation (CV) % | 52.15 | 25.40 | 36.84 |
| 95% Confidence Interval (CI) | 481–3735 | 5301–15,433 | 507–1827 |
| Species | Number of Sightings | Number of Individuals |
|---|---|---|
| Tursiops truncatus ponticus | 24 | 57 |
| Delphinus delphis ponticus | 18 | 42 |
| Phocoena phocoena relicta | 81 | 261 |
| Total | 123 | 360 |
| Parameter | Species | ||
|---|---|---|---|
| T. t. ponticus | P. p. relicta | D. d. ponticus | |
| Number of observations (individuals or groups)–coastal/offshore | 19/5 | 14/67 | 15/3 |
| Goodness-of-fit, CvM, p-value | >0.5 | >0.05 | >0.6 |
| Encounter rate (ER; n/L)–coastal shelf | 0.057 | 0.042 | 0.045 |
| Coefficient of variation (CV) % | 46.3 | 31.98 | 43.97 |
| 95% Confidence Interval (CI) | 0.022–0.022 | 0.021–0.084 | 0.018–0.114 |
| Encounter rate (ER; n/L)–offshore shelf | 0.014 | 0.191 | 0.009 |
| Coefficient of variation (CV) % | 67.61 | 46.16 | 48.69 |
| 95% Confidence Interval (CI) | 0.004–0.05 | 0.073–0.502 | 0.003–0.024 |
| Estimate of density of groups (DS)–coastal | 0.077 | 0.073 | 0.071 |
| Coefficient of variation (CV) % | 48.32 | 34.52 | 45.98 |
| 95% Confidence Interval (CI) | 0.029–0.208 | 0.036–0.149 | 0.028–0.183 |
| Estimate of density of groups (DS)–offshore | 0.042 | 0.331 | 0.013 |
| Coefficient of variation (CV) % | 69 | 47.96 | 50.52 |
| 95% Confidence Interval (CI) | 0.005–0.075 | 0.124–0.887 | 0.005–0.038 |
| Estimate of density of animals (D, individuals/km2)–coastal | 0.187 | 0.136 | 0.138 |
| Coefficient of variation (CV) % | 52.13 | 35.82 | 48.59 |
| 95% Confidence Interval (CI) | 0.067–0.526 | 0.0652–0.282 | 0.052–0.366 |
| Estimate of density of animals (D, individuals/km2)–offshore | 0.042 | 1.065 | 0.031 |
| Coefficient of variation (CV), % | 71.07 | 48.82 | 58.04 |
| 95% Confidence Interval (CI) | 0.011–0.168 | 0.394–2.877 | 0.0099–0.1 |
| Estimate of number of animals in the coastal shelf (N) | 1191 | 863 | 878 |
| Coefficient of variation (CV), % | 52.13 | 35.82 | 48.59 |
| 95% Confidence Interval (CI) | 424–3346 | 415–1795 | 331–2329 |
| Estimate of number of animals in the offshore shelf (N) | 243 | 6106 | 180 |
| Coefficient of variation (CV), % | 71.07 | 48.82 | 58.04 |
| 95% Confidence Interval (CI) | 61–965 | 2261–16,488 | 56–574 |
| Estimate of density of animals (D, individuals/km2) in the global shelf | 0.119 | 0.576 | 0.088 |
| Coefficient of variation (CV), % | 45.52 | 43.43 | 42.13 |
| 95% Confidence Interval (CI) | 0.048–0.293 | 0.237–1.401 | 0.038–0.204 |
| Estimate of number of animals in the global shelf (N) | 1434 | 6969 | 1058 |
| Coefficient of variation (CV), % | 45.52 | 43.43 | 42.13 |
| 95% Confidence Interval (CI) | 581–3537 | 2867–16,938 | 454–2466 |
Disclaimer/Publisher’s Note: The statements, opinions and data contained in all publications are solely those of the individual author(s) and contributor(s) and not of MDPI and/or the editor(s). MDPI and/or the editor(s) disclaim responsibility for any injury to people or property resulting from any ideas, methods, instructions or products referred to in the content. |
© 2023 by the authors. Licensee MDPI, Basel, Switzerland. This article is an open access article distributed under the terms and conditions of the Creative Commons Attribution (CC BY) license (https://creativecommons.org/licenses/by/4.0/).
Share and Cite
Popov, D.; Panayotova, M.; Bekova, R.; Dimitrov, H.; Meshkova, G. Seasonal Abundance, Density and Distribution of Cetaceans in the Bulgarian Black Sea Shelf in 2017. Diversity 2023, 15, 229. https://0-doi-org.brum.beds.ac.uk/10.3390/d15020229
Popov D, Panayotova M, Bekova R, Dimitrov H, Meshkova G. Seasonal Abundance, Density and Distribution of Cetaceans in the Bulgarian Black Sea Shelf in 2017. Diversity. 2023; 15(2):229. https://0-doi-org.brum.beds.ac.uk/10.3390/d15020229
Chicago/Turabian StylePopov, Dimitar, Marina Panayotova, Radoslava Bekova, Hristo Dimitrov, and Galina Meshkova. 2023. "Seasonal Abundance, Density and Distribution of Cetaceans in the Bulgarian Black Sea Shelf in 2017" Diversity 15, no. 2: 229. https://0-doi-org.brum.beds.ac.uk/10.3390/d15020229