Article

A Beacon in the Dark: Grey Literature Data Mining and Machine Learning Enlightening Historical Plankton Seasonality Dynamics in the Ligurian Sea

1
Department of Earth, Environmental and Life Sciences (DISTAV), University of Genoa, Corso Europa 26, 16132 Genoa, Italy
2
National Biodiversity Future Center (NBFC), Piazza Marina 61, 90100 Palermo, Italy
3
Italian National Antarctic Museum (MNA, Section of Genoa), Viale Benedetto XV No. 5, 16132 Genoa, Italy
4
Department of Physical Sciences, Earth and Environment (DSFTA), University of Siena, 53100 Siena, Italy
*
Author to whom correspondence should be addressed.
Submission received: 29 February 2024 / Revised: 15 March 2024 / Accepted: 18 March 2024 / Published: 21 March 2024

Abstract

:
The Mediterranean Sea, as one of the world’s most climate-sensitive regions, faces significant environmental changes due to rising temperatures. Zooplankton communities, particularly copepods, play a vital role in marine ecosystems, yet their distribution dynamics remain poorly understood, especially in the Ligurian Sea. Leveraging open-source software and environmental data, this study adapted a methodology to model copepod distributions from 1985 to 1986 in the Portofino Promontory ecosystem using the Random Forest machine learning algorithm to produce the first abundance and distribution maps of the area. Five copepod genera were studied across different trophic guilds, revealing habitat preferences and ecological fluctuations throughout the seasons. The assessment of model accuracy through symmetric mean absolute percentage error (sMAPE) highlighted the variability in copepod dynamics influenced by environmental factors. While certain genera exhibited higher predictive accuracy during specific seasons, others posed challenges due to ecological complexities. This study underscores the importance of species-specific responses and environmental variability in predictive modeling. Moreover, this study represents the first attempt to model copepod distribution in the Ligurian Sea, shedding light on their ecological niches and historical spatial dynamics. The study adhered to FAIR principles, repurposing historical data to generate three-dimensional predictive maps, enhancing our understanding of copepod biodiversity. Future studies will focus on developing abundance distribution models using machine learning and artificial intelligence to predict copepod standing crop in the Ligurian Sea with greater precision. This integrated approach advances knowledge of copepod ecology in the Mediterranean and sets a precedent for integrating historical data with contemporary methodologies to elucidate marine ecosystem dynamics.

1. Introduction

Climate change stands as an escalating and pervasive worldwide threat to biodiversity and ecosystems’ functioning [1], posing an intricate intergovernmental challenge, across various domains, in terms of conservation, management and economical aspects [2]. Major drivers, such as ocean warming and acidification, among others, exert a profound influence on global biodiversity, causing significant alterations in the dynamics of marine communities [3,4,5,6,7,8,9]. Intrinsic characteristics of marine organisms, such as physiological tolerance [10,11,12,13], larval ecology [14,15], ecological plasticity and rapid adaptation to environmental variations [11,16,17,18], are expected to be affect in response to these drivers. Consequential ecological effects are also expected to vary across temporal and spatial scales due to extrinsic factors, such as the rate of environmental change [19,20], the magnitude of environmental variability [21] and the differences in environmental conditions between regions and habitats [22].
The semi-enclosed marine region of Mediterranean Sea, the second largest marine biodiversity hotspot globally [23], is projected to be highly affected by the altering climate conditions at a faster pace than the global average [24]. Although this region represents merely 0.32% of the total ocean volume, its distinctive geomorphological history has resulted in an exceptionally rich biodiversity, encompassing 7–10% of all identified marine species, including a significant proportion of endemic taxa [23,25]. The Mediterranean basin has experienced a significant rise in sea surface temperature (SST) since the beginning of satellite records in 1982, exhibiting a warming trend in the period from 1982 to 2019 at a rate of 0.38 °C per decade [26]. This rate is over three times greater than the global average of 0.11 °C per decade [27]. This presents specific concern and attention to the Mediterranean Sea due to the numerous instances of heat waves [28] triggered by the constant temperature rise. Currently, the average temperature stands at 1.2 ± 0.23 °C (mean ± standard deviation of absolute annual anomalies) higher than the earliest available satellite data (corresponding to the years 1982–1986), indicating a substantial temperature increase [26]. This poses significant risks to the diverse marine life in the region, with notable impacts on biodiversity (e.g., [26,28,29,30]). To efficiently tackle any of these challenges, increasing the resolution of observational and monitoring capacities over relevant spatial, temporal and taxonomic scales is essential. Pelagic ecosystems are the first responder to changing conditions, exhibiting shifts in species distribution across trophic levels [31,32,33,34,35,36]. Environmental changes, such as temperature, salinity and chlorophyll concentration, impact marine life from plankton to mammals. In pelagic ecosystems, zooplankton, particularly copepods, play a crucial role in connecting primary producers to higher-level consumers in marine food webs [37]. The distribution of zooplankton is intricately regulated by various factors, encompassing physical and chemical constraints [38,39]. Additionally, biological interactions, including predator–prey dynamics, symbiosis, parasitism and commensalism, further influence their distribution [40]. Due to the short generation times and fecundity of zooplankton, their populations can rapidly respond (<1 year) to changes in the marine environment [41], of course including those of anthropogenic origin [42]. As a result, marine zooplankton dynamics represent an optimal candidate to inform marine policy and ecosystem management regarding environmental changes [43]. Despite the recognized critical role of zooplankton, challenges persist in assessing their response to climate change, and data accessibility remains a hurdle to gaining a comprehensive dynamic understanding.
Earlier investigations into changes in the planktonic community around the Portofino Promontory in the Ligurian Sea were conducted by Morabito et al. (2018) [44], and a more recent work has been carried out by Vassallo et al. (2021) [45] within the Long-Term Ecological Research (LTER Italia) framework. These studies, with a primary focus on copepods—small crustaceans that typically constitute 70% to 90% of mesozooplankton abundance—aimed to explore the dynamics of this vital ecological component. This study area presents an intricate circulation pattern influenced by wind direction and intensity, as well as the morphological features characterized by the interference of the promontory itself and the narrow continental shelf along the Ligurian coastline.
In this work, we employ prediction-based inferences using a machine learning and artificial intelligence (AI) methods to produce species distribution models (SDMs) [46,47] of the grey literature data from zooplanktonic Fabiano et al. (1988) [48] marine survey of 1985–1986. The digitalization of the historic grey literature not only meets the principles of FAIR data (findability, accessibility, interoperability and reusability) [49] but also makes vital information available to the public. In this context, this work allows us to shift back the zooplankton community information timeline to 20 years from first available data, presenting an important reference baseline for comparison before the trend of increasing temperature was first identified.

2. Materials and Methods
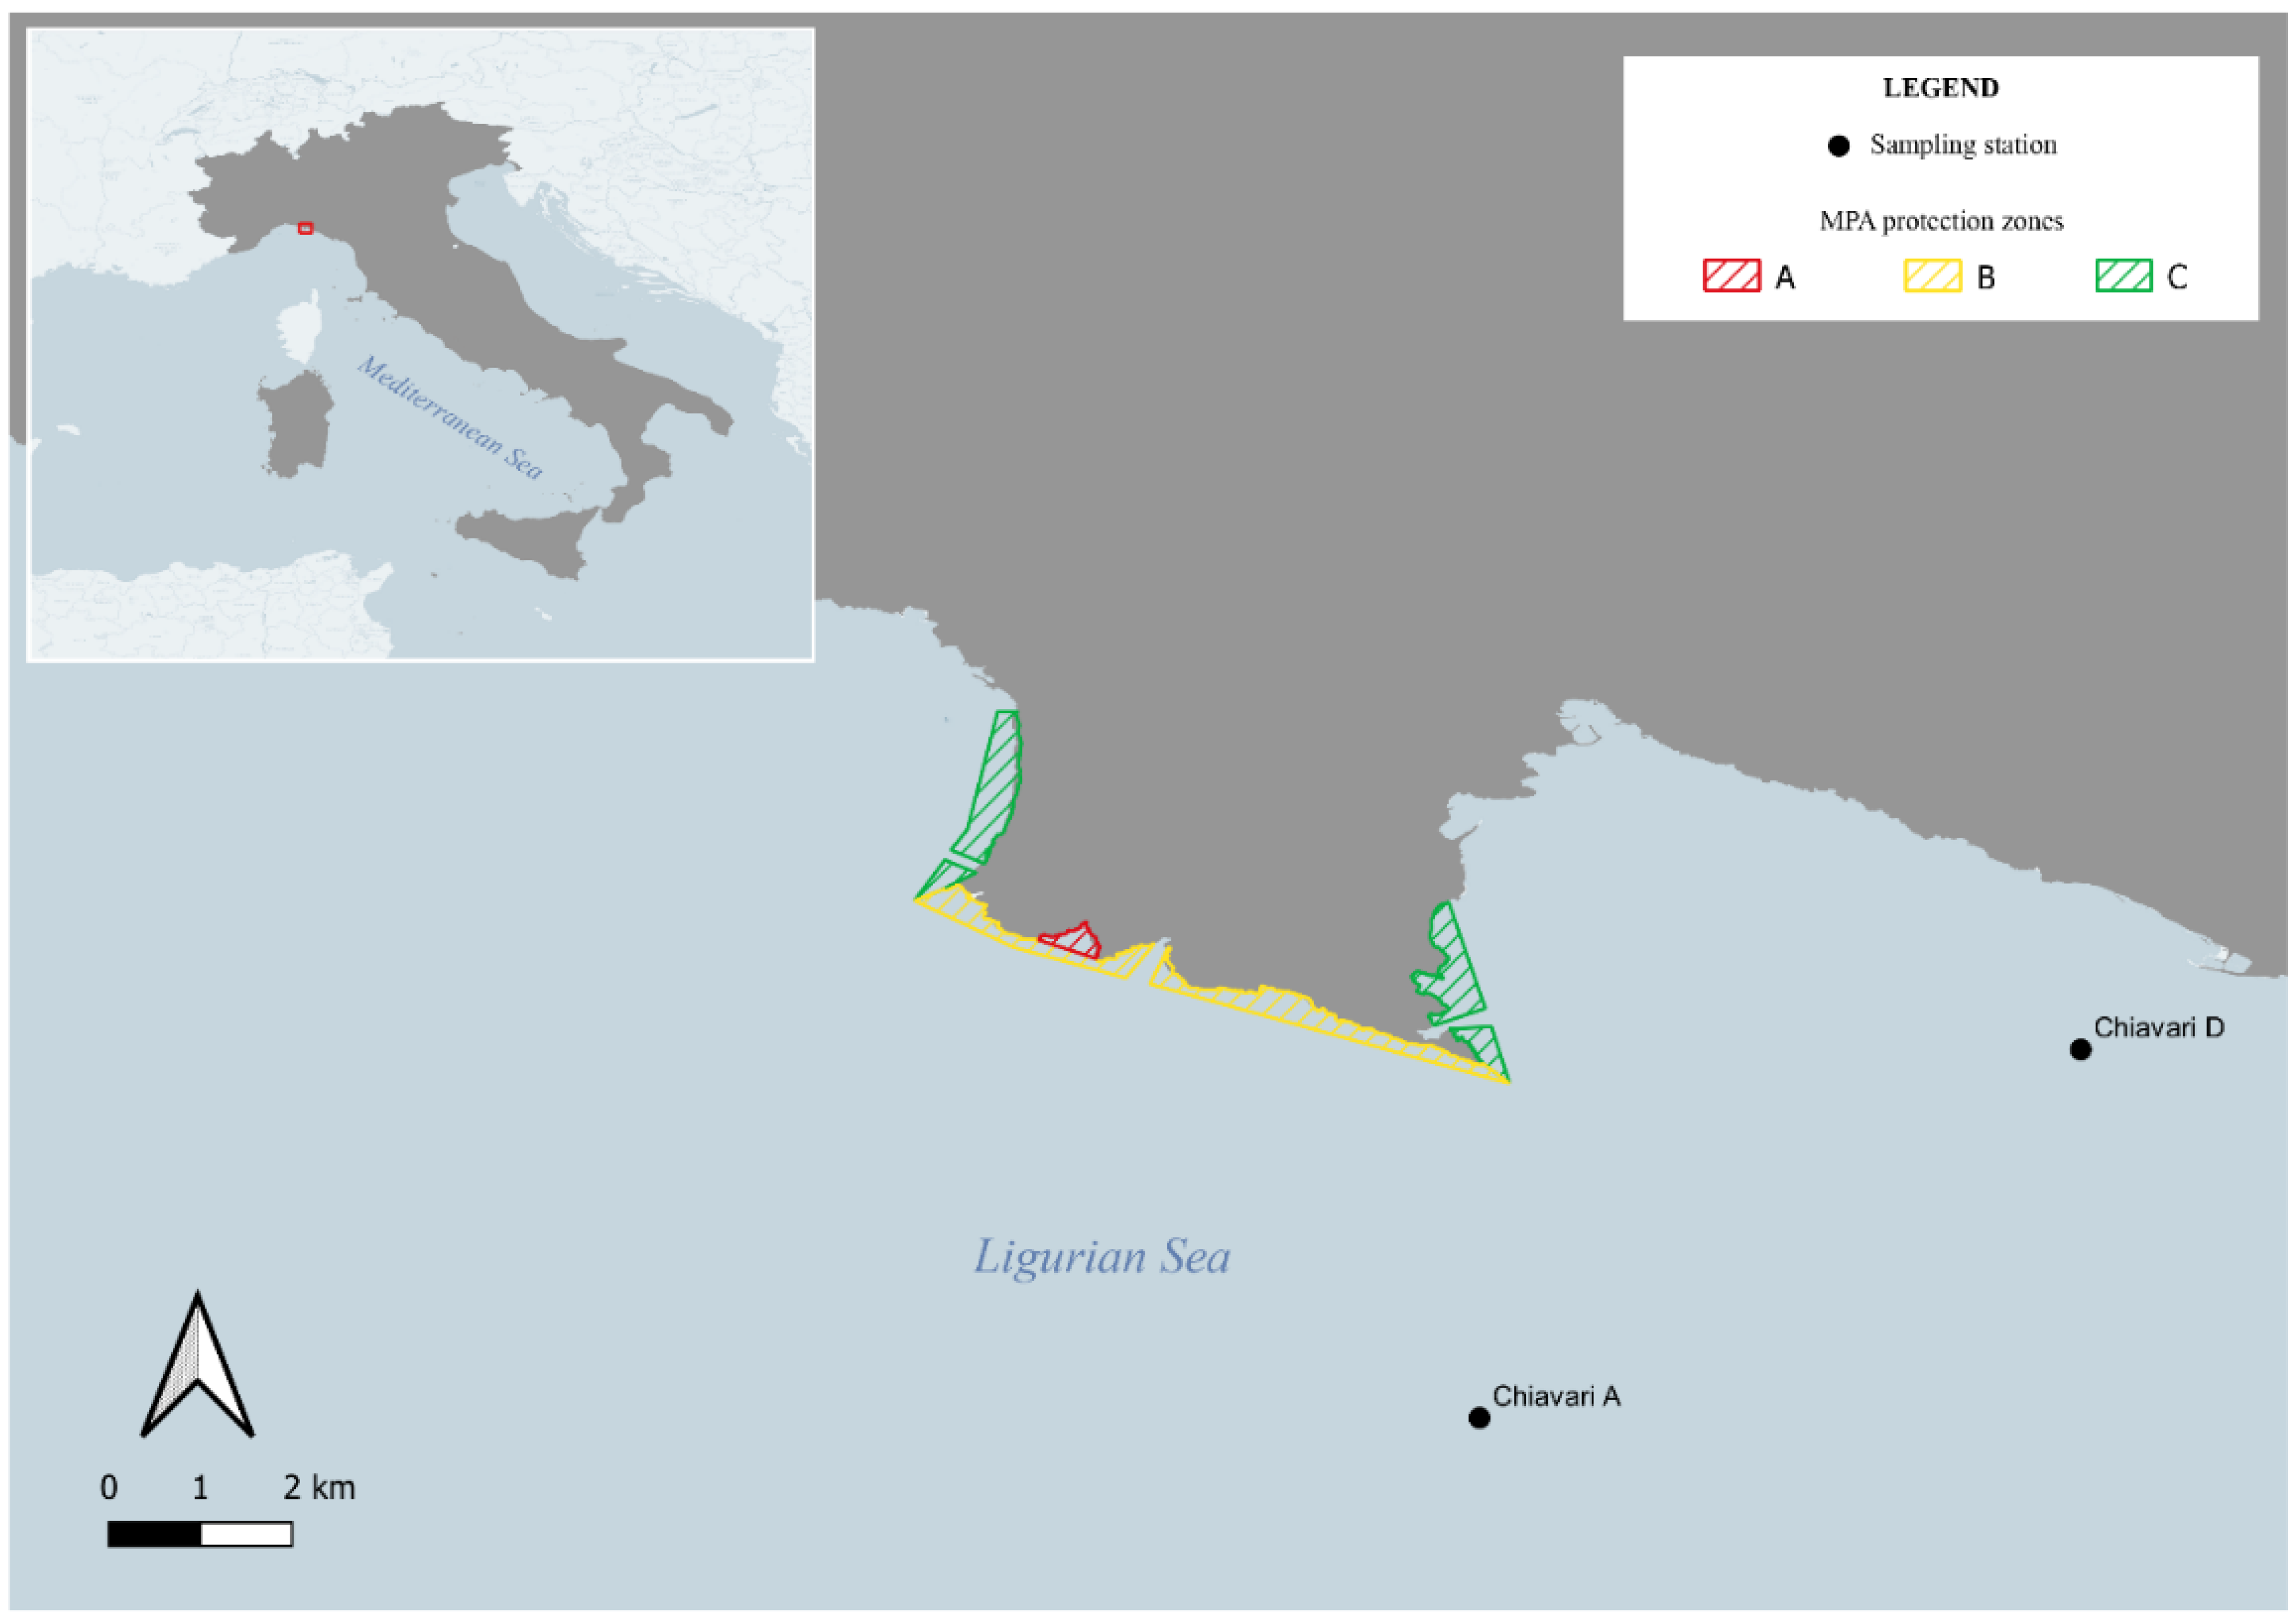
2.1. Study Area

The predominant large-scale characteristic of water dynamics in the Ligurian Sea is a cyclonic circulation that remains active throughout the year. This circulation is notably more vigorous during the winter months compared to summer ones, and it affects both deep and surface layers [50]. While climatic influences can lead to fluctuations in the intensity of fluxes, the overall pattern of this circulation is considered to be relatively constant [51]. This study focuses on the area surrounding the Portofino Promontory, a blunt headland with an abrupt, almost square shape (Figure 1) rising from the sea with very steep slopes. The Portofino Promontory has a very complex circulation due to both meteo-climatic (wind direction and intensity) and hydrodynamic (dominant circulation) forcing, as well as to the interference of the promontory itself together with the narrow continental shelf [52,53,54,55]. Current historical series show that the current off Sestri Levante in winter has a northwest direction (Ligurian Provençal current), consistent at all depths, while on the other side of the promontory, it has the opposite direction (southeast) with some variation in the vertical component. A recirculation or anticyclonic vortex near Camogli is triggered by the prevailing southeast current, as confirmed by historical records and numerical models [52]. Occasional current reversals off Camogli may occur due to local winds. Finally, off the coast of Bogliasco or off 15 km downstream of the promontory, the current again has a northwest direction and consistency at all depths, as confirmed using numerical models [52]. Along the western cape of the Promontory, the primary east-to-west stream can intensify and move away from the promontory under specific wind conditions. Meanwhile, winds originating from the south-southwest have the potential to strengthen coastal circulation within the Gulf of Tigullio. The Gulf receives inputs from several watercourses, resulting in a pronounced state of oligotrophy. This stream serves as a substantial source of freshwater, altering the physical, chemical and biological dynamics of the marine environment, impacting phytoplankton dynamics. In particular, the Entella River mouth, situated approximately 9 km to the east of the promontory, coupled with substantial anthropogenic influences (such as beach nourishment, excessive summer tourism, maritime activities and urban and industrial development), contributes significantly to sediment accumulation and heightened water turbidity, particularly on the eastern side of the promontory [56]. Since 1998, the promontory and its surroundings have been declared a Marine Protected Area (MPA), with the intent to preserve the coastal and marine ecosystem (the MPA’s zonation is showed in Figure 1).

2.2. Data Elaboration and Modeling
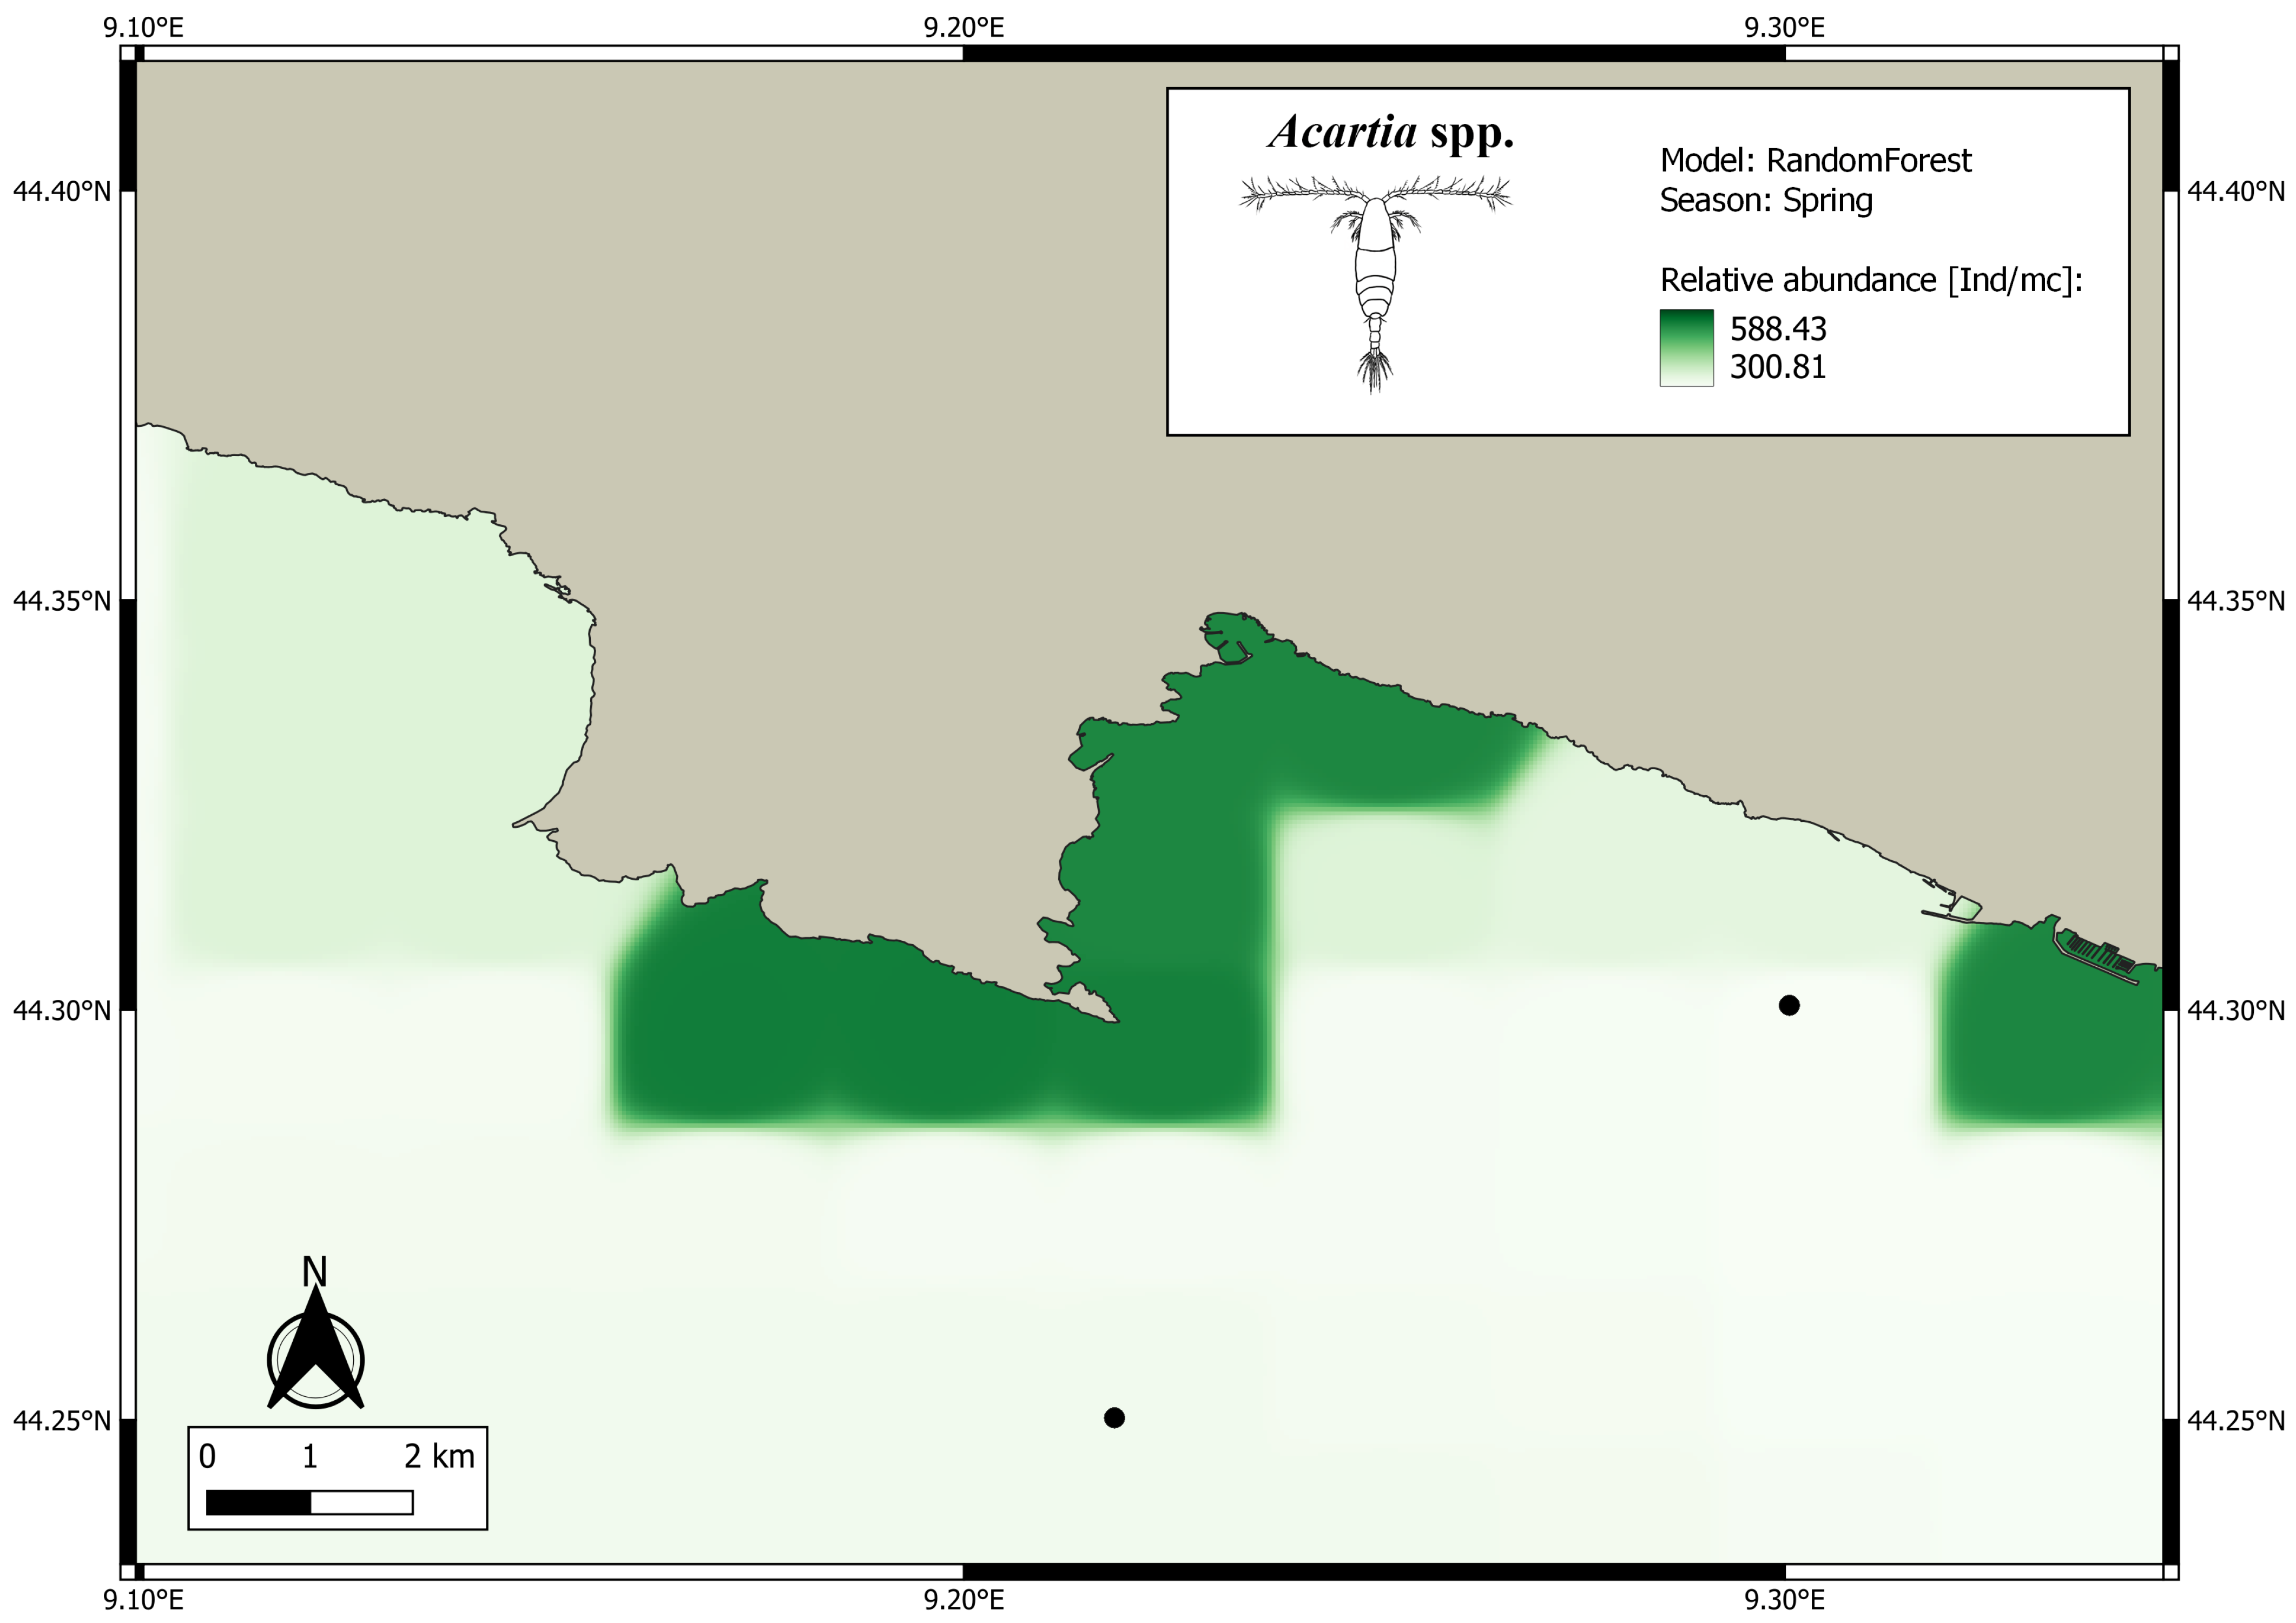
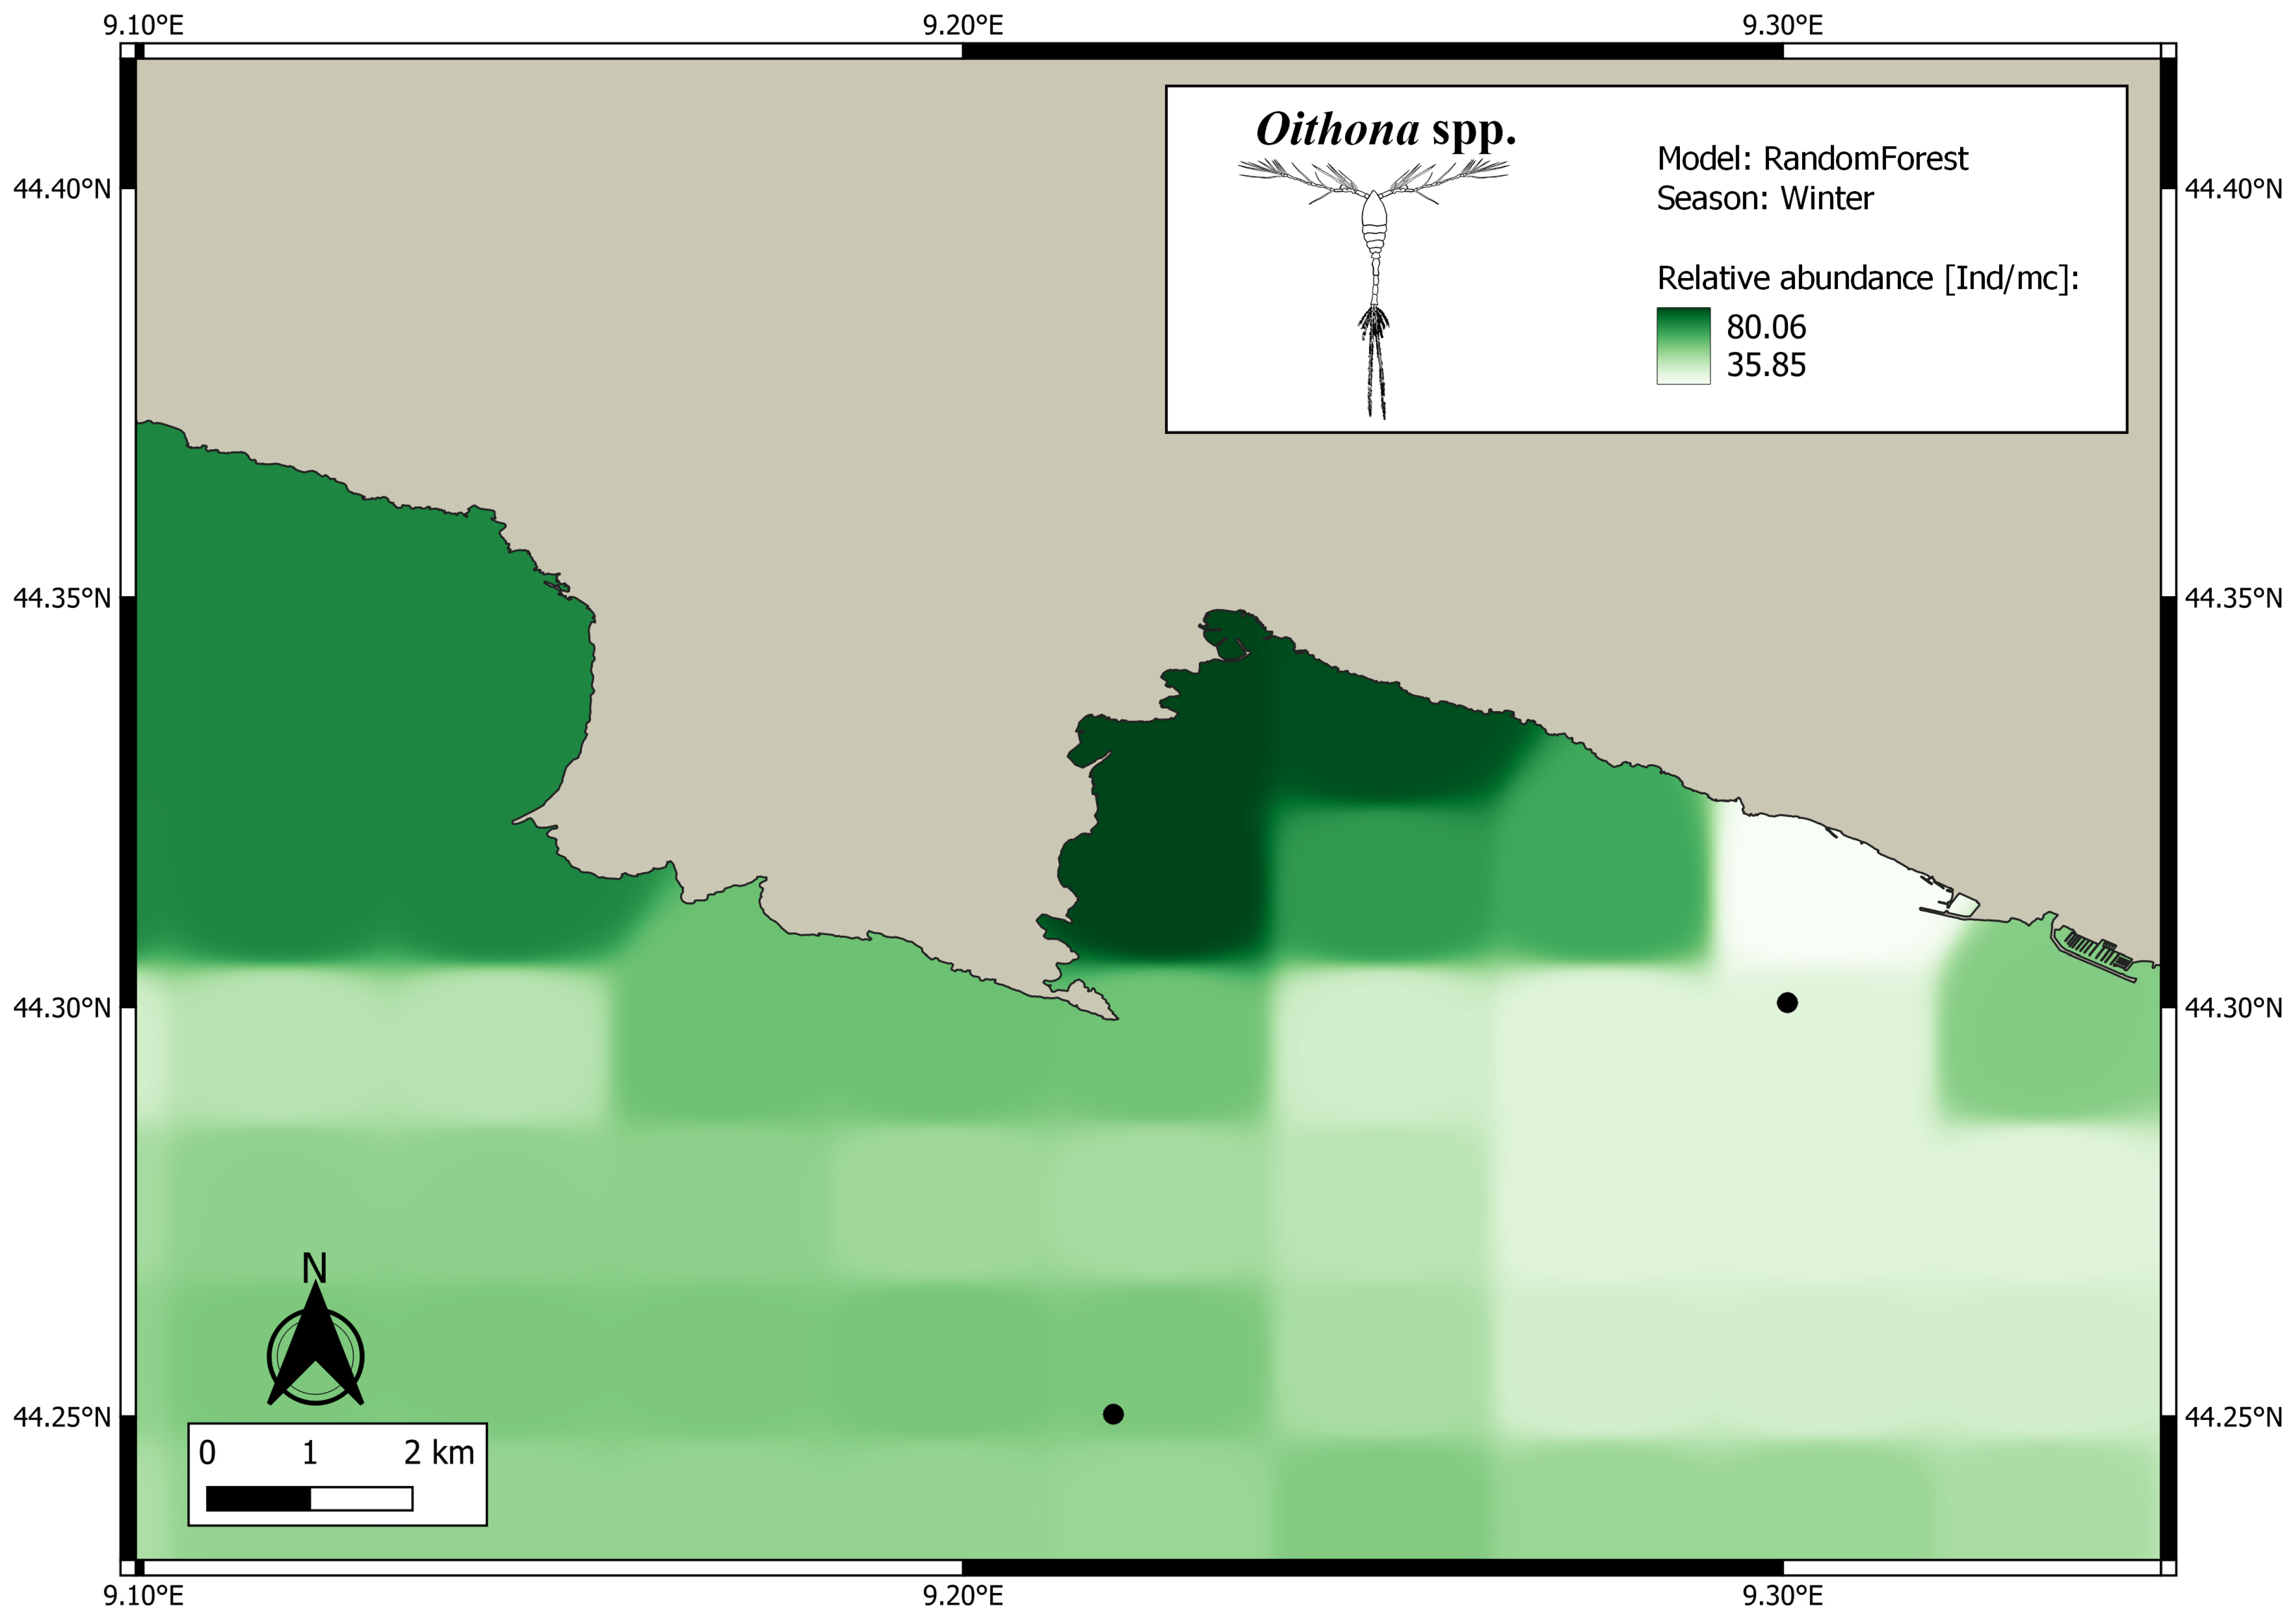
In this study, the data employed were sourced from the grey literature, specifically digitized from the technical report authored by Fabiano et al. in 1988 [48]. The technical report, identified as No. 25 within the series of “Technical reports of the chair of Hydrobiology and Fisheries”, was published by the Institute of Marine Environmental Sciences at the University of Genoa. Following Italian legislation, four copies are deposited at the Prefecture of Genoa and, therefore, readily available upon request (digitized copy is available in Supplementary Materials File S5). Original data collection took place on the Portofino Promontory over a year, from March 1985 to March 1986, with sampling occurring twice a month at fortnightly intervals. Sampling involved the use of paired “Bongo” nets, each featuring a 20 cm diameter mouth and 200 µm mesh, equipped with a General Oceanics Inc. model 2030 flow meter positioned at the net’s center. The nets were towed to the surface for a duration of 20 min in two different locations nominally Chiavari A (44°15′1″ N–9°13′6″ E), located on the 200 m bathymetry, and Chiavari D (44°18′2″ N–9°18′2″ E), located on the 30 m bathymetry. Of the two collected samples, one was preserved in 4% formalin and utilized for both qualitative and quantitative analyses of zooplanktonic organisms. In the analysis, plankton samples were standardized to a constant volume of 500 mL. Following a homogenization procedure, subsamples of known volume were taken to taxonomically define no fewer than one hundred copepods, except in instances from August, September and October, where the count concluded at fifty copepods due to their scarcity. The resulting copepod abundance tables, related to individual per cubic meter (Ind/m3), from this study were digitalized and complemented with environmental data directly extracted from the technical report, when available (e.g., temperature, salinity, chlorophyll). The highest taxonomic resolution achieved in Fabiano et al. (1988) enables the differentiation of organisms in the analyzed samples up to the genus level. However, the absence of physical specimens stored in a permanent collection restricts further taxonomic investigations at the species level and presupposes the possibility of errors associated with misidentifications. Consequently, all analyses in this paper focused on modeling the distribution of copepods at the genus level, considering them to be assemblages of species. Additional proxies to increase the resolution and accuracy of the model were retrieved from the Copernicus Marine Service (https://marine.copernicus.eu/, accessed on 23 January 2024), NASA Earth Observations (https://neo.gsfc.nasa.gov/, accessed on 23 January 2024) and General Bathymetric Chart of the Oceans (https://www.gebco.net/, accessed on 23 January 2024) (See Supplementary Files S2–S4 for details). In our investigation, we employed the methodology proposed in Grillo et al. (2022) [57] with modifications. We utilized open-source software including QGIS [58], R [59] and Ocean Data View (ODV) [60] data exploration, visualization, mapping and modeling, incorporating basemaps where necessary. Geographic data were processed and displayed using the WGS84 EPSG:4326 projection system, facilitating latitude- and longitude-based analysis. To extract environmental descriptor values from the Copernicus Marine Service product layers, we overlaid presence data points onto the attribute table using the “extract multiple values in points” function within the GIS environment. The resulting table served as the basis for modeling copepod distribution using machine learning techniques, with subsequent representation in QGIS. For predictive modeling, we constructed a 1 km point lattice to generate a prediction grid, which was then evaluated using various machine learning algorithms. The environmental descriptors employed were sourced from open-access outlets and detailed in the online resource “Environmental descriptors” (see Appendix B). A Random Forest predictive distribution model was developed in R, drawing comparisons with similar studies such as those by Hardy [61] for Alaska, Meissner [62] for Iceland and Huettmann and Schmid [63] for Antarctica. For the analysis, a regression method was employed synergically with the ‘rpart’ (4.3.2 version) (https://cran.r-project.org/web/packages/rpart/index.html, accessed on 30 January 2024), ‘randomForest’ (4.3.2 version) (https://cran.r-project.org/web/packages/randomForest/index.html, accessed on 30 January 2024) and ‘tidyverse’ (4.3.2 version) (https://cran.r-project.org/web/packages/tidyverse/index.html, accessed on 30 January 2024) packages. We employed the original scripts developed by Guisan, Thuiller and Zimmermann (2017) [64] for predictive distribution analysis, tailoring them to accommodate the specific data matrix utilized in our study. Using the inverse distance weighting (IDW) tool within QGIS, we generated 24 predictive surfaces illustrating the relative abundance values (RA) of selected zooplankton genera across the entire study area, extending beyond the lattice point locations. This process facilitated the creation of a predictive surface grid. Subsequently, the predicted data were imported into ODV software to derive relative predicted abundance profiles for each copepod genus from the surface to the bottom. We focused on a specific section by selecting areas near the Portofino Promontory. By utilizing the gridded field function and DIVA gridding, we extrapolated values for the entire water column based on longitude. Initially, we crafted comprehensive distribution maps for copepods across the four distinct seasons using the complete data matrix. Our subsequent efforts were concentrated on the five most abundant genera of copepods, each representing a distinct trophic strategy (refer to Table 1 for details): Acartia spp., Oithona spp., Centropages spp., Temora spp. and Coryaceus spp.
We aimed to create detailed maps for individual seasons by focusing on these five genera. This was achieved by using the above algorithms and deriving the relative abundance (RA) for the lattice to identify the most suitable habitats for each copepod genus. We extracted the RA values for the analyzed points to assess how well the predictions aligned with the independent field data across the data. The accuracy of the selected models was assessed using the symmetric mean absolute percentage error (sMAPE), which measured the forecast accuracy based on percentage errors (see Table 2) [65,66,67]. sMAPE index was obtained from the ‘Metrics’ package (4.3.2 version) (https://cran.r-project.org/web/packages/Metrics/index.html, accessed on 30 January 2024).

3. Results

We were able to compile, for the first time, a value-added data cube, explicit in time and space, consisting of copepod genera and environmental predictors to be used for model predictions of copepods for the Portofino Promontory area. Our field data consist of five genera with sample sizes, relative sMAPEs (Table 2) and RA values (Appendix A). Most of the sMAPEs obtained showed 70% higher accuracy in the season period investigated, which means that the analyzed models performed well with moderate accuracy.
The symmetric mean absolute percentage error (sMAPE) values present an insightful assessment of the predictive accuracy of copepod distribution models across different seasons and genera within the Portofino Promontory ecosystem. Each season reveals distinct patterns of predictive performance across the copepod genera, offering valuable insights into the underlying ecological dynamics.
In autumn, Acartia spp. demonstrates a relatively moderate sMAPE value of 1.3698, indicating a reasonable level of accuracy in predicting its abundance. Similarly, Centropages spp. and Temora spp. exhibit sMAPE values of 1.0204 and 1.0047, respectively, suggesting a comparable predictive performance. Oithona spp. follows suit with a relatively lower sMAPE of 0.7357, reflecting a closer alignment between the predicted and observed abundances. Notably, Coryceus spp. stands out with a notably low sMAPE value of 0.5111, indicating a high level of predictive accuracy for this species in autumn.
Moving into winter, the predictive performances of the models vary across genera. Acartia spp. and Centropages spp. display relatively lower sMAPE values of 1.0429 and 0.7985, respectively, suggesting a reasonable degree of accuracy in predicting their abundance. Oithona spp. shows a lower sMAPE value of 0.4567, indicating a closer alignment between the predicted and observed abundances compared to other genera. However, Temora spp. and Coryceus spp. exhibit higher sMAPE values of 1.3779 and 0.8969, respectively, suggesting greater discrepancies in the predictive models for these species during winter.
Spring unveils further nuances in predictive accuracy, with Acartia spp. displaying a notably low sMAPE value of 0.4105, indicating a high level of accuracy in predicting its abundance during this season. Centropages spp. follows suit with a moderate sMAPE value of 0.9100, reflecting a relatively consistent predictive performance across seasons. Oithona spp. and Temora spp., however, exhibit higher sMAPE values of 0.5558 and 1.8411, respectively, suggesting challenges in accurately predicting their abundance during spring. Coryceus spp. presents the highest sMAPE value of 1.8448, indicating significant discrepancies between the predicted and observed abundances.
Summer marks a period of increased complexity in copepod dynamics, as reflected in the sMAPE values across genera. Acartia spp. and Oithona spp. display moderate sMAPE values of 0.9639 and 1.0322, respectively, indicating relatively accurate predictions for these species. Conversely, Centropages spp. and Temora spp. exhibit higher sMAPE values of 1.4982 and 1.9648, respectively, suggesting challenges in accurately capturing their abundance during summer. Coryceus spp. stands out with a relatively lower sMAPE value of 0.8390, indicating a comparatively higher level of predictive accuracy for this species in summer.
The following are the two predictive maps that achieved the best sMAPE values in our work (sMAPE < 0.5).
Figure 2 displays the predictive map for Acartia spp., a filter feeder calanoid, during spring (sMAPE = 0.4105), along with the corresponding RA values. Regarding habitat suitability, the sMAPE index indicates high values (0.58) throughout the entire study area. The lowest RA values (300.18 Ind/m3) are observed in the oceanic areas facing the Portofino Promontory, while the highest RA values (588.43 Ind/m3) are found in the southeastern region of the promontory, close to the port and in the neritic zones.
Figure 3 presents the predictive map for Oithona spp., an ambush feeder cyclopoid, during winter (sMAPE = 0.4567), accompanied by the corresponding RA values. Generally, Oithona spp. shows high RA values in all predicted areas. In detail, the highest RA values (80.06 Ind/m3) are concentrated near the coastal zone, with medium-high values (57.95 Ind/m3) observed in the pelagic zone. The lowest values (35.85 Ind/m3) are sporadically found in the western zone and in proximity to the port within the study area.
All predictive distribution maps generated in this study, including those for other genera and various seasons, can be found in Supplementary File S1. Supplementary File S2 presents predictions regarding the abundance of copepods, from the sea surface to the seabed, in the areas close to the Portofino Promontory.

4. Discussion

The Mediterranean Sea, influenced by prominent climate patterns within the global climate system, emerges as one of the region’s most susceptible to the impacts of climate change [68]. The Mediterranean basin plays pivotal role as a heat reservoir, source of moisture and support system for high marine biodiversity [25]. These environmental changes have a significant impact on marine communities, which may react with varying response times. Zooplanktonic communities exhibit sensitivity to environmental changes and react, for example, with biogeographical shifts [69], thus playing crucial roles as environmental indicators [38]. Copepods, among zooplankton, play a vital role in secondary production and grazing rates [70,71]. Understanding their potential distribution is, thus, crucial, given their ecological role as a trophic link between microzooplankton and secondary consumers [72]. However, very few works have been carried out on organisms that occupy the lowest trophic levels of marine food networks, despite their acknowledged paramount ecological role. To date, there is no work in the literature modeling the distribution of abundance or presence of any copepods in the Ligurian Sea. Most studies of species distribution models in Mediterranean or Ligurian Sea, in fact, were focused on secondary consumers, top predators and alien species (e.g., Azzurro et al. 2013 [73], Giannoulaki et al. 2017 [74], Azzolin et al. 2020 [75] and Ranù et al. 2022 [76]).
In this work, we applied the methodology described in Grillo et al. (2022) [57] to the grey literature data from Fabiano et al. (1988) [48], leveraging pre-existing scripts in the scientific literature [64] and environmental data obtained from both the original technical report [48] and the Copernicus Marine Service to produce distribution maps. The inclusion of environmental descriptors sourced from open-access outlets enriched the predictive capacity of the models, which were evaluated by using a Random Forest machine learning algorithm approach (regression method). The focus on the five most abundant genera of copepods across different trophic guilds allowed for the creation of detailed distribution maps for individual seasons, shedding light on their habitat preferences and ecological dynamics. The outcomes derived from the developed models, based on a limited number of actual observation points, stand as a noteworthy achievement in unraveling the ecological intricacies of the Ligurian Sea. The capability to extrapolate meaningful data from a sparse set of observation points not only deepens our understanding of the ecosystem but also highlights the potential of these models as powerful tools for advancing marine ecology research and bolstering conservation initiatives.
The results obtained here by applying the above descripted approach represent a comprehensive and meticulous effort to model copepod distribution in the Portofino Promontory area, utilizing a combination of historical technical report and contemporary machine learning techniques. These “legacy data” enabled obtaining, for the first time, a 3D representation (i.e., with horizontal and vertical distributions) and SDMs for the most important genera of Ligurian Sea copepods in quantitative terms [45,77,78,79], i.e., Acartia, Centropages, Oithona, Temora and Coryacaeus, that have never been studied before in terms of habitat suitability.
The symmetric mean absolute percentage error (sMAPE) provides an assessment of the model accuracy of copepod distribution models in the Portofino Promontory ecosystem across different seasons. The observed variations in sMAPE values highlight the intricate interplay between environmental factors and copepod dynamics, shaping their abundance and distribution patterns. The relatively higher predictive accuracies of certain copepod genera, such as Acartia spp. and Centropages spp., during specific seasons suggest a marked seasonality in their ecological requirements and responses to environmental fluctuations. Conversely, the higher sMAPE values associated with genera like Oithona spp. and Temora spp. across multiple seasons indicate the challenges in accurately predicting their abundance, possibly due to the influence of additional ecological factors and chaotic dynamics, not considered here.
Our sMAPE results underscore the complexity of copepod dynamics within the Portofino Promontory ecosystem and highlight the need for the continued refinement and validation of predictive models to enhance our understanding of marine ecosystem dynamics across different seasons and copepod genera. Greater model accuracy can also be achieved by recognizing the importance of adding an additional level of refinement, working at the species level and incorporating species-specific responses and environmental variability into predictive models for copepod distribution. Future research efforts could focus on refining predictive models by incorporating additional environmental variables and fine-scale habitat features to enhance their accuracy and predictive capacity. Incorporating long-term monitoring data could provide valuable insights into the temporal trends and interannual variability in copepod abundance, aiding the development of more robust predictive models.
The trophic dynamics of Ligurian Sea zooplankton show a typical network of interconnected relationships, starting from the lower trophic levels represented by copepod genera, which are exploited by fishes. Centropages spp., in particular, which is the most abundant calanoid genera studied in temperate neritic zone [80] and present in all coastal stations analyzed here, represents an important element for modeling higher tropic levels. This genus has abundance hotspots in the functioning of seasons but generally, in neritic provinces and near port. Centropages spp., represents up to approx. 6% of the stomach contents of prey [81]. This copepod genus has been found in stomach analyses conducted on small pelagic fish such as Sardina sp. and Sardinella sp. [82], as well as in mesopelagic fish such as Cyclothone braueri [83]. Centropages spp., as well as Acartia spp., Oithona spp., Temora spp. and Coryacaeus spp., are targeted by Engraulis encrasiculus (Linnaeus, 1758) [81], the European anchovy, a very abundant pelagic Engraulidae in Mediterranean fisheries that plays a very important role in marine food webs [84]. The prevalence of copepods in the ecosystem influences the abundance and distribution patterns of higher trophic level organisms, including migratory fish species and apex predators like tuna. This is reflected by the presence of the “Tonnarella di Camogli”, a complex system of fixed nets designed to catch tuna fishes, which has been deployed along the western side of the Portofino Promontory (Golf of Paradise) since XVII Century [85].
This fishing structure obviously benefits from the increased abundance of copepods in the area due to a seasonal persisting vortex. This concentration of copepods, in fact, attracts larger fish, creating a hub of biological activity that extends throughout the food web. The vortex’s influence on current patterns enhances the availability of food, ultimately impacting the movements and feeding behaviors of migratory fish species, whose movements also reflect the direction of the surface currents direction that arise in early spring [53]. The Tonnarella’s exploitation of this dynamic environment capitalizes on the rich food resources provided by copepods, contributing to its significance as a strategic fishing location [86,87] that lasted for 400 years.
By modeling copepods’ historical distributions, we can, thus, potentially discern how fluctuations in copepod populations influence the abundance and occurrence of higher-trophic-level organisms, including large predators like tuna, and obtain relevant data for sustainable fisheries management and ecosystem conservation efforts.
This process, however, is still hampered by our limited understanding of single-species ecologies, which are also greatly differentiated as a consequence of adaptation to different pelagic habitats.
Our data and metadata adhere to the FAIR (findability, accessibility, interoperability and reusability) principles [49]. The generation of three-dimensional predictive maps became feasible through the initial digitization of the “grey literature” data, which were subsequently repurposed to create 3D distributional maps. By adhering to the FAIR principle, distributional data extracted from these historical technical reports were effectively repurposed and recycled. This process significantly enhanced our comprehension of pelagic copepod biodiversity and contributed to refining the accuracy of our chosen models. These datasets will remain searchable, accessible and reusable to the fullest extent possible, providing a lasting glimpse into the structure of copepod diversity in the Ligurian Sea during the 1980s.
In conclusion, future advancements will focus on developing abundance distribution models using machine learning (ML) and artificial intelligence (AI) applications to predict the standing crop in the Ligurian Sea with greater quantitative precision. This effort aims to enhance monitoring capabilities for this area, which holds significance for mankind at a cultural, economic and ecological level. Overall, this approach not only advances our understanding of copepod ecology in the Mediterranean Sea but also serves as a template for integrating historical data with contemporary methodologies to elucidate marine ecosystem dynamics.

Supplementary Materials

The following supporting information can be downloaded via this link: https://0-www-mdpi-com.brum.beds.ac.uk/article/10.3390/d16030189/s1, File S1: Maps; File S2: Predicted data; File S3: Descriptor table; File S4: Raw species presence_absence data with environmental descriptors; File S5: Digitized copy of technical report. References [88,89,90,91] are cited in File S2.

Author Contributions

Conceptualization, A.G., M.B., S.S. and M.G.; methodology, A.G. and M.G.; formal analysis, A.G. and M.G.; resources, M.G.; data acquisition A.G., M.B. and M.G.; data curation, A.G., S.S. and M.G.; writing—original draft preparation, A.G. and M.G.; writing—review and editing, A.G., M.B., S.S. and M.G.; funding acquisition, S.S. All authors have read and agreed to the published version of the manuscript.

Funding

This work was partially funded by the National Recovery and Resilience Plan (NRRP), Mission 4 Component 2 Investment 1.4—Call for tender No. 3138 of 16 December 2021, rectified by Decree No. 3175 of 18 December 2021 of the Italian Ministry of University and Research funded by the European Union—NextGenerationEU. Project code CN_00000033, Spoke 1, Concession Decree No. 1034 of 17 June 2022 adopted by the Italian Ministry of University and Research, Project title “National Biodiversity Future Center—NBFC” (G. Bavestrello).

Institutional Review Board Statement

Not applicable.

Data Availability Statement

All relevant data are presented within the manuscript and the provided Supplementary Materials.

Acknowledgments

We would like to express heartfelt thanks to Mauro Fabiano, the first author of the technical report used in this work, for authorizing the inclusion of the digitized copy of the original document in the Supplementary Materials. We are grateful to the two anonymous reviewers, whose comments and suggestions were of great help for improving the quality of this paper.

Conflicts of Interest

The authors declare no conflicts of interest. The funders had no role in the design of the study; the collection, analyses, or interpretation of data; the writing of the manuscript; and the decision to publish the results.

Appendix A

Appendix B

Seasonal lattice grid (see Supplementary Materials File).

References

  1. Díaz, S.M.; Settele, J.; Brondízio, E.; Ngo, H.; Guèze, M.; Agard, J.; Arneth, A.; Balvanera, P.; Brauman, K.; Butchart, S. The Global Assessment Report on Biodiversity and Ecosystem Services: Summary for Policy Makers; IPBES: Bonn, Germany, 2019. [Google Scholar]
  2. Feliciano, D.; Recha, J.; Ambaw, G.; MacSween, K.; Solomon, D.; Wollenberg, E. Assessment of Agricultural Emissions, Climate Change Mitigation and Adaptation Practices in Ethiopia. Clim. Policy 2022, 22, 427–444. [Google Scholar] [CrossRef]
  3. Parmesan, C. Ecological and Evolutionary Responses to Recent Climate Change. Annu. Rev. Ecol. Evol. Syst. 2006, 37, 637–669. [Google Scholar] [CrossRef]
  4. Hoegh-Guldberg, O.; Bruno, J.F. The Impact of Climate Change on the World’s Marine Ecosystems. Science 2010, 328, 1523–1528. [Google Scholar] [CrossRef] [PubMed]
  5. Doney, S.C.; Ruckelshaus, M.; Emmett Duffy, J.; Barry, J.P.; Chan, F.; English, C.A.; Galindo, H.M.; Grebmeier, J.M.; Hollowed, A.B.; Knowlton, N.; et al. Climate Change Impacts on Marine Ecosystems. Annu. Rev. Mar. Sci. 2012, 4, 11–37. [Google Scholar] [CrossRef]
  6. Russell, B.D.; Harley, C.D.G.; Wernberg, T.; Mieszkowska, N.; Widdicombe, S.; Hall-Spencer, J.M.; Connell, S.D. Predicting Ecosystem Shifts Requires New Approaches That Integrate the Effects of Climate Change across Entire Systems. Biol. Lett. 2012, 8, 164–166. [Google Scholar] [CrossRef]
  7. Nadeau, C.P.; Urban, M.C.; Bridle, J.R. Climates Past, Present, and Yet-to-Come Shape Climate Change Vulnerabilities. Trends Ecol. Evol. 2017, 32, 786–800. [Google Scholar] [CrossRef]
  8. Pecl, G.T.; Araújo, M.B.; Bell, J.D.; Blanchard, J.; Bonebrake, T.C.; Chen, I.-C.; Clark, T.D.; Colwell, R.K.; Danielsen, F.; Evengård, B.; et al. Biodiversity Redistribution under Climate Change: Impacts on Ecosystems and Human Well-Being. Science 2017, 355, eaai9214. [Google Scholar] [CrossRef]
  9. Manes, S.; Costello, M.J.; Beckett, H.; Debnath, A.; Devenish-Nelson, E.; Grey, K.-A.; Jenkins, R.; Khan, T.M.; Kiessling, W.; Krause, C. Endemism Increases Species’ Climate Change Risk in Areas of Global Biodiversity Importance. Biol. Conserv. 2021, 257, 109070. [Google Scholar] [CrossRef]
  10. Pörtner, H.O.; Knust, R. Climate Change Affects Marine Fishes through the Oxygen Limitation of Thermal Tolerance. Science 2007, 315, 95–97. [Google Scholar] [CrossRef]
  11. Hofmann, G.E.; Todgham, A.E. Living in the Now: Physiological Mechanisms to Tolerate a Rapidly Changing Environment. Annu. Rev. Physiol. 2010, 72, 127–145. [Google Scholar] [CrossRef]
  12. Sorte, C.J.; Jones, S.J.; Miller, L.P. Geographic Variation in Temperature Tolerance as an Indicator of Potential Population Responses to Climate Change. J. Exp. Mar. Biol. Ecol. 2011, 400, 209–217. [Google Scholar] [CrossRef]
  13. Minuti, J.J.; Byrne, M.; Hemraj, D.A.; Russell, B.D. Capacity of an Ecologically Key Urchin to Recover from Extreme Events: Physiological Impacts of Heatwaves and the Road to Recovery. Sci. Total Environ. 2021, 785, 147281. [Google Scholar] [CrossRef]
  14. Dupont, S.; Dorey, N.; Thorndyke, M. What Meta-Analysis Can Tell Us about Vulnerability of Marine Biodiversity to Ocean Acidification? Estuar. Coast. Shelf Sci. 2010, 89, 182–185. [Google Scholar] [CrossRef]
  15. Byrne, M.; Przeslawski, R. Multistressor Impacts of Warming and Acidification of the Ocean on Marine Invertebrates’ Life Histories. Integr. Comp. Biol. 2013, 53, 582–596. [Google Scholar] [CrossRef]
  16. Reusch, T.B.H. Climate Change in the Oceans: Evolutionary versus Phenotypically Plastic Responses of Marine Animals and Plants. Evol. Appl. 2014, 7, 104–122. [Google Scholar] [CrossRef]
  17. Leung, J.Y.; Russell, B.D.; Connell, S.D. Adaptive Responses of Marine Gastropods to Heatwaves. One Earth 2019, 1, 374–381. [Google Scholar] [CrossRef]
  18. Leung, J.Y.; Russell, B.D.; Connell, S.D. Linking Energy Budget to Physiological Adaptation: How a Calcifying Gastropod Adjusts or Succumbs to Ocean Acidification and Warming. Sci. Total Environ. 2020, 715, 136939. [Google Scholar] [CrossRef] [PubMed]
  19. Hoffmann, A.A.; Sgrò, C.M. Climate Change and Evolutionary Adaptation. Nature 2011, 470, 479–485. [Google Scholar] [CrossRef] [PubMed]
  20. Silbiger, N.J.; Sorte, C.J. Biophysical Feedbacks Mediate Carbonate Chemistry in Coastal Ecosystems across Spatiotemporal Gradients. Sci. Rep. 2018, 8, 796. [Google Scholar] [CrossRef]
  21. Eriander, L.; Wrange, A.-L.; Havenhand, J.N. Simulated Diurnal pH Fluctuations Radically Increase Variance in—But Not the Mean of—Growth in the Barnacle Balanus Improvisus. ICES J. Mar. Sci. 2016, 73, 596–603. [Google Scholar] [CrossRef]
  22. Boyd, P.W.; Lennartz, S.T.; Glover, D.M.; Doney, S.C. Biological Ramifications of Climate-Change-Mediated Oceanic Multi-Stressors. Nat. Clim. Chang. 2015, 5, 71–79. [Google Scholar] [CrossRef]
  23. Coll, M.; Piroddi, C.; Steenbeek, J.; Kaschner, K.; Ben Rais Lasram, F.; Aguzzi, J.; Ballesteros, E.; Bianchi, C.N.; Corbera, J.; Dailianis, T. The Biodiversity of the Mediterranean Sea: Estimates, Patterns, and Threats. PLoS ONE 2010, 5, e11842. [Google Scholar] [CrossRef] [PubMed]
  24. Chatzimentor, A.; Doxa, A.; Katsanevakis, S.; Mazaris, A.D. Are Mediterranean Marine Threatened Species at High Risk by Climate Change? Glob. Chang. Biol. 2023, 29, 1809–1821. [Google Scholar] [CrossRef] [PubMed]
  25. Bianchi, C.N.; Morri, C. Marine Biodiversity of the Mediterranean Sea: Situation, Problems and Prospects for Future Research. Mar. Pollut. Bull. 2000, 40, 367–376. [Google Scholar] [CrossRef]
  26. Garrabou, J.; Gómez-Gras, D.; Medrano, A.; Cerrano, C.; Ponti, M.; Schlegel, R.; Bensoussan, N.; Turicchia, E.; Sini, M.; Gerovasileiou, V.; et al. Marine Heatwaves Drive Recurrent Mass Mortalities in the Mediterranean Sea. Glob. Chang. Biol. 2022, 28, 5708–5725. [Google Scholar] [CrossRef] [PubMed]
  27. Pörtner, H.-O.; Roberts, D.C.; Masson-Delmotte, V.; Zhai, P.; Tignor, M.; Poloczanska, E.; Weyer, N.M. The Ocean and Cryosphere in a Changing Climate; Special Report on the Ocean and Cryosphere in a Changing Climate; IPCC: Geneva, Switzerland, 2019; Volume 1155. [Google Scholar]
  28. Marbà, N.; Jordà, G.; Agustí, S.; Girard, C.; Duarte, C.M. Footprints of Climate Change on Mediterranean Sea Biota. Front. Mar. Sci. 2015, 2, 56. [Google Scholar] [CrossRef]
  29. Albouy, C.; Guilhaumon, F.; Araújo, M.B.; Mouillot, D.; Leprieur, F. Combining Projected Changes in Species Richness and Composition Reveals Climate Change Impacts on Coastal Mediterranean Fish Assemblages. Glob. Chang. Biol. 2012, 18, 2995–3003. [Google Scholar] [CrossRef]
  30. Albouy, C.; Guilhaumon, F.; Leprieur, F.; Lasram, F.B.R.; Somot, S.; Aznar, R.; Velez, L.; Le Loc’h, F.; Mouillot, D. Projected Climate Change and the Changing Biogeography of Coastal Mediterranean Fishes. J. Biogeogr. 2013, 40, 534–547. [Google Scholar] [CrossRef]
  31. Thomas, M.K.; Kremer, C.T.; Klausmeier, C.A.; Litchman, E. A Global Pattern of Thermal Adaptation in Marine Phytoplankton. Science 2012, 338, 1085–1088. [Google Scholar] [CrossRef]
  32. Hazen, E.L.; Jorgensen, S.; Rykaczewski, R.R.; Bograd, S.J.; Foley, D.G.; Jonsen, I.D.; Shaffer, S.A.; Dunne, J.P.; Costa, D.P.; Crowder, L.B. Predicted Habitat Shifts of Pacific Top Predators in a Changing Climate. Nat. Clim. Chang. 2013, 3, 234–238. [Google Scholar] [CrossRef]
  33. Pinsky, M.L.; Worm, B.; Fogarty, M.J.; Sarmiento, J.L.; Levin, S.A. Marine Taxa Track Local Climate Velocities. Science 2013, 341, 1239–1242. [Google Scholar] [CrossRef]
  34. Barton, A.D.; Irwin, A.J.; Finkel, Z.V.; Stock, C.A. Anthropogenic Climate Change Drives Shift and Shuffle in North Atlantic Phytoplankton Communities. Proc. Natl. Acad. Sci. USA 2016, 113, 2964–2969. [Google Scholar] [CrossRef]
  35. Record, N.R.; Runge, J.A.; Pendleton, D.E.; Balch, W.M.; Davies, K.T.; Pershing, A.J.; Johnson, C.L.; Stamieszkin, K.; Ji, R.; Feng, Z. Rapid Climate-Driven Circulation Changes Threaten Conservation of Endangered North Atlantic Right Whales. Oceanography 2019, 32, 162–169. [Google Scholar] [CrossRef]
  36. Striebel, M.; Kallajoki, L.; Kunze, C.; Wollschläger, J.; Deininger, A.; Hillebrand, H. Marine Primary Producers in a Darker Future: A Meta-analysis of Light Effects on Pelagic and Benthic Autotrophs. Oikos 2023, 2023, e09501. [Google Scholar] [CrossRef]
  37. McGinty, N.; Barton, A.D.; Record, N.R.; Finkel, Z.V.; Johns, D.G.; Stock, C.A.; Irwin, A.J. Anthropogenic Climate Change Impacts on Copepod Trait Biogeography. Glob. Chang. Biol. 2021, 27, 1431–1442. [Google Scholar] [CrossRef]
  38. Hays, G.C.; Richardson, A.J.; Robinson, C. Climate Change and Marine Plankton. Trends Ecol. Evol. 2005, 20, 337–344. [Google Scholar] [CrossRef]
  39. Steinberg, D.K.; Landry, M.R. Zooplankton and the Ocean Carbon Cycle. Annu. Rev. Mar. Sci. 2017, 9, 413–444. [Google Scholar] [CrossRef]
  40. Drago, L.; Panaïotis, T.; Irisson, J.-O.; Babin, M.; Biard, T.; Carlotti, F.; Coppola, L.; Guidi, L.; Hauss, H.; Karp-Boss, L. Global Distribution of Zooplankton Biomass Estimated by in Situ Imaging and Machine Learning. Front. Mar. Sci. 2022, 9, 894372. [Google Scholar] [CrossRef]
  41. Richardson, A.J. In Hot Water: Zooplankton and Climate Change. ICES J. Mar. Sci. 2008, 65, 279–295. [Google Scholar] [CrossRef]
  42. Bedford, J.; Ostle, C.; Johns, D.G.; Atkinson, A.; Best, M.; Bresnan, E.; Machairopoulou, M.; Graves, C.A.; Devlin, M.; Milligan, A.; et al. Lifeform Indicators Reveal Large-scale Shifts in Plankton across the North-West European Shelf. Glob. Chang. Biol. 2020, 26, 3482–3497. [Google Scholar] [CrossRef]
  43. McQuatters-Gollop, A.; Edwards, M.; Helaouët, P.; Johns, D.G.; Owens, N.J.; Raitsos, D.E.; Schroeder, D.; Skinner, J.; Stern, R.F. The Continuous Plankton Recorder Survey: How Can Long-Term Phytoplankton Datasets Contribute to the Assessment of Good Environmental Status? Estuar. Coast. Shelf Sci. 2015, 162, 88–97. [Google Scholar] [CrossRef]
  44. Morabito, G.; Mazzocchi, M.G.; Salmaso, N.; Zingone, A.; Bergami, C.; Flaim, G.; Accoroni, S.; Basset, A.; Bastianini, M.; Belmonte, G. Plankton Dynamics across the Freshwater, Transitional and Marine Research Sites of the LTER-Italy Network. Patterns, Fluctuations, Drivers. Sci. Total Environ. 2018, 627, 373–387. [Google Scholar] [CrossRef] [PubMed]
  45. Vassallo, P.; Bellardini, D.; Castellano, M.; Dapueto, G.; Povero, P. Structure and Functionality of the Mesozooplankton Community in a Coastal Marine Environment: Portofino Marine Protected Area (Liguria). Diversity 2021, 14, 19. [Google Scholar] [CrossRef]
  46. Humphries, G.; Magness, D.R.; Huettmann, F. (Eds.) Machine Learning for Ecology and Sustainable Natural Resource Management; Springer International Publishing: Cham, Switzerland, 2018; ISBN 978-3-319-96976-3. [Google Scholar]
  47. Steiner, M.; Huettmann, F.; Bryans, N.; Barker, B. With Super SDMs (Machine Learning, Open Access Big Data, and The Cloud) towards a More Holistic and Inclusive Inference: Insights from Progressing the Marginalized Case of the World’s Squirrel Hotspots and Coldspots. Sci. Rep. 2024, 14, 5204. [Google Scholar] [CrossRef]
  48. Fabiano, M.; Medica, D.; Ossola, C.; Zunini Sertorio, T. Materiale Particellato e Zooplancton in Acque Superficiali. Chiavari: Marzo 1985–Marzo 1986. Ibid 1988, 25, 14. [Google Scholar]
  49. Culina, A.; Baglioni, M.; Crowther, T.W.; Visser, M.E.; Woutersen-Windhouwer, S.; Manghi, P. Navigating the Unfolding Open Data Landscape in Ecology and Evolution. Nat. Ecol. Evol. 2018, 2, 420–426. [Google Scholar] [CrossRef]
  50. Aliani, S.; Griffa, A.; Molcard, A. Floating Debris in the Ligurian Sea, North-Western Mediterranean. Mar. Pollut. Bull. 2003, 46, 1142–1149. [Google Scholar] [CrossRef] [PubMed]
  51. Astraldi, M.; Gasparini, G.P. The Seasonal Characteristics of the Circulation in the North Mediterranean Basin and Their Relationship with the Atmospheric-climatic Conditions. J. Geophys. Res. 1992, 97, 9531–9540. [Google Scholar] [CrossRef]
  52. Doglioli, A.M.; Magaldi, M.G.; Vezzulli, L.; Tucci, S. Development of a Numerical Model to Study the Dispersion of Wastes Coming from a Marine Fish Farm in the Ligurian Sea (Western Mediterranean). Aquaculture 2004, 231, 215–235. [Google Scholar] [CrossRef]
  53. Doglioli, A.M.; Griffa, A.; Magaldi, M.G. Numerical Study of a Coastal Current on a Steep Slope in Presence of a Cape: The Case of the Promontorio Di Portofino. J. Geophys. Res. 2004, 109, 2004JC002422. [Google Scholar] [CrossRef]
  54. Vietti, R.C.; Albertelli, G.; Aliani, S.; Bava, S.; Bavestrello, G.; Cecchi, L.B.; Bianchi, C.N.; Bozzo, E.; Capello, M.; Castellano, M.; et al. The Ligurian Sea: Present Status, Problems and Perspectives. Chem. Ecol. 2010, 26, 319–340. [Google Scholar] [CrossRef]
  55. Cattaneo-Vietti, R.; Cappanera, V.; Castellano, M.; Povero, P. Yield and Catch Changes in a M Editerranean Small Tuna Trap: A Warming Change Effect? Mar. Ecol. 2015, 36, 155–166. [Google Scholar] [CrossRef]
  56. Oprandi, A.; Mucerino, L.; De Leo, F.; Bianchi, C.N.; Morri, C.; Azzola, A.; Benelli, F.; Besio, G.; Ferrari, M.; Montefalcone, M. Effects of a Severe Storm on Seagrass Meadows. Sci. Total Environ. 2020, 748, 141373. [Google Scholar] [CrossRef]
  57. Grillo, M.; Huettmann, F.; Guglielmo, L.; Schiaparelli, S. Three-Dimensional Quantification of Copepods Predictive Distributions in the Ross Sea: First Data Based on a Machine Learning Model Approach and Open Access (FAIR) Data. Diversity 2022, 14, 355. [Google Scholar] [CrossRef]
  58. Team: QGIS Geographic Information System; Open Source Geospat. Found Proj. 2020. Available online: https://qgis.org/en/site/ (accessed on 1 February 2024).
  59. R Core Team. R: A Language and Environment for Statistical Computing; R Foundation for Statistical Computing: Vienna, Austria, 2010. [Google Scholar]
  60. Schlitzer, R. Ocean Data View 4.0. Oceanography 1998, 11, 19–21. [Google Scholar]
  61. Hardy, S.M.; Lindgren, M.; Konakanchi, H.; Huettmann, F. Predicting the distribution and ecological niche of unexploited snow crab (Chionoecetes opilio) populations in Alaskan waters: A first open-access ensemble model. Integr. Comp. Biol. 2011, 51, 608–622. [Google Scholar] [CrossRef]
  62. Meißner, K.; Fiorentino, D.; Schnurr, S.; Arbizu, P.M.; Huettmann, F.; Holst, S.; Brix, S.; Svavarsson, J. Distribution of Benthic Marine Invertebrates at Northern latitudes―An Evaluation Applying Multi-Algorithm Species Distribution Models. J. Sea Res. 2014, 85, 241–254. [Google Scholar] [CrossRef]
  63. Huettmann, F.; Schmid, M. 9.1. Climate Change and Predictions of Pelagic Biodiversity Components. Biogeogr. Atlas South. Ocean. Sci. Comm. Antarct. Res. Camb 2014, 16, 470–475. [Google Scholar]
  64. Guisan, A.; Thuiller, W.; Zimmermann, N.E. Habitat Suitability and Distribution Models: With Applications in R; Ecology, Biodiversity and Conservation; Cambridge University Press: Cambridge, UK, 2017; ISBN 978-0-521-76513-8. [Google Scholar]
  65. Kim, S.; Kim, H. A New Metric of Absolute Percentage Error for Intermittent Demand Forecasts. Int. J. Forecast. 2016, 32, 669–679. [Google Scholar] [CrossRef]
  66. Armstrong, J.S. Long-Range Forecasting: From Crystal Ball to Computer; Wiley-Interscience: Hoboken, NJ, USA, 1985. [Google Scholar]
  67. Chicco, D.; Warrens, M.J.; Jurman, G. The Coefficient of Determination R-Squared Is More Informative than SMAPE, MAE, MAPE, MSE and RMSE in Regression Analysis Evaluation. PeerJ Comput. Sci. 2021, 7, e623. [Google Scholar] [CrossRef]
  68. Houghton, J.T.; Ding, Y.; Griggs, D.J.; Noguer, M.; van der Linden, P.J.; Dai, X.; Maskell, K.; Johnson, C.A. Climate Change 2001: The Scientific Basis; Cambridge University Press: Cambridge, UK, 2001; Volume 881. [Google Scholar]
  69. Edwards, M. Sea Life (Pelagic and Planktonic Ecosystems) as an Indicator of Climate and Global Change. In Climate Change; Elsevier: Amsterdam, The Netherlands, 2009; pp. 233–251. ISBN 978-0-444-53301-2. [Google Scholar]
  70. Carli, A.; Feletti, M.; Pane, L. Zooplankton Biomass and Copepod Abundance of Terra Nova Bay, Ross Sea Antarctic Campaign 1994/1995. Terra Antarct. Rep. B 2002, 1, 51–55. [Google Scholar]
  71. Barton, A.D.; Pershing, A.J.; Litchman, E.; Record, N.R.; Edwards, K.F.; Finkel, Z.V.; Kiørboe, T.; Ward, B.A. The Biogeography of Marine Plankton Traits. Ecol. Lett. 2013, 16, 522–534. [Google Scholar] [CrossRef]
  72. Turner, J.T. The Importance of Small Planktonic Copepods and Their Roles in Pelagic Marine Food Webs. Zool. Stud 2004, 43, 255–266. [Google Scholar]
  73. Azzurro, E.; Soto, S.; Garofalo, G.; Maynou, F. Fistularia Commersonii in the Mediterranean Sea: Invasion History and Distribution Modeling Based on Presence-Only Records. Biol. Invasions 2013, 15, 977–990. [Google Scholar] [CrossRef]
  74. Giannoulaki, M.; Markoglou, E.; Valavanis, V.D.; Alexiadou, P.; Cucknell, A.; Frantzis, A. Linking Small Pelagic Fish and Cetacean Distribution to Model Suitable Habitat for Coastal Dolphin Species, Delphinus Delphis and Tursiops Truncatus, in the Greek Seas (Eastern Mediterranean). Aquat. Conserv. 2017, 27, 436–451. [Google Scholar] [CrossRef]
  75. Azzolin, M.; Arcangeli, A.; Cipriano, G.; Crosti, R.; Maglietta, R.; Pietroluongo, G.; Saintingan, S.; Zampollo, A.; Fanizza, C.; Carlucci, R. Spatial Distribution Modelling of Striped Dolphin (Stenella coeruleoalba) at Different Geographical Scales within the EU Adriatic and Ionian Sea Region, Central-eastern Mediterranean Sea. Aquat. Conserv. 2020, 30, 1194–1207. [Google Scholar] [CrossRef]
  76. Ranù, M.; Vanacore, A.; Mandich, A.; Alessi, J. Bottlenose Dolphins and Seabirds Distribution Analysis for the Identification of a Marine Biodiversity Hotspot in Agrigento Waters. J. Mar. Sci. Eng. 2022, 10, 345. [Google Scholar] [CrossRef]
  77. Licandro, P.; Ibanez, F. Changes of Zooplankton Communities in the Gulf of Tigullio (Ligurian Sea, Western Mediterranean) from 1985 to 1995. Influence of Hydroclimatic Factors. J. Plankton Res. 2000, 22, 2225–2253. [Google Scholar] [CrossRef]
  78. Pane, L.; Boccardo, S.; Bonfiglioli, F.; Mariottini, G.L.; Priano, F.; Conio, O. Polycyclic Aromatic Hydrocarbons in Water, Seston and Copepods in a Harbour Area in the Western Mediterranean (Ligurian Sea). Mar. Ecol. 2005, 26, 89–99. [Google Scholar] [CrossRef]
  79. Zagami, G.; Granata, A.; Brugnano, C.; Minutoli, R.; Bonanzinga, V.; Guglielmo, L. Spring Copepod Vertical Zonation Pattern and Diel Migration in the Open Ligurian Sea (North-Western Mediterranean). Prog. Oceanogr. 2020, 183, 102297. [Google Scholar] [CrossRef]
  80. Mazzocchi, M.G.; Dubroca, L.; García-Comas, C.; Capua, I.D.; Ribera d’Alcalà, M. Stability and Resilience in Coastal Copepod Assemblages: The Case of the Mediterranean Long-Term Ecological Research at Station MC (LTER-MC). Prog. Oceanogr. 2012, 97–100, 135–151. [Google Scholar] [CrossRef]
  81. Borme, D.; Tirelli, V.; Brandt, S.; Fonda Umani, S.; Arneri, E. Diet of Engraulis Encrasicolus in the Northern Adriatic Sea (Mediterranean): Ontogenetic Changes and Feeding Selectivity. Mar. Ecol. Prog. Ser. 2009, 392, 193–209. [Google Scholar] [CrossRef]
  82. Lillia, M.; Hafferssas, A.; Hamri, F.; Alioua, Z.; Yacine, K.G.E. Importance of Copepods in the Diet of Sardina Pilchardus and Sardinella Aurita: Preliminary Investigation in Bou Ismail Bay (Algerian Basin—SW Mediterranean Sea). Thalassas 2024, 1–17. [Google Scholar] [CrossRef]
  83. Granata, A.; Bergamasco, A.; Zagami, G.; Guglielmo, R.; Bonanzinga, V.; Minutoli, R.; Geraci, A.; Pagano, L.; Swadling, K.; Battaglia, P.; et al. Daily Vertical Distribution and Diet of Cyclothone braueri (Gonostomatidae) in the Polcevera Submarine Canyon (Ligurian Sea, North-Western Mediterranean). Deep Sea Res. Part I Oceanogr. Res. Pap. 2023, 199, 104113. [Google Scholar] [CrossRef]
  84. Coll, M.; Santojanni, A.; Palomera, I.; Tudela, S.; Arneri, E. An Ecological Model of the Northern and Central Adriatic Sea: Analysis of Ecosystem Structure and Fishing Impacts. J. Mar. Syst. 2007, 67, 119–154. [Google Scholar] [CrossRef]
  85. La Tonnarella e La Pesca Tradizionale a Camogli—Riccardo Vietti Cattaneo, Simone Bava—Libro Le Mani-Microart’S 2009, Le Mani. Natura, Ambiente, Flora e Fauna | Libraccio. Available online: https://www.libraccio.it/libro/9788880124948/riccardo-vietti-cattaneo-simone-bava/tonnarella-e-pesca-tradizionale-a-camogli.html (accessed on 29 February 2024).
  86. Relini, M.; Palandri, G.; ORSI, L. Monitoraggio Di Grandi Pesci Pelagici Dalla Tonnarella Di Camogli: Il Caso Della Palamita, Sarda Sarda (Bloch). Biol. Mar. Mediterr 2007, 14, 116–117. [Google Scholar]
  87. Plandri, G.; Lanteri, L.; Garibaldi, F.; Relini, L.O. Biological Parameters of Bullet Tuna in the Ligurian Sea. Collect. Vol. Sci. Pap. ICCAT 2009, 64, 2272–2279. [Google Scholar]
  88. Escudier, R.; Clementi, E.; Omar, M.; Cipollone, A.; Pistoia, J.; Aydogdu, A.; Drudi, M.; Grandi, A.; Lyubartsev, V.; Lecci, R.; et al. Mediterranean Sea Physical Reanalysis (CMEMS MED-Currents) (Version 1) [Data Set]; Copernicus Monitoring Environment Marine Service (CMEMS): Ramonville-Saint-Agne, France, 2020. [Google Scholar]
  89. Escudier, R.; Clementi, E.; Cipollone, A.; Pistoia, J.; Drudi, M.; Grandi, A.; Lyubartsev, V.; Lecci, R.; Aydogdu, A.; Delrosso, D.; et al. A High Resolution Reanalysis for the Mediterranean Sea. Front. Earth Sci. 2021, 9, 1060. [Google Scholar] [CrossRef]
  90. Nigam, T.; Escudier, R.; Pistoia, J.; Aydogdu, A.; Omar, M.; Clementi, E.; Cipollone, A.; Drudi, M.; Grandi, A.; Mariani, A.; et al. Mediterranean Sea Physical Reanalysis INTERIM (CMEMS MED-Currents, E3R1i System) (Version 1) [Data Set]; Copernicus Monitoring Environment Marine Service (CMEMS): Ramonville-Saint-Agne, France, 2021. [Google Scholar]
  91. Chau, T.T.T.; Gehlen, M.; Chevallier, F. A seamless ensemble-based reconstruction of surface ocean pCO2 and air–sea CO2 fluxes over the global coastal and open oceans. Biogeosciences 2022, 19, 1087–1109. [Google Scholar] [CrossRef]
Figure 1. Study area. Black dots are original sampling stations from Fabiano et al. (1988) [48]. Portofino MPA marine protection zones are shown on the map (red = zone A, No-Take Zone; yellow = zone B, Sustainable Use Zone; green = zone C, Transition Zone).
Diversity 16 00189 g001
Figure 2. Predictive map for Acartia spp., a filter feeder calanoid, during spring (sMAPE = 0.4105), along with the corresponding RA values (expressed as Individuals/m3). Black dots are original sampling stations from Fabiano et al. (1988) [48].
Diversity 16 00189 g002
Figure 3. Predictive map for Oithona spp., an ambush feeder cyclopoid, during winter (sMAPE = 0.4567), accompanied by the corresponding RA values (expressed as Individuals//m3). Black dots are the original sampling stations from Fabiano et al. (1988) [48].
Diversity 16 00189 g003
Table 1. Genera analyzed in the present work. In this work, we analyzed the distribution of copepods at the genus level, considering them to be assemblages of species. AphiaID was from the World Register of Marine Species (https://www.marinespecies.org, accessed on 21 February 2024).
FamilyGenusWorms Aphia IDTrophic Guilds
AcartiidaeAcartia spp. Dana, 1846104108Filter feeder
OithonidaeOithona spp. Baird, 1843106485Ambush feeder
CentropagidaeCentropages spp. Krøyer, 1849104081Suspension feeder
TemoridaeTemora spp. Baird, 1850104241Filter feeder/Ambush feeder
CorycaeidaeCorycaceus spp. Dana, 1845128634Predator
Table 2. Genera list with sMAPE index accuracy values for each season. Red (very poor), orange (poor), yellow (good) and green (very good). sMAPE classes were modeled based on Chicco, Warrens and Jurman (2021).
sMAPE Index
SeasonAcartia spp.Centropages spp.Oithona spp.Temora spp.Coryceus spp.
Autumn1.36981.02040.73571.00470.5111
Winter1.04290.79850.45671.37790.8969
Spring0.41050.91000.55581.84111.8448
Summer0.96391.49821.03221.96480.8390
Disclaimer/Publisher’s Note: The statements, opinions and data contained in all publications are solely those of the individual author(s) and contributor(s) and not of MDPI and/or the editor(s). MDPI and/or the editor(s) disclaim responsibility for any injury to people or property resulting from any ideas, methods, instructions or products referred to in the content.

