Storm-Drain and Manhole Detection Using the RetinaNet Method

 ,
,  , , ,
, , ,  ,
,  and
and
Abstract
:1. Introduction
- The state-of-the-art DL method RetinaNet is investigated to detect Storm-drain and Manhole;
- RetinaNet is compared to Faster R-CNN, which was used for the same purpose in previous research;
- ResNet-50 and ResNet-101 backbones were assessed and;
- The data set is publicly provided for future investigations in https://sites.google.com/view/geomatics-and-computer-vision/home/datasets.
2. Material and Methods
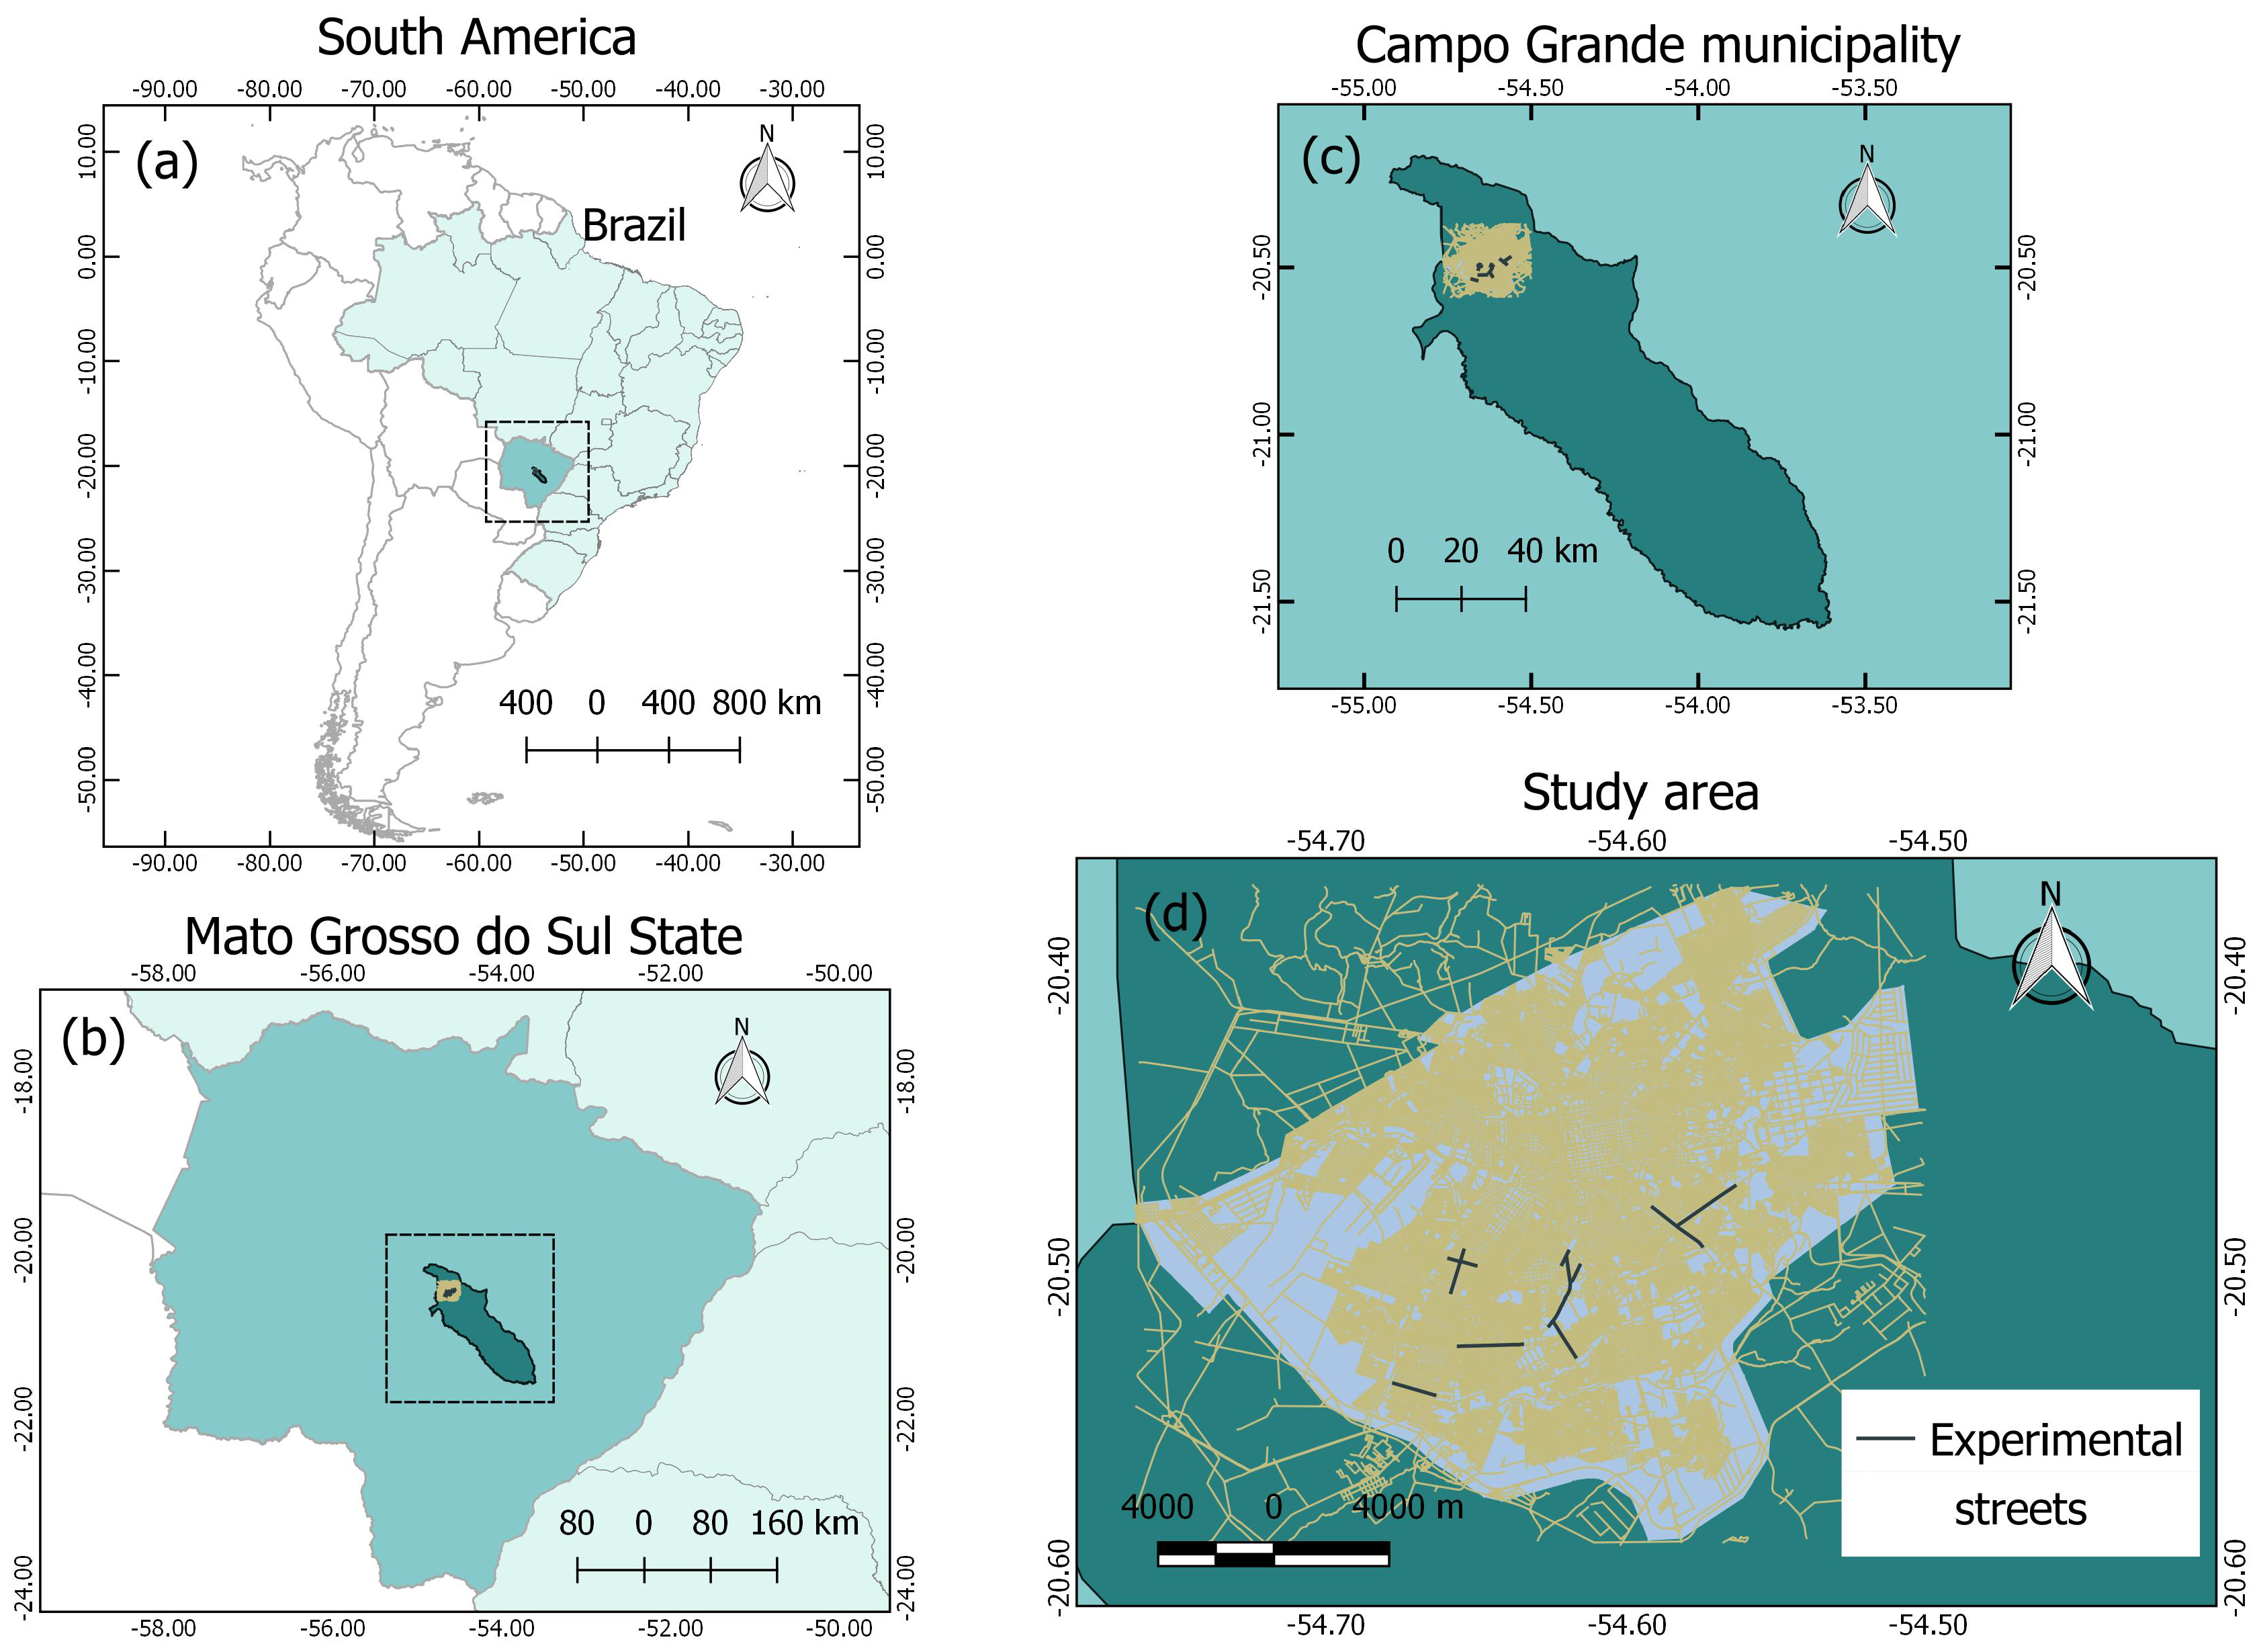
2.1. Study Area
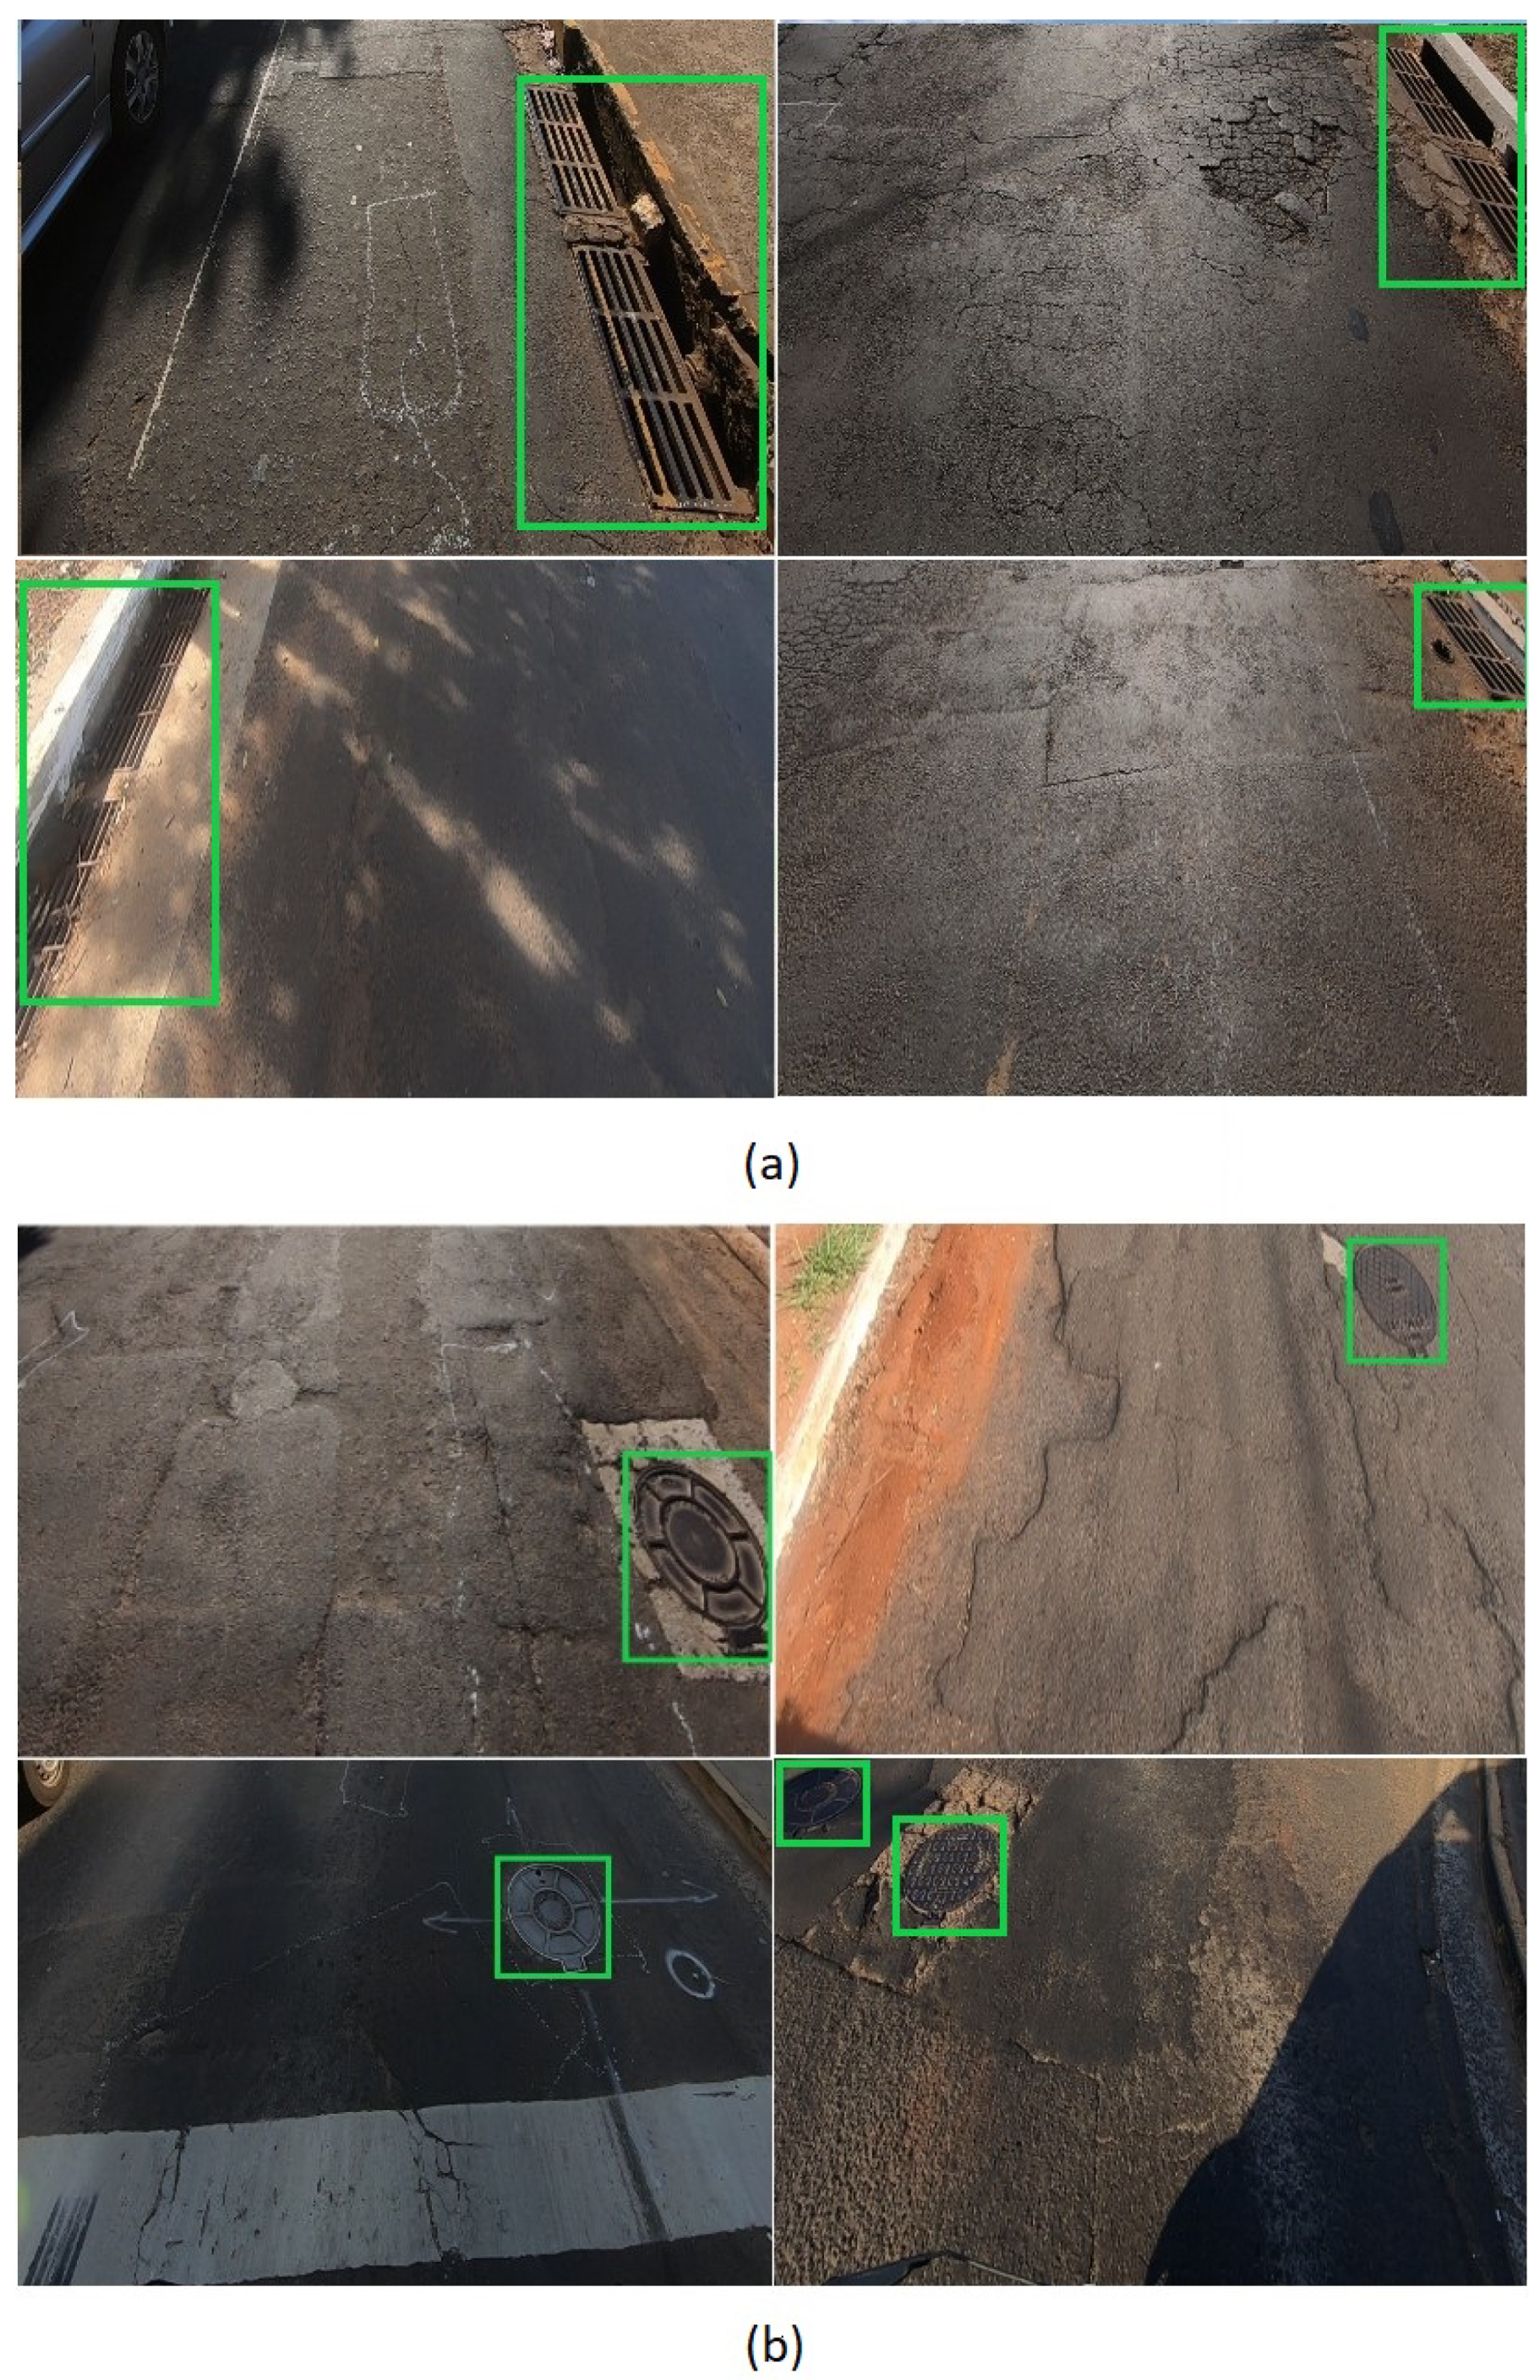
2.2. Image Dataset
2.3. Object Detection Method
2.4. Method Assessment
3. Results and Discussions
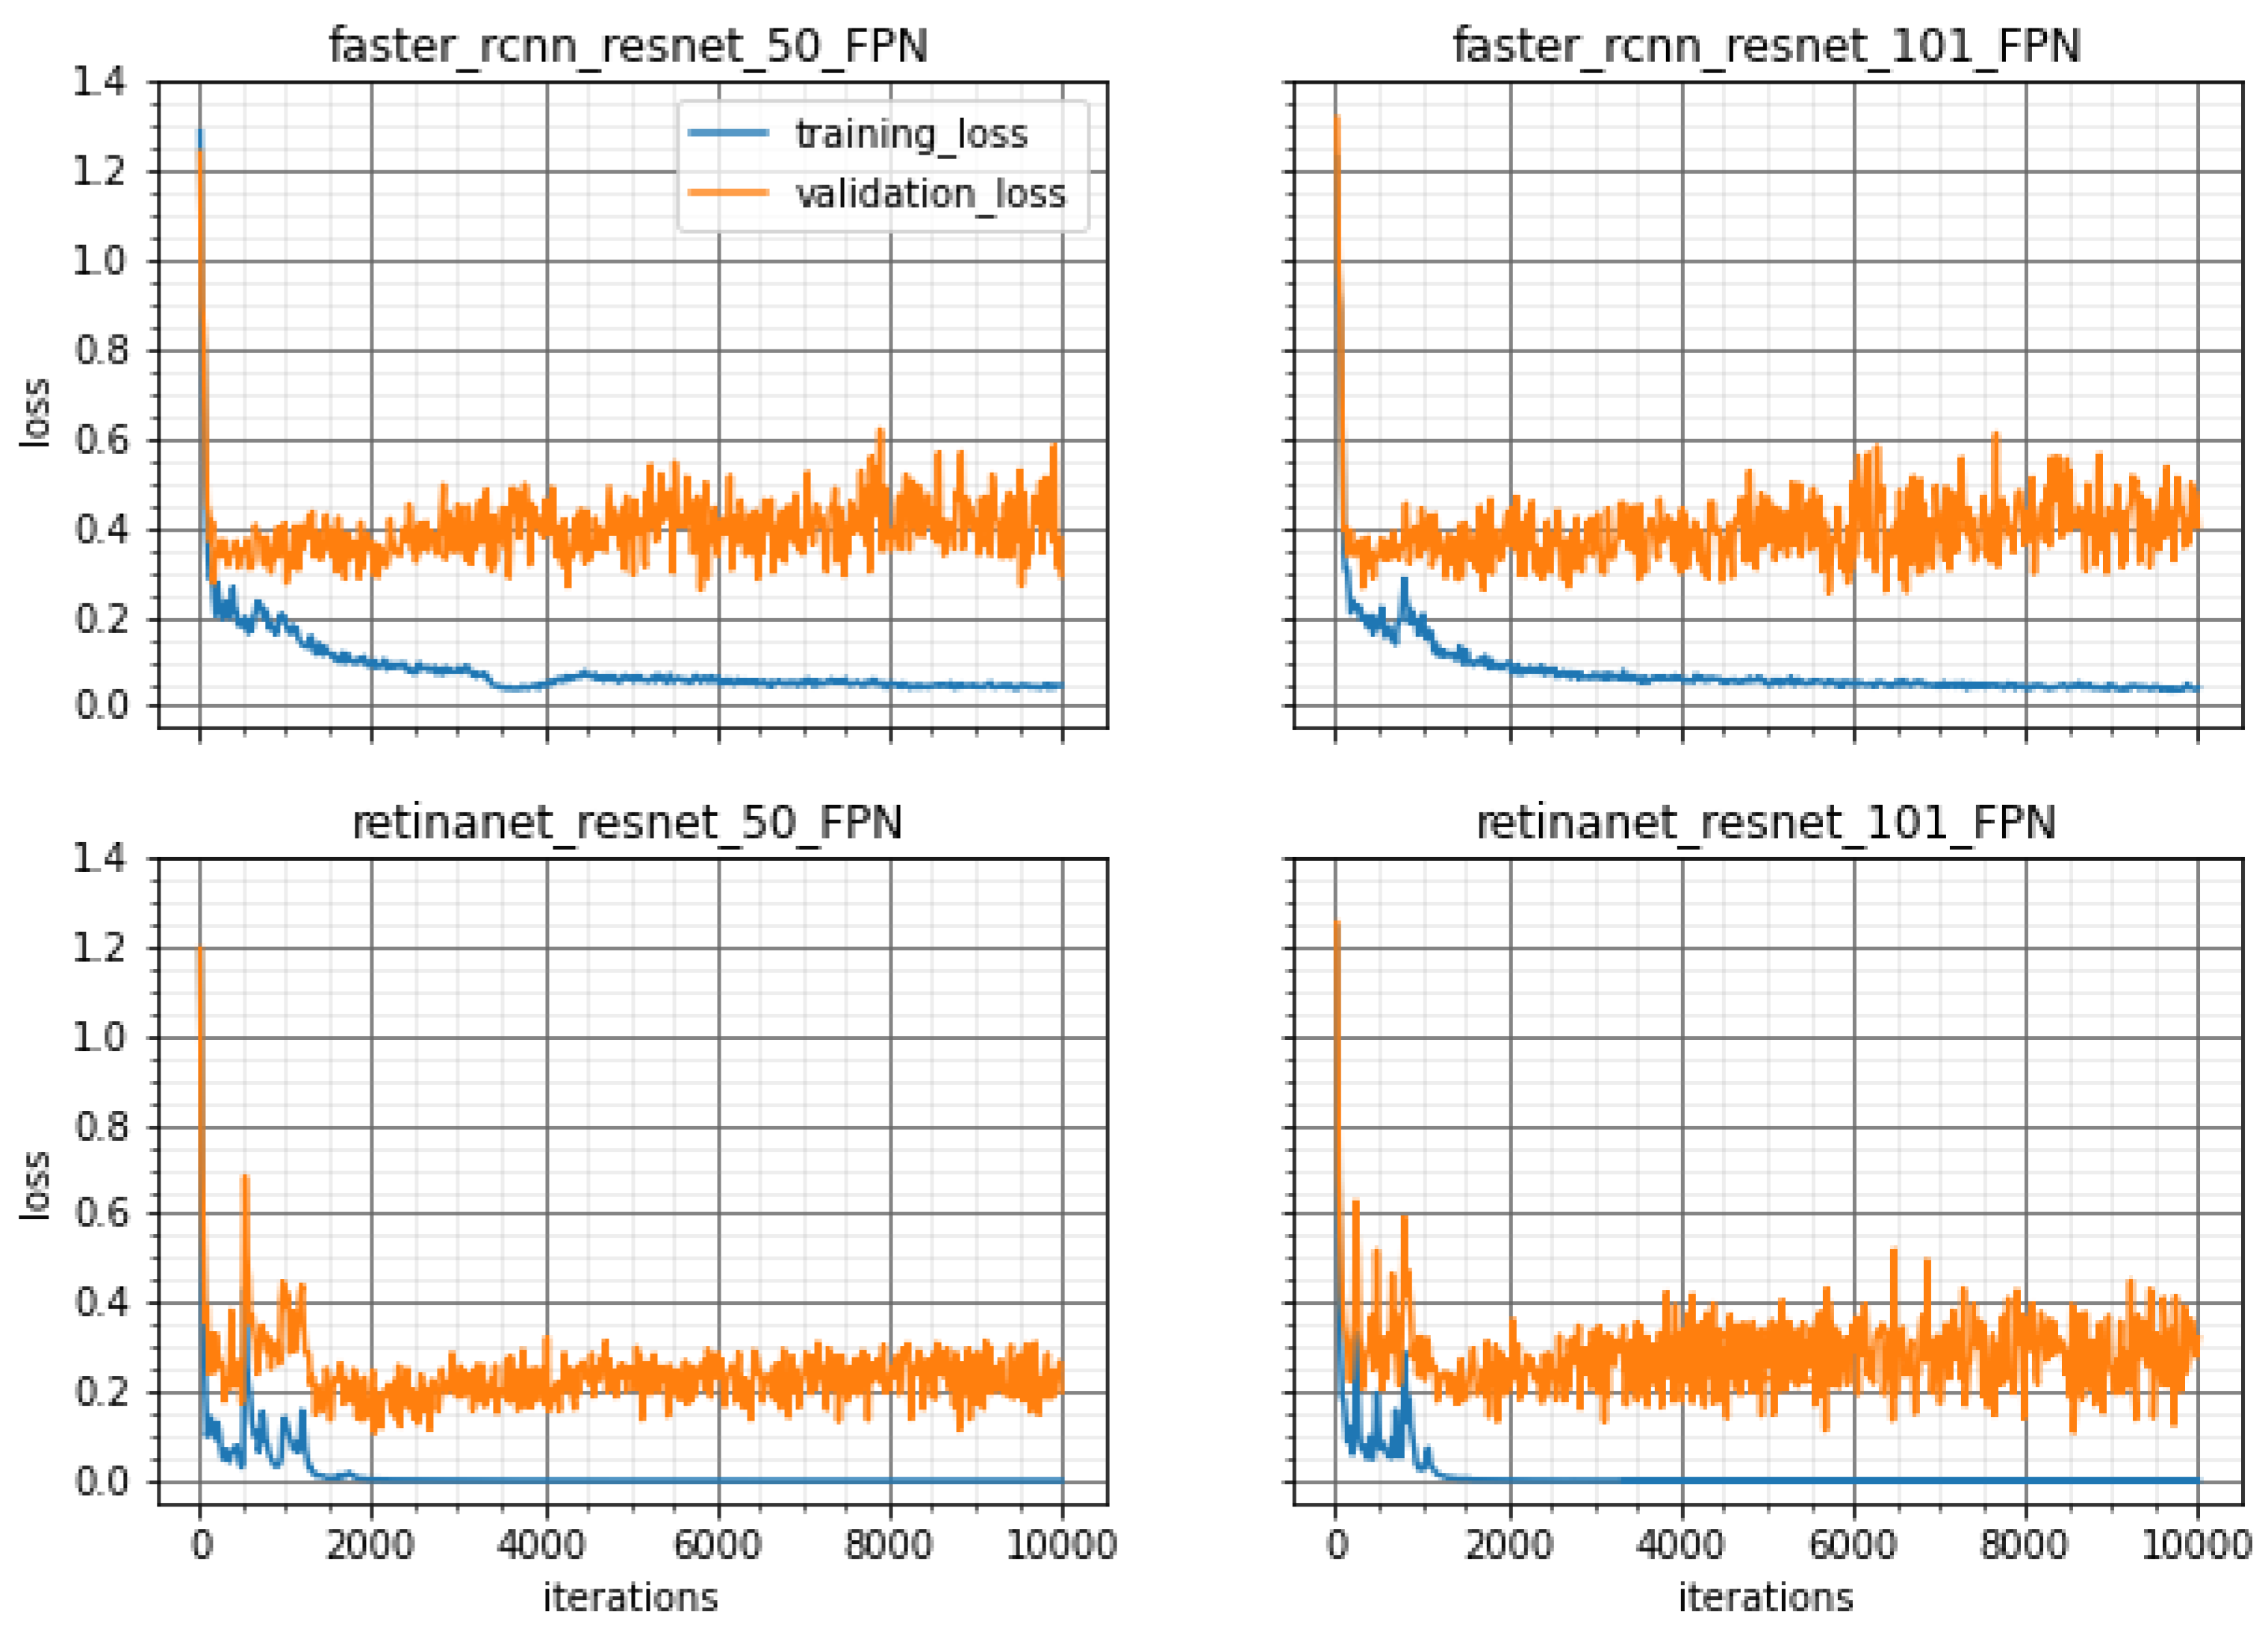
3.1. Learning Results of the Object Detection Method
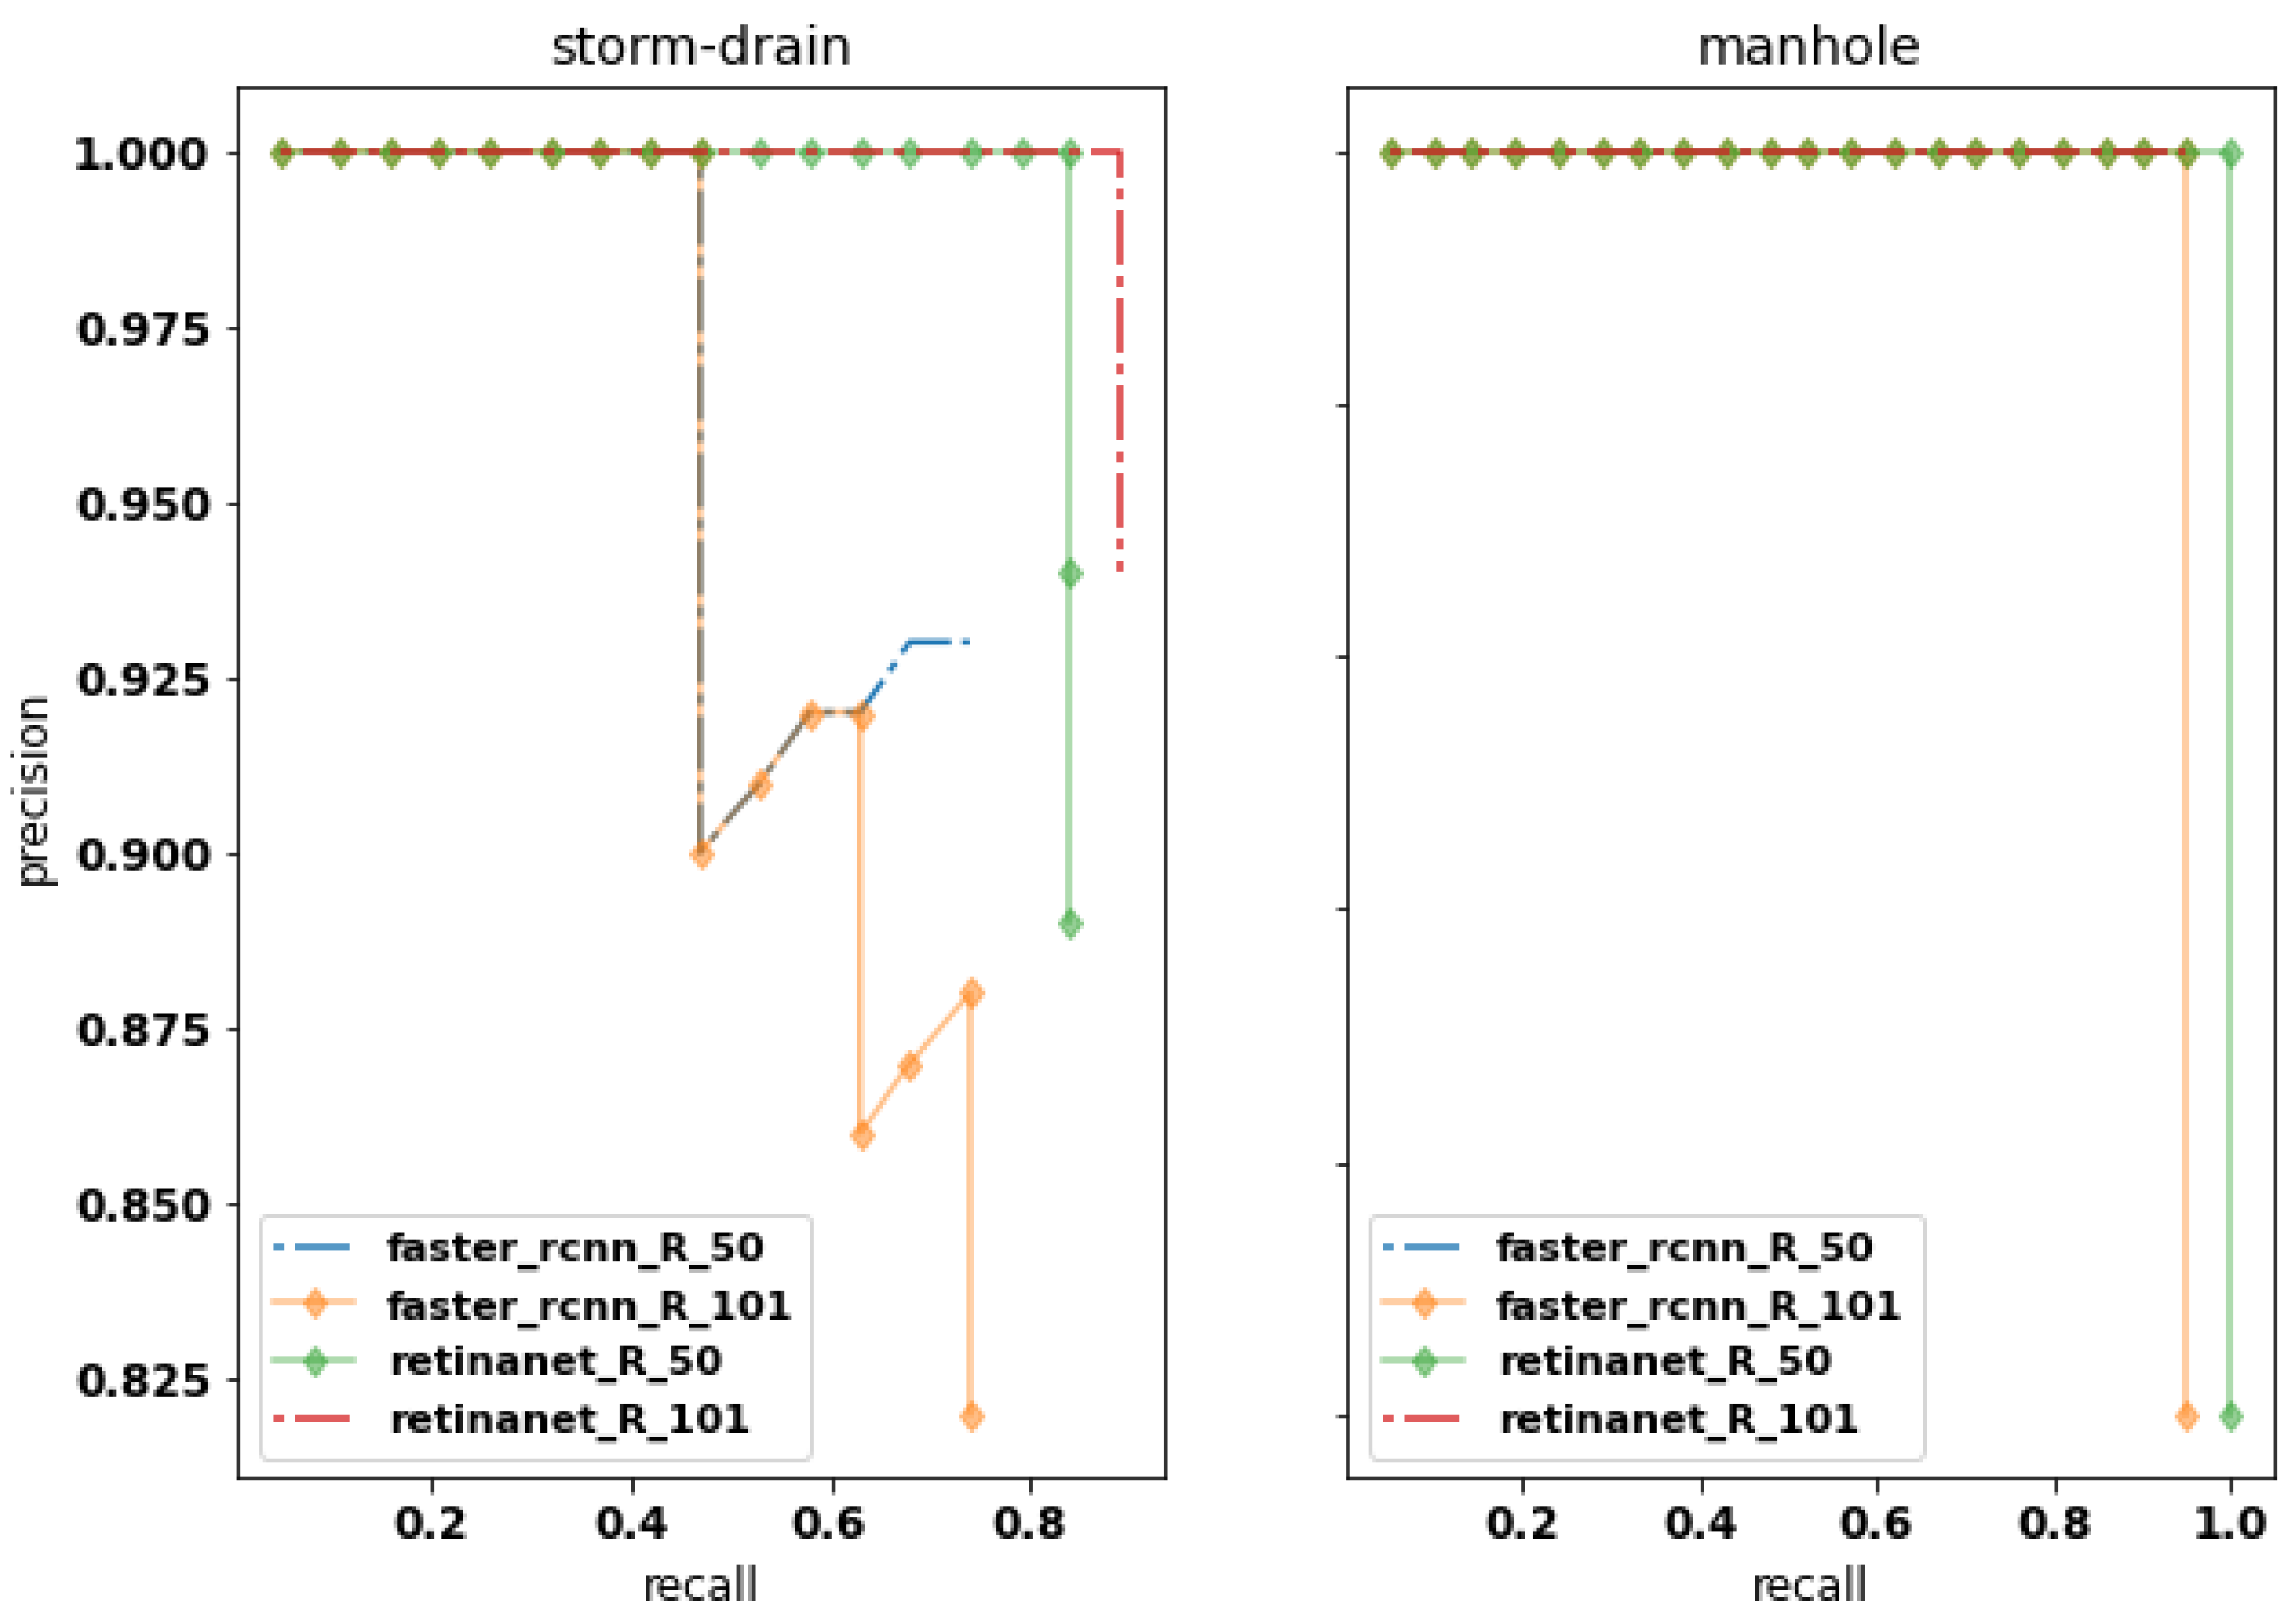
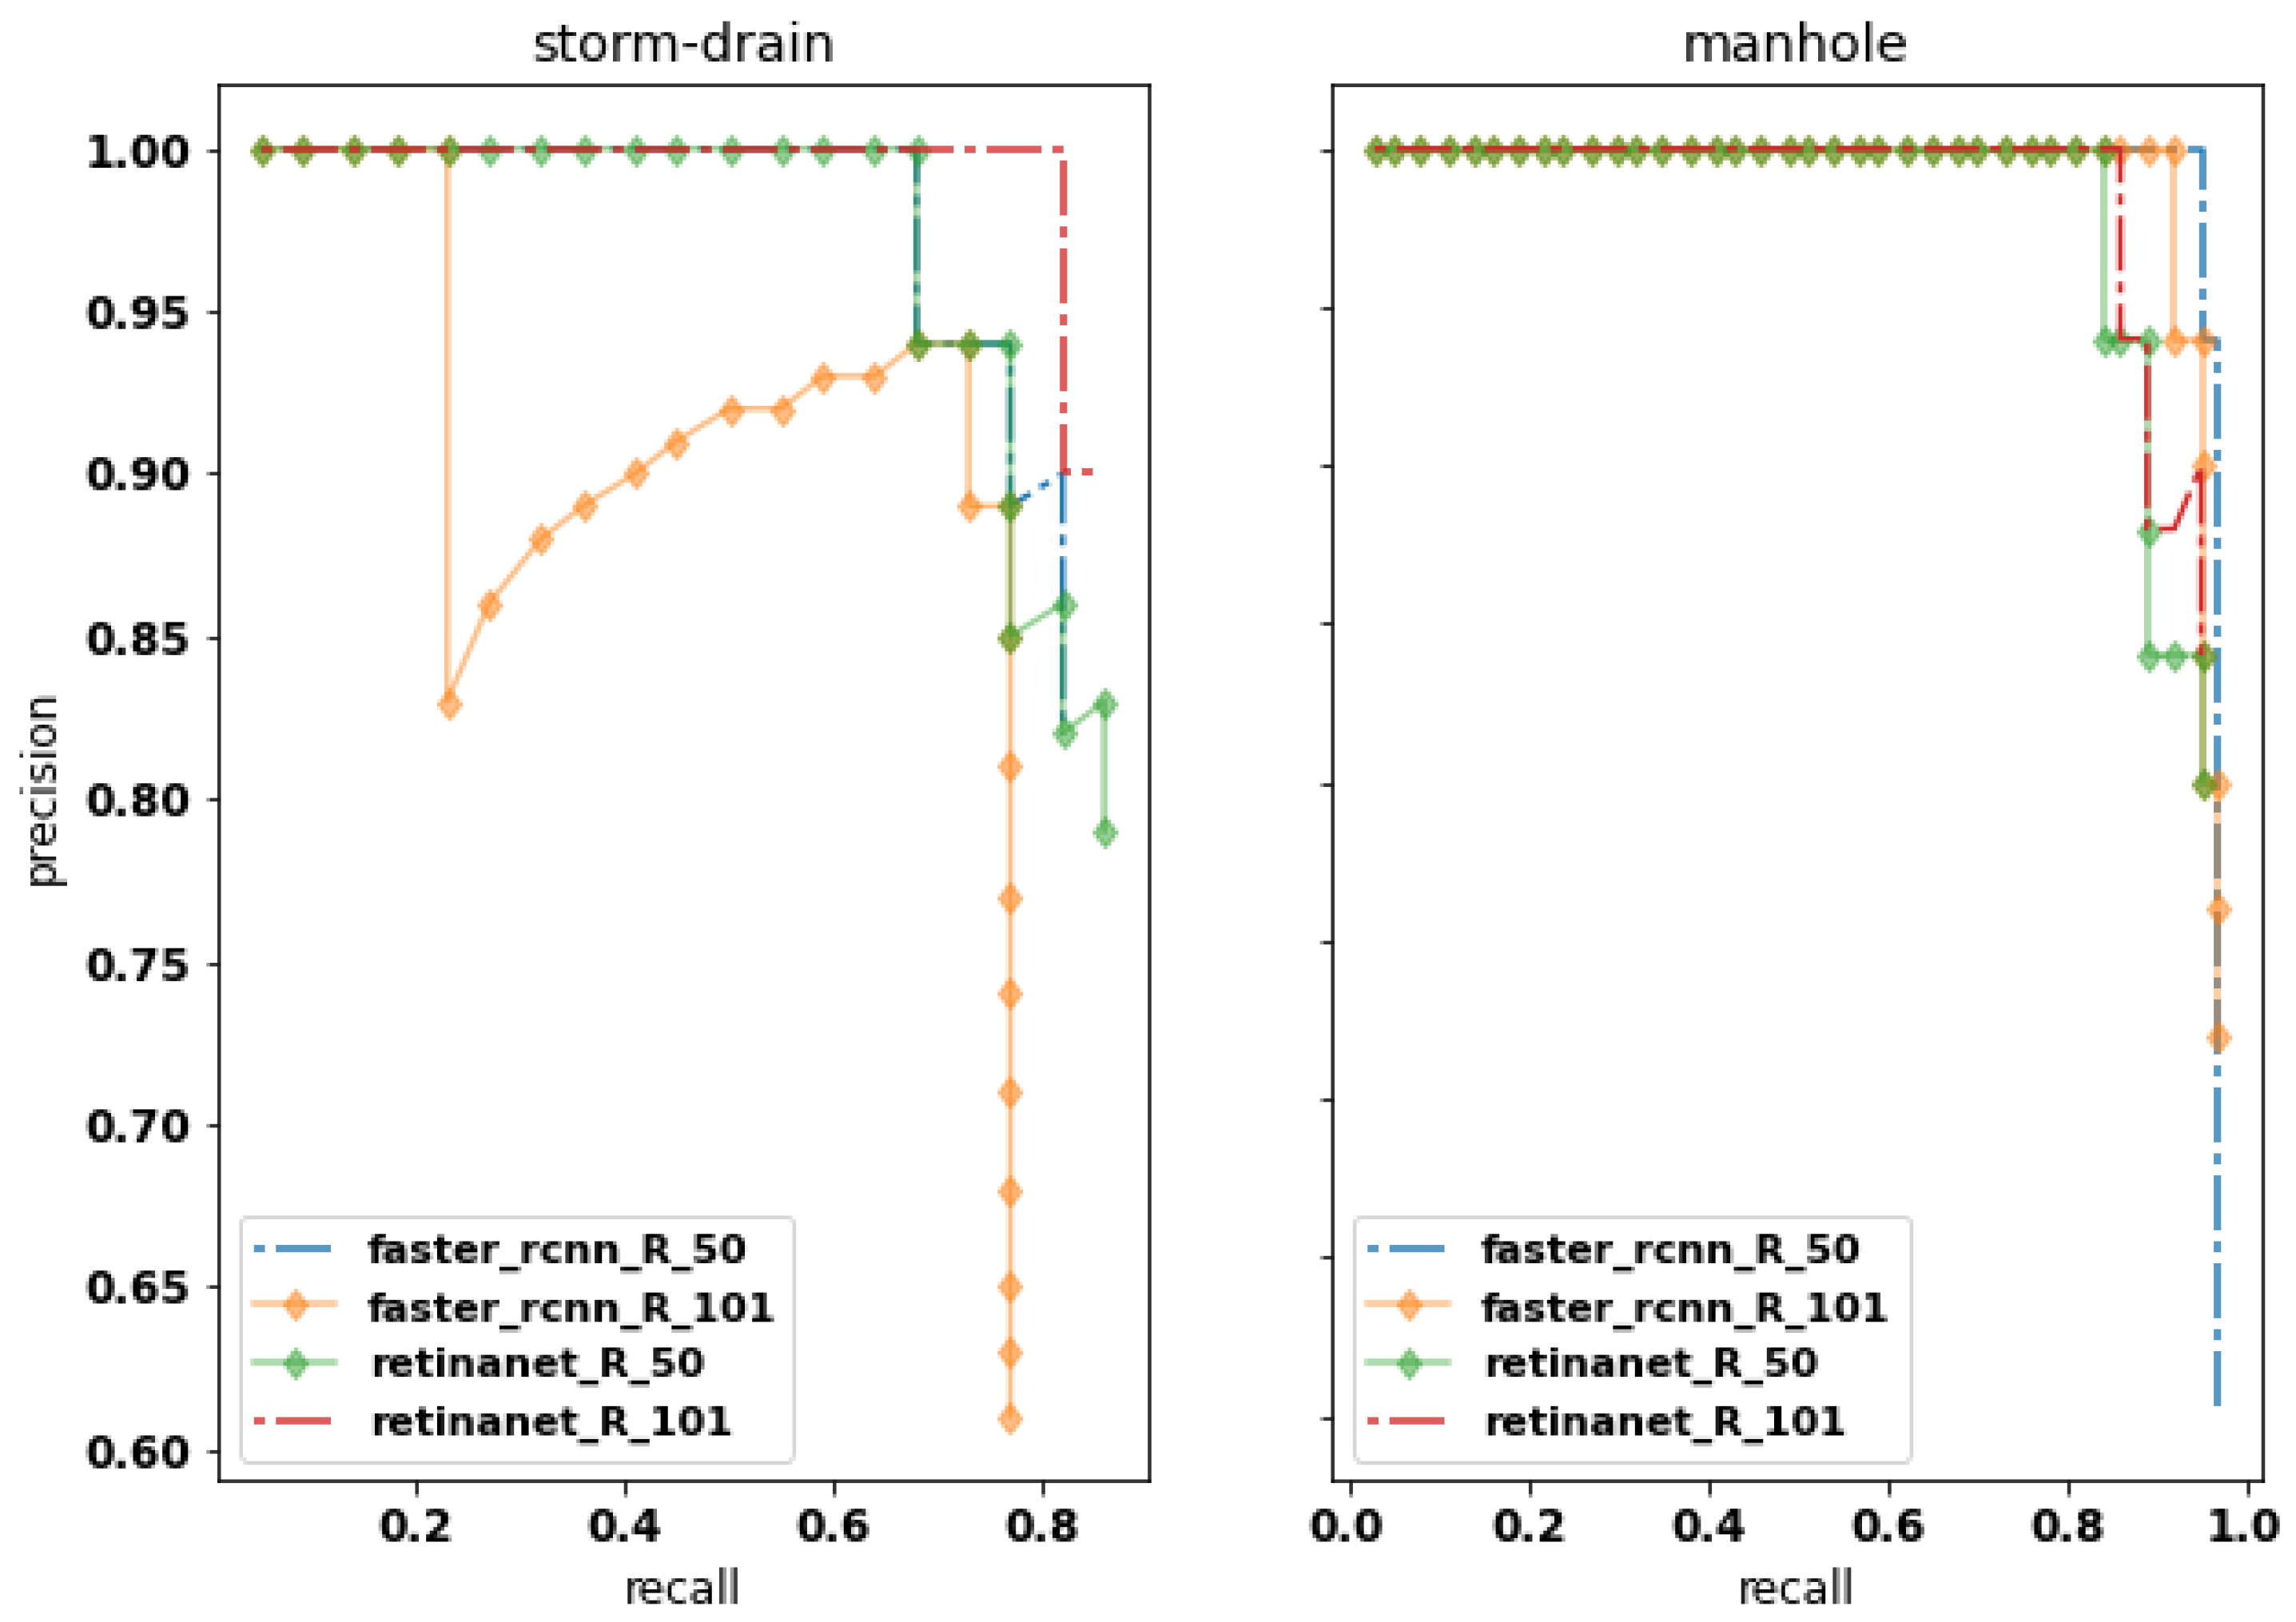
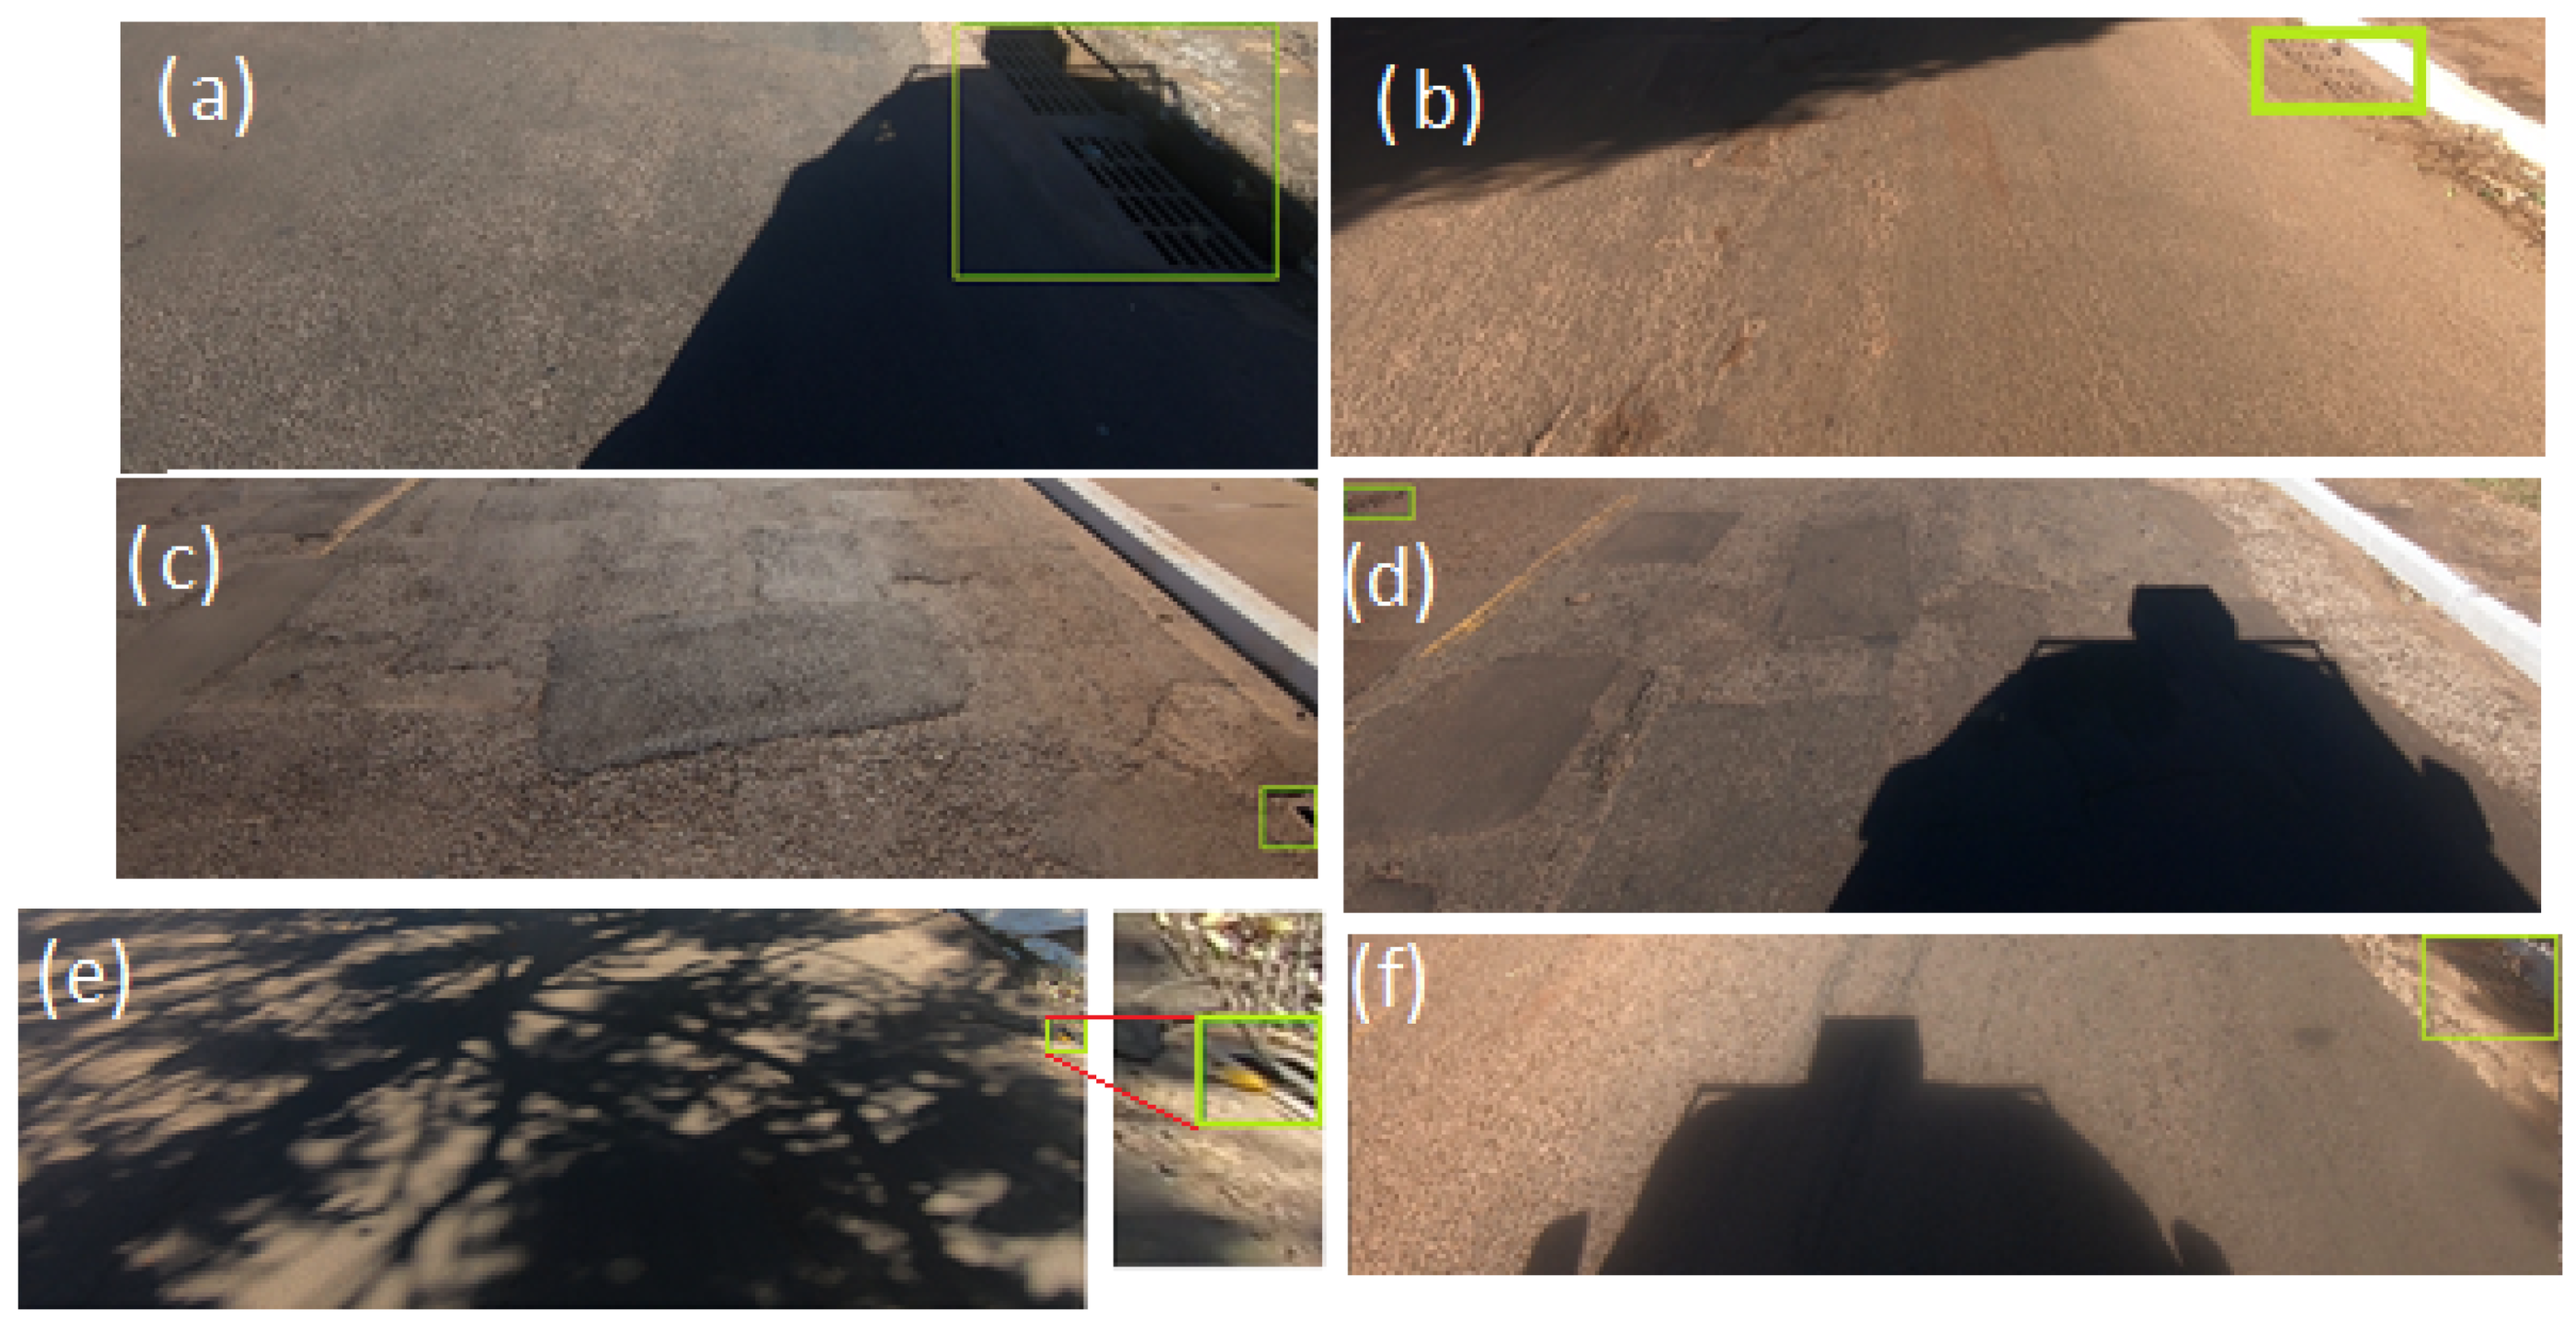
3.2. Inference Results of the Object Detection Method
4. Conclusions
Author Contributions
Funding
Acknowledgments
Conflicts of Interest
References
- Mizutor, M.; Guha-Sapir, D. Economic Losses, Poverty & Disasters; Centre for Research on the Epidemiology of Disasters (CRED): Brussels, Belgium; UN Office for Disaster Risk Reduction (UNISDR): Geneva, Switzerland, 2017. [Google Scholar]
- Heilig, G.K. World Urbanization Prospects: The 2011 Revision; United Nations, Department of Economic and Social Affairs (DESA), Population Division, Population Estimates and Projections Section: New York, NY, USA, 2012. [Google Scholar]
- Ahiablame, L.; Shakya, R. Modeling flood reduction effects of low impact development at a watershed scale. J. Environ. Manag. 2016, 171, 81–91. [Google Scholar] [CrossRef]
- Shuster, W.D.; Bonta, J.; Thurston, H.; Warnemuende, E.; Smith, D.R. Impacts of impervious surface on watershed hydrology: A review. Urban Water J. 2005, 2, 263–275. [Google Scholar] [CrossRef]
- Xie, J.; Chen, H.; Liao, Z.; Gu, X.; Zhu, D.; Zhang, J. An integrated assessment of urban flooding mitigation strategies for robust decision making. Environ. Model. Softw. 2017, 95, 143–155. [Google Scholar] [CrossRef]
- Darabi, H.; Choubin, B.; Rahmati, O.; Haghighi, A.T.; Pradhan, B.; Kløve, B. Urban flood risk mapping using the GARP and QUEST models: A comparative study of machine learning techniques. J. Hydrol. 2019, 569, 142–154. [Google Scholar] [CrossRef]
- Habibi, H.; Seo, D.J. Simple and modular integrated modeling of storm-drain network with gridded distributed hydrologic model via grid-rendering of storm-drains for large urban areas. J. Hydrol. 2018, 567, 637–653. [Google Scholar] [CrossRef]
- Yu, Y.; Li, J.; Guan, H.; Wang, C.; Yu, J. Automated Detection of Road Manhole and Sewer Well Covers From Mobile LiDAR Point Clouds. IEEE Geosci. Remote Sens. Lett. 2014, 11, 1549–1553. [Google Scholar]
- Wei, Z.; Yang, M.; Wang, L.; Ma, H.; Chen, X.; Zhong, R. Customized Mobile LiDAR System for Manhole Cover Detection and Identification. Sensors 2019, 19, 2422. [Google Scholar] [CrossRef] [PubMed] [Green Version]
- Mitchell, T.M. Machine Learning, 1st ed.; McGraw-Hill, Inc.: New York, NY, USA, 1997. [Google Scholar]
- Chaczko, Z.; Yeoh, L.A.; Mahadevan, V. A Preliminary Investigation on Computer Vision for Telemedicine Systems Using OpenCV. In Proceedings of the 2010 Second International Conference on Machine Learning and Computing, Bangalore, India, 9–11 February 2010; IEEE Computer Society: Washington, DC, USA, 2010; pp. 42–46. [Google Scholar]
- Marengoni, M.; Stringhini, D. High Level Computer Vision Using OpenCV. In Proceedings of the 2011 24th SIBGRAPI Conference on Graphics, Patterns, and Images Tutorials, Alagoas, Brazil, 28–30 August 2011; pp. 11–24. [Google Scholar]
- Timofte, R.; Van Gool, L. Multi-view manhole detection, recognition, and 3D localisation. In Proceedings of the 2011 IEEE International Conference on Computer Vision Workshops (ICCV Workshops), Barcelona, Spain, 6–13 November 2011; pp. 188–195. [Google Scholar]
- Niigaki, H.; Shimamura, J.; Morimoto, M. Circular object detection based on separability and uniformity of feature distributions using Bhattacharyya Coefficient. In Proceedings of the 21st International Conference on Pattern Recognition (ICPR2012), Tsukuba, Japan, 11–15 November 2012; pp. 2009–2012. [Google Scholar]
- Pasquet, J.; Desert, T.; Bartoli, O.; Chaumont, M.; Delenne, C.; Subsol, G.; Derras, M.; Chahinian, N. Detection of manhole covers in high-resolution aerial images of urban areas by combining two methods. IEEE J. Sel. Top. Appl. Earth Obs. Remote Sens. 2015, 9, 1802–1807. [Google Scholar] [CrossRef] [Green Version]
- Ali, Z.; Wang, D.; Loya, M. SURF and LA with RGB Vector Space Based Detection and Monitoring of Manholes with an Application to Tri-Rotor UAS Images. Int. J. Eng. Technol. 2017, 9, 32–39. [Google Scholar]
- Moy de Vitry, M.; Schindler, K.; Rieckermann, J.; Leitão, J.P. Sewer Inlet Localization in UAV Image Clouds: Improving Performance with Multiview Detection. Remote Sens. 2018, 10, 706. [Google Scholar] [CrossRef] [Green Version]
- Guo, Y.; Liu, Y.; Oerlemans, A.; Lao, S.; Wu, S.; Lew, M.S. Deep learning for visual understanding: A review. Neurocomputing 2016, 187, 27–48. [Google Scholar] [CrossRef]
- Wang, J.; Ma, Y.; Zhang, L.; Gao, R.X.; Wu, D. Deep learning for smart manufacturing: Methods and applications. J. Manuf. Syst. 2018, 48, 144–156. [Google Scholar] [CrossRef]
- Zhao, Z.; Zheng, P.; Xu, S.; Wu, X. Object Detection With Deep Learning: A Review. IEEE Trans. Neural Netw. Learn. Syst. 2019, 30, 3212–3232. [Google Scholar] [CrossRef] [PubMed] [Green Version]
- Osco, L.P.; de Arruda, M.D.S.; Junior, J.M.; da Silva, N.B.; Ramos, A.P.M.; Moryia, É.A.S.; Imai, N.N.; Pereira, D.R.; Creste, J.E.; Matsubara, E.T.; et al. A convolutional neural network approach for counting and geolocating citrus-trees in UAV multispectral imagery. ISPRS J. Photogramm. Remote Sens. 2020, 160, 97–106. [Google Scholar] [CrossRef]
- Santos, A.A.D.; Marcato Junior, J.; Araújo, M.S.; Di Martini, D.R.; Tetila, E.C.; Siqueira, H.L.; Aoki, C.; Eltner, A.; Matsubara, E.T.; Pistori, H.; et al. Assessment of CNN-Based Methods for Individual Tree Detection on Images Captured by RGB Cameras Attached to UAVs. Sensors 2019, 19, 3595. [Google Scholar] [CrossRef] [Green Version]
- Ale, L.; Zhang, N.; Li, L. Road Damage Detection Using RetinaNet. In Proceedings of the 2018 IEEE International Conference on Big Data (Big Data), Seattle, WA, USA, 10–13 December 2018; pp. 5197–5200. [Google Scholar]
- Guan, Q.; Huang, Y.; Zhong, Z.; Zheng, Z.; Zheng, L.; Yang, Y. Diagnose like a Radiologist: Attention Guided Convolutional Neural Network for Thorax Disease Classification. arXiv 2018, arXiv:1801.09927. [Google Scholar]
- Liu, W.; Cheng, D.; Yin, P.; Yang, M.; Li, E.; Xie, M.; Zhang, L. Small Manhole Cover Detection in Remote Sensing Imagery with Deep Convolutional Neural Networks. ISPRS Int. J. Geo-Inf. 2019, 8, 49. [Google Scholar] [CrossRef] [Green Version]
- Boller, D.; de Vitry, M.M.; Wegner, J.D.; Leitão, J.P. Automated localization of urban drainage infrastructure from public-access street-level images. Urban Water J. 2019, 16, 480–493. [Google Scholar] [CrossRef]
- Cui, Y.; Oztan, B. Automated firearms detection in cargo x-ray images using RetinaNet. In Anomaly Detection and Imaging with X-rays (ADIX) IV; International Society for Optics and Photonics: Bellingham, WA, USA, 2019; Volume 10999, pp. 105–115. [Google Scholar]
- Sun, P.; Chen, G.; Guerdan, L.M.; Shang, Y. Salience Biased Loss for Object Detection in Aerial Images. arXiv 2018, arXiv:1810.08103. [Google Scholar]
- Sinkevych, O.; Berezhansky, D.; Matchyshyn, Z. On the Development of Object Detector Based on Capsule Neural Networks. In Proceedings of the 2019 XIth International Scientific and Practical Conference on Electronics and Information Technologies (ELIT), Lviv, Ukraine, 16–18 September 2019; pp. 159–162. [Google Scholar]
- Jiao, L.; Zhang, F.; Liu, F.; Yang, S.; Li, L.; Feng, Z.; Qu, R. A Survey of Deep Learning-Based Object Detection. IEEE Access 2019, 7, 128837–128868. [Google Scholar] [CrossRef]
- Han, J.; Zhang, D.; Cheng, G.; Liu, N.; Xu, D. Advanced Deep-Learning Techniques for Salient and Category-Specific Object Detection: A Survey. IEEE Signal Process. Mag. 2018, 35, 84–100. [Google Scholar] [CrossRef]
- Luo, R.; Huang, H.; Wu, W. Salient object detection based on backbone enhanced network. Image Vis. Comput. 2020, 95, 103876. [Google Scholar] [CrossRef]
- Lin, T.; Goyal, P.; Girshick, R.B.; He, K.; Dollár, P. Focal Loss for Dense Object Detection. arXiv 2017, arXiv:1708.02002. [Google Scholar]
- Lin, T.; Dollár, P.; Girshick, R.; He, K.; Hariharan, B.; Belongie, S. Feature Pyramid Networks for Object Detection. In Proceedings of the 2017 IEEE Conference on Computer Vision and Pattern Recognition (CVPR), Honolulu, HI, USA, 21–26 July 2017; pp. 936–944. [Google Scholar]
- Lin, T.Y.; Maire, M.; Belongie, S.; Hays, J.; Perona, P.; Ramanan, D.; Dollár, P.; Zitnick, C.L. Microsoft COCO: Common Objects in Context. In Computer Vision—ECCV 2014; Fleet, D., Pajdla, T., Schiele, B., Tuytelaars, T., Eds.; Springer International Publishing: Cham, Switzerland, 2014; pp. 740–755. [Google Scholar]
- Wu, Y.; Kirillov, A.; Massa, F.; Lo, W.Y.; Girshick, R. Detectron2. 2019. Available online: https://github.com/facebookresearch/detectron2 (accessed on 4 April 2020).
- Ren, S.; He, K.; Girshick, R.; Sun, J. Faster R-CNN: Towards Real-Time Object Detection with Region Proposal Networks. IEEE Trans. Pattern Anal. Mach. Intell. 2017, 39, 1137–1149. [Google Scholar] [CrossRef] [Green Version]
- Yu, Y.; Li, J.; Guan, H.; Wang, C. Automated Extraction of Urban Road Facilities Using Mobile Laser Scanning Data. IEEE Trans. Intell. Transp. Syst. 2015, 16, 2167–2181. [Google Scholar] [CrossRef]
- Li, K.; Wan, G.; Cheng, G.; Meng, L.; Han, J. Object detection in optical remote sensing images: A survey and a new benchmark. ISPRS J. Photogramm. Remote Sens. 2020, 159, 296–307. [Google Scholar] [CrossRef]


| Division | Set | # Images (%) | # Manholes | # Storm-Drains |
|---|---|---|---|---|
| 76-12-12 | Train | 226 (76%) | 120 | 113 |
| Validation | 35 (12%) | 25 | 10 | |
| Train + Validation | 261 (88%) | 145 | 123 | |
| Test | 36 (12%) | 21 | 19 | |
| 66-15-19 | Train | 198 (66%) | 104 | 100 |
| Validation | 44 (15%) | 25 | 20 | |
| Train + Validation | 226 (81%) | 129 | 120 | |
| Test | 55 (19%) | 37 | 22 |
| Division | Method | Backbone | |||
|---|---|---|---|---|---|
| 76-12-12 | Faster-RCNN | ResNet-50 | |||
| ResNet-101 | |||||
| RetinaNet | ResNet-50 | ||||
| ResNet-101 | |||||
| 66-15-19 | Faster-RCNN | ResNet-50 | |||
| ResNet-101 | |||||
| RetinaNet | ResNet-50 | ||||
| ResNet-101 |
© 2020 by the authors. Licensee MDPI, Basel, Switzerland. This article is an open access article distributed under the terms and conditions of the Creative Commons Attribution (CC BY) license (http://creativecommons.org/licenses/by/4.0/).
Share and Cite
Santos, A.; Marcato Junior, J.; de Andrade Silva, J.; Pereira, R.; Matos, D.; Menezes, G.; Higa, L.; Eltner, A.; Ramos, A.P.; Osco, L.; et al. Storm-Drain and Manhole Detection Using the RetinaNet Method. Sensors 2020, 20, 4450. https://0-doi-org.brum.beds.ac.uk/10.3390/s20164450
Santos A, Marcato Junior J, de Andrade Silva J, Pereira R, Matos D, Menezes G, Higa L, Eltner A, Ramos AP, Osco L, et al. Storm-Drain and Manhole Detection Using the RetinaNet Method. Sensors. 2020; 20(16):4450. https://0-doi-org.brum.beds.ac.uk/10.3390/s20164450
Chicago/Turabian StyleSantos, Anderson, José Marcato Junior, Jonathan de Andrade Silva, Rodrigo Pereira, Daniel Matos, Geazy Menezes, Leandro Higa, Anette Eltner, Ana Paula Ramos, Lucas Osco, and et al. 2020. "Storm-Drain and Manhole Detection Using the RetinaNet Method" Sensors 20, no. 16: 4450. https://0-doi-org.brum.beds.ac.uk/10.3390/s20164450