Graphene-Doped Tin Oxide Nanofibers and Nanoribbons as Gas Sensors to Detect Biomarkers of Different Diseases through the Breath

 ,
,  ,
,  , ,
, ,
Abstract
:1. Introduction
2. Materials and Methods
2.1. Materials
2.2. Preparation of Precursor Solution
2.3. Synthesis of Tin Oxide Nanostructures with Pristine Graphene
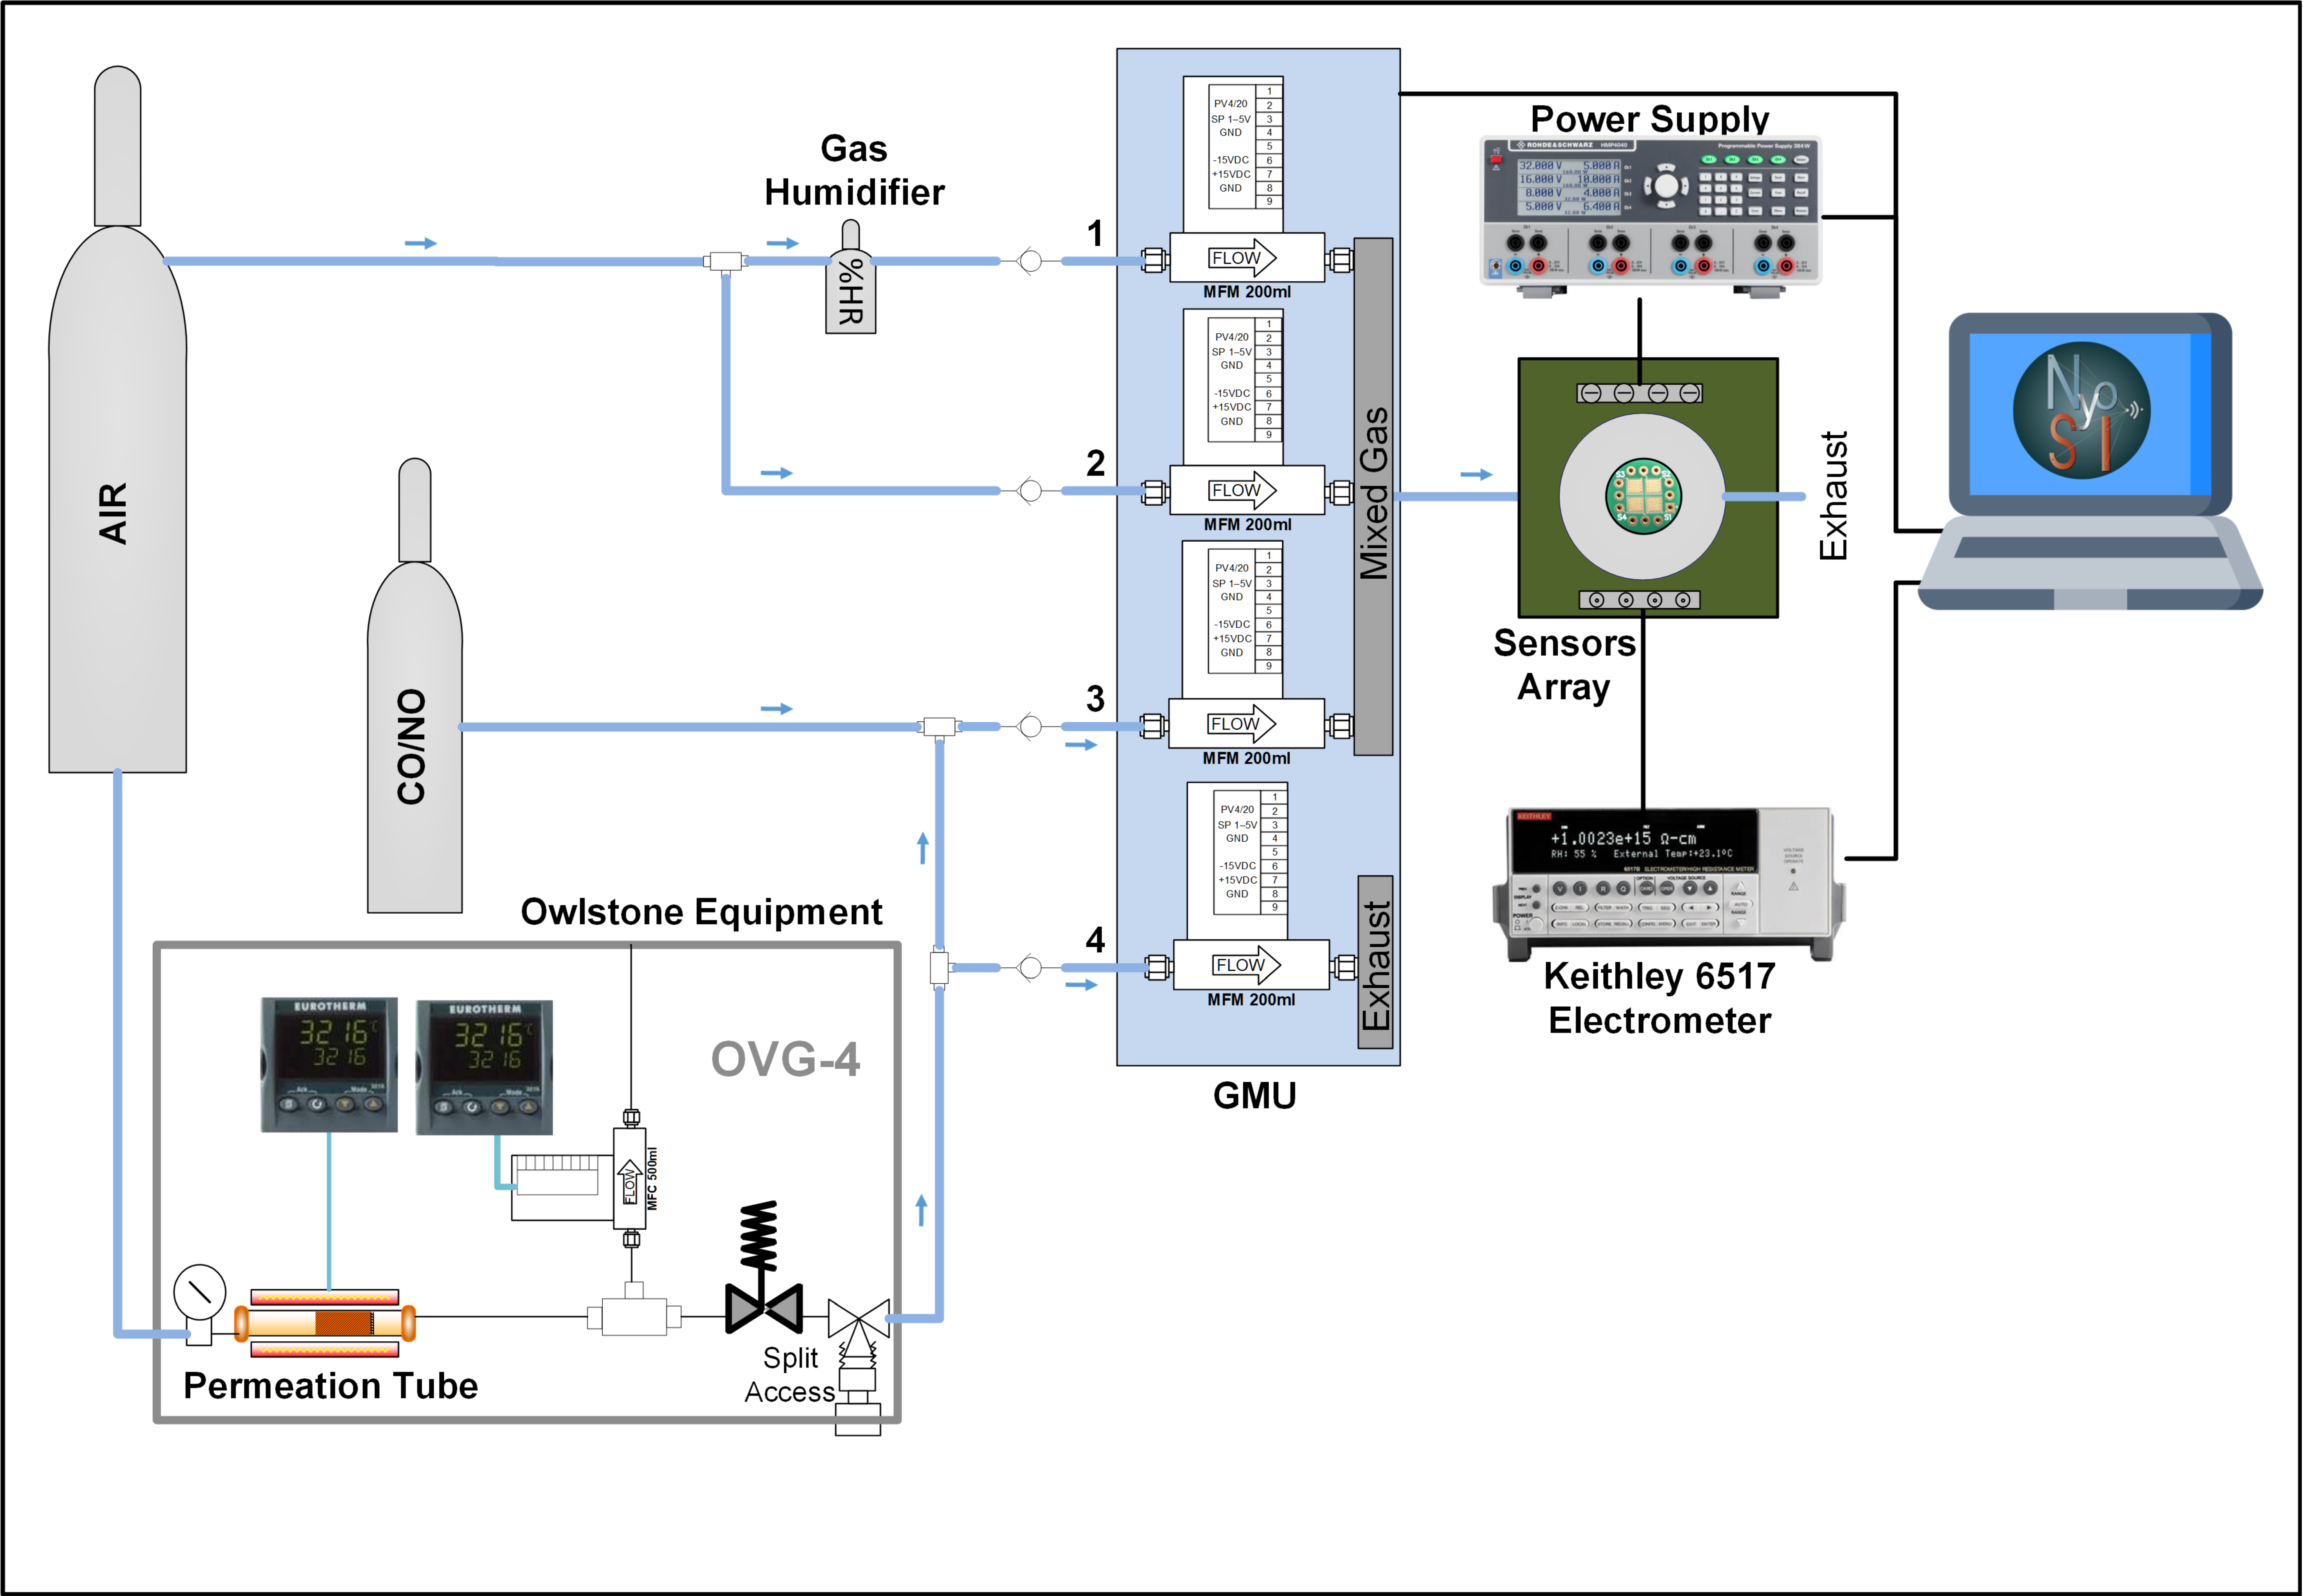
2.4. Gas Line Setup
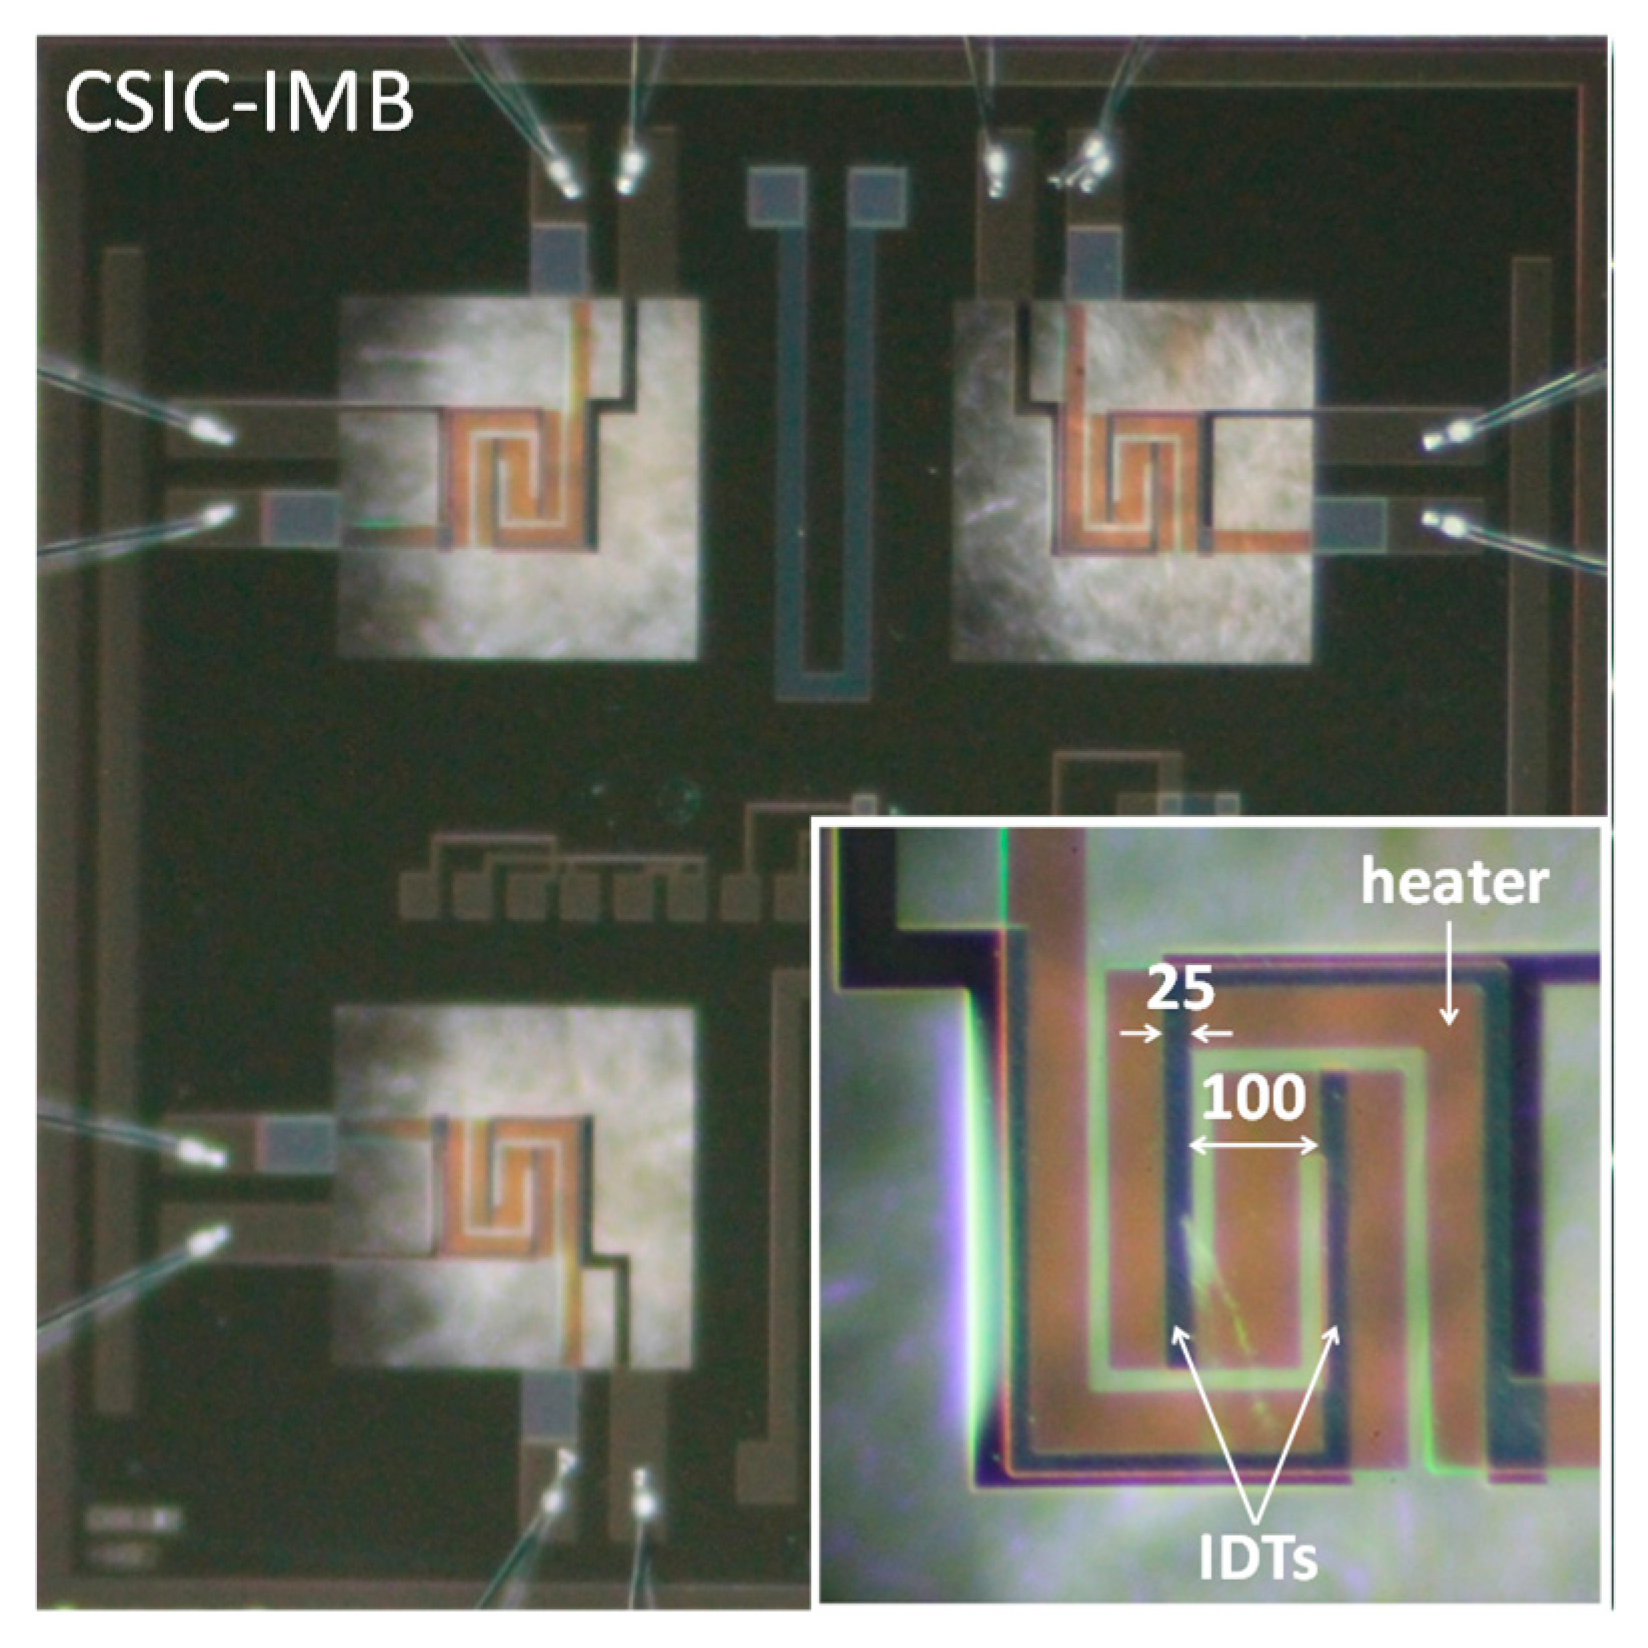
2.5. Sensor Description
3. Results and Discussion
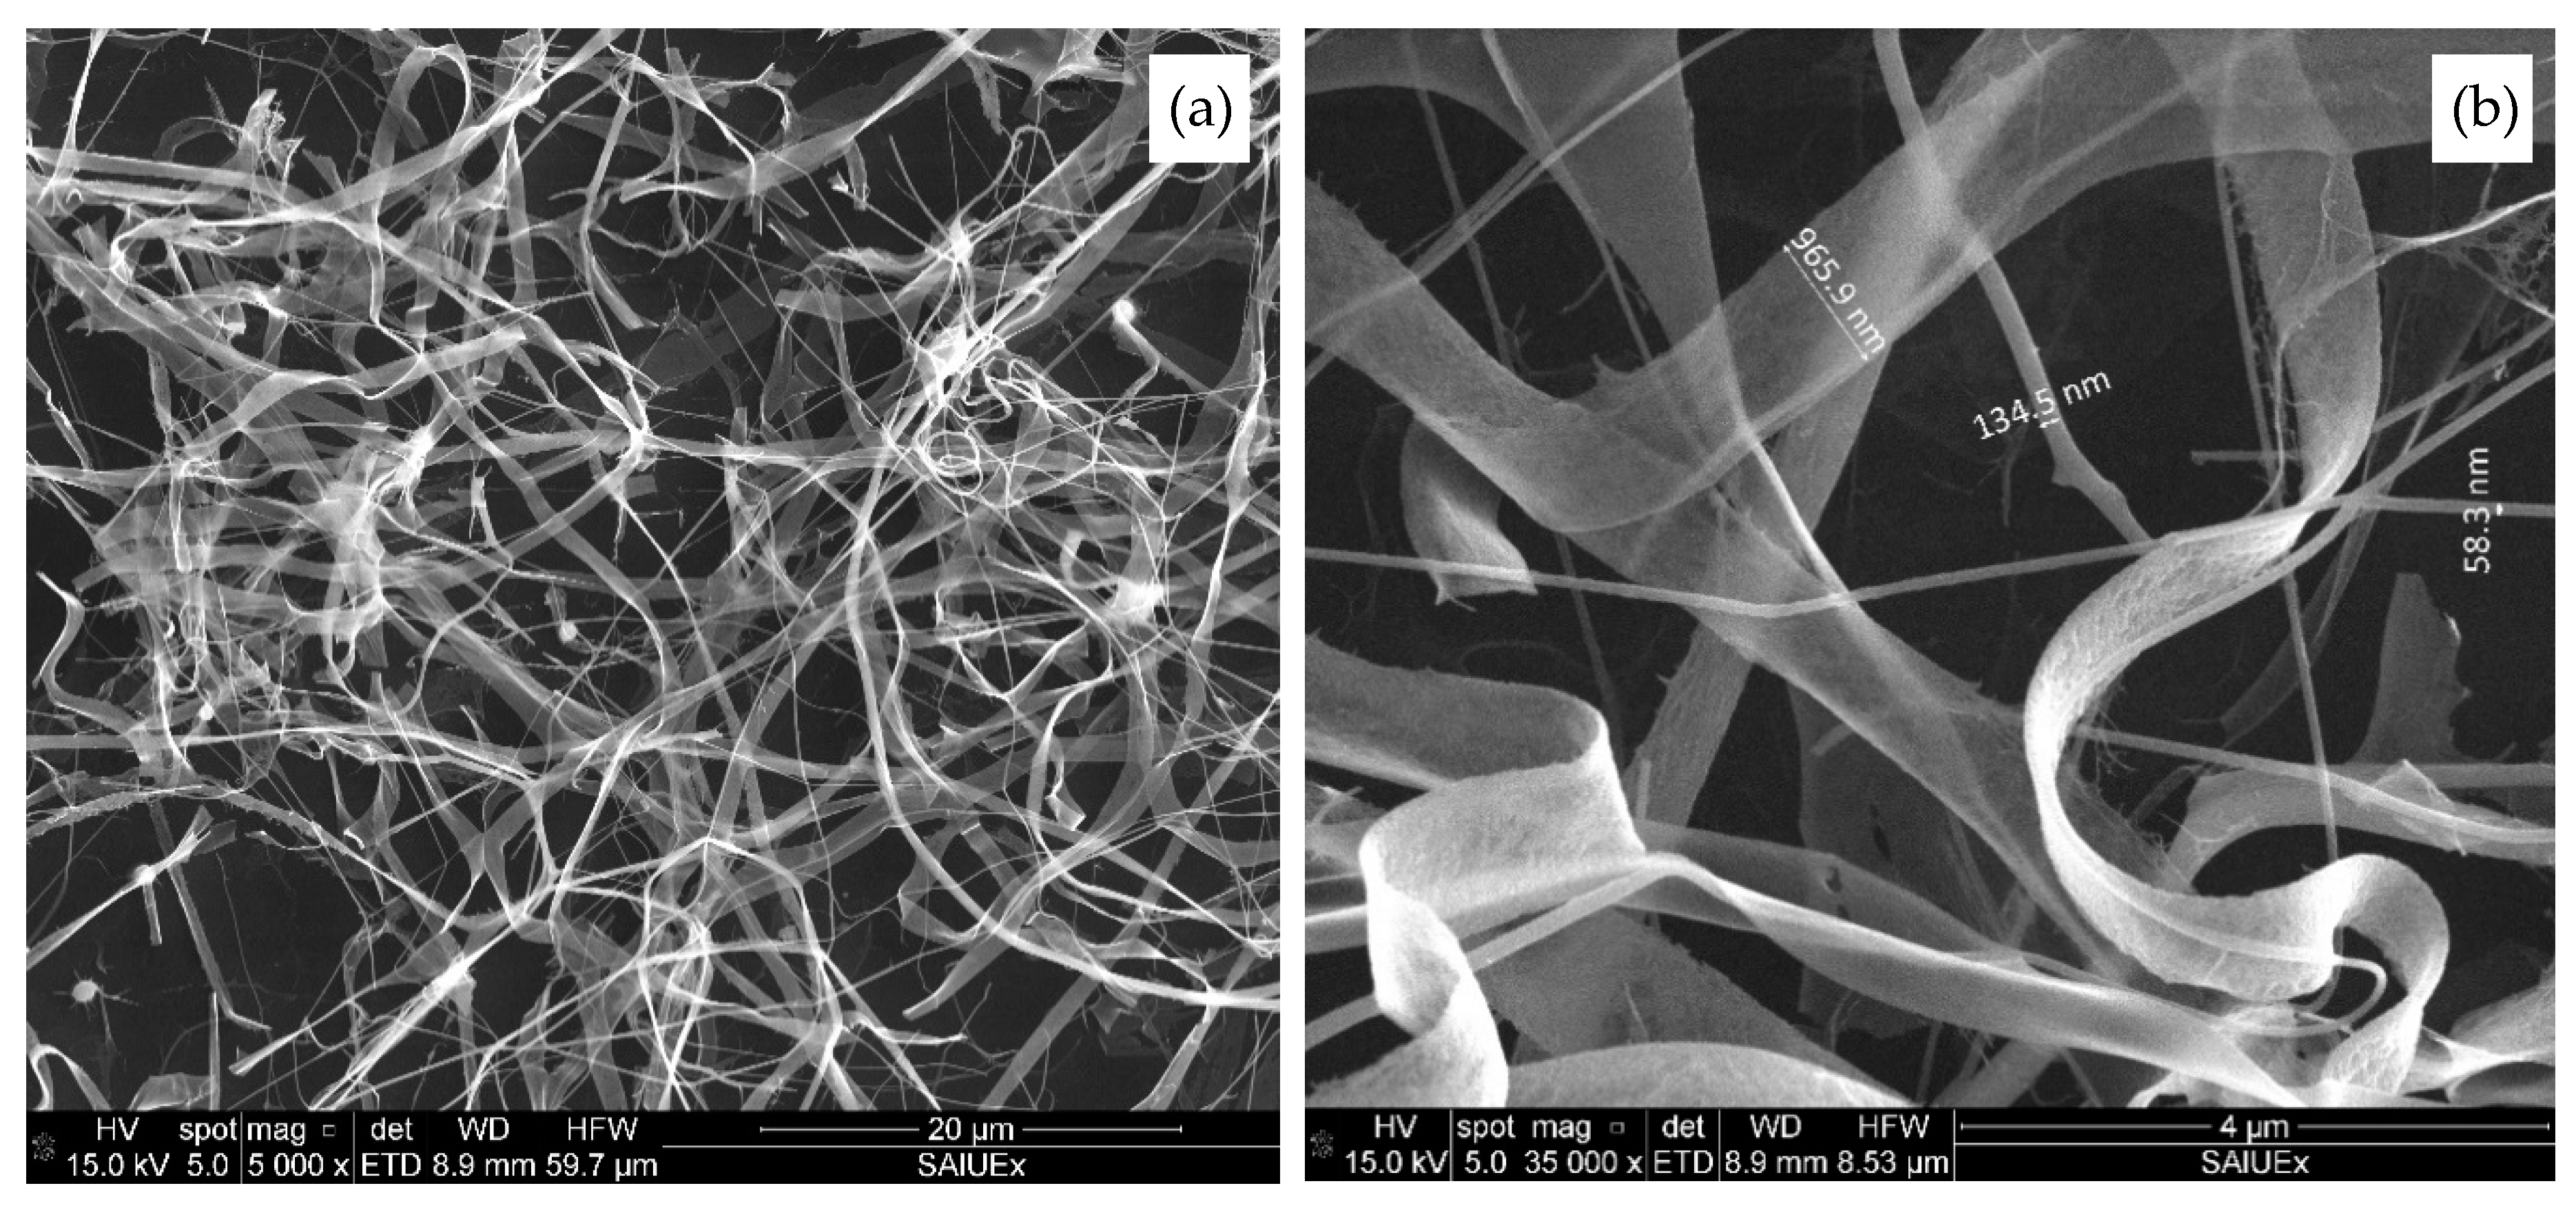
3.1. Morphological Characterization
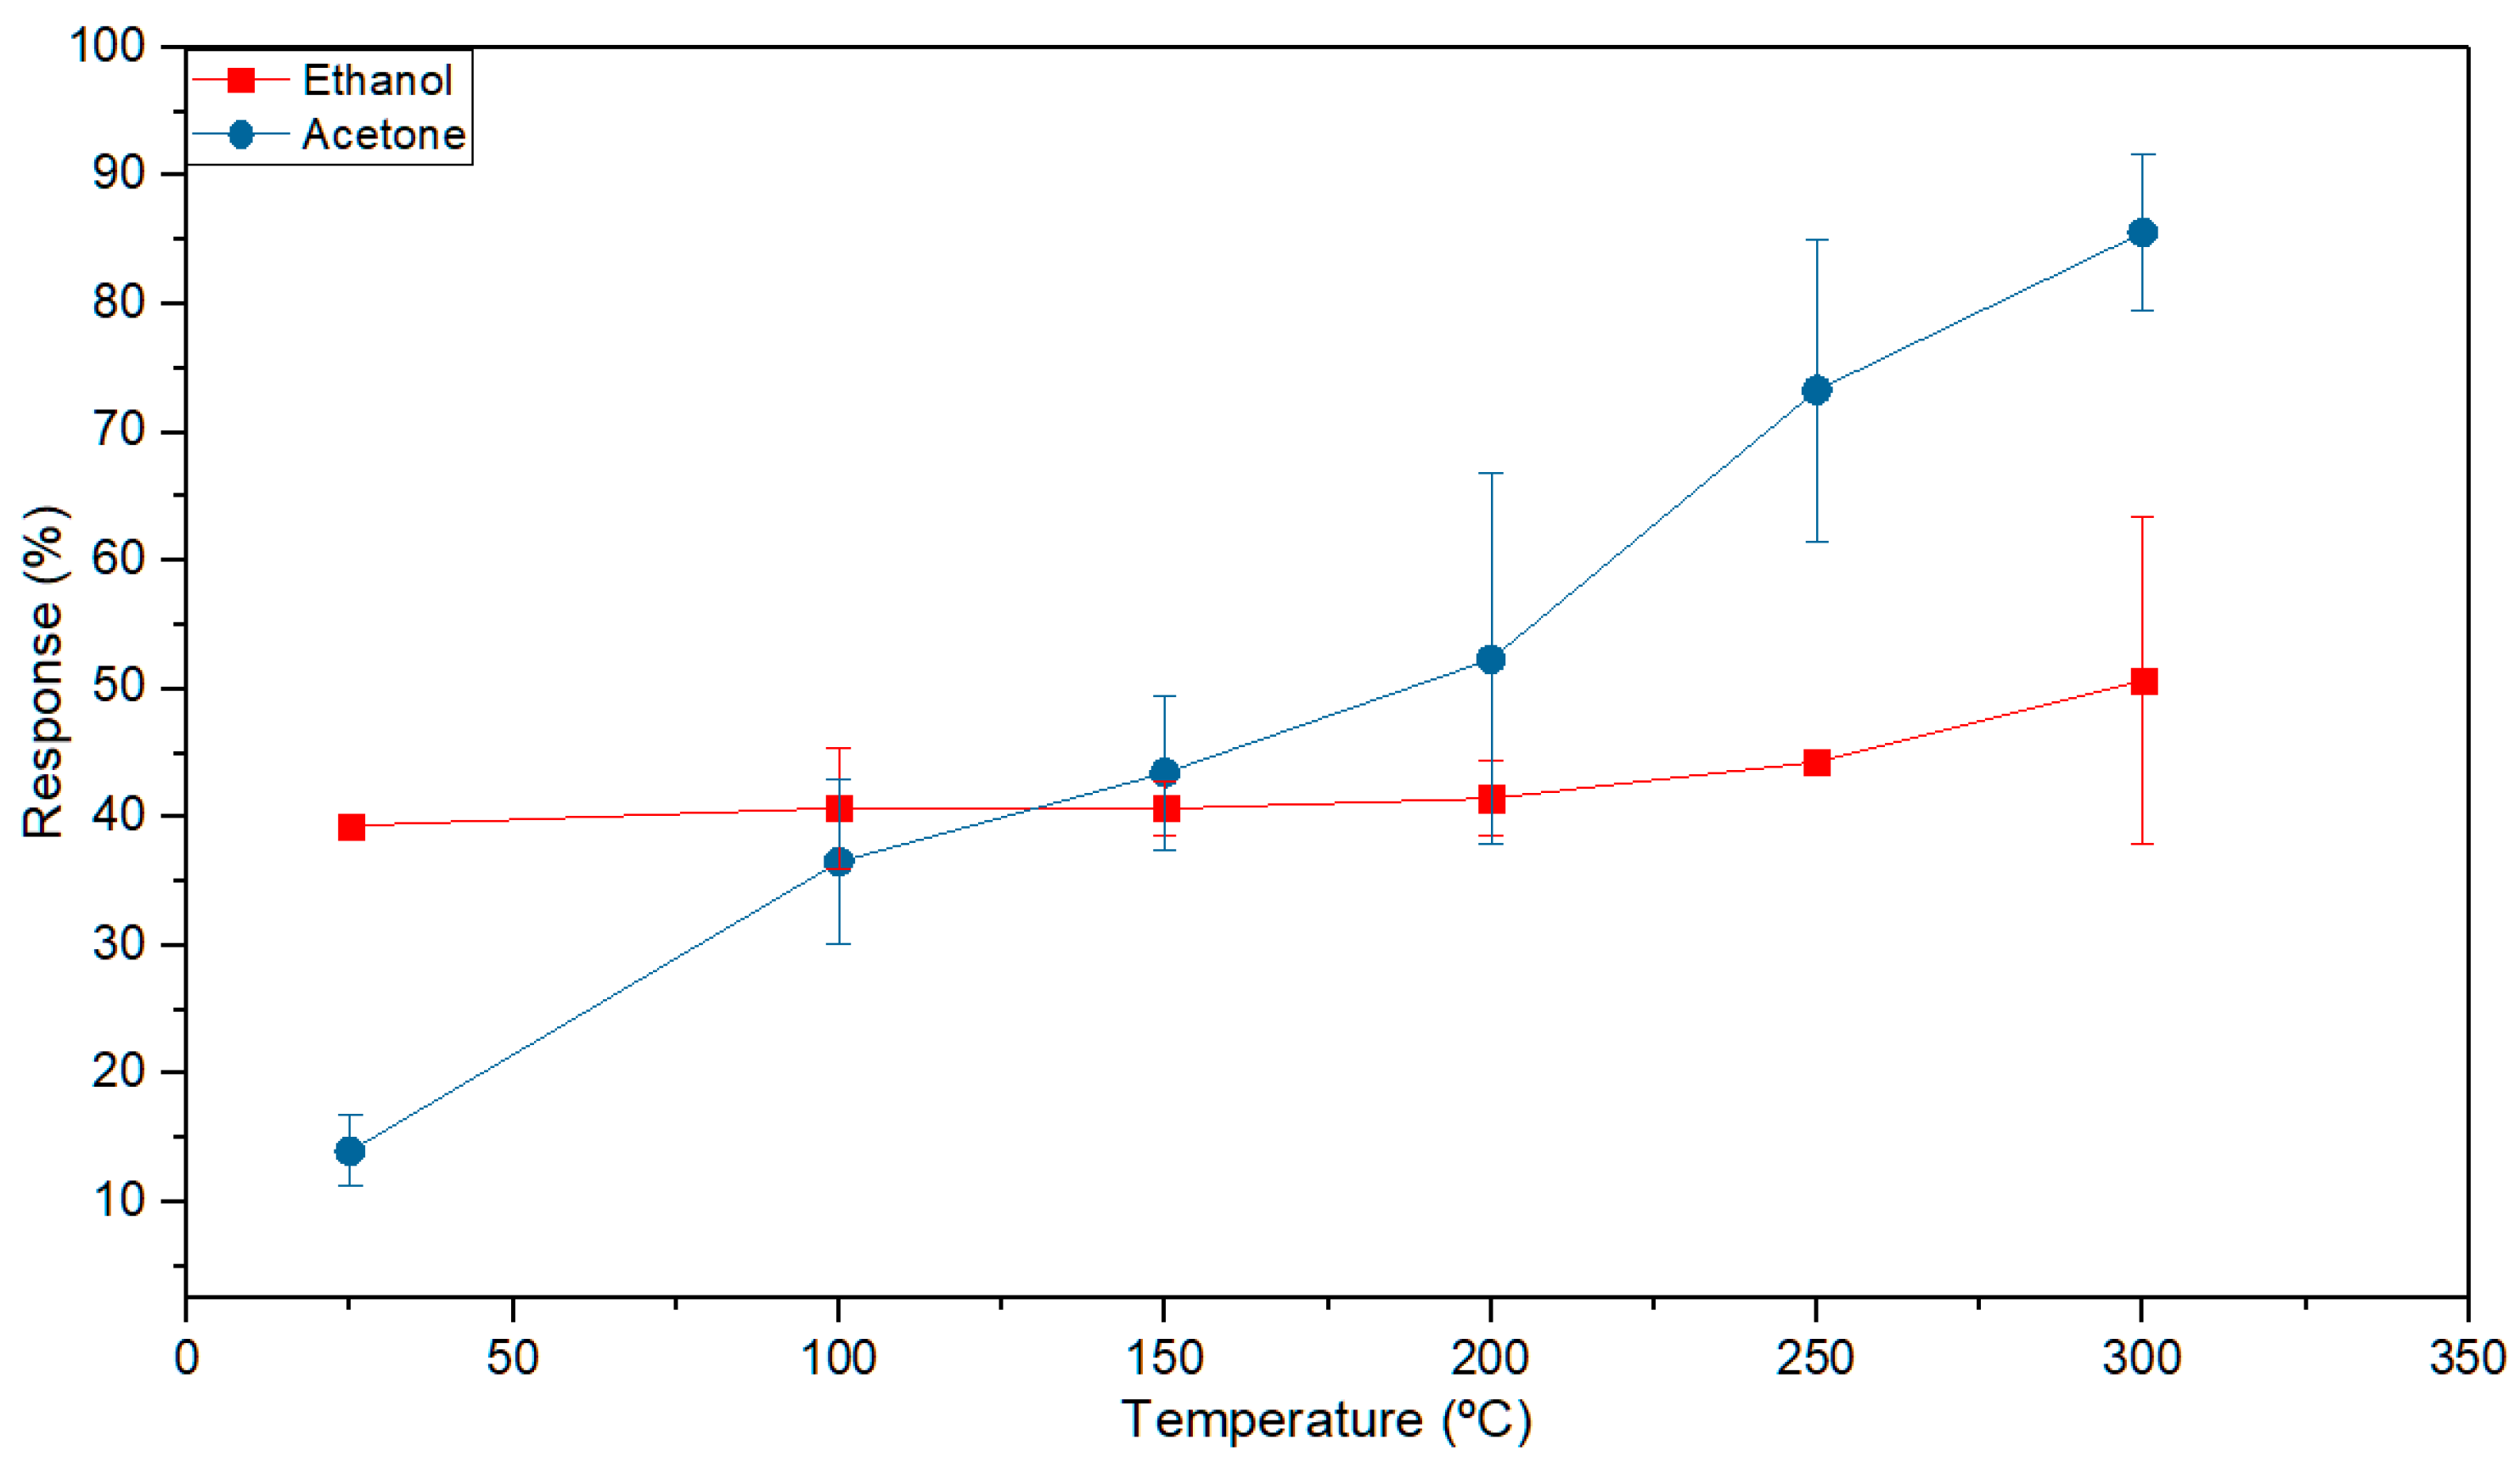
3.2. Sensors Response
4. Conclusions
Author Contributions
Funding
Acknowledgments
Conflicts of Interest
References
- Wilson, A.D.; Baietto, M. Advances in electronic-nose technologies developed for biomedical applications. Sensors 2011, 11, 1105–1176. [Google Scholar] [CrossRef] [PubMed]
- Browne, C.; Stafford, K.J. The use of scent-detection dogs. Irish Vet. J. 2006, 59, 97. [Google Scholar]
- Concha, A.; Mills, D.S.; Feugier, A.; Zulch, H.; Guest, C.; Harris, R.; Pike, T.W. Using sniffing behavior to differentiate true negative from false negative responses in trained scent-detection dogs. Chem. Senses 2014, 39, 749–754. [Google Scholar] [CrossRef] [PubMed] [Green Version]
- World Health Organization. World Report on Ageing and Health; WHO: Geneva, Switzerland, 2015; ISBN 9789241565042. [Google Scholar]
- Persaud, K.; Dodd, G. Analysis of discrimination mechanisms in the mammalian olfactory system using a model nose. Nature 1982, 299, 352–355. [Google Scholar] [CrossRef]
- Rydosz, A. Sensors for enhanced detection of acetone as a potential tool for noninvasive diabetes monitoring. Sensors 2018, 18, 2298. [Google Scholar] [CrossRef] [Green Version]
- Patil, J.V.; Mali, S.S.; Shaikh, J.S.; Patil, A.P.; Patil, P.S.; Hong, C.K. Influence of reduced graphene oxide-TiO2 composite nanofibers in organic indoline DN350 based dye sensitized solar cells. Synth. Met. 2019, 256, 116146. [Google Scholar] [CrossRef]
- Alfano, B.; Miglietta, M.L.; Polichetti, T.; Massera, E.; Bruno, A.; Di Francia, G.; Veneri, P.D. Improvement of NO2 detection: Graphene decorated with ZnO nanoparticles. IEEE Sens. J. 2019, 19, 8751–8757. [Google Scholar] [CrossRef]
- Luan, C.; Zhu, Z.; Mi, W.; Ma, J. Structural and electrical properties of SnO2 films grown on r-cut sapphire at different substrate temperature by MOCVD. Vacuum 2014, 99, 110–114. [Google Scholar] [CrossRef]
- Pan, J.; Shen, H.; Mathur, S. One-dimensional SnO 2 nanostructures: Synthesis and applications. J. Nanotechnol. 2012, 2012. [Google Scholar] [CrossRef] [Green Version]
- Comini, E.; Baratto, C.; Faglia, G.; Ferroni, M.; Vomiero, A.; Sberveglieri, G. Quasi-one dimensional metal oxide semiconductors: Preparation, characterization and application as chemical sensors. Prog. Mater. Sci. 2009, 54, 1–67. [Google Scholar] [CrossRef]
- World Health Organization. World Diabetes Report; WHO: Geneva, Switzerland, 2016; pp. 20–42. ISBN 978-92-4-156525-7. Available online: https://www.who.int/ (accessed on 23 September 2020).
- World Health Organization: Epidemiology of Asthma. Available online: https://www.who.int/news-room/fact-sheets/detail/asthma (accessed on 23 September 2020).
- Amann, A.; Costello, B.D.L.; Miekisch, W.; Schubert, J.; Buszewski, B.; Pleil, J.; Ratcliffe, N.; Risby, T. The human volatilome: Volatile organic compounds (VOCs) in exhaled breath, skin emanations, urine, feces and saliva. J. Breath Res. 2014, 8. [Google Scholar] [CrossRef] [PubMed]
- Centers for Disease Control and Prevention. Las Infecciones Mortales por Estafilococo Siguen Siendo una Amenaza en los EE. UU. Available online: https://www.cdc.gov/spanish/mediosdecomunicacion/comunicados/p_vs_estafilococo_030519.html (accessed on 23 September 2020).
- Sánchez, C.; Santos, J.P.; Lozano, J. Use of electronic noses for diagnosis of digestive and respiratory diseases through the breath. Biosensors 2019, 9, 35. [Google Scholar] [CrossRef] [PubMed] [Green Version]
- Das, S.; Pal, S.; Mitra, M. Significance of exhaled breath test in clinical diagnosis: A special focus on the detection of diabetes Mellitus. J. Med. Biol. Eng. 2016, 36, 605–624. [Google Scholar] [CrossRef] [PubMed] [Green Version]
- Paredi, P.; Kharitonov, S.A.; Leak, D.; Ward, S.; Cramer, D.; Barnes, P.J. Exhaled ethane, a marker of lipid peroxidation, is elevated chronic obstructive pulmonary disease. Am. J. Respir. Crit. Care Med. 2000, 162, 369–373. [Google Scholar] [CrossRef] [PubMed]
- Dweik, R.A.; Boggs, P.B.; Erzurum, S.C.; Irvin, C.G.; Leigh, M.W.; Lundberg, J.O.; Olin, A.C.; Plummer, A.L.; Taylor, D.R. An official ATS clinical practice guideline: Interpretation of exhaled nitric oxide levels (FENO) for clinical applications. Am. J. Respir. Crit. Care Med. 2011, 184, 602–615. [Google Scholar] [CrossRef] [Green Version]
- Barker, M.; Hengst, M.; Schmid, J.; Buers, H.J.; Mittermaier, B.; Klemp, D.; Koppmann, R. Volatile organic compounds in the exhaled breath of young patients with cystic fibrosis. Eur. Respir. J. 2006, 27, 929–936. [Google Scholar] [CrossRef]
- Filipiak, W.; Sponring, A.; Baur, M.M.; Filipiak, A.; Ager, C.; Wiesenhofer, H.; Nagl, M.; Troppmair, J.; Amann, A. Molecular analysis of volatile metabolites released specifically by staphylococcus aureus and pseudomonas aeruginosa. BMC Microbiol. 2012, 12, 113. [Google Scholar] [CrossRef] [Green Version]
- Fedi, F.; Miglietta, M.L.; Polichetti, T.; Ricciardella, F.; Massera, E.; Ninno, D.; Di Francia, G. A study on the physicochemical properties of hydroalcoholic solutions to improve the direct exfoliation of natural graphite down to few-layers graphene. Mater. Res. Express 2015, 2. [Google Scholar] [CrossRef]
- Santos, J.P.; Fernández, M.J.; Fontecha, J.L.; Matatagui, D.; Matatagui, D.; Sayago, I.; Horrillo, M.C.; Gracia, I. Nanocrystalline tin oxide nanofibers deposited by a novel focused electrospinning method. Application to the detection of TATP precursors. Sensors 2014, 14, 24231–24243. [Google Scholar] [CrossRef]
- Horrillo, M.C.; Martí, J.; Matatagui, D.; Santos, J.P.; Sayago, I.; Gutiérrez, J.; Martin-Fernandez, I.; Ivanov, P.; Grcia, I.; Cané, C. Single-walled carbon nanotube microsensors for nerve agent simulant detection. Sens. Actuators B Chem. 2011, 157, 253–259. [Google Scholar] [CrossRef]
- Koski, A.; Yim, K.; Shivkumar, S. Effect of molecular weight on fibrous PVA produced by electrospinning. Mater. Lett. 2004, 58, 493–497. [Google Scholar] [CrossRef]
- Li, Z.; Fan, Y.; Zhan, J. In2O3 nanofibers and nanoribbons: Preparation by electrospinning and their formaldehyde gas-sensing properties. Eur. J. Inorg. Chem. 2010, 2010, 3348–3353. [Google Scholar] [CrossRef]
- Li, X.; Yang, Y.; Zhao, Y.; Lou, J.; Zhao, X.; Wang, R.; Liang, Q.; Huang, Z. Electrospinning fabrication and in situ mechanical investigation of individual graphene nanoribbon reinforced carbon nanofiber. Carbon NY 2017, 114, 717–723. [Google Scholar] [CrossRef] [Green Version]
- Yang, G.; Wang, L.; Wang, J.; Wei, W.; Yan, W. Fabrication of lithium manganese oxide nanoribbons by electrospinning: A general strategy and formation mechanism. Mater. Des. 2016, 112, 429–435. [Google Scholar] [CrossRef]
- Harrison, P.G.; Willett, M.J. Tin oxide surfaces. Part 20.—Electrical properties of tin(IV) oxide gel: Nature of the surface species controlling the electrical conductance in air as a function of temperature. J. Chem. Soc. Faraday Trans. 1 Phys. Chem. Condens. Phases 1989, 85, 1921–1932. [Google Scholar] [CrossRef]
- McAleer, J.F.; Moseley, P.T.; Norris, J.O.W.; Williams, D.E. Tin dioxide gas sensors. Part 1.—Aspects of the surface chemistry revealed by electrical conductance variations. J. Chem. Soc. Faraday Trans. 1 Phys. Chem. Condens. Phases 1987, 83, 1323–1346. [Google Scholar] [CrossRef]
- Yamazoe, N.; Fuchigami, J.; Kishikawa, M.; Seiyama, T. Interactions of tin oxide surface with O2, H2O and H2. Surf. Sci. 1979, 86, 335–344. [Google Scholar] [CrossRef]
- Jinkawa, T.; Sakai, G.; Tamaki, J.; Miura, N.; Yamazoe, N. Relationship between ethanol gas sensitivity and surface catalytic property of tin oxide sensors modified with acidic or basic oxides. J. Mol. Catal. A Chem. 2000, 155, 193–200. [Google Scholar] [CrossRef]
- Qin, L.; Xu, J.; Dong, X.; Pan, Q.; Cheng, Z.; Xiang, Q.; Li, F. The template-free synthesis of square-shaped SnO2 nanowires: The temperature effect and acetone gas sensors. Nanotechnology 2008, 19. [Google Scholar] [CrossRef]
- Barsan, N.; Weimar, U. Conduction model of metal oxide gas sensors. J. Electroceramics 2001, 7, 143–167. [Google Scholar] [CrossRef]
- Pavelko, R.G.; Daly, H.; Hardacre, C.; Vasiliev, A.A.; Llobet, E. Interaction of water, hydrogen and their mixtures with SnO2 based materials: The role of surface hydroxyl groups in detection mechanisms. Phys. Chem. Chem. Phys. 2010, 12, 2639–2647. [Google Scholar] [CrossRef]
- Shankar, P.; Rayappan, J. Gas sensing mechanism of metal oxides: The role of ambient atmosphere, type of semiconductor and gases-A review. Sci. Lett. J 2015, 4, 126. [Google Scholar]
- Abideen, Z.U.; Park, J.Y.; Kim, H.W.; Kim, S.S. Graphene-loaded tin oxide nanofibers: Optimization and sensing performance. Nanotechnology 2017, 28, 035501. [Google Scholar] [CrossRef] [PubMed]
- Sun, D.; Luo, Y.; Debliquy, M.; Zhang, C. Graphene-enhanced metal oxide gas sensors at room temperature: A review. Beilstein J. Nanotechnol. 2018, 9, 2832–2844. [Google Scholar] [CrossRef] [PubMed]
- Qi, W.; Li, W.; Sun, Y.; Guo, J.; Xie, D.; Cai, L.; Zhu, H.; Xiang, L.; Ren, T. Influence of low-dimension carbon-based electrodes on the performance of SnO2 nanofiber gas sensors at room temperature. Nanotechnology 2019, 30, 345503. [Google Scholar] [CrossRef] [PubMed]
- Lee, J.H.; Katoch, A.; Choi, S.W.; Kim, J.H.; Kim, H.W.; Kim, S.S. Extraordinary improvement of gas-sensing performances in SnO2 nanofibers due to creation of local p–N heterojunctions by loading reduced graphene oxide nanosheets. ACS Appl. Mater. Interfaces 2015, 7, 3101–3109. [Google Scholar] [CrossRef]


| Disease | Biomarker | Concentration Range for Healthy Persons | Concentration Range for Ill Persons |
|---|---|---|---|
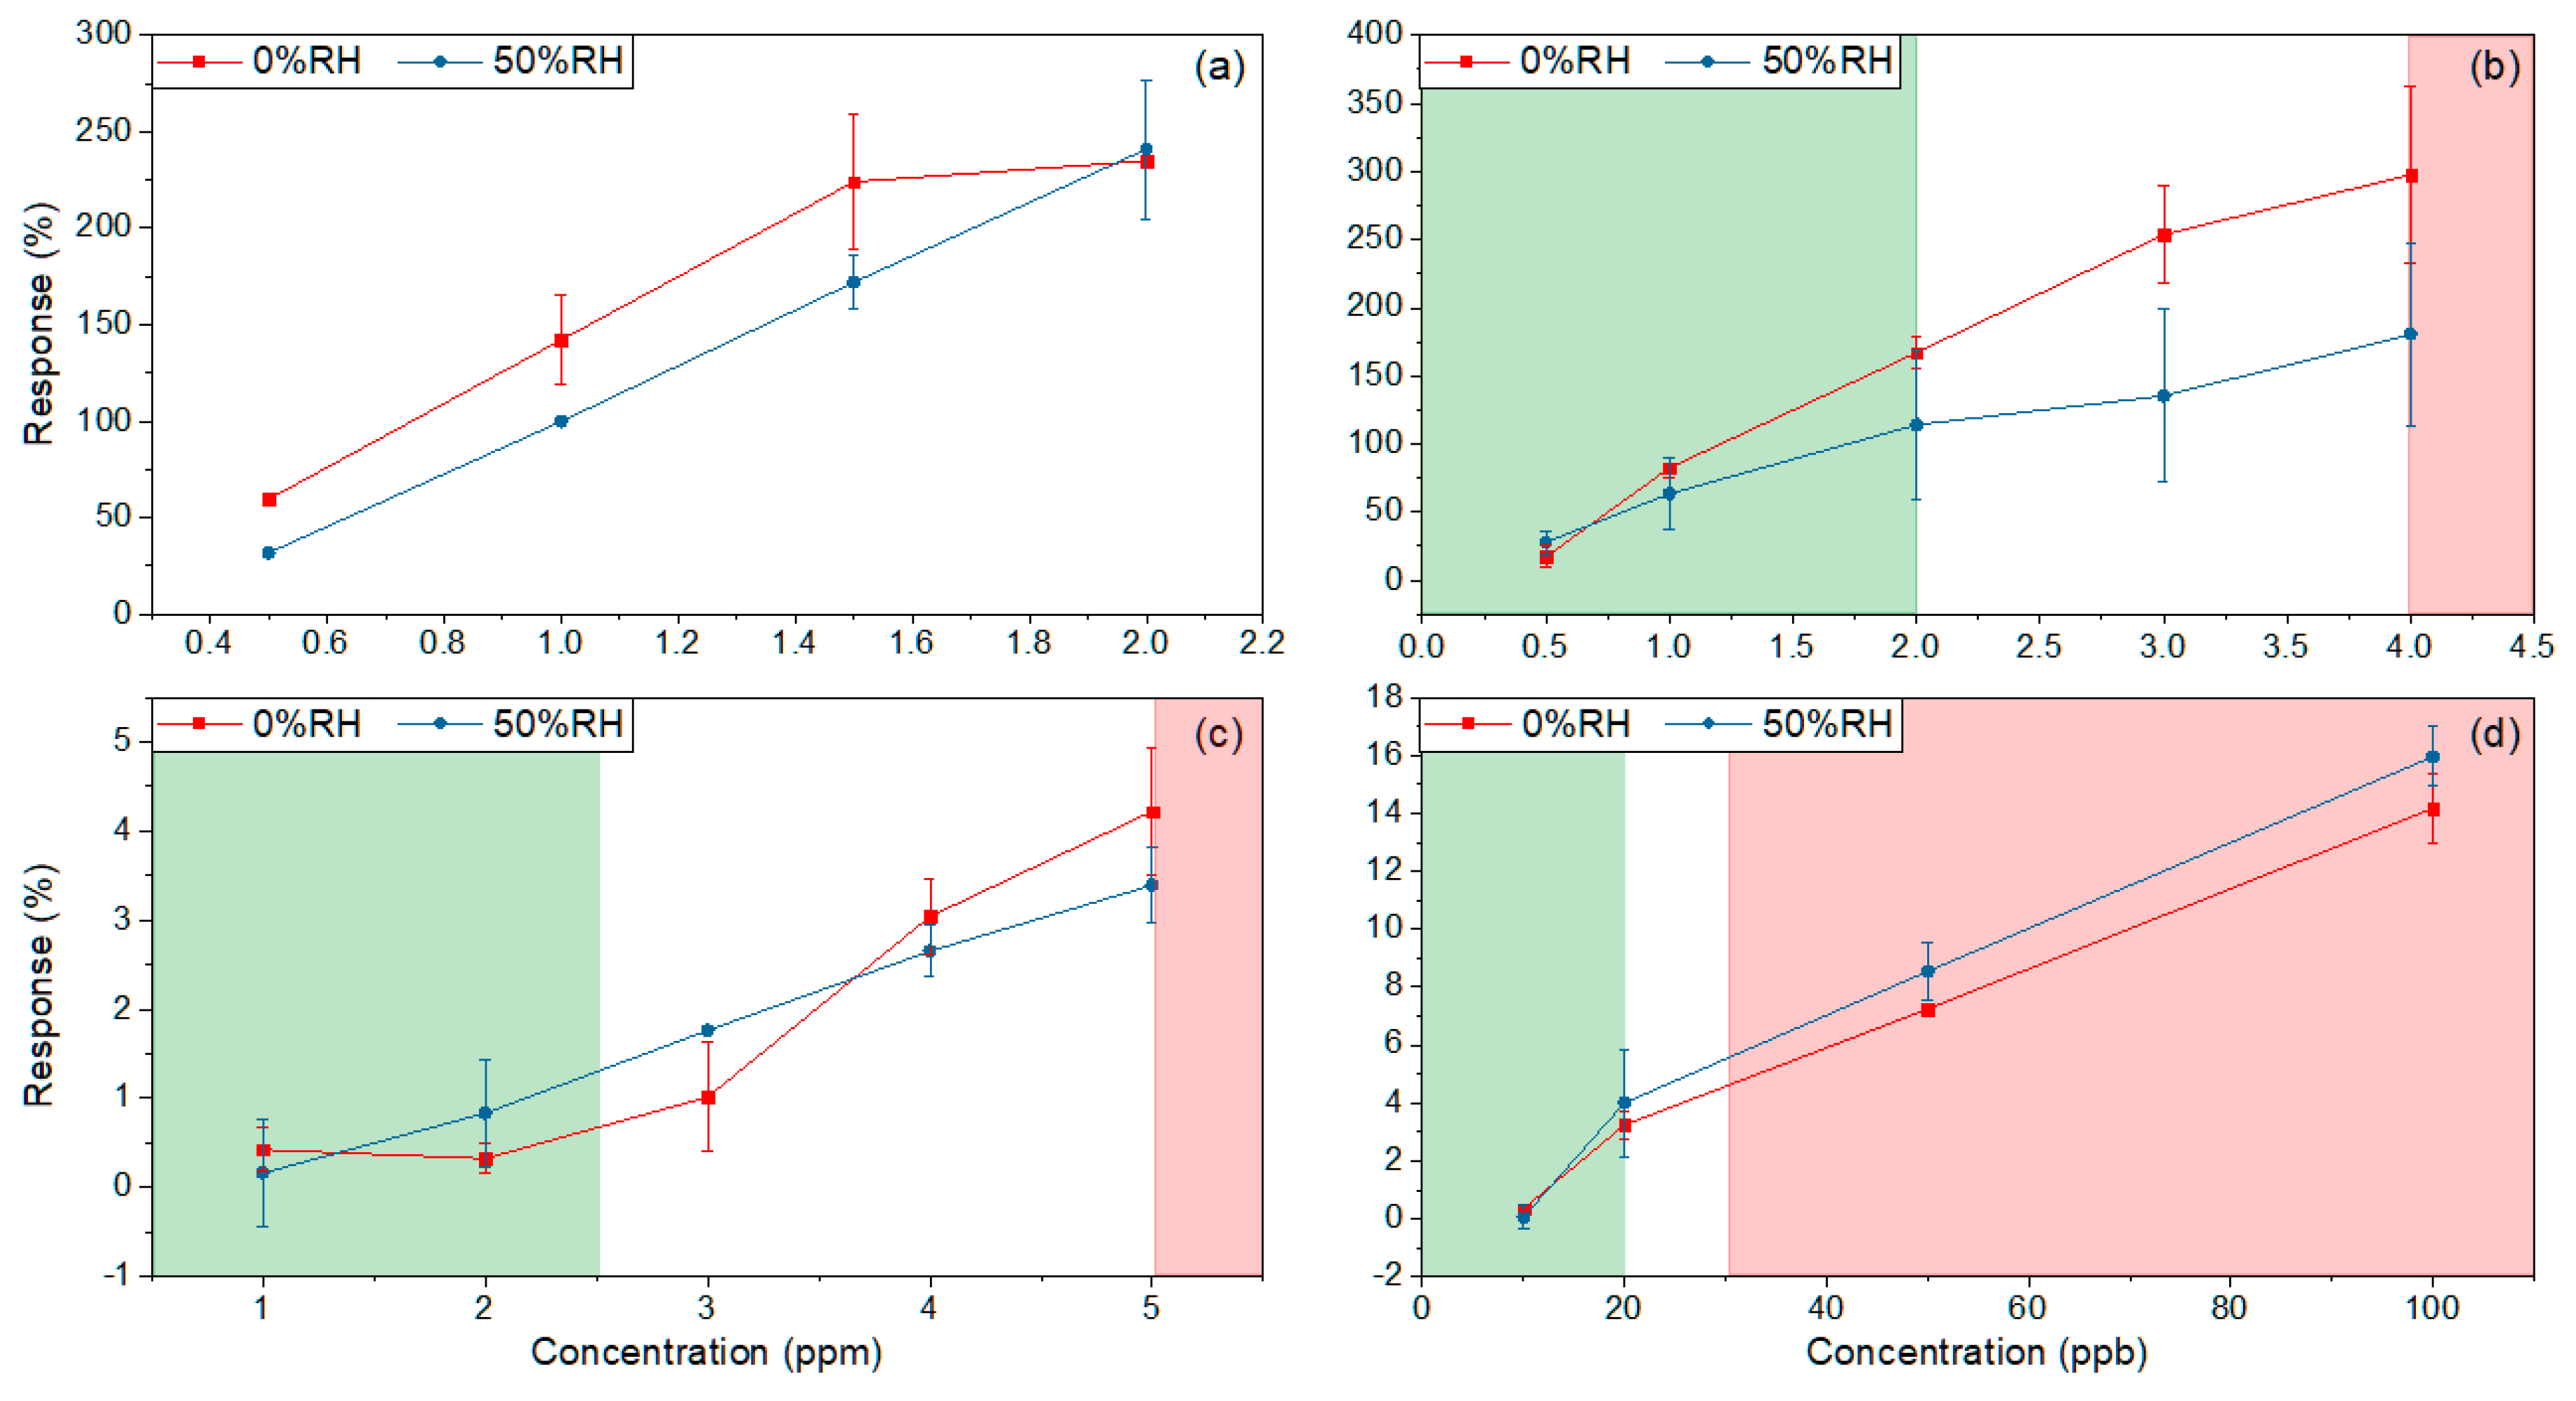
| Diabetes [17] | Acetone | 0.5–2 ppm | >4 ppm |
| Asthma, COPD and Cystic Fibrosis [16,18,19,20] | NO | 1–20 ppb | >25 ppb |
| CO | 1–2 ppm | >5 ppm |
| Disease | Biomarker | 1.5 h | 3 h | 4.5 h | 6 h |
|---|---|---|---|---|---|
| Staphylococcus aureus infection [21] | Ethanol | 89 ppb | 237 ppb | 6173 ppb | 11,695 ppb |
| Biomarker | Concentrations |
|---|---|
| Ethanol | 0.5, 1, 1.5 and 2 ppm |
| Acetone | 0.5, 1, 2, 3, and 4 ppm |
| CO | 1, 2, 3, 4 and 5 ppm |
| NO | 10, 20, 50 and 100 ppb |
| Biomarker | 0% RH | 50% RH |
|---|---|---|
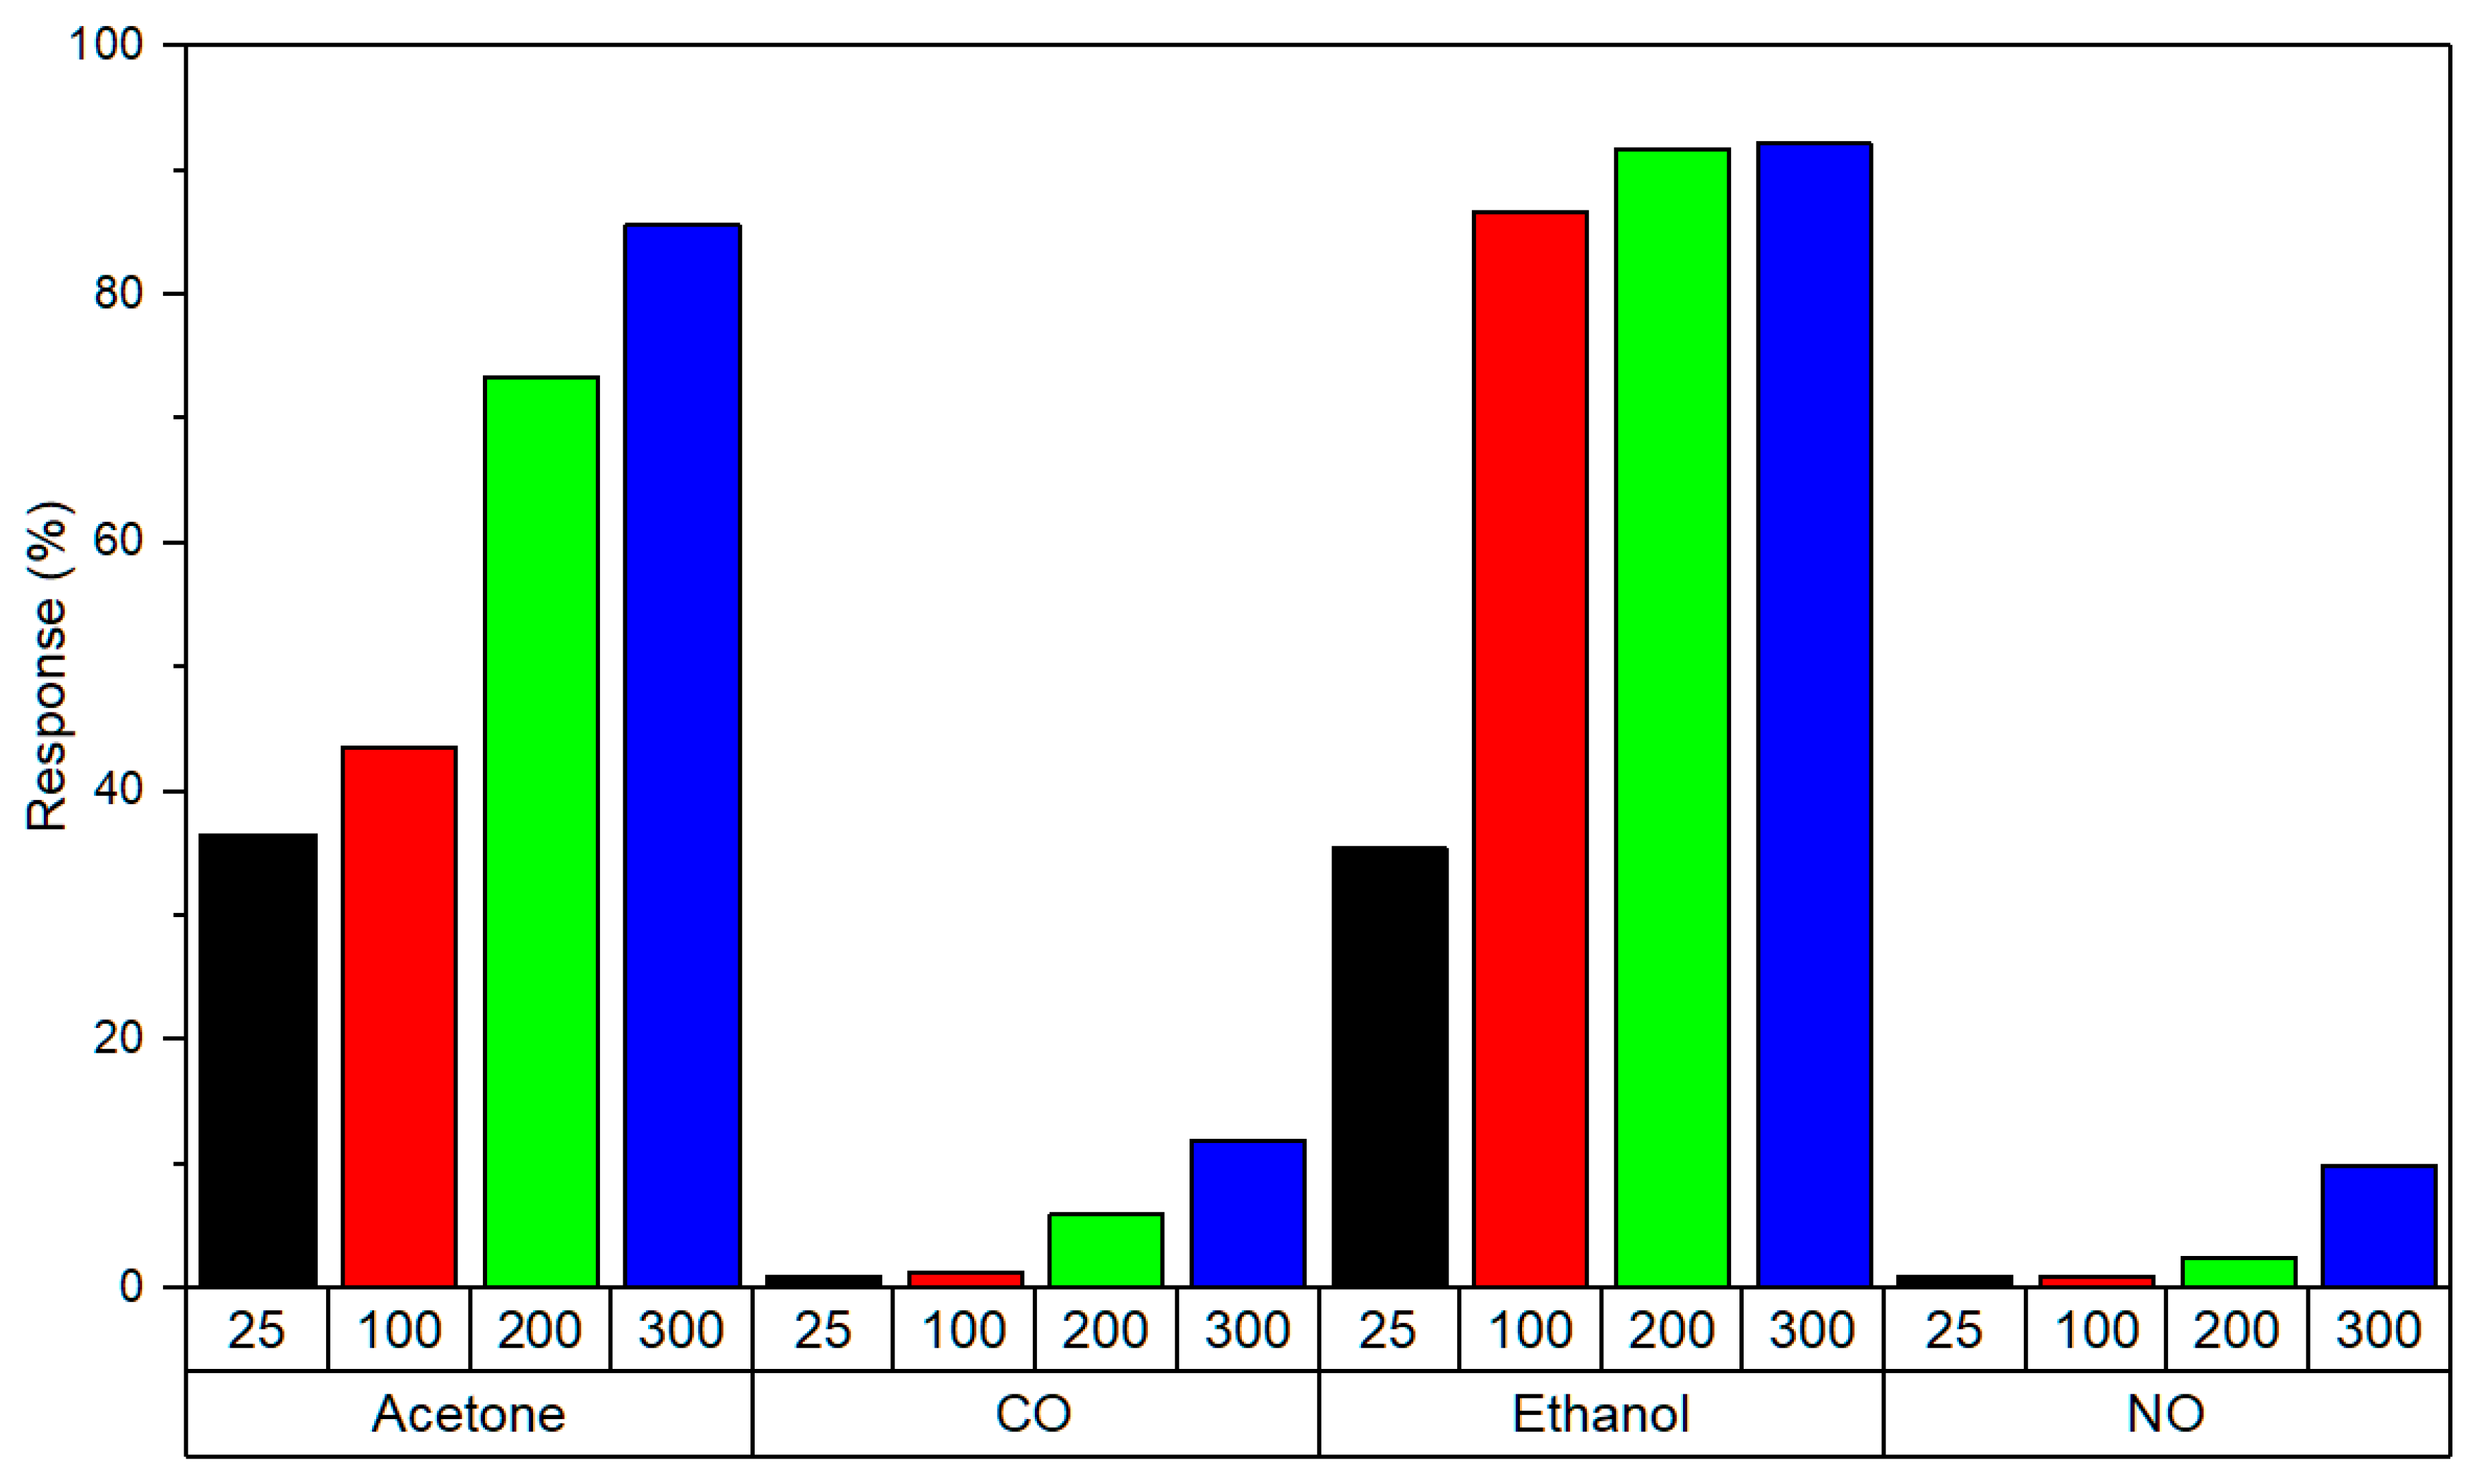
| Acetone | 130.5% | 66.3% |
| CO | 3.9% | 2.6% |
| NO | 4.1% | 4.5% |
| Biomarker | 0% RH | 50% RH |
|---|---|---|
| Ethanol | 175.1% | 209.1% |
Publisher’s Note: MDPI stays neutral with regard to jurisdictional claims in published maps and institutional affiliations. |
© 2020 by the authors. Licensee MDPI, Basel, Switzerland. This article is an open access article distributed under the terms and conditions of the Creative Commons Attribution (CC BY) license (http://creativecommons.org/licenses/by/4.0/).
Share and Cite
Sánchez-Vicente, C.; Santos, J.P.; Lozano, J.; Sayago, I.; Sanjurjo, J.L.; Azabal, A.; Ruiz-Valdepeñas, S. Graphene-Doped Tin Oxide Nanofibers and Nanoribbons as Gas Sensors to Detect Biomarkers of Different Diseases through the Breath. Sensors 2020, 20, 7223. https://0-doi-org.brum.beds.ac.uk/10.3390/s20247223
Sánchez-Vicente C, Santos JP, Lozano J, Sayago I, Sanjurjo JL, Azabal A, Ruiz-Valdepeñas S. Graphene-Doped Tin Oxide Nanofibers and Nanoribbons as Gas Sensors to Detect Biomarkers of Different Diseases through the Breath. Sensors. 2020; 20(24):7223. https://0-doi-org.brum.beds.ac.uk/10.3390/s20247223
Chicago/Turabian StyleSánchez-Vicente, Carlos, José Pedro Santos, Jesús Lozano, Isabel Sayago, José Luis Sanjurjo, Alfredo Azabal, and Santiago Ruiz-Valdepeñas. 2020. "Graphene-Doped Tin Oxide Nanofibers and Nanoribbons as Gas Sensors to Detect Biomarkers of Different Diseases through the Breath" Sensors 20, no. 24: 7223. https://0-doi-org.brum.beds.ac.uk/10.3390/s20247223