Article

Evaluation for Potential Drug–Drug Interaction of MT921 Using In Vitro Studies and Physiologically–Based Pharmacokinetic Models

1
Gwangkyo R&D Center, Medytox Inc., Suwon 16506, Korea
2
College of Pharmacy, Chungnam National University, Daejeon 34134, Korea
*
Authors to whom correspondence should be addressed.
Those of authors contributed equally for this work as first author.
Pharmaceuticals 2021, 14(7), 654; https://0-doi-org.brum.beds.ac.uk/10.3390/ph14070654
Submission received: 2 June 2021 / Revised: 1 July 2021 / Accepted: 1 July 2021 / Published: 7 July 2021

Abstract

:
MT921 is a new injectable drug developed by Medytox Inc. to reduce submental fat. Cholic acid is the active pharmaceutical ingredient, a primary bile acid biosynthesized from cholesterol, endogenously produced by liver in humans and other mammals. Although individuals treated with MT921 could be administered with multiple medications, such as those for hypertension, diabetes, and hyperlipidemia, the pharmacokinetic drug–drug interaction (DDI) has not been investigated yet. Therefore, we studied in vitro against drug-metabolizing enzymes and transporters. Moreover, we predicted the potential DDI between MT921 and drugs for chronic diseases using physiologically-based pharmacokinetic (PBPK) modeling and simulation. The magnitude of DDI was found to be negligible in in vitro inhibition and induction of cytochrome P450s and UDP-glucuronosyltransferases. Organic anion transporting polypeptide (OATP)1B3, organic anion transporter (OAT)3, Na+-taurocholate cotransporting polypeptide (NTCP), and apical sodium-dependent bile acid transporter (ASBT) are mainly involved in MT921 transport. Based on the result of in vitro experiments, the PBPK model of MT921 was developed and evaluated by clinical data. Furthermore, the PBPK model of amlodipine was developed and evaluated. PBPK DDI simulation results indicated that the pharmacokinetics of MT921 was not affected by the perpetrator drugs. In conclusion, MT921 could be administered without a DDI risk based on in vitro study and related in silico simulation. Further clinical studies are needed to validate this finding.

1. Introduction

MT921 is a new injectable drug developed by Medytox Inc. intended to reduce submental fat, commonly referred to as double chin, through a minimally invasive medical procedure known as injection adipolysis. Its active pharmaceutical ingredient is cholic acid (CA), a primary bile acid synthesized from cholesterol and endogenously produced in the liver of humans and other mammals [1]. In adult humans, the synthesis of CA primarily occurs via the classical pathway of bile acids (BA) biosynthesis [2], inside hepatocytes. It starts with hydroxylation of cholesterol to 7α-hydroxycholesterol by the cholesterol 7α-hydroxylase (CYP7A1) enzyme [3]. Most BAs are reabsorbed in the ileum and sent to the liver by active transport, called enterohepatic circulation. This process involves various transporters, including organic anion transporting polypeptides (OATPs), organic anion transporters (OATs), a Na+-taurocholate cotransporting polypeptide (NTCP), an apical sodium-dependent bile acid transporter (ASBT), and a bile salt export pump (BSEP) [4,5,6,7].
CA is an amphipathic molecule with surfactant properties capable of dissolving lipid bilayers. CA is particularly effective in adipolysis, a process that involves destabilizing and disintegrating the lipid bilayer of adipocytes, the major cell found in adipose tissue [8,9,10,11]. A single subcutaneous injection of MT921 into the submental region at strategic intervals results in a significant reduction of submental fat (the data is not shown due to confidentiality issues). Individuals treated with MT921 are likely to have a high body mass index (BMI), so they may presumably be afflicted with some form of metabolic syndrome, such as hypertension, diabetes, and hyperlipidemia, among others [12,13]. Therefore, there is a high probability that these individuals would be on some medication to treat their existing medical condition. Hence, it is imperative to determine the pharmacokinetic drug–drug interaction (DDI) of MT921 to avoid any antagonistic or adverse effect in these patients.
The present study assessed the in vitro pharmacokinetic interaction potential of MT921 following the US Food and Drug Administration (FDA) guidelines [14]. In addition, the effect of MT921 on pharmacokinetics of drugs for metabolic diseases was also investigated by performing physiologically-based pharmacokinetic (PBPK) modeling and simulation studies.

2. Results

2.1. In Vitro Potential on Transporters

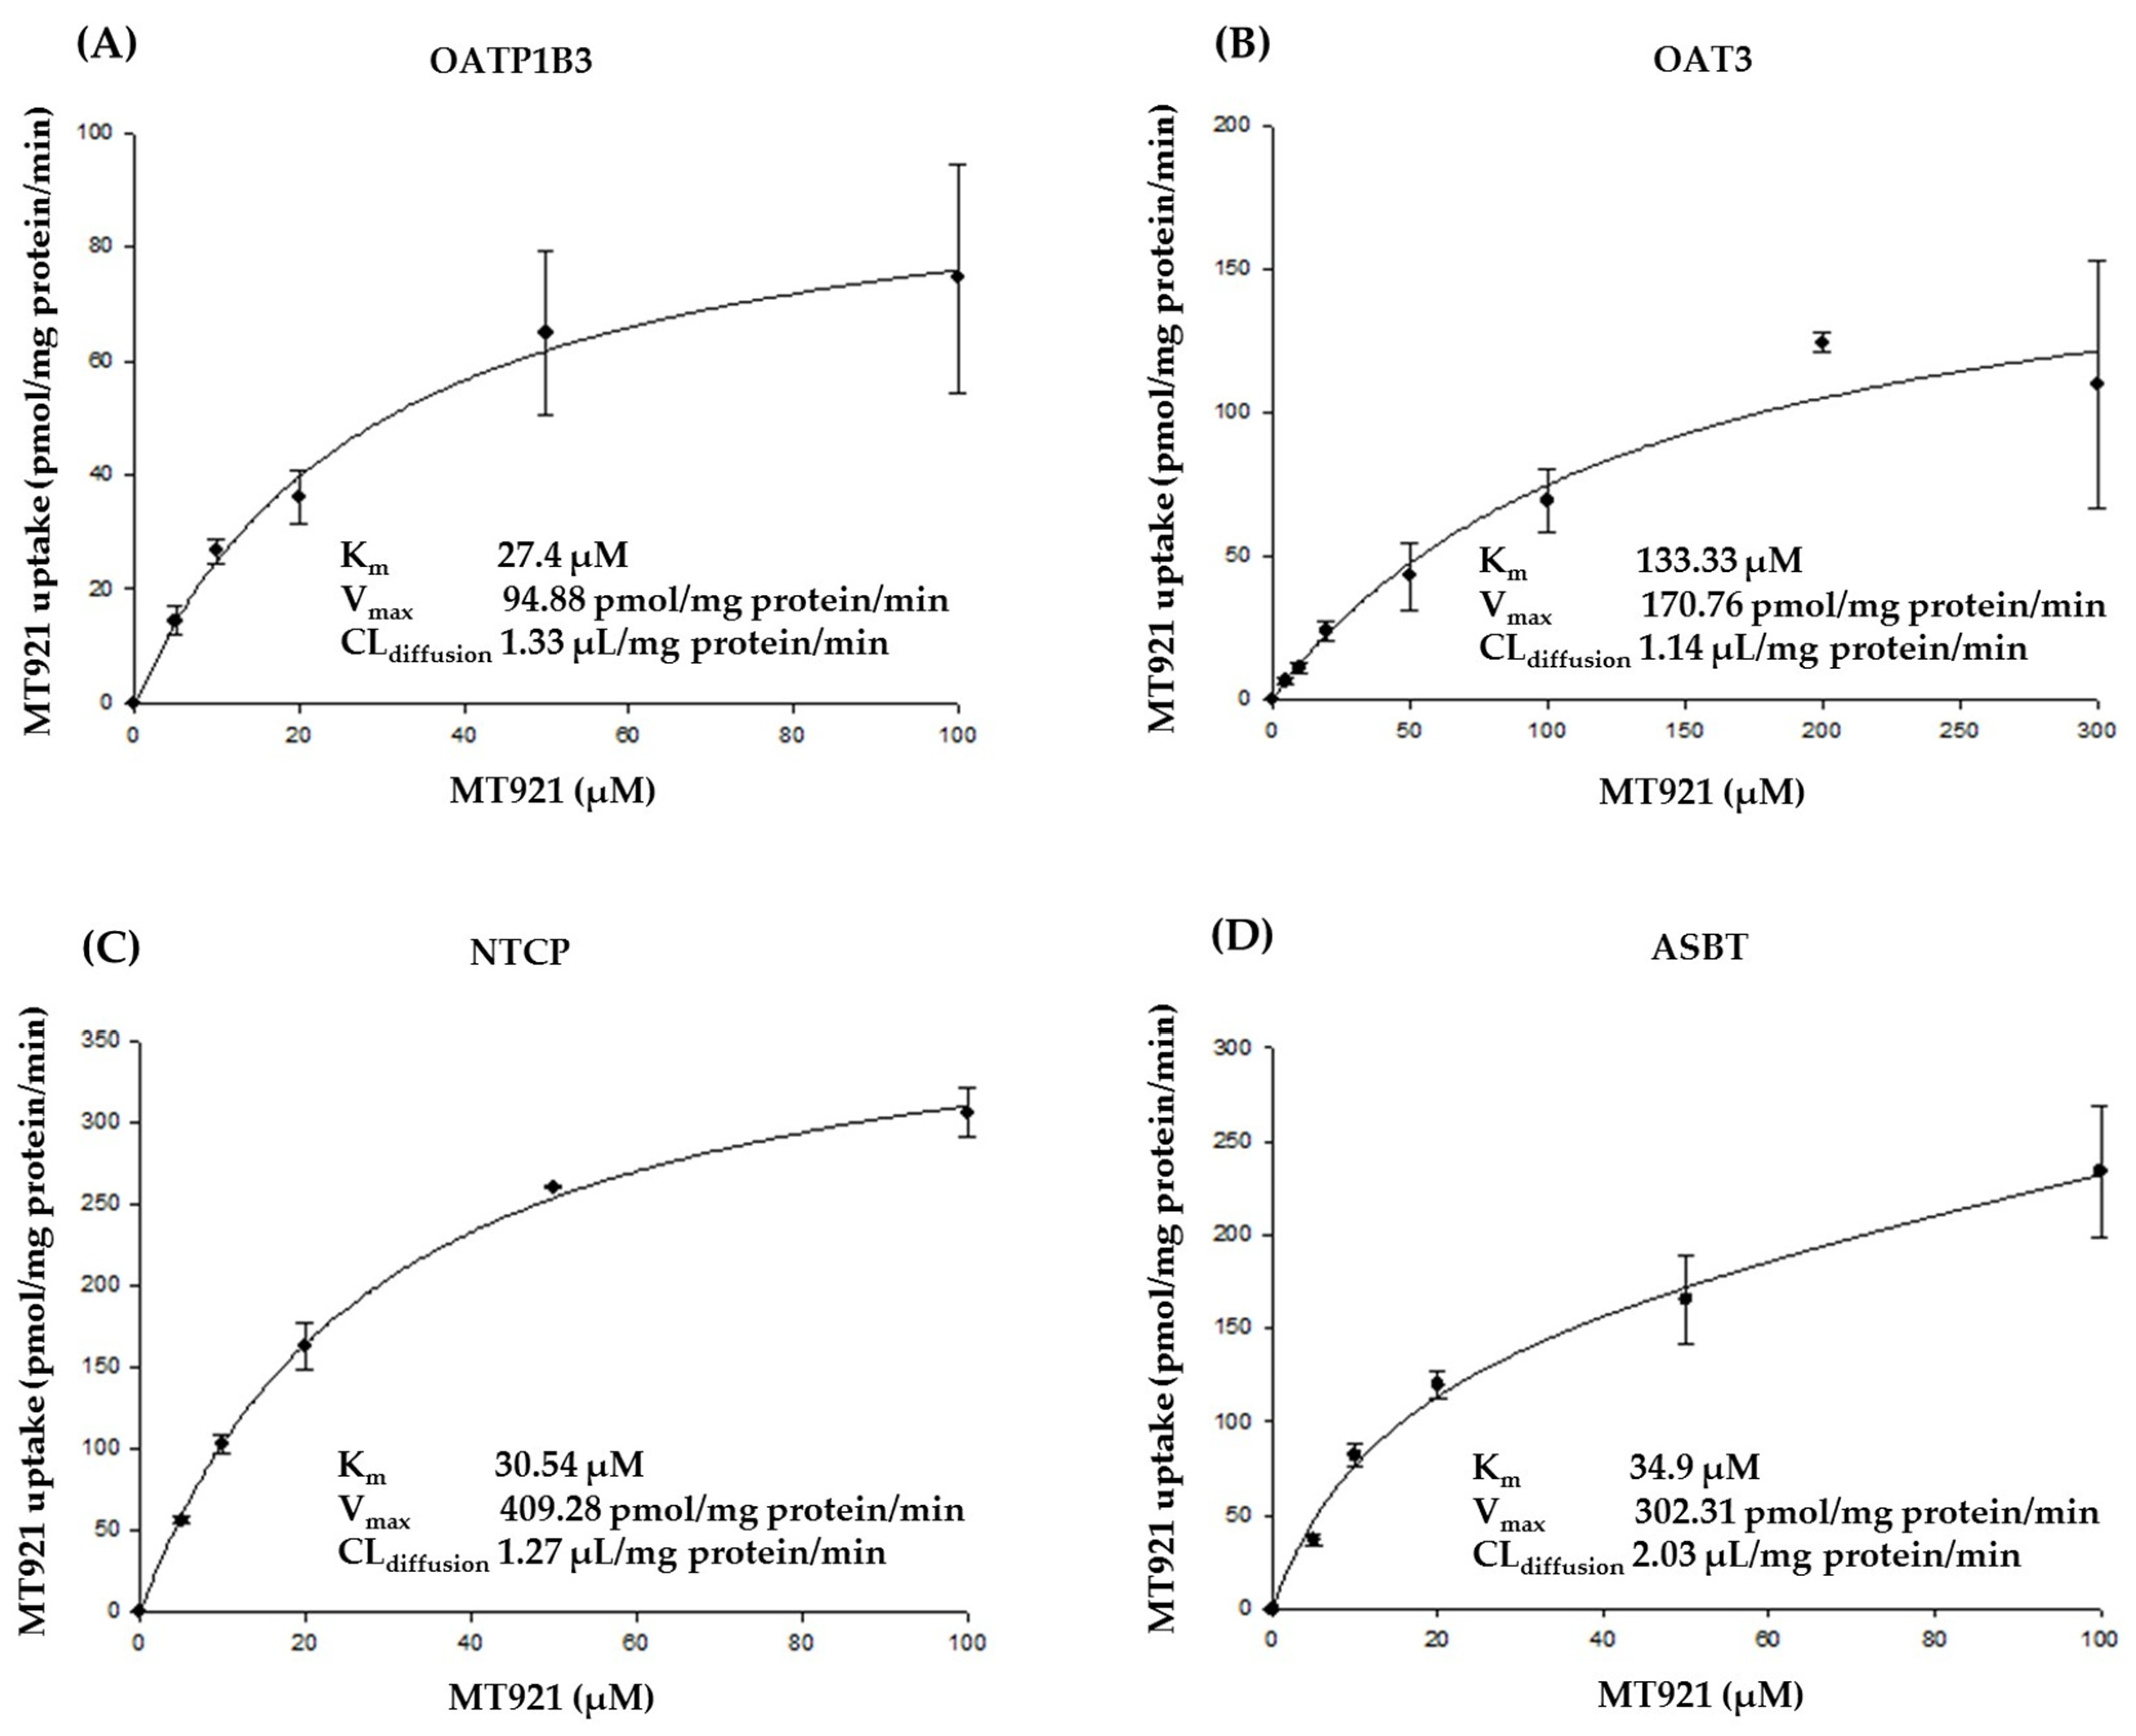
2.1.1. Substrate Specificity of MT921 for OATP1B1, OATP1B3, OAT3, NTCP, and ASBT

Substrate specificity of MT921 for OATP1B1, OATP1B3, OAT3, NTCP, and ASBT was identified in the human embryonic kidney (HEK) 293-OATP1B1, -OATP1B3, -OAT3, -NTCP,–ASBT, and mock cells. To ensure significance, we confirmed the uptake rates of the positive control substrate by the respective transporter-expressing cells and mock cells. The uptake rates of probe substrates (0.022 µM [3H]estrone-3-sulfate for OATP1B1 and OAT3, 0.06 µM [3H]estradiol-17β-D-glucuronide for OATP1B3, 0.8 µM [3H]taurocholate for NTCP and ASBT) in transporter-expressing cells greatly increased compared to those in mock cells and decreased in the presence of representative inhibitors (30 µM cyclosporine A for OATP1B1 and OATP1B3, 50 µM diclofenac for OAT3, 30 µM bromsulphthalein for NTCP, 100 µM deoxycholate for ASBT) (31.3-fold increase in [3H]estrone-3-sulfate for OATP1B1; 9.6-fold increase in [3H]estradiol-17β-D-glucuronide for OATP1B3; 19.4-fold increase in [3H]estrone-3-sulfate for OAT3; 102.1-fold increase in [3H]taurocholate for NTCP; 60.3-fold increase in [3H]taurocholate for ASBT). Uptake rate was determined at two different concentrations of MT921 (10 µM and 100 µM) in transporter-expressing cells and mock cells. The OATP1B1 transporter showed less than two-fold of uptake ratio, and thus was not involved in MT921 transport, according to US FDA guidelines [14], whereas OATP1B3, OAT3, NTCP, and ASBT showed greater than two-fold of uptake ratio, and thus could be involved in transport of MT921. The uptake rate of MT921 was higher in 10 µM of MT921 than 100 µM of MT921, indicating that the transporters may get saturated, thus plateauing the uptake (Table 1).
We confirmed the concentration-dependent uptake of MT921 by OATP1B3, OAT3, NTCP, and ASBT and calculated their kinetic values (Km, Vmax) in HEK 293-OATP1B3, -OAT3, -NTCP, -ASBT, and mock cells, with increasing MT921 concentration (5–100 µM for OATP1B3, NTCP, and ASBT, 5–300 µM for OAT3) (Figure 1). Kinetic parameters of OATP1B3-mediated MT921 uptake were Km 27.4 µM, Vmax 94.88 pmol/mg protein/min, intrinsic clearance (Vmax/Km) 3.46 µL/mg protein/min, and CLdiffusion 1.33 µL/mg protein/min (Figure 1A). In the OAT3-mediated MT921 uptake, Km, Vmax, intrinsic clearance, and CLdiffusion were calculated as 133.33 µM, 170.76 pmol/mg protein/min, 1.28 µL/mg protein/min, and 1.14 µL/mg protein/min, respectively (Figure 1B). For NTCP, Km, Vmax, intrinsic clearance, and CLdiffusion were 30.54 µM, 409.28 pmol/mg protein/min, 13.4 µL/mg protein/min, and 1.27 µL/mg protein/min, respectively (Figure 1C). In the case of ASBT, Km, Vmax, intrinsic clearance, and CLdiffusion were calculated as 34.9 µM, 302.31 pmol/mg protein/min, 8.66 µL/mg protein/min, and 2.03 µL/mg protein/min, respectively (Figure 1D).

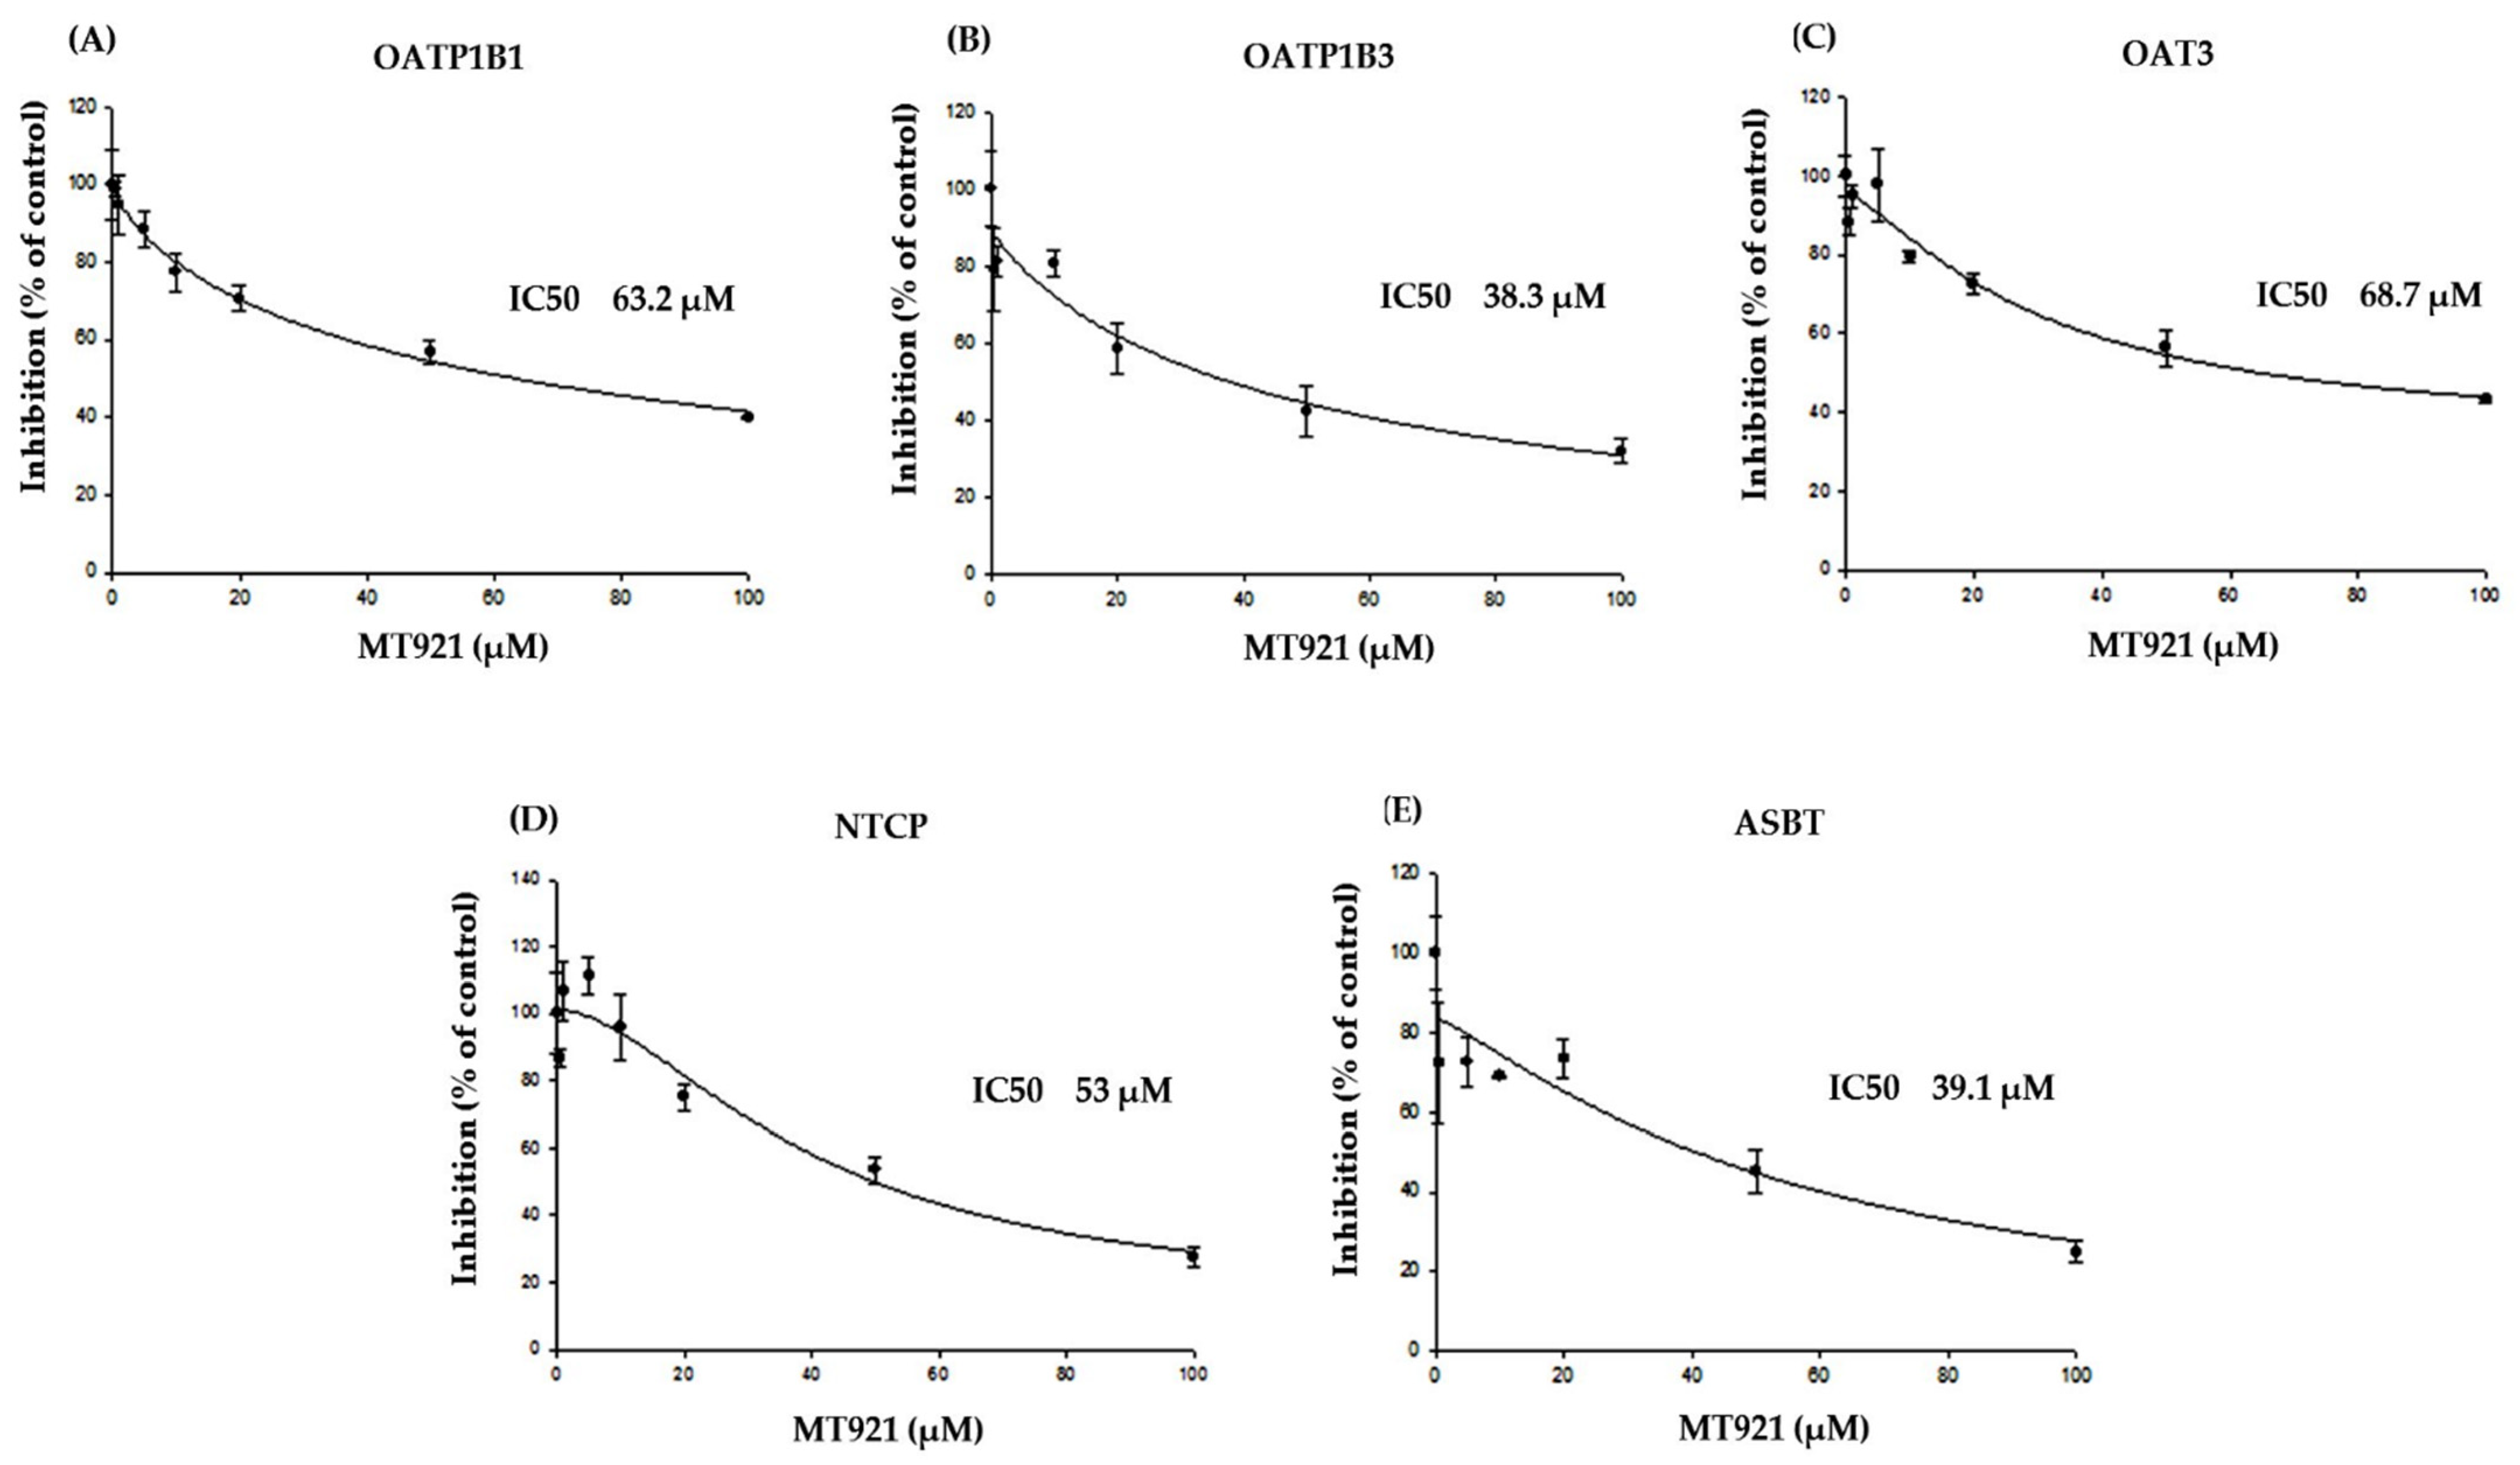
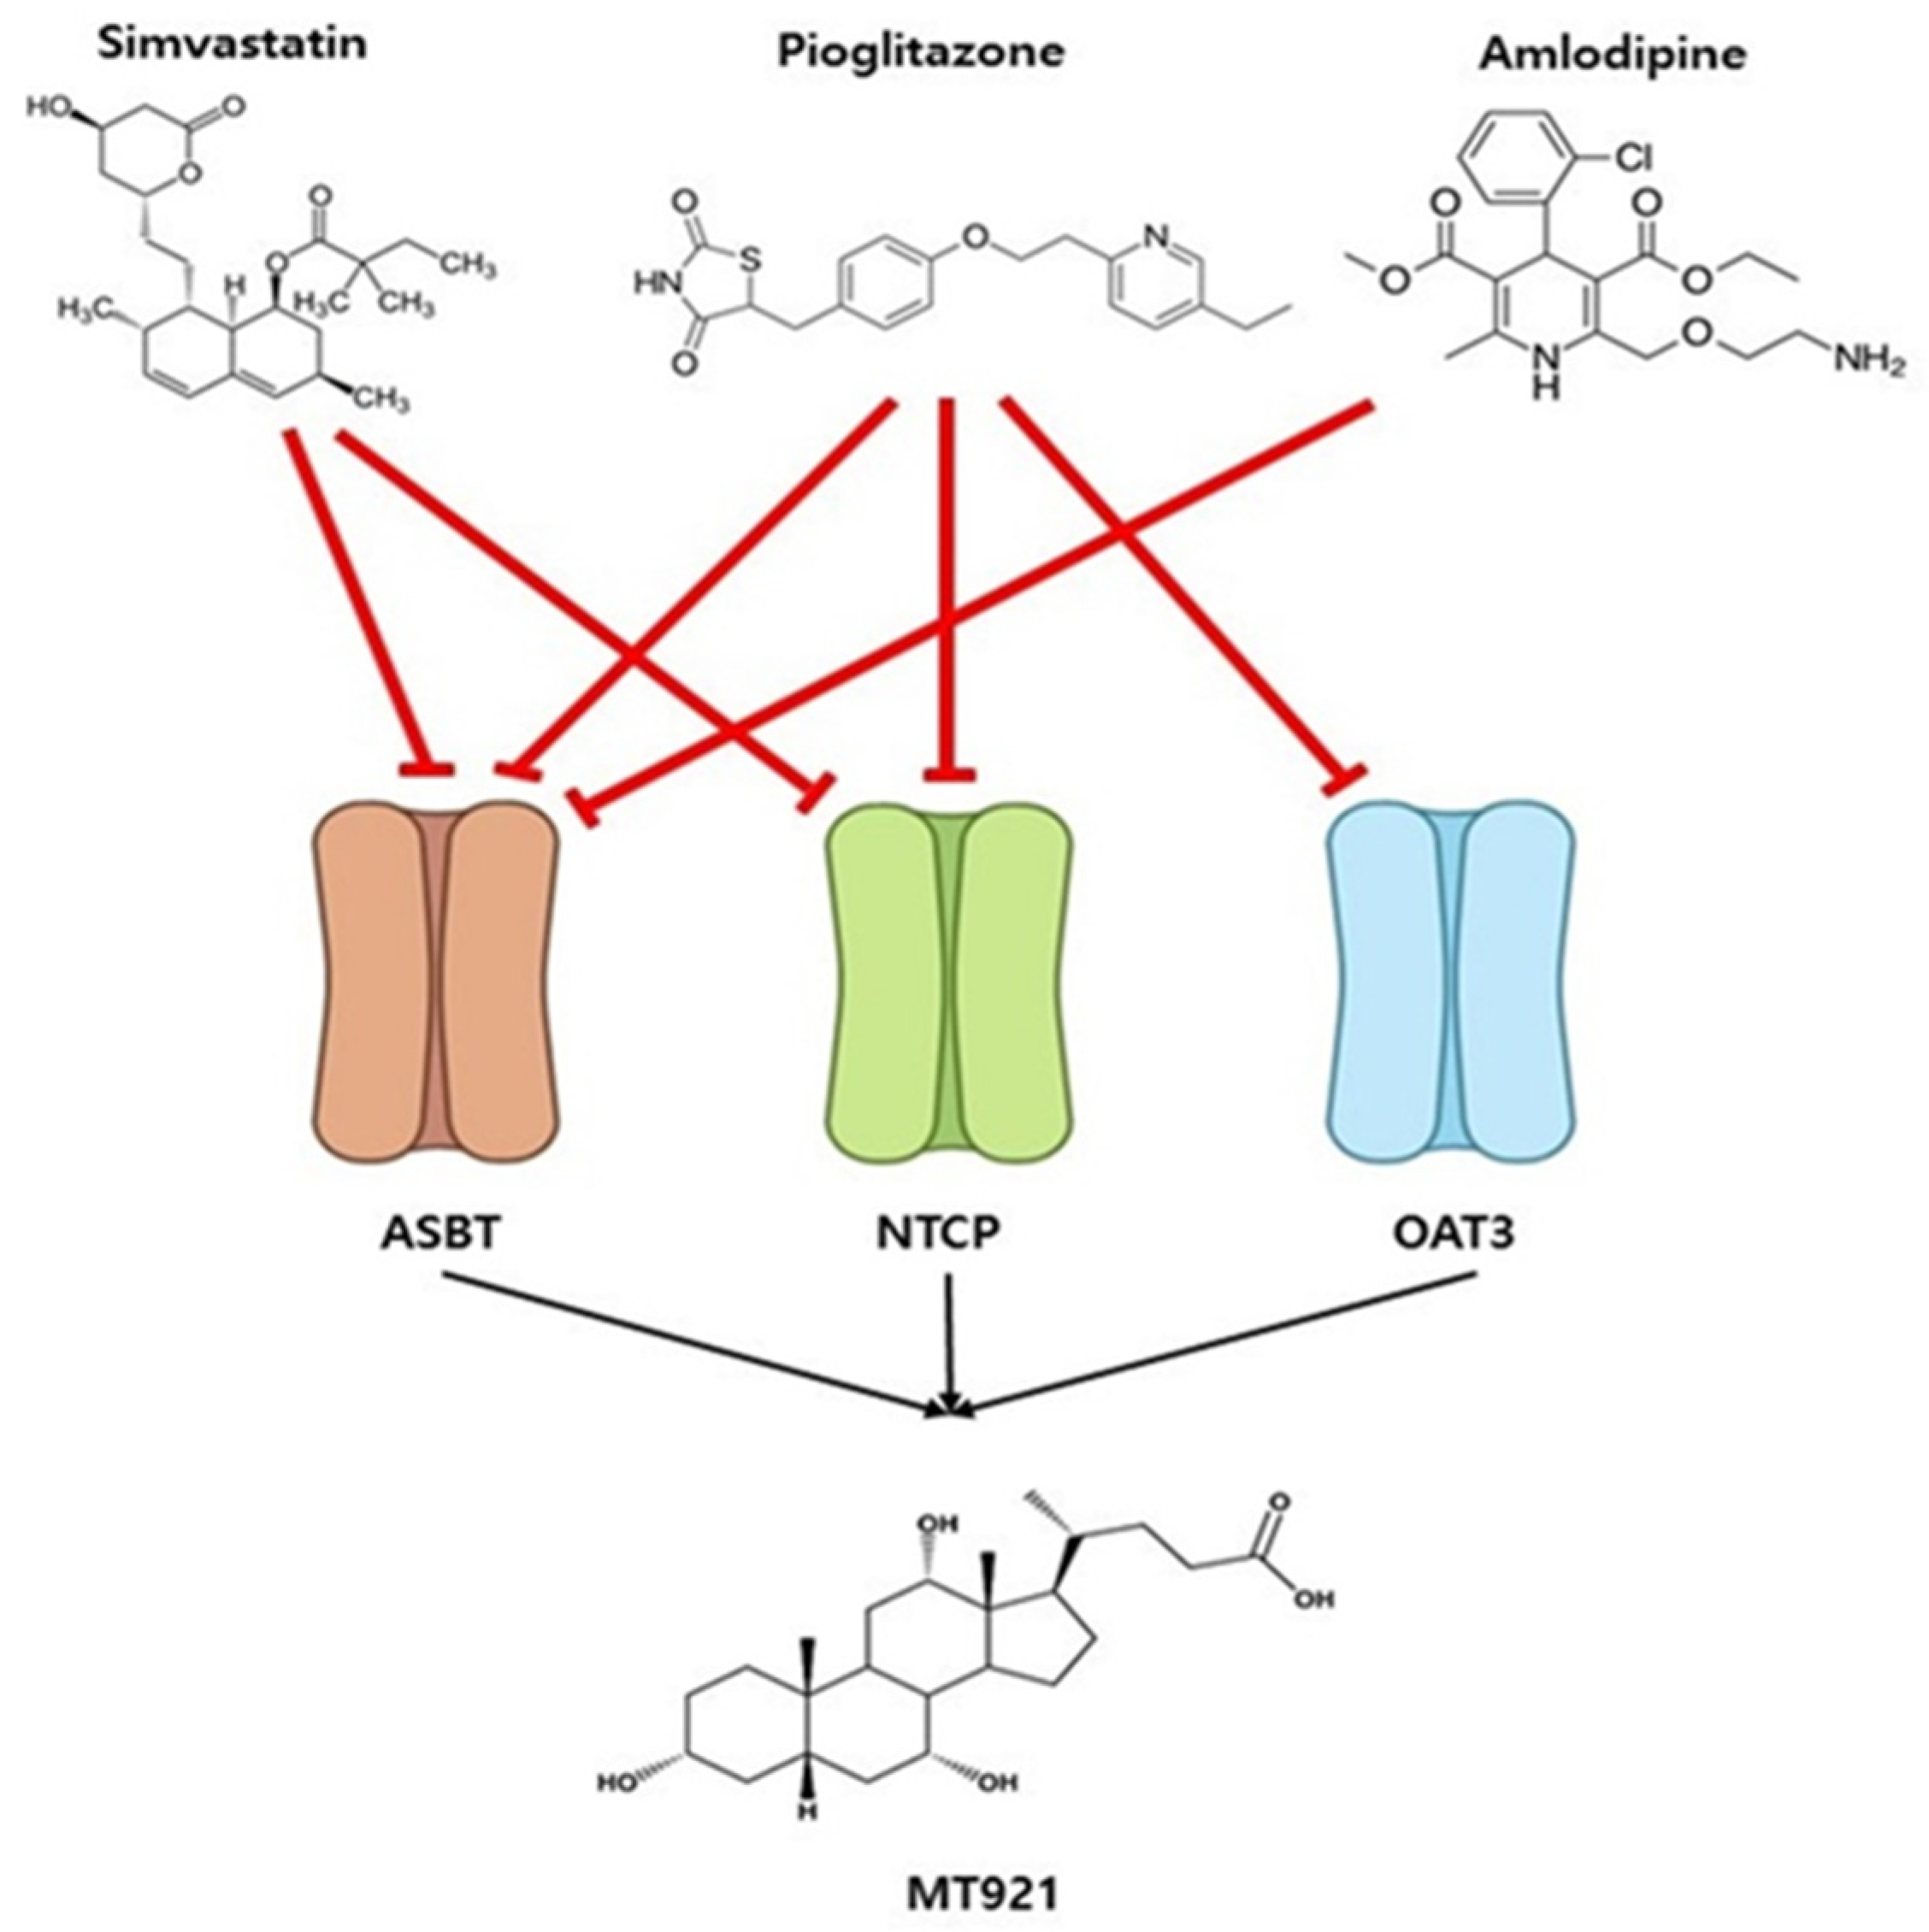
2.1.2. Inhibitory Effects of MT921 on The Transport Activities OATP1B1, OATP1B3, OAT3, NTCP, and ASBT

Inhibition of MT921 transport by OATP1B1, OATP1B3, OAT3, NTCP, and ASBT was evaluated using HEK 293-OATP1B1, -OATP1B3, -OAT3, -NTCP, and -ASBT stable cells. The uptake rate was determined by the uptake of probe substrates (0.022 µM [3H]estrone-3-sulfate for OATP1B1 and OAT3, 0.06 µM [3H]estradiol-17β-D-glucuronide for OATP1B3, 0.8 µM [3H]taurocholate for NTCP and ASBT) into transporter-expressing cells and mock cells in the absence and presence of MT921 or representative inhibitors (30 µM cyclosporine A for OATP1B1 and OATP1B3, 50 µM diclofenac for OAT3, 30 µM bromsulphthalein for NTCP, 100 µM deoxycholate for ASBT). The positive inhibitors strongly inhibited the transport of MT921 by OATP1B1, OATP1B3, OAT3, NTCP, and ASBT, and the in vitro test systems were capable of detecting inhibitors of respective transporters. Over the concentration range tested (0.5–100 µM), MT921 showed a concentration-dependent inhibition manner with IC50 values of 63.2 µM for OATP1B1, 38.3 µM for OATP1B3, 68.7 µM for OAT3, 53 µM for NTCP, and 39.1 µM for ASBT (Figure 2).

2.2. PBPK Modeling and Simulation

2.2.1. MT921 Model

In the final PBPK model, total hepatic clearance, ASBT, NTCP, OAT3, OATP1B3, Glomerular Filtration Rate (GFR), and enterohepatic circulation were utilized to describe the pharmacokinetic properties of MT921. Drug-dependent parameters are summarized in Table S8. Predicted plasma concentration of the simulated population was compared to plasma concentration-time profile of three doses of MT921 from a clinical trial (mentioned in the method section). Observed data of all doses were appropriately predicted in simulation. Semilogarithmic and linear plots of the simulated population for three dosages are shown in the Figures S4 and S5. A MT921 goodness-of-fit plot for the predicted plasma concentrations versus observed plasma concentrations of all studies was made. All observed data were included in 2-fold deviation (Figure S6). The mean relative deviation (MRD) value for all predicted plasma concentration-time profiles was 1.13 (1.08–1.24) and geometric mean fold error (GMFE) values of AUC and Cmax were 1.10 (1.01–1.17) and 1.09 (1.04–1.16) (Tables S9 and S10). All predicted AUC and Cmax values were within the tw-fold compared with the observed AUC and Cmax. Detailed values of each dose are listed in Tables S9 and S10. Sensitivity was analyzed with a simulation of 150 mg MT921. The MT921 model in the 150 mg was sensitive to the properties of the lipophilicity (−2.35), the fraction unbound (−0.71), permeability (−0.07), and total hepatic clearance (−0.05). The result of sensitivity analysis is illustrated in Figure S7.

2.2.2. Amlodipine Model

The final model of amlodipine (AMLO) contains information about hepatic clearance, GFR, and Ki values of ASBT. The drug-dependent parameters of AMLO are listed in Table S12. We compared population simulation to the observed plasma concentration-time profile from 19 clinical studies. All population simulations adequately predicted the results from the clinical studies. Semilogarithmic and linear plots of population simulation of 19 clinical studies are shown in the Figures S8 and S9, respectively. The goodness-of-fit of AMLO confirmed that most of the observed values were included within two-fold deviation lines (Figure S10). The MRD of AMLO was 1.29. MRD values for all predicted plasma concentration-time profiles were within the two-fold deviation. GMFE values of AUC and Cmax were 1.16 and 1.19, repectively, also within the two-fold deviation (Tables S13 and S14). Sensitivity analysis results of a simulation of 10 mg AMLO are illustrated in Figure S11. The final model of AMLO was sensitive to the unbound fraction (−0.82), total hepatic clearance (−0.64), lipophilicity (0.46), and permeability (−0.24).

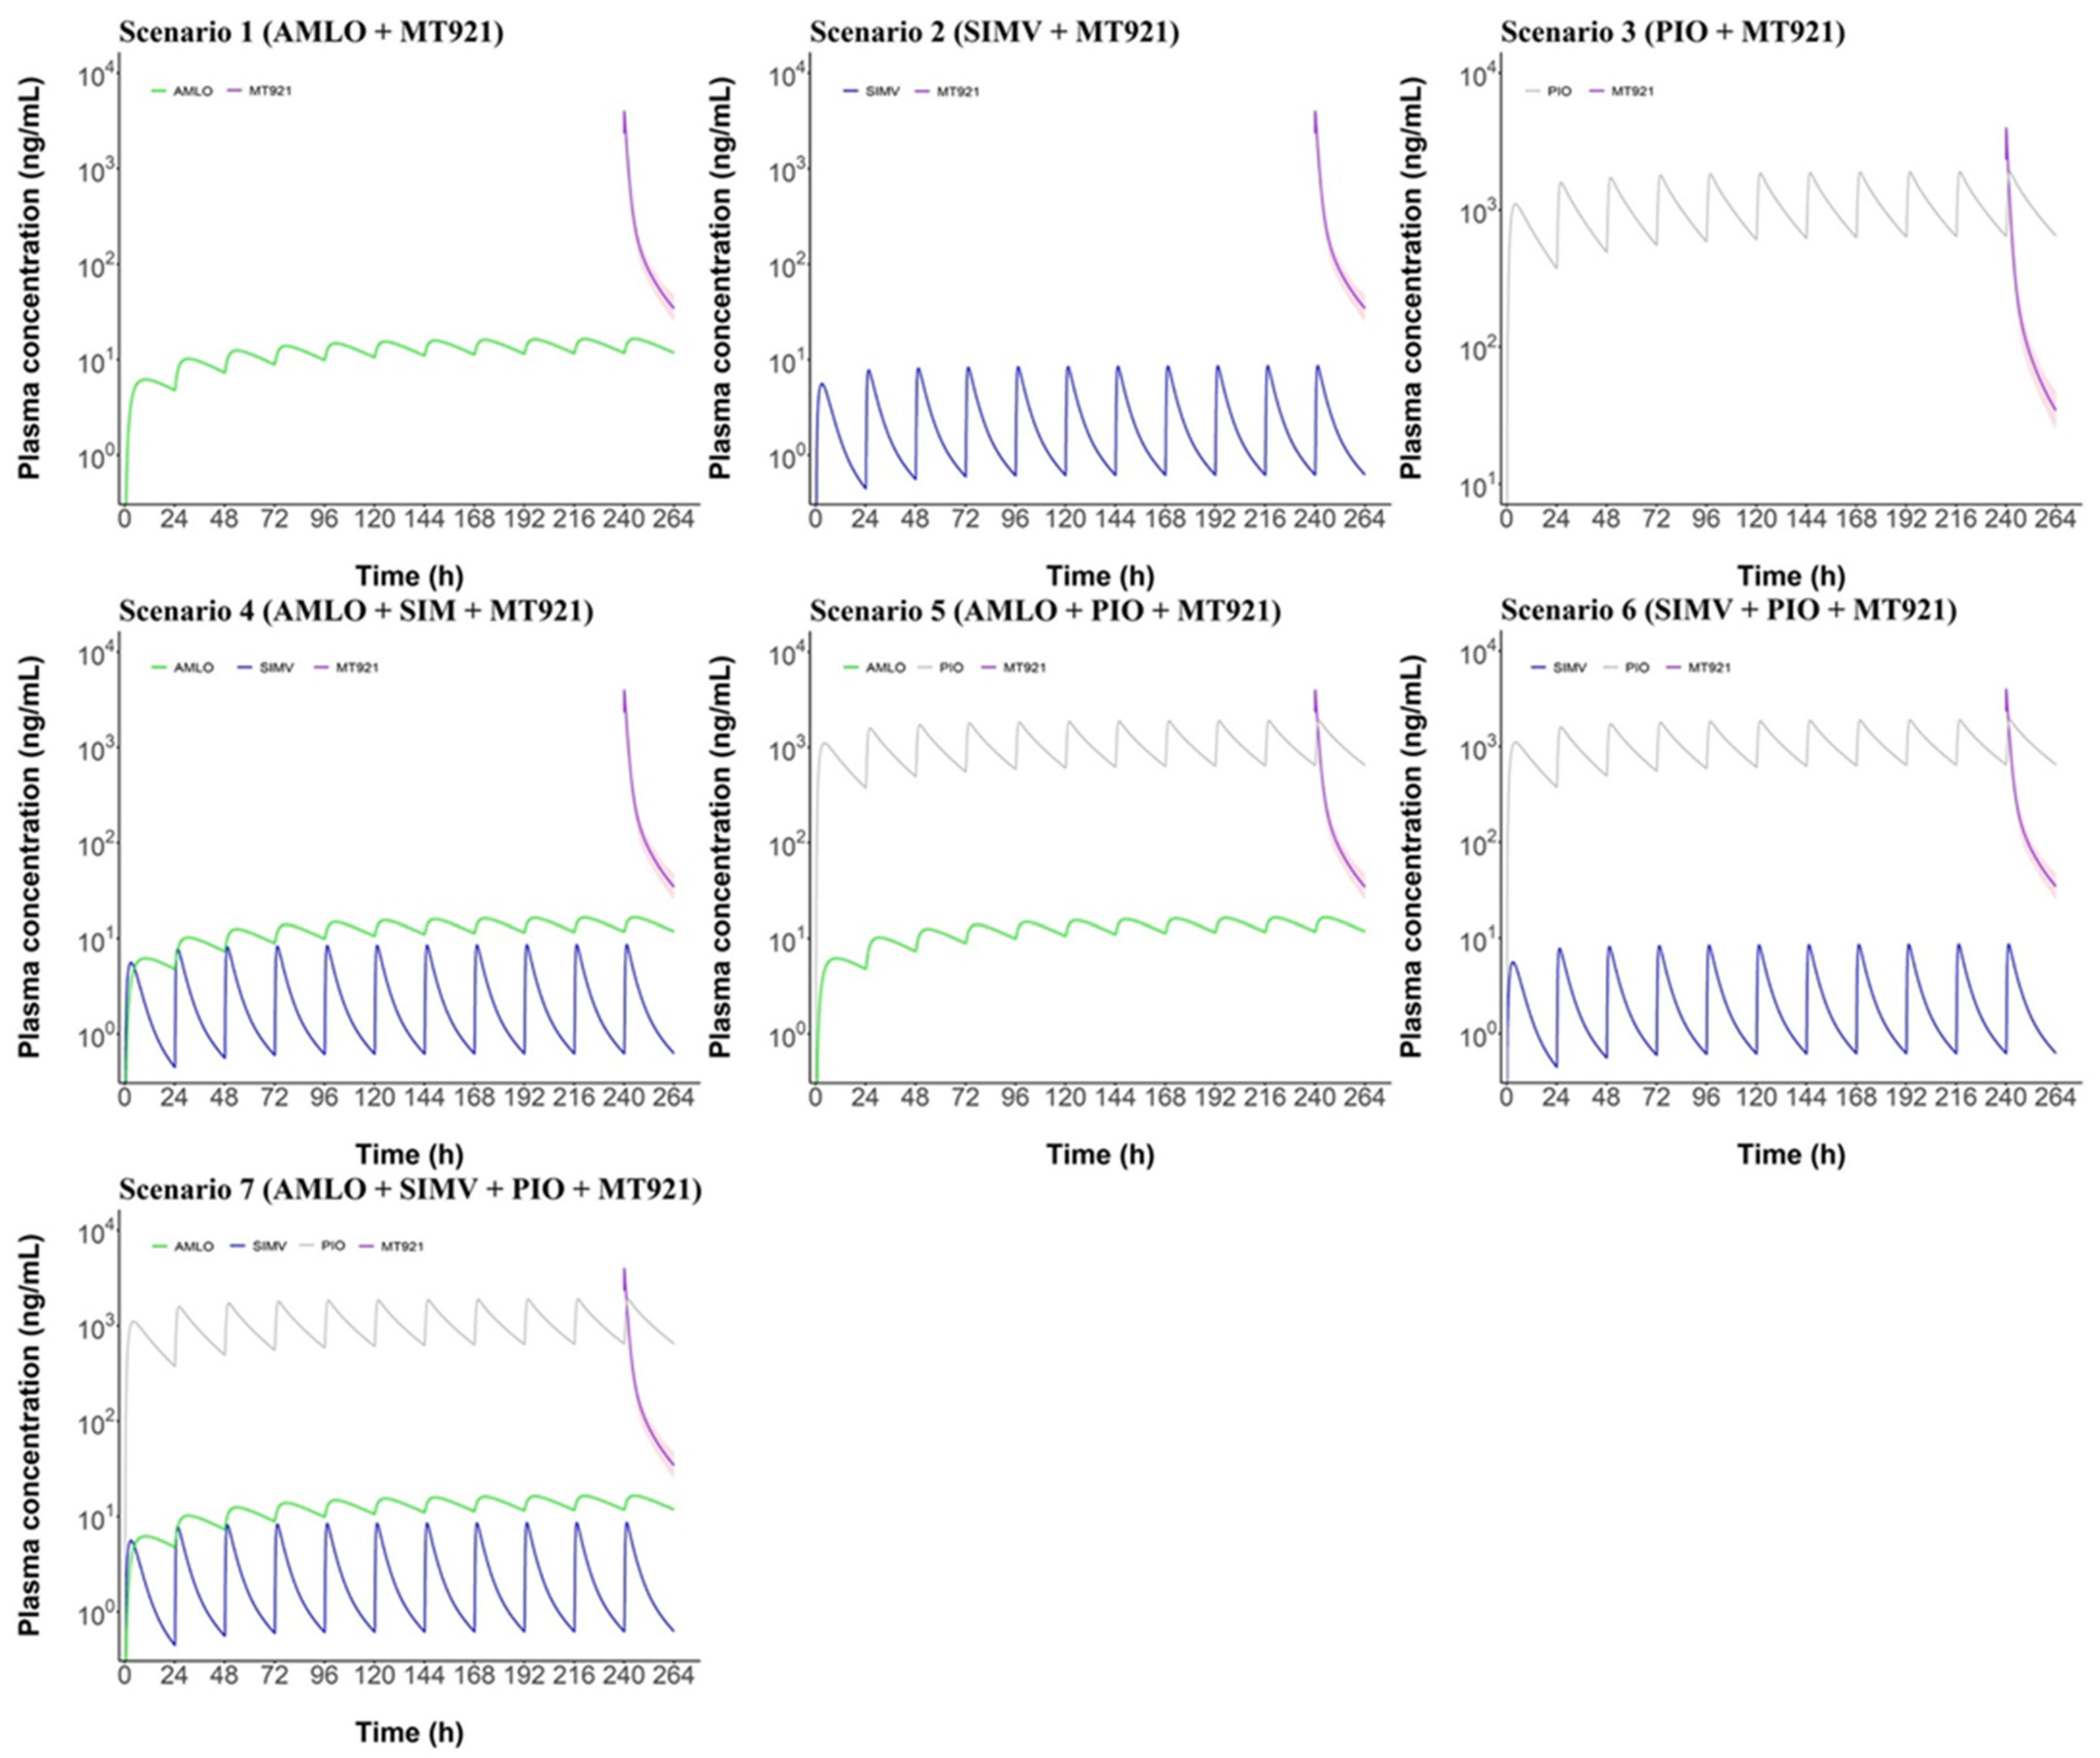
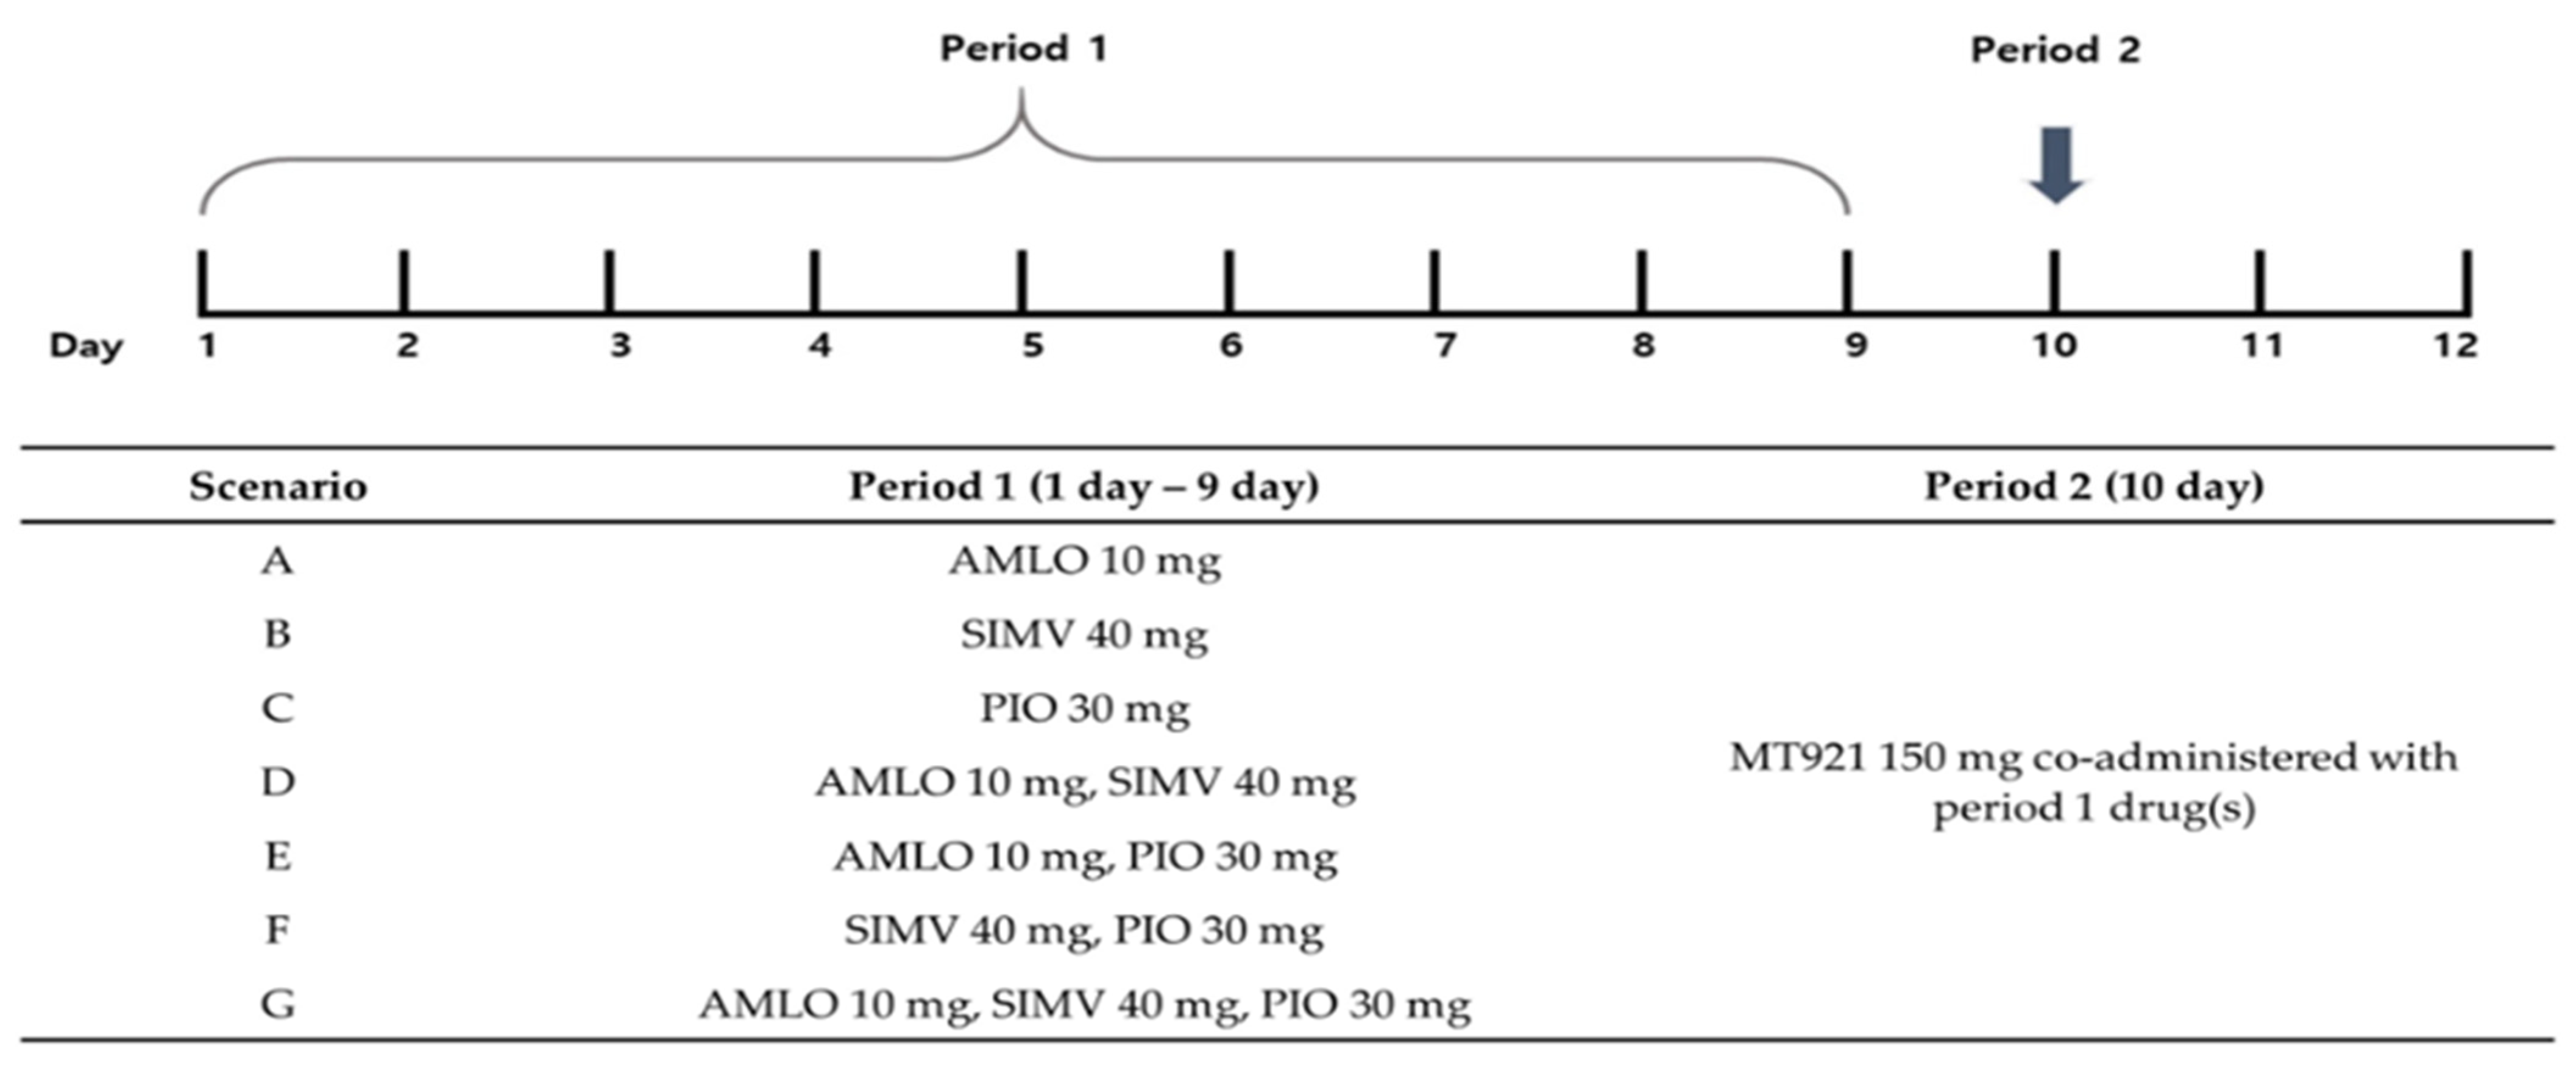
2.2.3. Prediction of Potential DDI between MT921 and Chronic Disease Drugs

With the developed PBPK model of MT921, AMLO, simvastatin (SIMV), and pioglitazone (PIO), potential DDI was tested when these chronic disease drugs were co-administered with MT921. The highest doses of single or multiple drugs were administered once a day for 9 days. At 10 days, 150 mg of MT921 was co-administered with chronic disease drugs. The plasma concentration of MT921 was predicted up to 24 h after administration. In all scenarios, the concentration of MT921 alone (purple line) was within the range of 5–95% concentration of MT921 with chronic disease drugs (pink shade), regardless of which drugs were taken (Figure 3). This means that MT921 concentration did not change with co-administration to AMLO, SIMV, and PIO. Linear and semilogarithmic graphs for comparing only plasma concentration of MT921 alone and MT921 co-administration are shown in Figures S12 and S13.

3. Discussion

MT921 is a fat-solubilizing drug, injected subcutaneously into the adipose tissue lying anterior to the platysma muscle to reduce submental fat. Since this drug is administered directly into topical sites, its bioavailability is expected to be very low. This was confirmed by a Phase I clinical trial of MT921, where a minimal amount of the drug was found in the systemic circulation of healthy volunteers administered MT921 subcutaneously. Nonetheless, we decided to investigate the in vitro pharmacokinetic DDI potential of MT921 when we had enough of the intended patients, many of whom were expected to be on multiple medications. Furthermore, we could simulate the change of MT921 AUC and Cmax when patients took drugs for their pre-existing metabolic conditions with MT921. Our in vitro study and in silico PBPK modeling predicted that there would be no potential DDI between MT921 and chronic disease drugs.
Our results revealed that MT921 seemed to have no significant inhibitory effect on cytochrome P450 (CYP) and the UDP-glucuronosyltransferase (UGT) enzyme or inductory effect on CYP isoforms and UGT isoforms (Tables S1, S2, S5 and S6) (IC50 > 100 μM on CYP isoforms and UGT isoforms; less than two-fold change in the mRNA expression level of CYPs and UGTs compared with vehicle control). We confirmed that MT921 had an extremely rare chance of DDI with the metabolic enzymes recommended by FDA. In addition, MT921 was determined to not be a substrate and did not show inhibitory effects on efflux (MDR1, BCRP, MRP2, and BSEP) or uptake (OATP1B1, OATP2B1, OAT1, OCT1, OCT2, MATE1, and MATE2K) transporters (Table 1, Tables S3 and S4, Figures S1–S3). However, OATP1B3, OAT3, NTCP, and ASBT seemed to be involved in MT921 transport (Figure 1 and Figure 2). Therefore, in our MT921 model, CYP and UGT-associated metabolic processes were not considered, but ASBT, NTCP, OAT3, and OATP1B3 were included in our final model to determine the potential drug interaction with MT921 (Figure 1 and Figure 2).
Our PBPK models of MT921 and AMLO describe and predict plasma concentration-time profiles over a dose range, as per the administration protocol from clinical trials published previously [15,16,17,18,19,20,21,22,23,24,25,26,27,28,29]. The performance of these models was demonstrated by the evaluation method. Physiology-based bile acid (PBBA) and the PBPK model of AMLO were developed [30,31,32] to investigate bile recirculation and AMLO DDI prediction with other drugs. Therefore, we first developed a model of CA administration to reduce submental fat and test DDI of CA with AMLO, SIM, and PIO.
In the PBPK model development, transporter Km values obtained from in vitro tests were used to describe pharmacokinetic characteristics, after adjusting the scale used in PK-sim. Ki values of the transporter reflected auto-inhibition and DDI and were calculated from the in vitro IC50 value. Total hepatic clearance, lipophilicity, unbound fraction, first-order absorption, permeability, and intestinal specific permeability were optimized. Total hepatic clearance of [24-14C] CA was included in metabolizing enzymes to cover unknown hepatic clearance [33]. Since the lipophilicity and unbound fraction data were sparse, they were optimized and found to be within the reported range of values proving its accuracy [34,35]. There was no data for absorption or distribution of MT921 after subcutaneou administration. Therefore, first-order absorption, permeability, and intestinal specific permeability were optimized to predict absorption and distribution of MT921. Three dosages of observed data were utilized in the evaluation step. Despite the lack of numbers of clinical trials in evaluation, MRDs and GMFEs of AUC and Cmax were within two-fold deviation. The GOF and population simulation results also verified correct predictions of observed data using the final PBPK model. Nonlinear PK of MT921 for different doses was also described well. After that, MT921 model sensitivity was analyzed to identify the parameter that could have an impact on the AUC of this model [36]. If the sensitivity value is −1.0, a 10% increase in the parameters leads to a 10% decrease of the PK parameter value. Similarly, if a sensitivity value is 0.5, a 10% increase in the parameters leads to a 5% increase in the PK parameter value. The results indicated that the AUC of MT921 is sensitive to lipophilicity and the unbound fraction, but not Kcat and Ki of the transporter. It is speculated that MT921 DDI would not be associated with those transporters.
To predict ADME properties of amlodipine, physicochemical properties, Weibull, total hepatic clearance, GFR, permeability, and intestine specific permeability were implemented. Amlodipine is majorly metabolized by CYP3A4 and CYP3A5 [37]. Although it could be more accurate to implement these metabolizing enzymes, total hepatic clearance was utilized as the dominant metabolic process in our model. As Weibull, permeability, and intestinal specific permeability could not be extracted from the published paper, these values were optimized in our model. Amlodipine model was evaluated using 19 clinical trials. Lastly, Ki value of ASBT was added to develop the amlodipine model to study DDI. The MRD of amlodipine was 1.29. GMFEs of AUC and Cmax were 1.16 and 1.19, respectively, and MRD and GMFEs were within two-fold. Sensitivity of the amlodipine model was analyzed to investigate parameters that affect drug exposure. As mentioned above, if the sensitivity value was bigger, the parameter greatly affected the PK parameter. The results show that the amlodipine model was sensitive to unbound fraction, total hepatic clearance, lipophilicity, and permeability. Other parameters decreased drug exposure, while lipophilicity increased drug exposure.
In the SIMV and PIO final model, the reproducibility of the model was first confirmed, and then these models were used. The Ki value for transporter was added to inhibit the transporter in DDI simulation [38,39,40,41].
In the simulation step, scenarios of DDI were set, as well as the period in which inhibition could occur. The highest doses of three chronic disease drugs were administered, along with the MT921. Ki values of MT921 were obtained from the in vitro test. AMLO, SIMV, and PIO Ki values were taken from literature. All of these drugs were assumed to competitively inhibit each other [42]. Before DDI simulation, drug interaction among chronic disease drugs was investigated. DDI between AMLO and SIMV was reported [43]. When SIMV was co-administered with AMLO, AUC and Cmax of SIMV increased 1.8- and 1.9-fold, respectively. DDI between AMLO and SIMV was reflected in our DDI simulation by adjusting the SIMV final model. In DDI prediction simulation, MT921 concentration with chronic disease drugs was not significantly different from those with MT921 administration alone. In other words, MT921 PK was not affected by transporter inhibition. Since the concentration of MT921 did not change, we checked whether inhibition functions would work well in DDI simulation. Considering the sensitivity value of the MT921 transporter, it is confirmed that the concentration of MT921 changed when the inhibition was changed by the dose or Ki value. Therefore, the inhibition of the transporter was well implemented in DDI simulation. These results matched with inhibitor concentration and its IC50. Cmax of AMLO and SIM in the clinic was 2000 times lower than their IC50. For PIO, Cmax of ASBT was 30 times lower and NTCP was two times lower than its IC50, though Cmax of OAT3 was two times higher than its IC50. Since MT921 is rarely distributed in the kidney, where OAT3 is located (data not shown), PIO would not inhibit MT921.
Due to the lack of observed data, the MT921 model development and DDI simulation had a limitation. Although the MT921 model showed good results in the model evaluation, results may not be highly reliable because the same data was used for model development and evaluation, due to the lack of clinical trials. Moreover, since DDI simulation had no real-world data, all potential DDI simulations were predicted models, not developed models. These limitations should be considered while interpreting these models.

4. Materials and Methods

4.1. Materials

The active ingredient of MT921, cholic acid (CA), was synthesized from Medytox Inc. (Suwon, Korea). Cyclosporine A, diclofenac, bromsulphthalein, deoxycholate, chenodeoxycholic acid, and Dulbecco’s Phosphate Buffered Saline (DPBS) were purchased from Sigma-Aldrich (St. Louis, MO, USA). [3H]estrone-3-sulfate (45 Ci/mmol), [3H]estradiol-17β-d-glucuronide (34.3 Ci/mmol), and [3H]taurocholate (5 Ci/mmol) were purchased from Perkin Elmer (Boston, MA, USA). Fetal bovine serum (FBS), non-essential amino acids, penicillin, and streptomycin were purchased from Gibco BRL, Life Technologies (Grand Island, NY, USA). Dulbecco’s Modified Eagle’s Medium (DMEM), poly-d-lysine coated 24-well plates, and poly-d-lysine coated 96-well plates were purchased from Corning-Gentest (Tewksbury, MA, USA). The acetonitrile used was analytical grade and purchased from Merck (Darmstadt, Germany).
The HEK 293-OATP1B1, -OATP1B3, -OAT3, -NTCP, and -ASBT stable cells and mock cells were purchased from Corning Life Science (Woburn, MA, USA).

4.2. In Vitro Effect on Transporters

4.2.1. Substrate Specificity of MT921 for OATP1B1, OATP1B3, OAT3, NTCP, and ASBT

The HEK 293-OATP1B1, -OATP1B3, -OAT3, -NTCP, and -ASBT stable cells and mock cells were maintained in DMEM supplemented with 10% FBS, 1% non-essential amino acids, and 100 U/mL of penicillin-streptomycin at 37 °C in a humidified atmosphere of 5% CO2 [44]. For the experiments, 0.8 × 10⁵ cells per well were seeded in poly-D-lysine coated 24-well plates, except for HEK293-ASBT cells, where 1 × 10⁵ cells per well were seeded in poly-D-lysine coated 24-well plates. After incubation for 48 h, the medium was removed and the cells were washed with DPBS and preincubated for 10 min in DPBS at 37 °C.
The uptake of MT921 (10 µM and 100 µM) or probe substrates (0.022 µM [3H]estrone-3-sulfate for OATP1B1 and OAT3, 0.06 µM [3H]estradiol-17β-d-glucuronide for OATP1B3, 0.8 µM [3H]taurocholate for NTCP and ASBT) was measured in the absence and presence of representative inhibitors (30 µM cyclosporine A for OATP1B1 and OATP1B3, 50 µM diclofenac for OAT3, 30 µM bromsulphthalein for NTCP, 100 µM deoxycholate for ASBT) [45,46,47,48,49]. After 10 min at 37 °C uptake, the cells were washed twice with ice-cold DPBS. Cells were disintegrated in 150 µL of 70% acetonitrile containing internal standard (IS; 200 nM of chenodeoxycholic acid). The cells were sonicated for 3 s and centrifuged at 13,000 rpm for 10 min. An aliquot (5 µL) from the supernatant (100 µL) was injected into LC-MS/MS system.
Concentration-dependent MT921 uptake by OATP1B3, OAT3, NTCP, and ASBT was examined in HEK 293-OATP1B3, -OAT3, -NTCP, -ASBT and mock cells for 10 min at 37 °C. The uptake rates were measured with increasing MT921 concentration (5–100 µM for OATP1B3, NTCP, and ASBT, 5–300 µM for OAT3). The sample preparation method is as stated above.

4.2.2. Inhibitory Effects of MT921 on the Transport Activities of OATP1B1, OATP1B3, OAT3, NTCP, and ASBT

HEK-293 cells with respective transporters were prepared, as shown in 4.2.1. To examine the inhibitory effects of MT921 on transport activities, the uptake of 0.022 µM [3H]estrone-3-sulfate for OATP1B1 and OAT3, 0.06 µM [3H]estradiol-17β-d-glucuronide for OATP1B3, and 0.8 µM [3H]taurocholate for NTCP and ASBT was measured in the presence of MT921 (0.5–100 µM) [45,46,47,48,49]. After 5 min at 37 °C incubation, the cells were washed twice with ice-cold DPBS. The cells were disintegrated in 0.1 N sodium hydroxide for 1 h. Radioactivity in the samples was measured using a liquid scintillation counter.

4.2.3. LC-MS/MS Analysis

MT921 was analyzed by modifying the protocol from a previously published paper, using an Agilent 6410 Triple Quadrupole LC-MS/MS system (Agilent, Wilmington, DE, USA) equipped with an Agilent 1200 series HPLC system [50]. MT921 was separated using an XBridge C18 column (2.1 mm × 100 mm, 3.5 µm; Waters, Milford, MA, USA). The mobile phases consisted of water and acetonitrile (40:60 υ/υ) with 0.1% formic acid at a flow rate of 0.2 mL/min. The retention times of MT921 and chenodeoxycholic acid (IS) were 2.1 min and 3.4 min, respectively. Quantitation was carried out using the multiple reaction monitoring (MRM) mode at m/z 407.5 → 407.5 (collision energy (CE) of 20 eV; negative ion mode) for MT921 and m/z 391.3 → 391.3 (CE of 25 eV; negative ion mode) for IS. The analytical data was processed by MassHunter software (version B.01.04).

4.2.4. Data Analysis

The uptake of MT921 into HEK 293-OATP1B1, -OATP1B3, -OAT3, -NTCP, and -ASBT stable cells was calculated as percentages relative to that in mock cells. Kinetic parameters of OATP1B3-, OAT3-, NTCP-, and ASBT-mediated MT921 uptake were fit to a modified Michaelis–Menten equation ((ν = (Vmax × [S])/(Km + [S]) + CLdiffusion × [S])) using Phoenix WinNonlin (version 2.1; Pharsight, Mountain view, CA, USA) [51]. Vmax represents the maximum velocity at saturating substrate concentration, [S] represents the substrate concentration, Km represents the substrate concentration at half Vmax, and CLdiffusion represents the passive diffusion clearance.
The degrees of inhibition of transport of OATP1B1, OATP1B3, OAT3, NTCP, and ASBT by MT921 were calculated as percentages of control in the absence and presence of the inhibitors. IC50 values were fit to an inhibitory effect equation ((ν = Emax × (1 − [I]/(IC50 + [I])) using Phoenix WinNonlin (version 2.1; Pharsight, Mountain view, CA, USA) [52]. Emax represents the maximum effect, [I] represents the inhibitor concentration, and IC50 represents the drug concentration at half inhibition.

4.3. PBPK Modeling and Simulation

4.3.1. Software

The PBPK model of MT921 and AMLO were developed using PK-sim® (open systems pharmacology site 9.1 www.open-systems-pharmacology.org (accessed on 21 January 2021)). Model parameter optimization (Monte–Carlo algorithm) and sensitivity analysis were performed using PK-sim®. Plasma concentration-time profiles from the literature were digitized with WebPlotDigitizer Version 4.4 [53]. Calculation of quantitative model evaluation, PK parameter analysis, and graph plotting were accomplished with R 4.0.2 (the R foundation for statistical computing) and R studio 1.4.1103 (R studio, Inc, Boston, MA, USA).

4.3.2. PBPK Model Development

The PBPK model was developed using in vitro, in vivo, and clinical study data. Information of physicochemical properties, absorption, distribution, metabolism, and excretion (ADME) were used to reproduce compound characteristics. Clinical studies data (observed data) were used to create a data set, consisting of a training set and test set, for model development and evaluation. Demographic data of healthy individuals was used. If a clinical study did not provide demographic information, default values from the PK sim population database were used. Metabolic enzymes and transporter proteins were implemented using the PK-sim gene expression database [54]. Model parameters were then optimized by PK sim calculation methods for fitting predicted simulation to observed concentration of clinical study.

4.3.3. MT921 Model Development

MT921 in vitro data about the transporter and a clinical study containing demographic information (age, height, and weight) were provided by Medytox Inc. The rest of the in vitro data about physicochemical properties and ADME information of MT921 were retrieved from published literature. To develop a MT921 model, physicochemical properties, ASBT, NTCP, OAT3, OATP1B3, total hepatic clearance, GFR, and EHC recirculation was implemented. We found that MT921 is a substrate of ASBT, NTCP, OAT3, and OATP1B3, and MT921 can inhibit ABST, NTCP, OAT3, and OATP1B3. Experimental Km and Vmax values of ASBT, NTCP, OAT3, and OATP1B3 were utilized. The Ki value was calculated from the IC50 value using the Cheng–Prusoff equation
K i = IC 50 1 + [ S ] K m
where Ki is the inhibition constant, IC50 is half of the maximal inhibitory concentration of MT921, [S] is the concentration of substrate, and Km is the substrate concentration required for half of the maximum rate of transport.
These values are shown in Figure 1 and Figure 2. Kcat of MT921 was calculated by the PK-sim-embedded Michaelis-Menten calculation method. To explain unknown clearance, total hepatic clearance was used. Total hepatic clearance was obtained from [24-14C] CA clearance [33]. GFR and EHC recirculation values were assumed to be 1.
One clinical study was used as a training set; MT921 of 60 mg, 120 mg, and 150 mg were administered subcutaneously. If there was no information on sex in the clinical study, the population was assumed to be 100% male. A list of clinical studies is shown in Table S7. Partition coefficients and cellular permeability were taken from those calculated by Schmitt [55] and the PK-sim standard calculation method. Model parameters that could not obtain exact values from literature were optimized to observe the data of the training set.

4.3.4. Amlodipine Model Development

To develop the AMLO model, data on physicochemical properties, information about ADME, and clinical studies of AMLO were extracted from published literature. Total hepatic clearance and GFR were implemented to describe metabolism and excretion. Among the 19 clinical studies with two repeated doses and 17 single doses, 7 clinical studies are used as the training set and 12 as the test set. All AMLO was administered orally, 2.5–10 mg. Asian [56] demographic information was used for Korean and Chinese subjects whose demographic data was not provided. European [57] and Japanese (2015) demographic information was used for Caucasian and Japanese. All 19 clinical studies are shown in Table S11. Partition coefficients and cellular permeability was calculated using the Rogers and Rowland method [58,59] and PK-sim standard method. Model parameters whose exact values were not obtained from literature were optimized to fit the predicted simulation to observed data.

4.3.5. PBPK Model Evaluation

For model evaluation, several methods were used. As a visual comparison of the model performance, population simulations and goodness-of-fit were conducted. In total, 100 individuals were used in population simulations. If no demographic information was available, 20–50 years of age and male gender were assumed. The population predicted plasma concentration-time profile was compared to that observed in clinical data. Comparison of predicted versus observed plasma concentration of all studies was plotted in the goodness-of-fit plot. As a quantitative measure of performance of the model, the MRD of all PK parameters and the GMFE of all predicted PK parameters were calculated. If MRD and GMFE values were less than 2, it was considered to be adequate model performance.
The equation of MRD and GMFE are:
MRD = 10 x ,   x = i = 1 n ( log 10 C predicted ,   i log 10 C observed ,   i ) 2 n
where Cpredicted,i is predicted plasma concentration, Cobserved,i is observed data from literature, and n is the number of observed values.
GMFE = 10 x , x = i = 1 m | log 10 PK   parameter predicted , i PK   parameter observed ,   i | m
where PK parameterpredicted,i is predicted AUC and Cmax, PK parameterobserved,i is observed AUC and Cmax from literature, and m is the number of studies.

4.3.6. Sensitivity Analysis

The sensitivity analysis of the final PBPK model was performed to determine how other parameters affect PK parameters. All parameters that could influence PK were included. Sensitivity analysis was performed for the simulation using the highest dose of the drug (MT921 150 mg, AMLO 10 mg) and conducted with the Sensitivity Analysis tool in PK-sim. The variation range and maximum number of steps were set to 10 and 9, respectively. The sensitivity of each parameter was calculated as the ratio of the relative change in the AUC to the relative change in the parameter.
The equation is below:
S = Δ AUC Δ P × P AUC
where S is the sensitivity of the area under the curve; AUC is the area under the curve; ΔAUC is the change in the area under the curve; ΔP is the change in the model parameter value; P is the original parameter value in final model.

4.3.7. Prediction of Potential DDI between MT921 and the Inhibitors of Uptake Transporters

MT921 can be co-administered with SIMV, AMLO, and PIO. These drugs can affect MT921 transport. SIMV inhibits ASBT and NTCP [38,39], and AMLO inhibits ASBT [60]. PIO inhibits ASBT, NTCP, and OAT3 [38,40,41] (Figure 4).
To predict the potential DDI of MT921, SIMV and PIO models already developed by Hanke, along with MT921 and AMLO PBPK models, were used [61,62]. Ki values of ASBT, NTCP, OAT3, and OATP1B3 obtained from in vitro tests and literature were added to developed PBPK models. Inhibition of ASBT (Ki = 54.60 µM) [38], NTCP (Ki = 4.04 µM) [40], and OAT3 (Ki =1.02 µM) [41] was implemented by PIO. Inhibition of ASBT (Ki =10.40 µM) [38] and NTCP (Ki = 47.90 µM) [39] was implemented by SIMV. Inhibition of ASBT (Ki = 42.10 µM) [61] was implemented by AMLO. In the simulation for investigating potential DDI, the highest dose of AMLO, PIO, and SIMV was administered once a day for 10 days based on each scenario. At 10 days, MT921 150 mg was administered subcutaneously. Potential DDI was predicted with single or multiple drugs. The scenario simulation is presented in Figure 5.
To estimate changes in PK parameter of MT921, DDI PK parameter ratio was calculated using PK parameters of MT921 administered alone and co-administered.
The equation of PK parameter ratio is below:
DDI   PK   parameter   ratio =   PK   parameter   MT 921   during   co administration PK   parameter MT 921   alone  
where PK parameter is AUC and Cmax.

5. Conclusions

To verify the DDI of MT921s with other drugs, we conducted various in vitro assays according to the DDI guidelines by the FDA, as well as in silico prediction using PBPK models. In summary, none of the results of in vitro assays indicated a significant DDI risk for metabolism or transport, considering the exposure from phase 1 clinical trials of MT921. Furthermore, we found no DDI possibility of MT921 with potential co-administrated drugs related to metabolic disease syndrome, using the PBPK modeling approach in various scenarios. Therefore, MT921 could be administered without a DDI risk based on in vitro study and related in silico simulation. Further clinical studies are needed to validate this finding.

Supplementary Materials

The following are available online at https://0-www-mdpi-com.brum.beds.ac.uk/article/10.3390/ph14070654/s1, Figure S1: Inhibitory effects of MT921 (1, 10 and 100 μM) on bidirectional transport activity using probe substrates ([3H]digoxin for MDR1, [3H]estrone-3-sulfate for BCRP) in MDCKII (A) -MDR1. (B) -BCRP, Figure S2: Inhibitory effects of MT921 (0.5–100 μM) on intracellular accumulation of probe substrates (calcein AM for MRP2, [3H]taurocholate for BSEP) in MDCKII (A) -MRP2. (B) -BSEP, Figure S3: Concentration-dependent inhibition effect of MT921 (0.5–100 µM) on (A) 0.022 µM [3H]estrone-3-sulfate in HEK 293-OATP2B1, (B) 0.930 µM [3H]para-aminohippuric acid in HEK 293-OAT1, (C) 4 µM [14C]Metformin in HEK 293-OCT1, (D) 4 µM [14C]Metformin in HEK 293- OCT2, (E) 4 µM [14C]Metformin in HEK 293-MATE1, and (F) 4 µM [14C]Metformin in HEK 293-MATE2K, Figure S4: MT921 population plasma concentration-time profiles (semilogarithmic), Figure S5: MT921 population plasma concentration-time profiles (linear), Figure S6: Goodness-of-fit plot of MT921, Figure S7: MT921 model sensitivity analysis, Figure S8: Amlodipine population plasma concentration-time profiles (semilogarithmic), Figure S9: Amlodipine population plasma concentration-time profiles (linear), Figure S10: Goodness-of-fit plot of amlodipine, Figure S11: Amlodipine model sensitivity analysis, Figure S12: Linear graph comparing plasma concentration of MT921 administered alone and co-administered, Figure S13: Semilogarithmic graph comparing plasma concentration of MT921 administered alone and co-administered, Table S1: Summary of inhibitory potential of MT921 on nine CYP isoform catalytic activities in pooled human liver microsomal incubation system, Table S2: Summary of the inhibitory potential of MT921 on six UGT isoform catalytic activities in the pooled human liver microsomal incubation system, Table S3: Apical to Basal (A to B) and Basal to Apical (B to A) directional apparent permeability of MT921 (10 µM and 100 µM) in MDCKII-MDR1, -BCRP, -MRP2, and -BSEP, Table S4: The uptake transport rate of MT921 (10 µM and 100 µM) in HEK 293-OATP2B1, -OAT1, -OCT1, -OCT2, -MATE1, -MATE2K, and mock cells, Table S5: Cell viability of MT921 (0–100 µM) in cryopreserved human hepatocytes, Table S6: Effects of MT921 (1, 10, and 100 μM) on CYPs, UGTs, and transporter mRNA expression in cryopreserved human hepatocytes, Table S7: MT921 clinical studies, Table S8: Drug-dependent parameters of the MT921 PBPK model, Table S9: MRD values of predicted MT921 plasma concentration, Table S10: Observed and predicted MT921 AUC and Cmax values with mean GMFE values, Table S11: Summary of clinical studies used for the amlodipine model, Table S12: Drug-dependent parameters of the amlodipine PBPK model, Table S13: MRD values of predicted amlodipine plasma concentration, Table S14: Observed and predicted amlodipine AUC and Cmax values with mean GMFE values.

Author Contributions

Conceptualization and methodology, H.-j.R., H.-k.M., G.-h.Y., H.-y.Y., J.-w.C. and W.-h.K.; investigation, H.-j.R., H.-k.M., H.-y.Y., J.-w.C. and W.-h.K.; data curation, H.-j.R., H.-k.M., H.-y.Y., J.-w.C. and W.-h.K.; modeling and simulation, H.-j.R., H.-k.M., S.-y.Y., H.-y.Y., J.-w.C. and W.-h.K.; statistical and graphical analysis, H.-j.R., H.-k.M., S.-y.Y., H.-y.Y., J.-w.C. and W.-h.K.; qualifying modeling, H.-j.R., H.-k.M., S.-y.Y., H.-y.Y., J.-w.C. and W.-h.K.; writing—original draft preparation, H.-j.R., H.-k.M., H.-y.Y., J.-w.C. and W.-h.K.; writing—review and editing, H.-j.R., H.-k.M., J.L., G.-h.Y., S.-y.Y., H.-y.Y., J.-w.C. and W.-h.K.; supervision, H.-y.Y., J.-w.C. and W.-h.K.; project administration, H.-y.Y., J.-w.C. and W.-h.K.; funding acquisition, H.-y.Y. and J.-w.C. All authors have read and agreed to the published version of the manuscript.

Funding

This research was funded by Chungnam National University (CNU).

Institutional Review Board Statement

Not applicable.

Informed Consent Statement

Not applicable.

Data Availability Statement

Data is contained within the article and supplementary material.

Conflicts of Interest

The authors declare no conflict of interest. H.-j.R., J.L., G.-h.Y. and W.-h.K. are the employees of Medytox Inc. The company had no role in the design of the study; in the collection, analyses, or interpretation of data; in the writing of the manuscript, and in the decision to publish the results.

References

  1. Chiang, J.Y.L. Bile acids: Regulation of synthesis. J. Lipid Res. 2009, 50, 1955–1966. [Google Scholar] [CrossRef] [Green Version]
  2. Pavlović, N.; Goločorbin-Kon, S.; Ðanić, M.; Stanimirov, B.; Al-Salami, H.; Stankov, K.; Mikov, M. Bile Acids and Their Derivatives as Potenial Modifiers of Drug Release and Pharmacokinetic Profile. Front. Pharmacol. 2018, 9, 1–23. [Google Scholar] [CrossRef]
  3. Chiang, J.Y.L.; Ferrell, J.M. Up to date on cholesterol 7α-hydroxylase (CYP7A1) in bile acid synthesis. Liver Res. 2020, 4, 47–63. [Google Scholar] [CrossRef]
  4. Chiang, J.Y.L.; Li, T. Bile Acid Signaling in metabolic Disease and Drug Therapy. Pharmacol. Rev. 2014, 66, 948–983. [Google Scholar] [CrossRef] [Green Version]
  5. Dawson, P.A.; Lan, T.; Rao, A. Bile acid transporters. J. Lipid Res. 2009, 50, 2340–2357. [Google Scholar] [CrossRef] [PubMed] [Green Version]
  6. Alrefai, W.A.; Gill, R.K. Bile Acid Transporters: Structure, Function, Regulation and Pathophysiological Implications. Pharm. Res. 2007, 24, 1803–1823. [Google Scholar] [CrossRef]
  7. Thakkar, N.; Slizgi, J.R.; Brouwer, K.L.R. Effect of Liver Disease on Hepatic Transporter Expression and Function. J. Pharm. Sci. 2017, 106, 2282–2294. [Google Scholar] [CrossRef] [PubMed] [Green Version]
  8. Chiang, J.Y.L. Bile Acid Metabolism and Signaling. Compr. Physiol. 2013, 3, 1191–1212. [Google Scholar] [CrossRef] [Green Version]
  9. Bang, J.S.; Lee, Y.J.; Jeong, J.H.; Sohn, U.D. Roles of Bile Acid as an Active Biological Substance. Kor. J. Clin. Pharm. 2011, 21, 49–56. [Google Scholar]
  10. Humphrey, S.; Beleznay, K.; Beleznay, J.D.A. Sodium Deoxycholate for Submental Contouring. Skin Ther. Lett. 2016, 21, 1–4. [Google Scholar]
  11. Fang, Z.-Z.; He, R.-R.; Cao, Y.-F.; Tanaka, N.; Jiang, C.; Krausz, K.W.; Qi, Y.; Dong, P.-P.; Ai, C.-Z.; Sun, X.-Y.; et al. A model of in vitro UDP-glucuronosyltransferase inhibition by bile acids predicts possible metabolic disorders. J. Lipid Res. 2013, 54, 3334–3344. [Google Scholar] [CrossRef] [PubMed] [Green Version]
  12. Ämlöv, J.; Sundström, J.; Schmitz, G.; Ingelsson, E.; Lind, L. Impact of BMI and the Metabolic Syndrome on the Risk of Diabetes in Middle-Aged Men. Diabetes Care 2011, 34, 61–65. [Google Scholar] [CrossRef] [Green Version]
  13. Nguyen, N.T.; Magno, C.P.; Lane, K.T.; Hinojosa, M.W.; Lane, J.S. Association of Hypertension, Diabetes, Dyslipidemia, and Metabolic Syndrome with Obesity: Findings from the National Health and Nutrition Examination Survey, 1999 to 2004. Kor. J. Clin. Pharm. 2008, 207, 928–934. [Google Scholar] [CrossRef] [PubMed]
  14. Center for Drug Evaluation and Research (CDER). Guidance for Industry: In Vitro Drug Interaction Studies-Cytochrome P450 Enzyme- and Transporter-Mediated Drug Interactions; Food and Drug Administration: Silver Spring, MD, USA, 2020; Available online: http://www.fda.gov/media/134582/download (accessed on 10 January 2021).
  15. Yi, S.; Kim, T.-E.; Yoon, S.H.; Cho, J.-Y.; Shin, S.-G.; Jang, I.-J.; Yu, K.-S. Pharmacokinetic Interaction of Fimasartan, a New Angiotensin II Receptor Antagonist, with Amlodipine in Healthy Volunteers. J. Cardiovasc. Pharmacol. 2011, 57, 682–689. [Google Scholar] [CrossRef] [PubMed]
  16. Williams, D.M.; Cubeddu, L.X. Amlodipine Pharmacokinetics in Healthy Volunteers. J. Clin. Pharmacol. 1988, 28, 990–994. [Google Scholar] [CrossRef] [PubMed]
  17. Liu, Y.; Jia, J.; Liu, G.; Li, S.; Lu, C.; Liu, Y.; Yu, C. Pharmacokinetics and Bioequivalence Evaluation of Two Formulations of 10-Mg Amlodipine Besylate: An Open-Label, Single-Dose, Randomized, Two-Way Crossover Study in Healthy Chinese Male Volunteers. Clin. Ther. 2009, 31, 777–783. [Google Scholar] [CrossRef]
  18. Faulkner, J.K.; McGibney, D.; Chasseaud, L.F.; Perry, J.L.; Taylor, I.W. The Pharmacokinetics of Amlodipine in Healthy Volunteers after Single Intravenous and Oral Doses and after 14 Repeated Oral Doses given Once Daily. Br. J. Clin. Pharmacol. 1986, 22, 21–25. [Google Scholar] [CrossRef] [Green Version]
  19. Jeon, J.Y.; Kim, J.R.; Chung, J.Y.; Cho, J.-Y.; Yu, K.-S.; Jang, I.-J.; Shin, S.G. Pharmacokinetic and Pharmacodynamic Comparative Study of Amlodipine Adipate and Amlodipine Besylate. J. Korean Soc. Clin. Pharmacol. Ther. 2006, 14, 106–115. [Google Scholar] [CrossRef] [Green Version]
  20. Kim, J.-R.; Kim, S.; Huh, W.; Ko, J.-W. No Pharmacokinetic Interactions between Candesartan and Amlodipine Following Multiple Oral Administrations in Healthy Subjects. Drug Des. Devel. Ther. 2018, 12, 2475–2483. [Google Scholar] [CrossRef] [Green Version]
  21. Abad-Santos, F.; Novalbos, J.; Gálvez-Múgica, M.-A.; Gallego-Sandín, S.; Almeida, S.; Vallée, F.; García, A.G. Assessment of Sex Differences in Pharmacokinetics and Pharmacodynamics of Amlodipine in a Bioequivalence Study. Pharmacol. Res. 2005, 51, 445–452. [Google Scholar] [CrossRef]
  22. Choi, S.; Jeon, S.; Yim, D.-S.; Han, S. Contribution of Trough Concentration Data in the Evaluation of Multiple-Dose Pharmacokinetics for Drugs with Delayed Distributional Equilibrium and Long Half-Life. Drug Des. Devel Ther. 2020, 14, 811–821. [Google Scholar] [CrossRef]
  23. Ma, Y.; Qin, F.; Sun, X.; Lu, X.; Li, F. Determination and Pharmacokinetic Study of Amlodipine in Human Plasma by Ultra Performance Liquid Chromatography-Electrospray Ionization Mass Spectrometry. J. Pharm. Biomed Anal. 2007, 43, 1540–1545. [Google Scholar] [CrossRef] [PubMed]
  24. Josefsson, M.; Zackrisson, A.L.; Ahlner, J. Effect of Grapefruit Juice on the Pharmacokinetics of Amlodipine in Healthy Volunteers. Eur. J. Clin. Pharmacol. 1996, 51, 189–193. [Google Scholar] [CrossRef] [PubMed]
  25. Han, J.M.; Yee, J.; Chung, J.E.; Lee, K.E.; Park, K.; Gwak, H.S. Effects of Cytochrome P450 Oxidoreductase Genotypes on the Pharmacokinetics of Amlodipine in Healthy Korean Subjects. Mol. Genet Genomic. Med. 2020, 8, e1201. [Google Scholar] [CrossRef] [PubMed]
  26. Wang, T.; Wang, Y.; Lin, S.; Fang, L.; Lou, S.; Zhao, D.; Zhu, J.; Yang, Q.; Wang, Y. Evaluation of Pharmacokinetics and Safety with Bioequivalence of Amlodipine in Healthy Chinese Volunteers: Bioequivalence Study Findings. J. Clin. Lab. Anal. 2020, 34, e23228. [Google Scholar] [CrossRef] [PubMed]
  27. Kirigaya, Y.; Shiramoto, M.; Ishizuka, T.; Uchimaru, H.; Irie, S.; Kato, M.; Shimizu, T.; Nakatsu, T.; Nishikawa, Y.; Ishizuka, H. Pharmacokinetic Interactions of Esaxerenone with Amlodipine and Digoxin in Healthy Japanese Subjects. BMC Pharmacol. Toxicol. 2020, 21, 55. [Google Scholar] [CrossRef] [PubMed]
  28. Sailer, R.; Arnold, P.; Erenmemişoğlu, A.; Martin, W.; Tamur, U.; Kanzik, I.; Hincal, A.A. Pharmacokinetics and Bioequivalence Study of a Generic Amlodipine Tablet Formulation in Healthy Male Volunteers. Arzneimittelforschung 2007, 57, 462–466. [Google Scholar] [CrossRef] [PubMed]
  29. Park, J.-Y.; Kim, K.-A.; Lee, G.-S.; Park, P.-W.; Kim, S.-L.; Lee, Y.-S.; Lee, Y.-W.; Shin, E.-K. Randomized, Open-Label, Two-Period Crossover Comparison of the Pharmacokinetic and Pharmacodynamic Properties of Two Amlodipine Formulations in Healthy Adult Male Korean Subjects. Clin. Ther. 2004, 26, 715–723. [Google Scholar] [CrossRef]
  30. Baier, V.; Cordes, H.; Thiel, C.; Castell, J.V.; Neumann, U.P.; Blank, L.M.; Kuepfer, L. A Physiology-Based Model of Human Bile Acid Metabolism for Predicting Bile Acid Tissue Levels After Drug Administration in Healthy Subjects and BRIC Type 2 Patients. Front. Physiol. 2019, 10. [Google Scholar] [CrossRef] [Green Version]
  31. Mukherjee, D.; Zha, J.; Menon, R.M.; Shebley, M. Guiding Dose Adjustment of Amlodipine after Co-Administration with Ritonavir Containing Regimens Using a Physiologically-Based Pharmacokinetic/Pharmacodynamic Model. J. Pharm. Pharm. 2018, 45, 443–456. [Google Scholar] [CrossRef] [Green Version]
  32. Rhee, S.; Lee, H.A.; Lee, S.; Kim, E.; Jeon, I.; Song, I.-S.; Yu, K.-S. Physiologically Based Pharmacokinetic Modeling of Fimasartan, Amlodipine, and Hydrochlorothiazide for the Investigation of Drug–Drug Interaction Potentials. Pharm. Res. 2018, 35, 1–10. [Google Scholar] [CrossRef] [PubMed]
  33. Engelking, L.R.; Barnes, S.; Dasher, C.A.; Naftel, D.C.; Hirschowitz, B.I. Radiolabelled Bile Acid Clearance in Control Subjects and Patients with Liver Disease. Clin. Sci. 1979, 57, 499–508. [Google Scholar] [CrossRef] [PubMed] [Green Version]
  34. Roda, A.; Minutello, A.; Angellotti, M.; Fini, A. Bile Acid Structure-Activity Relationship: Evaluation of Bile Acid Lipophilicity Using 1-Octanol/Water Partition Coefficient and Reverse Phase HPLC. J. Lipid Res. 1990, 31, 1433–1443. [Google Scholar] [CrossRef]
  35. Salvioli, G.; Lugli, R.; Pradelli, J.M.; Gigliotti, G. Bile Acid Binding in Plasma: The Importance of Lipoproteins. FEBS Lett. 1985, 187, 272–276. [Google Scholar] [CrossRef] [Green Version]
  36. Open Systems Pharmacology Suite Community. Open Systems Pharmacology Suite Manual. Available online: https://docs.open-systems-pharmacology.org/shared-tools-and-example-workflows/sensitivity-analysis (accessed on 26 May 2021).
  37. Zhu, Y.; Wang, F.; Li, Q.; Zhu, M.; Du, A.; Tang, W.; Chen, W. Amlodipine Metabolism in Human Liver Microsomes and Roles of CYP3A4/5 in the Dihydropyridine Dehydrogenation. Drug Metab. Dispos. 2014, 42, 245–249. [Google Scholar] [CrossRef] [Green Version]
  38. Zheng, X. Inhibition and Substrate Requirements of Human Apical Sodium-Dependent Bile Acid Transporter (ASBT) and Its Potential as a Prodrug Target. Ph.D. Thesis, University of Maryland, Baltimore, ML, USA, 2010. [Google Scholar]
  39. Dong, Z.; Ekins, S.; Polli, J.E. Structure-Activity Relationship for FDA Approved Drugs as Inhibitors of the Human Sodium Taurocholate Cotransporting Polypeptide (NTCP). Mol. Pharm. 2013, 10, 1008–1019. [Google Scholar] [CrossRef]
  40. Dong, Z.; Ekins, S.; Polli, J.E. Quantitative NTCP Pharmacophore and Lack of Association between DILI and NTCP Inhibition. Eur. J. Pharm. Sci. 2015, 66, 1–9. [Google Scholar] [CrossRef] [Green Version]
  41. Zou, L.; Matsson, P.; Stecula, A.; Ngo, H.X.; Zur, A.A.; Giacomini, K.M. Drug Metabolites Potently Inhibit Renal Organic Anion Transporters, OAT1 and OAT3. J. Pharm. Sci. 2021, 110, 347–353. [Google Scholar] [CrossRef]
  42. Türk, D.; Hanke, N.; Lehr, T. A Physiologically-Based Pharmacokinetic Model of Trimethoprim for MATE1, OCT1, OCT2, and CYP2C8 Drug-Drug-Gene Interaction Predictions. Pharmaceutics 2020, 12, 1074. [Google Scholar] [CrossRef]
  43. Zhou, Y.-T.; Yu, L.-S.; Zeng, S.; Huang, Y.-W.; Xu, H.-M.; Zhou, Q. Pharmacokinetic Drug-Drug Interactions between 1,4-Dihydropyridine Calcium Channel Blockers and Statins: Factors Determining Interaction Strength and Relevant Clinical Risk Management. Ther. Clin. Risk Manag. 2014, 10, 17–26. [Google Scholar] [CrossRef] [Green Version]
  44. Xin, H.-W.; Schwab, M.; Klotz, U. Transport studies with 5-aminosalicylate. Eur. J. Clin. Pharmacol. 2006, 62, 871–875. [Google Scholar] [CrossRef] [PubMed]
  45. Hirano, M.; Maeda, K.; Shitara, Y.; Sugiyama, Y. Contribution of OATP2 (OATP1B1) and OATP8 (OATP1B3) to the hepatic uptake of pitavastatin in humans. J. Pharmacol. Exp. Ther. 2004, 311, 139–146. [Google Scholar] [CrossRef] [PubMed]
  46. Ueo, H.; Motohashi, H.; Katsura, T.; Inui, K.-i. Human organic anion transporter hOAT3 is a potent transporter of cephalosporin antibiotics, in comparison with hOAT1. Biochem. Pharmacol. 2005, 70, 1104–1113. [Google Scholar] [CrossRef]
  47. Maeda, K.; Kambara, M.; Tian, Y.; Hofmann, A.F.; Sugiyama, Y. Uptake of ursodeoxycholate and its conjugates by human hepatocytes: Role of Na+-taurocholate cotransporting polypeptide (NTCP), organic anion transporting polypeptide (OATP) 1B1 (OATP-C), and OATP1B3 (OATP8). Mol. Pharm. 2006, 3, 70–77. [Google Scholar] [CrossRef]
  48. Ho, R.H.; Leake, B.F.; Urquhart, B.L.; Gregor, J.C.; Dawson, P.A.; Kim, R.B. Functional characterization of genetic variants in the apical sodium-dependent bile acid transporter (ASBT.; SLC10A2). J. Gastroenterol. Hepatol. 2011, 26, 1740–1748. [Google Scholar] [CrossRef] [Green Version]
  49. Craddock, A.L.; Love, M.W.; Daniel, R.W.; Kirby, L.C.; Walters, H.C.; Wong, M.H. Expression and transport properties of the human ileal and renal sodium-dependent bile acid transporter. Am. J. Physiol. 1998, 274, G157–G169. [Google Scholar] [CrossRef] [PubMed]
  50. Scherer, M.; Gnewuch, C.; Schmitz, G.; Liebisch, G. Rapid quantification of bile acids and their conjugates in serum by liquid chromatography-tandem mass spectrometry. J. Chromatogr. B. 2009, 877, 3920–3925. [Google Scholar] [CrossRef]
  51. Koo, T.-S.; Kwon, H.-J.; Kim, M.-H.; Kim, D.-D.; Shim, C.-K.; Chung, S.-J.; Chong, S. Functional impairment of rat taurine transporter by activation of nitrogen oxide through superoxide. Drug. Metab. Pharmacokinet. 2012, 27, 286–293. [Google Scholar] [CrossRef] [Green Version]
  52. Kwon, M.; Choi, Y.A.; Choi, M.-K.; Song, I.-S. Organic cation transporter-mediated drug-drug interaction potential between berberine and metformin. Arch. Pharm. Res. 2015, 38, 849–856. [Google Scholar] [CrossRef]
  53. Rohatgi, A. WebPlotDigitizer; Web Based Tool to Extract Data from Plot, Images, and Mapss Version 4.4. (Pacifica, California, USA). 2020. Available online: http://automeris.io/WebPlotDigitizer (accessed on 5 May 2021).
  54. Meyer, M.; Schneckener, S.; Ludewing, B.; Kuepfer, L.; Lippert, J. Using expression data for Quantification of Active Processes in Physiologically Based Pharmacokinetic Modeling. Drug Metab. Dispos. 2012, 40, 892–901. [Google Scholar] [CrossRef]
  55. Schmitt, W. General Approach for the Calculation of Tissue to Plasma Partition Coefficients. Toxicol. In Vitro 2008, 22, 457–467. [Google Scholar] [CrossRef] [PubMed]
  56. Tanaka, G. Anatomical and Physiological Characteristics for Asian Reference Man-Male and Female of Different Age: Tanaka Model; NIRS-M-115; Division of Radioecology, National Institute of Radiological Sciences: Chiba, Japan, 1996. [Google Scholar]
  57. Valentin, J. Basic Anatomical and Physiological Data for Use in Radiological Protection: Reference Values: ICRP Publication 89. ICRP 2002, 32, 1–277. [Google Scholar] [CrossRef]
  58. Rodgers, T.; Leahy, D.; Rowland, M. Physiologically Based Pharmacokinetic Modeling 1: Predicting the Tissue Distribution of Moderate-to-Strong Bases. J. Pharm. Sci. 2005, 94, 1259–1276. [Google Scholar] [CrossRef] [PubMed]
  59. Taylor, M.J.; Tanna, S.; Sahota, T. In Vivo Study of a Polymeric Glucose-Sensitive Insulin Delivery System Using a Rat Model. J. Pharm. Sci. 2010, 99, 4215–4227. [Google Scholar] [CrossRef] [PubMed]
  60. Zheng, X.; Ekins, S.; Raufman, J.-P.; Polli, J.E. Computational Models for Drug Inhibition of the Human Apical Sodium-Dependent Bile Acid Transporter. Mol. Pharm. 2009, 6, 1591–1603. [Google Scholar] [CrossRef] [Green Version]
  61. Hanke, N.; Teifel, M.; Moj, D.; Wojtyniak, J.-G.; Britz, H.; Aicher, B.; Sindermann, H.; Ammer, N.; Lehr, T. A Physiologically Based Pharmacokinetic (PBPK) Parent-Metabolite Model of the Chemotherapeutic Zoptarelin Doxorubicin-Integration of in Vitro Results, Phase I and Phase II Data and Model Application for Drug-Drug Interaction Potential Analysis. Cancer Chemother Pharmacol. 2018, 81, 291–304. [Google Scholar] [CrossRef]
  62. Türk, D.; Hanke, N.; Wolf, S.; Frechen, S.; Eissing, T.; Wendl, T.; Schwab, M.; Lehr, T. Physiologically Based Pharmacokinetic Models for Prediction of Complex CYP2C8 and OATP1B1 (SLCO1B1) Drug-Drug-Gene Interactions: A Modeling Network of Gemfibrozil, Repaglinide, Pioglitazone, Rifampicin, Clarithromycin and Itraconazole. Clin. Pharm. 2019, 58, 1595–1607. [Google Scholar] [CrossRef] [PubMed] [Green Version]
Figure 1. Concentration-dependent uptake of MT921 (5–100 µM for OATP1B3, NTCP, and ASBT, 5–300 µM for OAT3) in HEK 293 (A) -OATP1B3; (B) -OAT3; (C) -NTCP; (D) -ASBT. Each bar represents mean ± standard deviation from triplicate experiments. Vmax, maximum velocity at saturating substrate concentration; [S], substrate concentration; Km, substrate concentration at half of Vmax; CLdiffusion represents the passive diffusion clearance.
Pharmaceuticals 14 00654 g001
Figure 2. Concentration-dependent inhibition of MT921 uptake (0.5–100 µM) on (A) 0.022 µM [3H]estrone-3-sulfate in HEK 293-OATP1B1; (B) 0.06 µM [3H]estradiol-17β-D-glucuronide in HEK 293-OATP1B3; (C) 0.022 µM [3H]estrone-3-sulfate in HEK 293-OAT3; (D) 0.8 µM [3H]taurocholate in HEK 293-NTCP; (E) 0.8 µM [3H]taurocholate in HEK 293-ASBT. Each bar represents mean ± standard deviation from triplicate experiments. IC50, drug concentration at 50% inhibition.
Pharmaceuticals 14 00654 g002
Figure 3. Semilogarithmic graph comparing plasma concentration of MT921 administered alone and co-administered. Chronic disease drugs were administered for 9 days, once a day. At 10 days, 150 mg of MT921 was co-administered with chronic disease drugs. After administration, MT921 concentration was predicted. The purple line is a MT921-only population plasma concentration. The pink shade area is the 5–95% range of MT921 co-administration population plasma concentration. The green line is AMLO. The blue line is SIM. The gray line is PIO.
Pharmaceuticals 14 00654 g003
Figure 4. Drug–drug interaction networks. Simvastatin, amlodipine, and pioglitazone are the perpetrator drug in the DDI prediction model. MT921 (Cholic acid) is the victim drug. Simvastatin inhibits ASBT and NTCP. Amlodipine inhibits ASBT. Pioglitazone inhibits ASBT, NTCP, and OAT3. The red solid line represents inhibition, and the black solid line represents transport.
Pharmaceuticals 14 00654 g004
Figure 5. DDI scenario. During period 1, DDI drug(s) was administered as q.d., and MT921 was co-administered with DDI drug(s). AMLO, amlodipine; SIMV, simvastatin; PIO, pioglitazone.
Pharmaceuticals 14 00654 g005
Table 1. The uptake transport rate of MT921 (10 µM and 100 µM) in HEK 293-OATP1B1, -OATP1B3, -OAT3, -NTCP, -ASBT, and mock cells.
Concentration (µM)TransporterUptake
(pmol/mg protein/min)
Uptake Ratio
(Transporter vs. Mock)
10Mock7.61 ± 0.911.00
HEK 293-OATP1B112.68 ± 0.641.67
100Mock72.15 ± 3.911.00
HEK 293-OATP1B172.98 ± 4.461.01
10Mock7.61 ± 0.911.00
HEK 293-OATP1B323.24 ± 1.083.05
100Mock72.15 ± 3.911.00
HEK 293-OATP1B3126.56 ± 5.441.75
10Mock7.61 ± 0.911.00
HEK 293-OAT315.46 ± 2.092.03
100Mock72.15 ± 3.911.00
HEK 293-OAT363.53 ± 5.350.88
10Mock4.85 ± 0.551.00
HEK 293-NTCP56.74 ± 6.6611.71
100Mock57.16 ± 0.671.00
HEK 293-NTCP215.08 ± 8.653.76
10Mock4.38 ± 0.421.00
HEK 293-ASBT78.33 ± 5.6617.89
100Mock50.22 ± 5.651.00
HEK 293-ASBT253.49 ± 13.665.05
Each data represents the mean ± standard deviation from triplicate determinations.
Publisher’s Note: MDPI stays neutral with regard to jurisdictional claims in published maps and institutional affiliations.

