Article

Phenotypic and Genotypic Comparison of Antimicrobial-Resistant Variants of Escherichia coli and Salmonella Typhimurium Isolated from Evolution Assays with Antibiotics or Commercial Products Based on Essential Oils

1
Departamento de Producción Animal y Ciencia de los Alimentos, Facultad de Veterinaria, Instituto Agroalimentario de Aragón-IA2 (Universidad de Zaragoza-CITA), 50013 Zaragoza, Spain
2
Phytosynthese, 63200 Mozac, France
3
Chemistry Interdiscplinary Project (ChIP), School of Pharmacy, University of Camerino, 62032 Camerino, Italy
*
Author to whom correspondence should be addressed.
Pharmaceuticals 2023, 16(10), 1443; https://0-doi-org.brum.beds.ac.uk/10.3390/ph16101443
Submission received: 14 September 2023 / Revised: 6 October 2023 / Accepted: 7 October 2023 / Published: 11 October 2023

Abstract

:
On account of the widespread development and propagation of antimicrobial-resistant (AMR) bacteria, essential oils (EOs) have emerged as potential alternatives to antibiotics. However, as already observed for antibiotics, recent studies have raised concerns regarding the potential emergence of resistant variants (RVs) to EOs. In this study, we assessed the emergence of RVs in Escherichia coli and Salmonella enterica Typhimurium after evolution assays under extended exposure to subinhibitory doses of two commercial EOs (AEN and COLIFIT) as well as to two antibiotics (amoxicillin and colistin). Phenotypic characterization of RVs from evolution assays with commercial EOs yielded no relevant increases in the minimum inhibitory concentration (MIC) of E. coli and did not even modify MIC values in S. Typhimurium. Conversely, RVs of E. coli and S. Typhimurium isolated from evolution assays with antibiotics showed increased resistance. Genotypic analysis demonstrated that resistance to commercial EOs was associated with enhanced protection against oxidative stress and redirection of cell energy toward efflux activity, while resistance to antibiotics was primarily linked to modifications in the cell binding sites of antibiotics. These findings suggest that AEN and COLIFIT could serve as safe alternatives to antibiotics in combating the emergence and dissemination of antimicrobial resistance within the agrifood system.

Graphical Abstract

1. Introduction

The use of antibiotics in primary meat production is required to ensure animal health and welfare. In 2021, within the European Union (EU), penicillins emerged as the dominant antibiotic class, constituting a substantial 31.2% of the total antibiotic medicinal product sales designated for food-producing animals. Notably, penicillins with an extended spectrum, led by amoxicillin as the foremost representative, commanded the highest sales figures across the majority of EU member states [1]. Another notable antibiotic, extensively employed in livestock, is colistin, a member of the polymyxin antibiotic class. However, the utilization of colistin has faced stringent restrictions, owing to its critical status as a high-priority antibiotic—reserved as a last-resort option for combating human infections caused by multidrug-resistant Gram-negative bacteria [2].
Remarkably, antibiotics have been employed not only for treating animal diseases but also for fostering animal growth and optimizing feed conversion ratios, primarily aimed at augmenting productivity and, consequently, enhancing income [3]. Moreover, the overuse and misuse of antibiotics in primary production have contributed to the increase in antibiotic residues in food and the environment, as well as to the emergence of antimicrobial-resistant (AMR) bacteria [3]. In 2020–2021, high rates of multidrug resistance were observed in Salmonella spp. and Escherichia coli isolates recovered from broilers (41.8% and 37.7%, respectively), turkeys (38.2% and 47.6%), pigs (39.1% and 28.8%), and calves (30.4% and 18.8%) in the EU [2]. The main consequence is that these AMR bacteria can reach consumers all along the food chain, resulting in difficult-to-treat infections and, consequently, a higher morbidity and mortality rate.
Essential oils (EOs) are complex mixtures of volatile compounds extracted from different parts of plants [4]. A substantial number of studies have shown that EOs and their individual constituents (ICs) possess excellent antimicrobial properties [5] and have the ability to promote animal growth, as they are regarded as a major group of phytogenic feed additives [6]. For these reasons, EOs and their ICs have been proposed as alternatives to antibiotics with the primary objective of overcoming the emergence and dissemination of AMR bacteria [7,8].
Nevertheless, recent studies have shown that prolonged exposure to EOs or ICs can also lead to the emergence of resistant variants (RVs). These RVs are strains with increased resistance to the antimicrobial to which they have been exposed. The repeated application of Citrus sinensis (L.) Osbeck EO led to the selection of RVs of Staphylococcus aureus [9], while continuous exposure to Thymbra capitata (L.) EO resulted in the emergence of RVs of Listeria monocytogenes [10] and Salmonella enterica [11]. In addition, RVs in populations of E. coli [12,13], S. aureus [14], and S. enterica [15] were obtained after cyclical exposure to three different ICs (carvacrol, citral, and limonene oxide). It is worth noting that most of these RVs not only displayed direct resistance to the selective antimicrobial compound but also cross-resistance to a wide range of antibiotics, thus showing that the genetic modifications selected after exposure to EOs or ICs could be associated with resistance to antibiotics. However, cross-resistance of antibiotic-resistant variants against EOs or ICs has been less studied.
Thus, this study seeks (a) to evaluate the emergence of RVs of Escherichia coli MG1655 and Salmonella enterica subsp. enterica serovar Typhimurium str. LT2 after exposure to two commercial EOs (AEN and COLIFIT) or to two antibiotics (amoxicillin and colistin) using the same evolution protocol; (b) to assess the occurrence of cross-resistance of isolated RVs; and (c) to identify the genetic modifications responsible for the increase in the resistance of isolated RVs.

2. Results and Discussion

2.1. Chemical Composition of AEN and COLIFIT

Qualitative and quantitative analysis of commercial EOs was performed by GC/MS to determine their chemical composition. Table 1 shows the proportion of the different components present in AEN and COLIFIT. Only three volatile components were identified in AEN, representing 99.35% of all components detected therein. They were grouped into two classes: phenylpropanoids (97.96%) and sesquiterpene hydrocarbons (1.40%). The most abundant component was (E)-cinnamaldehyde (87.12%), followed by eugenol (10.83%) and (E)-caryophyllene (1.40%). All of them have been observed in Cinnamomum spp. EOs; in most cases, (E)-cinnamaldehyde was their major IC [16,17,18,19]. Twenty-six volatile components were identified in COLIFIT, representing 99.83% of all detected components. The two most representative classes were phenylpropanoids (47.02%) and monoterpenoids (43.54%), and the most abundant components were (E)-cinnamaldehyde (43.93%), thymol (29.83%), and carvacrol (10.56%). Thymol and its isomer carvacrol are the main phenolic monoterpenes found in EOs extracted from plants belonging to the Lamiaceae family [20,21]. In addition to those, other components were present in a concentration greater than 1.0%: geranial (3.12%), eugenol (2.99%), neral (1.98%), citronellal (1.98%), and p-cymene (1.30%).

2.2. Minimum Inhibitory Concentration (MIC)

Minimum inhibitory concentration (MIC) values of AEN, COLIFIT, amoxicillin, and colistin were determined against EcWT and SeWT (Table 2) prior to the evaluation of mutagenesis frequency and subsequent evolution assays.
As observed in Table 2, MIC values of AEN were lower than those of COLIFIT against both microorganisms. Thus, AEN showed a greater bacteriostatic effect than COLIFIT. Two factors can help explain this difference between the two commercial EOs: the bacteriostatic efficacy of the most prominent ICs, and the interaction among all ICs. Regarding the first factor, previous studies have reported similar MIC values of (E)-cinnamaldehyde [26,27], eugenol [27,28], thymol [27,29,30], and carvacrol [16,28,30] against various strains of E. coli and Salmonella spp. It is hence unlikely that the observed difference between the commercial EOs can be solely attributed to the bacteriostatic efficacy of their most prominent ICs. Certain researchers have suggested that the antimicrobial effect of EOs could be influenced by a synergistic, additive, or antagonistic effect among minor components [31]. Therefore, interactions among the ICs in AEN and COLIFIT would play a crucial role in the bacteriostatic efficacy of these two commercial EOs.
MIC values for the two antibiotics amoxicillin and colistin were consistent with the MIC distributions compiled by the EUCAST (European Committee on Antimicrobial Susceptibility Testing) for E. coli and S. enterica [32]. The most frequently observed MIC values against E. coli were 2, 4, and 8 μg/mL for amoxicillin, whereas for colistin, they were 0.25, 0.5, and 1 μg/mL. The most frequently observed MIC values against S. enterica were 0.5, 1, and 2 μg/mL for amoxicillin, whereas for colistin, they were 2, 4, and 8 μg/mL. It is also worth noting that SeWT was more susceptible to amoxicillin, while EcWT was more susceptible to colistin, although both antibiotics were highly effective.
MIC and MBC values for AEN and COLIFIT exhibited relatively minor variations as observed for other ICs of EOs [15,33], showing their strong bactericidal activity. Likewise, MIC and MBC values for antibiotics showed similarity due to the bactericidal nature of amoxicillin and colistin [34].

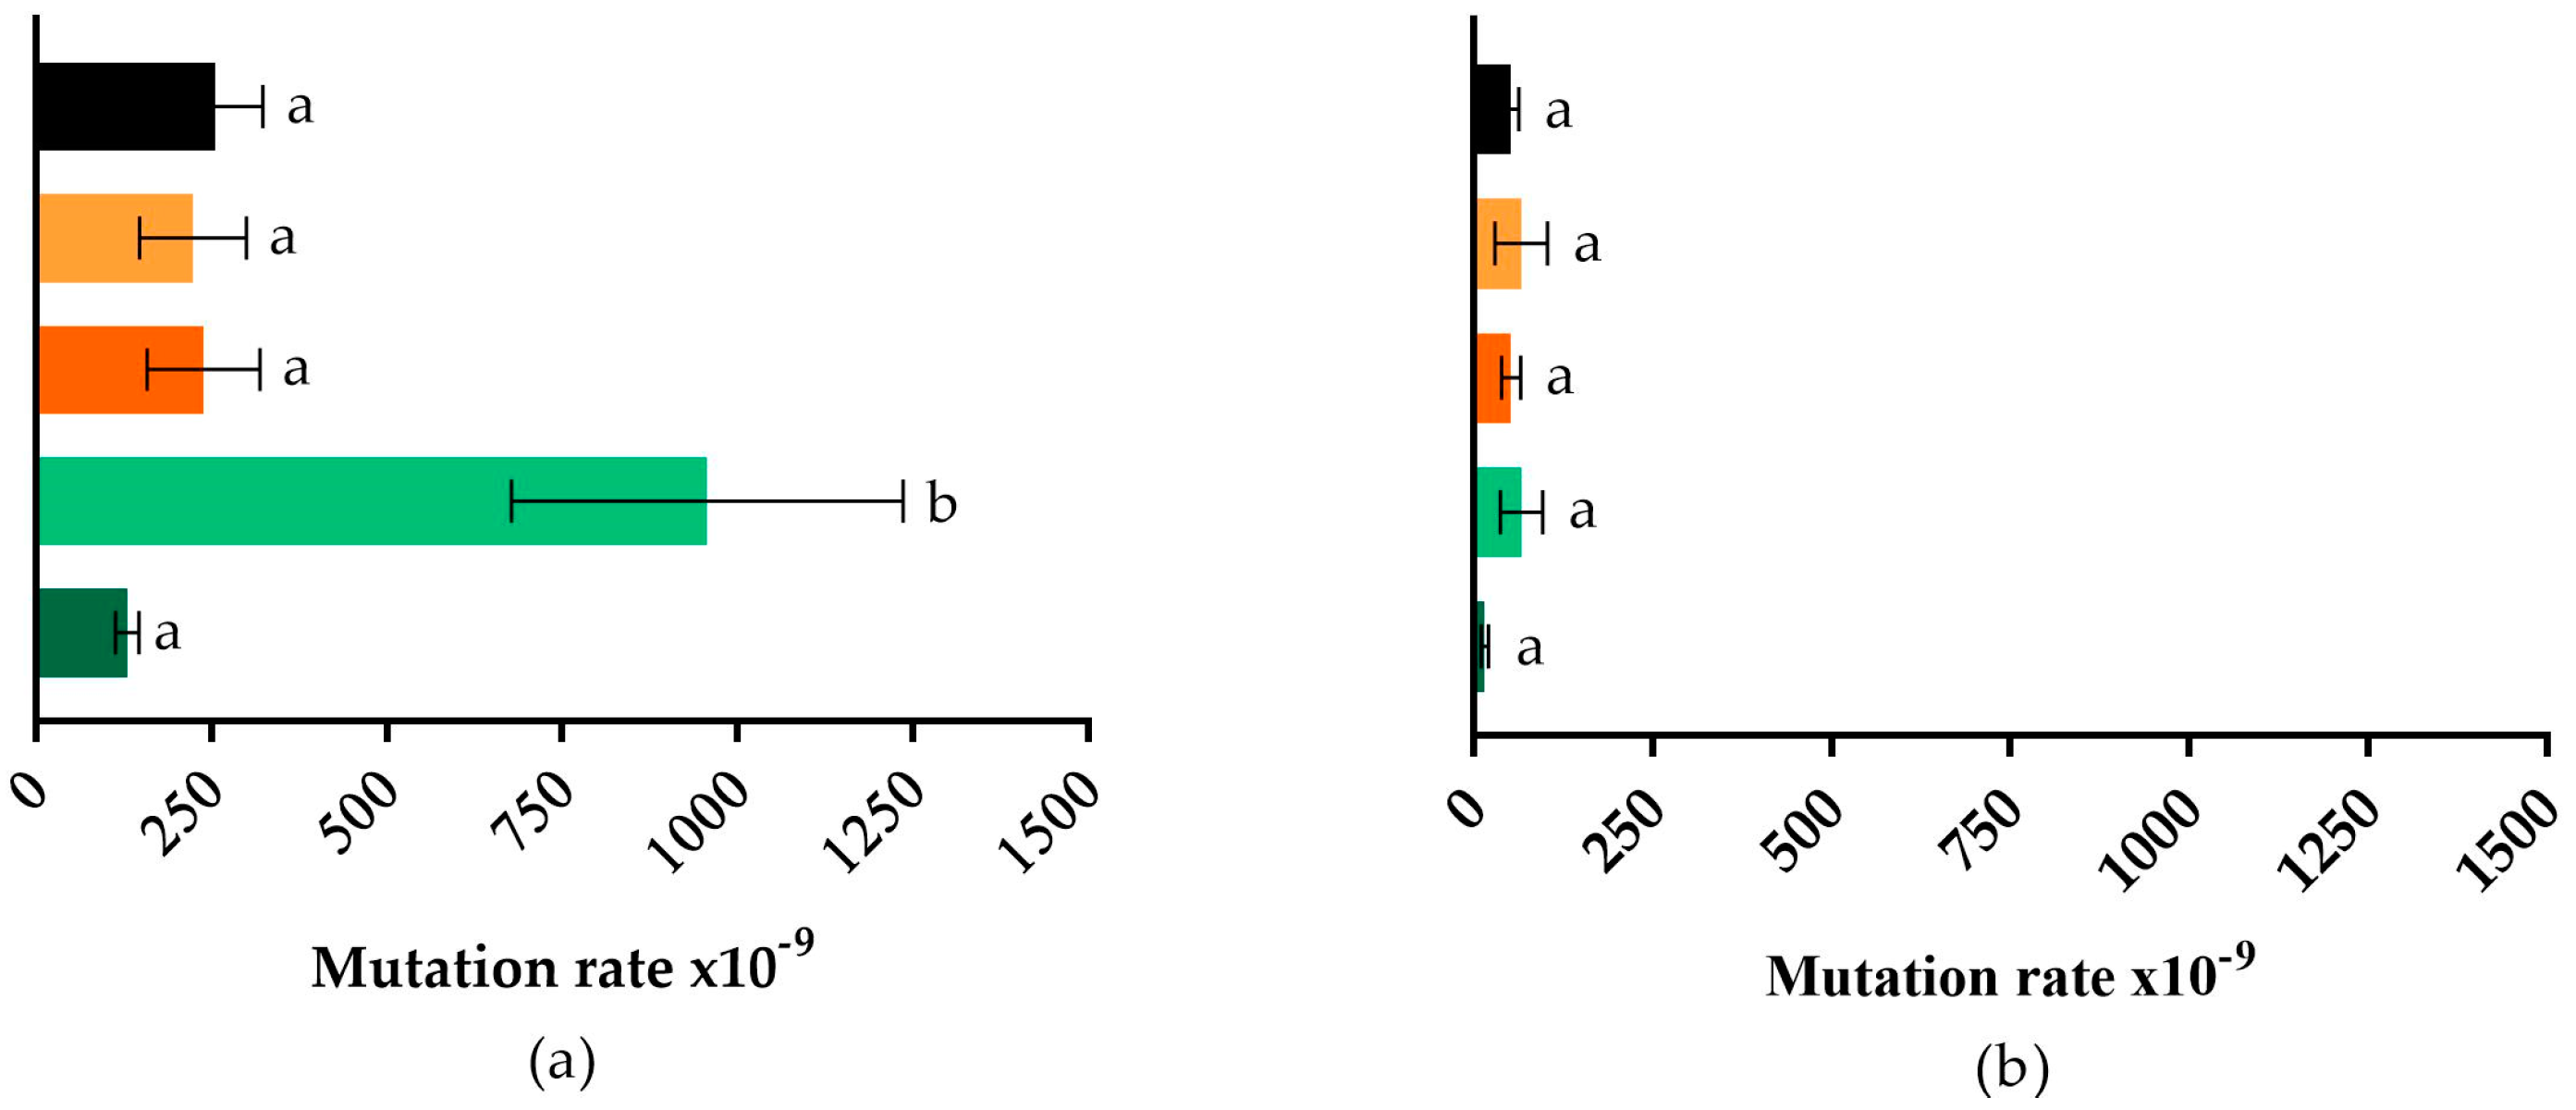
2.3. Mutagenesis Frequency

The rifampicin-based selection method was used to determine mutation rates in EcWT (Figure 1A) and SeWT (Figure 1B) after 24 h of growth in the presence and absence of subinhibitory doses (0.5 × MIC) of the antimicrobial compounds.
On the one hand, EcWT displayed a spontaneous frequency of rifampicin-resistant mutants of ~3 × 10⁻⁷, meaning that 3 out of 107 cells developed resistance to rifampicin. This result is quite similar to the value obtained for E. coli ME12, an MG1655 derivative strain, where 2 out of 10−7 cells were rifampicin-resistant [35]. On the other hand, SeWT in the absence of antimicrobial compounds showed a lower mutation rate (5 × 10⁻⁸) in comparison to EcWT.
In both cases, incubation in the presence of AEN and COLIFIT did not lead to a higher proportion of mutants (p > 0.05), in agreement with Chueca et al. [12] and Berdejo et al. [14]. The two latter studies found that exposure to different ICs did not increase or even decrease the mutation rate, thereby demonstrating a protective effect against mutations.
Regarding the impact of incubation in the presence of antibiotics, colistin did not increase bacterial mutagenesis for either microorganism (p > 0.05). This is in line with several studies in which the presence of colistin did not increase the mutagenic frequency of several different microorganisms [36,37,38]. However, amoxicillin significantly increased the mutation rate of E. coli, yielding a value of approximately 1 × 10⁻⁶ (p ≤ 0.05). This increase aligns with the findings of Kohanski et al. [39], who observed a significant rise in the mutation rate of E. coli MG1655 following exposure to subinhibitory levels of various antibiotics, such as norfloxacin, ampicillin, and kanamycin.

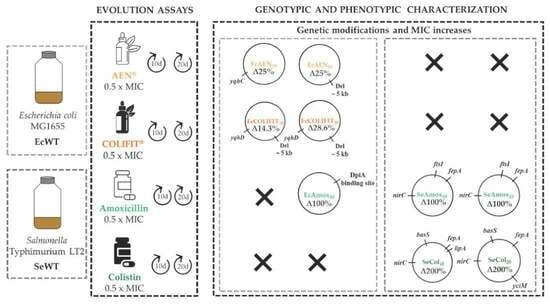
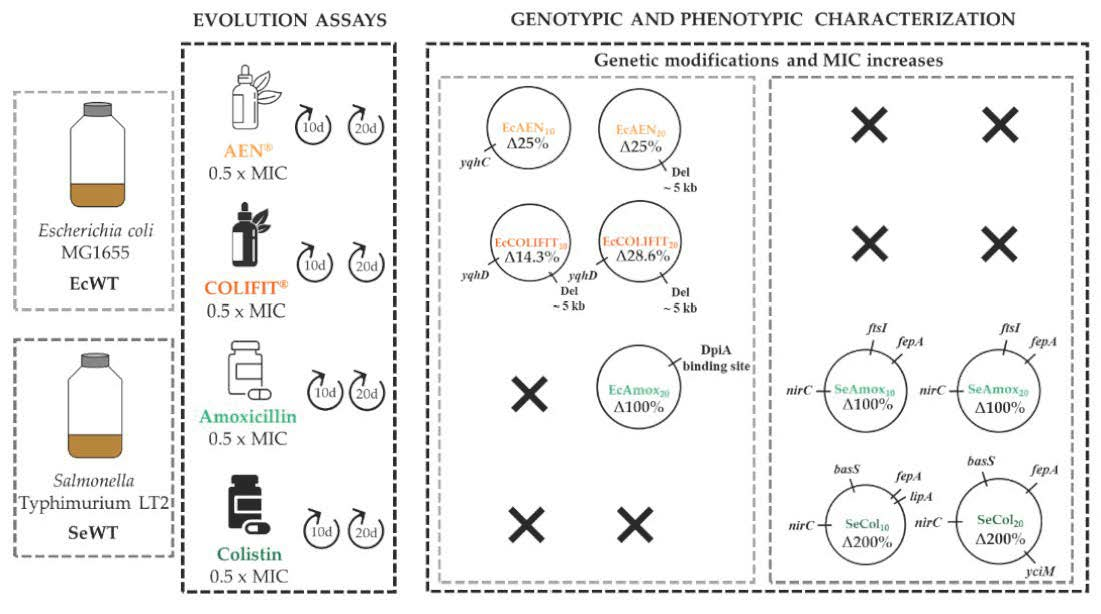
2.4. Phenotypic Characterization of Evolved Mutants

In order to ascertain whether RVs of E. coli and S. Typhimurium were present after 10 and 20 cycles of exposure to subinhibitory doses of AEN, COLIFIT, amoxicillin, or colistin, we determined the MIC values of isolated strains against their selective agents. Although MIC determination was carried out with five different colonies of each culture, Table 3 and Table 4 only include MIC values of one colony, as they all showed the same MIC value against their selective agent.
E. coli RVs were obtained after 10 and 20 cycles of exposure to AEN (EcAEN10 and EcAEN20) and to COLIFIT (EcCOLIFIT10 and EcCOLIFIT20), as well as after 20 cycles of exposure to amoxicillin (EcAmox20), but none after the exposure to colistin, although the evolution assays were conducted twice. Table 3 shows MIC values of EcWT and its RVs against all the selective agents, as well as against two major ICs (thymol and cinnamaldehyde).
In comparison to EcWT, EcAEN10 and EcAEN20 showed a 25% increase in MIC value against AEN, and EcCOLIFIT10 and EcCOLIFIT20 showed an increase in MIC value against COLIFIT of the order of 14.3% and 28.6%, respectively. However, compared to other studies in which RVs have also emerged after exposure to complex EOs [9,10,11], the observed increase in resistance was relatively low. Apart from direct resistance, AEN- and COLIFIT-RVs (EcAEN10, EcAEN20, EcCOLIFIT10, and EcCOLIFIT20) displayed a slight cross-resistance against AEN, COLIFIT, and cinnamaldehyde. Bearing in mind the similarity of the chemical composition of these two commercial EOs containing cinnamaldehyde as their main IC, these results were not surprising.
Against antibiotics, EcAmox20 displayed not only a considerable increase in resistance to amoxicillin (increase in MIC value of 100%) but also a slight cross-resistance to COLIFIT and cinnamaldehyde (Table 3). These results are in line with Hriouech et al. [40], who observed that exposure to increasing concentrations of amoxicillin not only resulted in a considerable MIC increase against amoxicillin but also against the IC thymol.
S. Typhimurium RVs emerged after 10 and 20 cycles of exposure to antibiotics (SeAmox10, SeAmox20, SeCol10, SeCol20) but not after exposure to commercial EOs, although the evolution assays were conducted twice. This is consistent with the study carried out by Hriouech et al. [40], who observed that subculturing E. coli in increasing concentrations of amoxicillin led to a considerable increase in MIC values, whereas subculturing in increasing concentrations of the IC thymol did not affect MIC values.
Table 4 shows MIC values of SeWT and its RVs against all the selective agents and against their major ICs (thymol and cinnamaldehyde). In comparison to SeWT, SeAmox10 and SeAmox20 showed an increase in MIC value of 100%, and SeCol10 and SeCol20 showed an increase in MIC value of 200%. This increase in resistance is remarkable. However, none of these strains showed cross-resistance to the other compounds. In fact, SeCol20 showed a higher susceptibility to COLIFIT.
All these results indicate that prolonged exposure to subinhibitory doses of AEN and COLIFIT either does not lead to a significant increase in resistance or does not even trigger the emergence of RVs. Conversely, prolonged exposure to subinhibitory doses of antibiotics does lead to the emergence of significant RVs. Hence, AEN and COLIFIT could be implemented as sustainable alternatives to antibiotics.

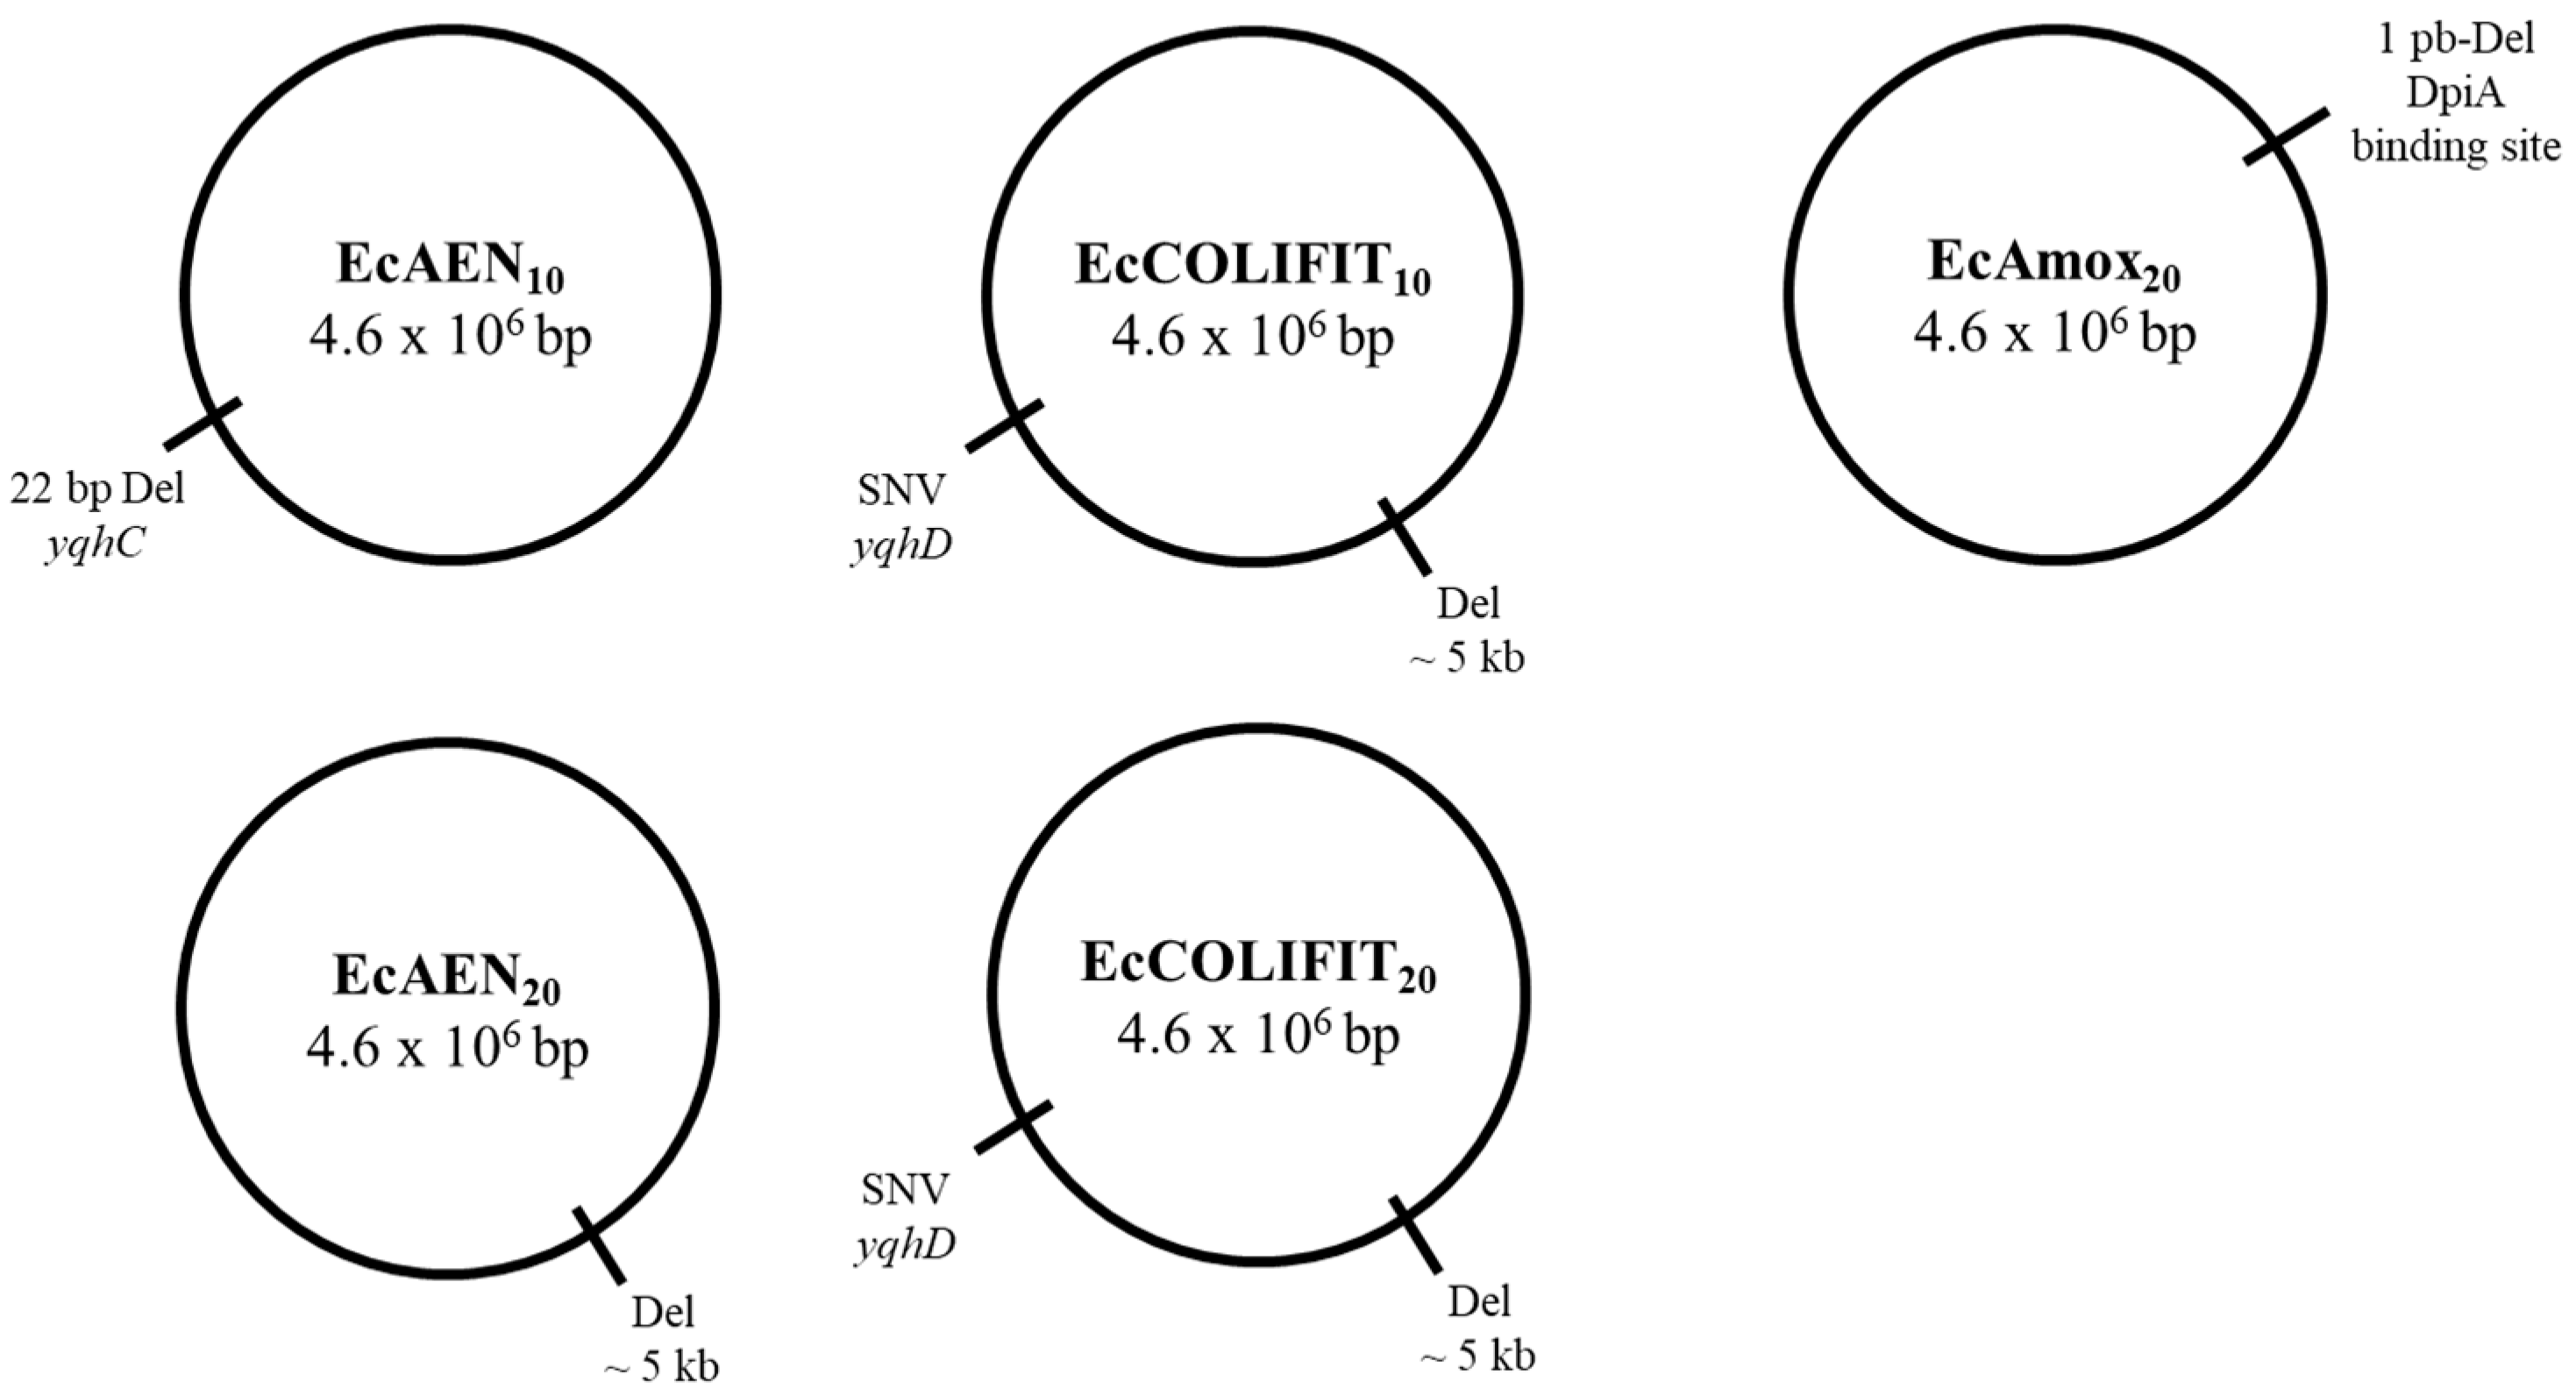
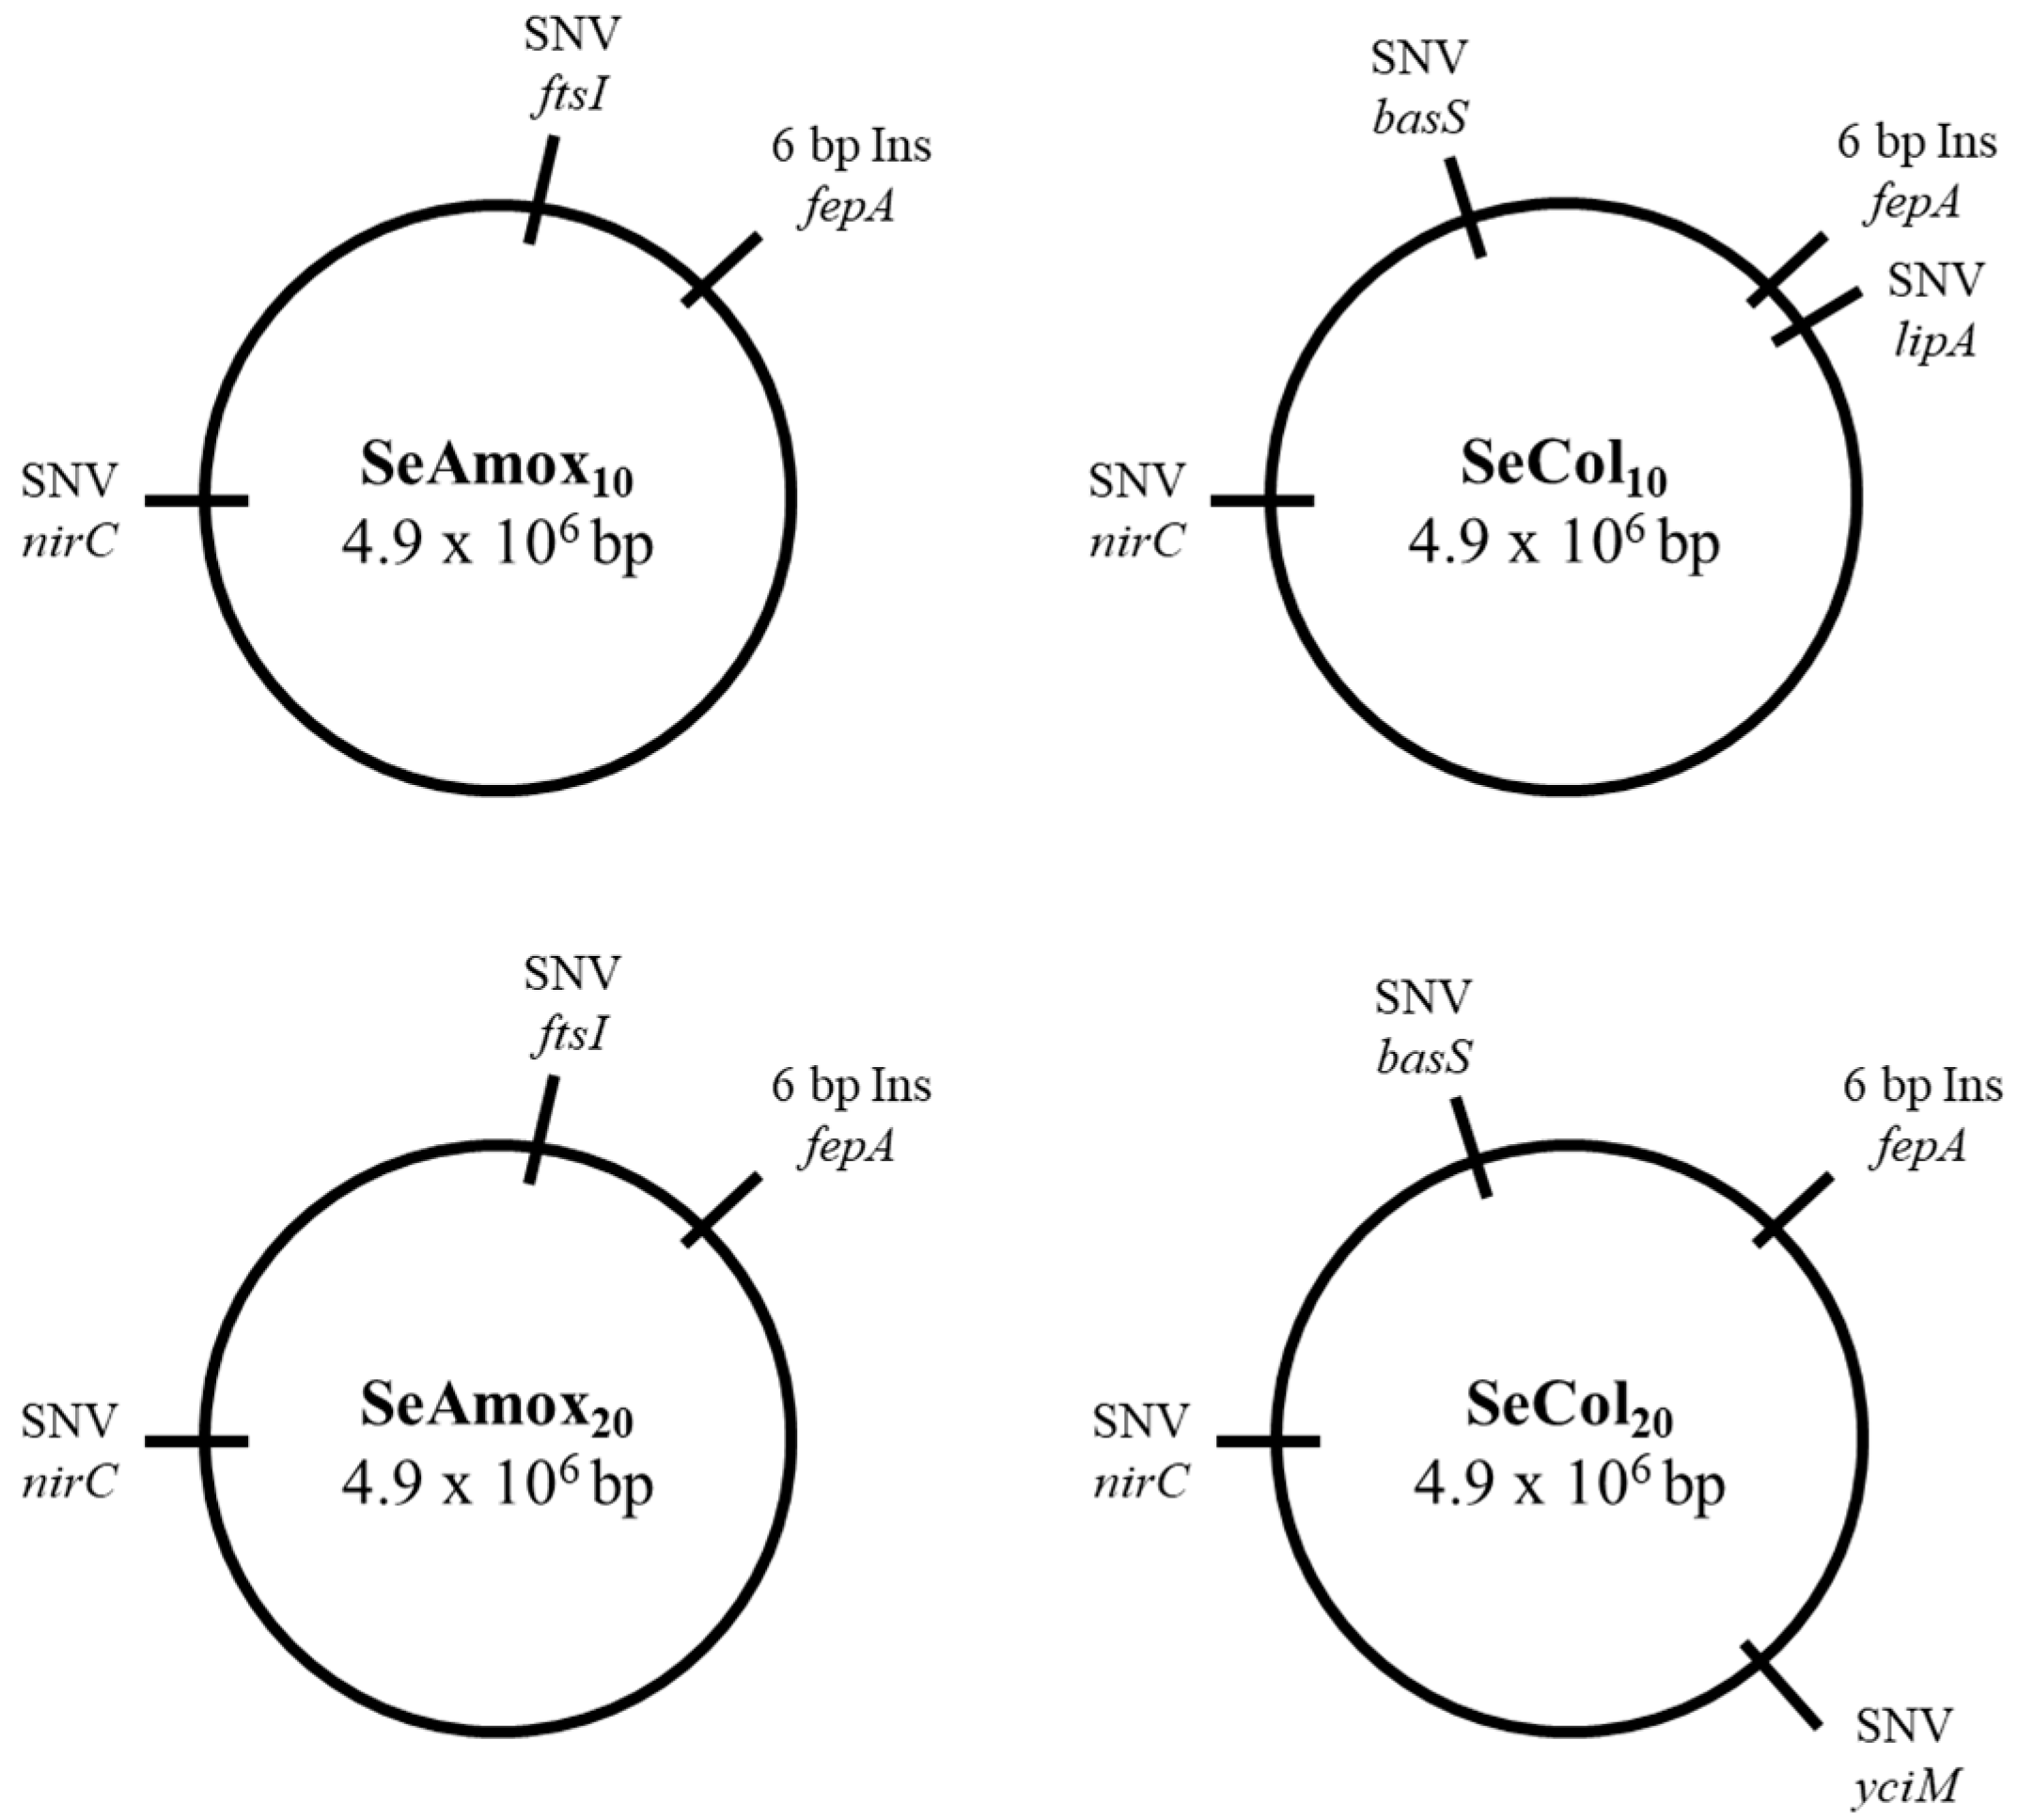
2.5. Genotypic Characterization of RVs

In order to ascertain which genetic variations were associated with the increased resistance of evolved strains to natural antimicrobial compounds as well as to antibiotics, we conducted WGS on EcWT, SeWT, and RVs.
Regarding EcWT and its RVs EcAEN10, EcAEN20, EcCOLIFIT10, EcCOLIFIT20, and EcAmox20, a total of 5.3, 5.0, 5.0, 4.8, 4.9, and 10.6 million 150-bp reads were respectively obtained. After quality control analysis, we determined that 93.08%, 93.11%, 92.80%, 93.31%, 93.38%, and 89.63% of those reads were above Q30. The filtered paired-end reads were then mapped on the reference genome sequence (Escherichia coli str. K-12 substr. MG1655 (NCBI accession: NC_000913.3)) at 99.88%, 99.89%, 99.86%, 99.87%, 99.89%, and 99.41%, respectively. We were able to detect genetic variations among strains because the reference genome was sufficiently covered and because a 150-fold coverage depth was achieved for all strains.
Genetic variations between the reference genome and EcWT were identified in order to exclude them as potential causes of resistance in RVs. After discarding those mutations, we conducted a genomic comparison of EcWT and its RVs (Figure 2) with the aim of identifying the genetic variations and, consequently, the genes involved in the resistance against the antimicrobial compounds. Table 5 shows all the genetic variations we found between EcWT and its RVs.
Regarding COLIFIT RVs (EcCOLIFIT10 and EcCOLIFIT20), WGS and Sanger sequencing revealed an SNV in yqhD and a deletion of more than 5000 bp in both strains; thus, there were no genetic differences between the strain obtained after 10 cycles and the strain obtained after 20 cycles. Regarding AEN RVs (EcAEN10 and EcAEN20), WGS revealed a 22-bp deletion in EcAEN10 and a deletion of more than 5000 bp in EcAEN20. However, Sanger sequencing revealed that some colonies selected after 10 cycles showed the 5-kb deletion and that some colonies selected after 20 cycles showed the 22-bp deletion, thus indicating that two different populations were present from the 10th cycle on.
As mentioned above, a 22-bp deletion was detected in the yqhC gene causing a frameshift. More specifically, this deletion affected part of a DNA-binding domain of the YqhC protein. Furthermore, a transition from guanine (G) to adenine (A) was detected at position 3,156,163 in the yqhD gene of COLIFIT RVs, resulting in a modification of the translation from glycine (Gly) to aspartic acid (Asp). The yqhC gene encodes the YqhC protein, a transcriptional regulator that activates the expression of the adjacent gene yqhD by binding to its putative promoter region [41]. This gene encodes the NADPH-dependent oxidoreductase YqhD, involved in bacterial response to the reactive oxygen species (ROS)-generating compounds and to the lipid peroxidation-derivate aldehydes [42]. Several authors observed mutations in the regulatory region of YqhC in E. coli MG1655 glyoxal- and glutaraldehyde-RVs, which were responsible for the overexpression of the yqhD gene and, consequently, for the increased resistance to antimicrobial compounds [41,43]. On the other hand, several studies linked exposure to ICs to the expression of genes involved in cellular response to oxidative stress, including the yqhD gene [44,45,46]. Hence, it is possible that the mutations detected in yqhC and yqhD may have enhanced the expression of yqhD and, consequently, the activity against ROS, thus increasing bacterial resistance to the commercial EOs and to the IC cinnamaldehyde.
Apart from triggering yqhC and yqhD genetic mutations, a deletion of more than 5000 bp led to the loss of several chemotaxes (cheW and cheA) and flagellar genes (motB, motA, motR, flhC, and flhD) (Table 5). Firstly, cheW and cheA encode CheW and CheA proteins, which are part of the chemotaxis signal transduction system, which, in turn, plays a decisive role in bacterial response to environmental cues and in the transmission of sensory signals from the chemoreceptors to the flagellar motors. In relation to motB and motA genes, they encode the motility proteins MotB and MotA, which comprise the stator element of the flagellar motor complex required for the rotation of the flagellar motor. Finally, flhC and flhD genes encode FlhC and FlhD proteins, which regulate the transcription of several flagellar operons. Lyu et al. [47] observed that cells that expressed flagella were more susceptible to antibiotics, whereas cells that did not express flagella were more resistant to them. They concluded that motility and efflux genes compete for the cellular energy stored in the form of proton motive force and that the loss of function of motility genes increases efflux activity and, consequently, bacterial resistance to antimicrobial compounds. Apart from that study, several other studies have linked the loss of function of different chemotaxis and motility genes to increased bacterial resistance to antimicrobial compounds. Tirumalai et al. [48] detected a major deletion affecting chemotaxis and motility genes after long-term exposure of E. coli MG1655 to chloramphenicol. Similarly, a further study [49] observed that chemotaxis and motility genes were downregulated after long-term exposure of E. coli MG1655 to benzalkonium chloride. On the other hand, Berdejo et al. [15] and Pagán et al. (unpublished results) detected genetic modifications in the motility genes fliG and fliH after the exposure of S. Typhimurium to carvacrol, one of the main ICs of COLIFIT. Therefore, the loss of chemotaxis and flagellar genes present in 5-kb deletion might explain the increased resistance of RVs to commercial EOs by the high availability of energy owing to the potential redirection of resources toward efflux activity.
Only one genetic modification was detected in the amoxicillin mutant EcAmox20. It showed a 1-bp deletion at position 652,049 in the intergenic region between citC and dpiB genes. In fact, the mutation was located 193 bp upstream of the citC translational start codon, corresponding to the DpiA binding site (between 190 and 280 bp upstream of the citC translational start codon) [50]. dpiB encodes the sensor histidine kinase DpiB, which, together with the response regulator DpiA, forms the DpiBA two-component signal transduction system. Apart from regulating the citrate metabolism in the cell, DpiBA also activates the SOS response to β-lactams antibiotics in E. coli [50]. More specifically, the overexpression of DpiA results in the interruption of DNA replication and in the activation of SOS response, inhibiting cell division while the cell is repairing DNA damage [51]. Therefore, the genetic modification we found in the DpiA binding site of EcAmox20 could cause the overexpression of DpiA and consequently lead to increased resistance to amoxicillin and to COLIFIT and cinnamaldehyde, as they also cause DNA damage by generating ROS [46].
Regarding SeWT and its RVs SeAmox10, SeAmox10, SeCol10, and SeCol20, a total of 9.2, 8.8, 9.1, 9.5, and 10.5 million 150-bp reads were respectively obtained. After quality control analysis, we observed that 88.28%, 86.47%, 89.09%, 87.10%, and 90.04% of those reads were above Q30. We then mapped out those filtered paired-end reads to the reference genome sequence (Salmonella enterica subsp. enterica serovar Typhimurium LT2 (NCBI accession: NC_003197.2)) at 98.35%, 98.05%, 98.33%, 98.01%, and 98.44%, respectively. The detection of genetic variations among strains was possible because the reference genome was sufficiently covered and because a 150-fold coverage depth was achieved for all strains.
We identified genetic variations between the reference genome and SeWT in order to exclude them as potential causes of resistance in RVs, similar to the approach we had adopted in EcWT. After discarding those mutations, we conducted a genomic comparison between SeWT and its RVs (Figure 3) to pinpoint genetic variations and the corresponding genes responsible for antimicrobial resistance. Table 6 presents a comprehensive overview of all the genetic variations observed between SeWT and its RVs.
Two genetic modifications were identified in fepA and nirC of all RVs:
(a) An insertion of 6 bp was detected at position 107 bp of fepA. This gene encodes the outer-membrane porin FepA, responsible for the uptake of ferric enterobactin and colicins B and D. However, this genetic modification was discarded as it did not affect any codifying or transcriptional region.
(b) A transition from thymine (T) to cytosine (C) was detected at position 215 bp of the nirC gene, modifying the translation from valine (Val) to alanine (Ala). This gene encodes the membrane transport protein NirC, responsible for mediating the passage of the nitrite (NO2−) and nitrate (NO3−) anions across the cytoplasmic membrane [52]. Certain studies have identified the same mutation in nirC after exposing S. enterica LT2 to subinhibitory doses of carvacrol for 10 days (Pagán et al., unpublished results) or 20 days [15]. However, Pagán et al. (unpublished results) assessed the contribution of this genetic modification to the phenotype of the RVs and concluded that this mutation was not responsible for the increased resistance observed against carvacrol, antibiotics, or heat.
In the behavior of amoxicillin RVs, no differences were observed between SeAmox10 and SeAmox20. Apart from fepA and nirC mutations, an SNV was detected in the ftsI gene, leading to the substitution of glutamine (Gln) by leucine (Leu) at position 663 aa. This gene encodes the protein FtsI, which is essential for cell division since it is involved in septum formation [53]. More specifically, FtsI (also called penicillin-binding protein 3 (PBP3)) is known to be the main target for β-lactams antibiotics. It has been observed that genetic modifications in PBPs may result in increased resistance to β-lactams either by reducing the binding of antibiotics to the target site or by developing β-lactamase activity that ends in antibiotic degradation [54]. In fact, Sun et al. [54] identified several mutations in the ftsI gene of certain penicillin-G-resistant strains. The SNV observed in SeAmox10 and SeAmox20 would therefore be responsible for amoxicillin resistance.
Apart from the genetic modifications of fepA and nirC, colistin RVs shared an SNV at position 274 bp of the basS gene (also called pmrB), causing the substitution of threonine (Thr) by proline (Pro). This gene encodes the sensor kinase BasS, which, together with the response regulator BasR, forms the two-component system (TCS) BasSR. Colistin resistance in S. enterica is mediated via the activation of the TCS BasSR either by environmental signals or genetic modifications in the TCS encoding genes [55]. More specifically, the activation of BasSR enables the yjdB gene product, the first gene of the operon, to catalyze the addition of phosphoethanolamine (pEtN) to lipid A, the hydrophobic group of lipopolysaccharides (LPS) in the cell envelope. When the TCS BasSR is not activated, colistin interacts with lipid A and disrupts the cell envelope, resulting in cell death. However, when the TCS BasSR is activated, the yjdB gene catalyzes the covalent modification, the net negative charge of lipid A is neutralized, and colistin cannot interact [56,57]. Sun et al. [58] determined that missense mutations in basS and basR genes conferred resistance to colistin in S. Typhimurium.
The only genetic difference between SeCol10 and SeCol20 was an SNV detected in the lipA gene of SeCol10 and in the yciM gene of SeCol20. Both genes are directly or indirectly involved in the biosynthesis of lipid A. More specifically, the lipA gene encodes the LipA protein, which is involved in lipid A biosynthesis along with LpxA, LpxC, and LpxD [59]. The yciM gene encodes the YciM protein, which modulates cellular lipopolysaccharide LPS levels by regulating LpxC, the rate-limiting enzyme of lipid A biosynthesis [60]. It has been reported that genetic modifications in the encoding genes LipA, LpxA, LpxC, and LpxD may lead to incomplete formation of bacterial LPS [59] and that overexpression of YciM leads to a decrease in LPS level [61], thus, consequently, to a decrease in lipid A level. In this sense, the genetic modifications we identified in the basS, lipA, and yciM genes of the colistin RVs could alter the attachment of colistin to the cell, leading to an increase in bacterial resistance against it.

3. Materials and Methods

3.1. Antimicrobial Compounds and Chemical Analysis

The antimicrobial compounds used in this study were the following: two antibiotics, amoxicillin and colistin sulfate (Sigma-Aldrich, Steinheim, Westphalia, Germany); two commercial EOs used in animal feed, AEN® and COLIFIT®, which were provided by Phytosynthese (Mozac, France); and two of their principal ICs, thymol and cinnamaldehyde (Sigma-Aldrich). Commercial EOs are clear mixtures of known EOs obtained by steam distillation and conform to EU Feed Additive Regulation 1831/2003. Once received, they were kept in the dark under cooling conditions until use.
In order to determine the chemical composition of AEN and COLIFIT, we analyzed these two commercial EOs using an Agilent 8890 gas chromatograph (GC) equipped with a single quadrupole 5977B mass spectrometer (Santa Clara, CA, USA) and a PAL RTC120 autosampler (CTC Analytics AG, Zwingen, Switzerland).
Samples were diluted in n-hexane (1:50 ratio) and injected (1 µL) in split mode (1:200 ratio). The injector temperature was set at 280 °C. For purposes of chromatographic separation, we used an HP-5 capillary column (30 m × 250 µm internal diameter × 0.2 µm film thickness), and we chose helium as gas carrier at flow rate of 1 mL/min. Oven was programmed as follows: 5 min at 60 °C, then raised to 220 °C at 4 °C/min, then to 280 °C at 11 °C/min and held for 15 min, and finally to 300 °C at 15 °C/min and held for 0.5 min; the run time was thus about 67 min. Transfer line temperature was 280 °C, and the temperatures of the ionization source and the mass analyzer were set at 230 and 150 °C, respectively. Samples were ionized by using an electron ionization source (EI). Spectra acquisition was carried out in SCAN mode (29–400 m/z).
We analyzed the chromatogram using MSD ChemStation software (Agilent, Version G1701DA D.01.00); for data analysis, we used the NIST Mass Spectral Search Program for the NIST/EPA/NIH EI and NIST Tandem Mass Spectral Library v. 2.3. Sample components were identified by combining the temperature-programmed retention indices (RIs) and mass spectra confronted with those of ADAMS [23], NIST 17 [24], and FFNSC2 libraries [25]. RI was calculated using a mix of n-alkanes (C8–C30, Supelco, Bellefonte, CA, USA) according to the Van den Dool and Kratz formula [22].

3.2. Microorganisms and Growth Conditions

The strains used in this study were Escherichia coli str. K-12 substr. MG1655, provided by the American Type Culture Collection (ATCC 700926), and Salmonella enterica subsp. enterica serovar Typhimurium LT2, provided by the Spanish Type Culture Collection (CECT 722).
These strains were kept in cryovials with glycerol (20% v/v) at −80 °C, from which plates of cation-adjusted Mueller-Hinton Agar (MHA) (Sigma-Aldrich) were prepared weekly. To obtain bacterial cultures, test tubes containing 5 mL of cation-adjusted Mueller-Hinton Broth (MHB) (Sigma-Aldrich) were inoculated with one single colony and incubated under aerobic conditions for 12 h at 37 °C (Incubig, Selecta, Barcelona, Spain) and 130 rpm (Heidolph Vibramax 100, Schwaback, Germany). After the incubation time, flasks containing 10 mL of MHB were inoculated with 10 µL of the bacterial subculture to obtain an initial concentration of ~106 colony-forming units per mL (CFU/mL) and then incubated under the same conditions for 24 h to obtain a stationary-phase culture (5 × 10⁹ CFU/mL). The same protocol was used for obtaining the bacterial cultures of the strains isolated from evolution assays.

3.3. Minimum Inhibitory Concentration (MIC) and Minimum Bactericidal Concentration (MCB)

The minimum inhibitory concentration (MIC) is defined as the lowest concentration of an antimicrobial compound that is able to inhibit bacterial growth under determined conditions [62], which vary depending on the antimicrobial compound used.
To determine the MIC values of the antibiotics, we followed the broth microdilution method for antimicrobial susceptibility tests as established by the Clinical and Laboratory Standards Institute (CLSI) [63]. To achieve this, we added increasing concentrations of amoxicillin (0.5–32 µg/mL) and colistin (from 0.125 µg/mL to 8 µg/mL) to 96-well microtiter plates with 100 µL of MHB in each well.
To determine the MIC values of the commercial EOs and the ICs, we adopted the methodology widely agreed upon in previous studies [9,10,11]. We added increasing concentrations of AEN, COLIFIT, thymol, and cinnamaldehyde (50–500 µL/L with 50 µL/L intervals) to test tubes with 5 mL of MHB. Since EOs have low solubility in aqueous buffers, it was necessary to include a vigorous shaking step (Ika vortex 3, Genius, Königswinter, Germany) in order to obtain a homogeneous antimicrobial suspension [64].
In the two methods, each well or test tube was inoculated with E. coli MG1655 or S. Typhimurium LT2 stationary-phase culture, respectively, at an initial concentration of 5 × 10⁵ CFU/mL and incubated for 24 h at 37 °C under static conditions, in the case of microtiter plates, or at 130 rpm, in the case of test tubes. Positive controls (inoculated at 5 × 10⁵ CFU/mL without any antimicrobial compound) and negative controls (inoculated with the highest concentration of the antimicrobial compound in the absence of bacterial inoculum) were also included in each experiment. After the incubation time, we determined optical density at 595 nm (OD595) (Genios, Tecan, Männedorf, Switzerland) in order to obtain an objective measurement of bacterial growth and thus be capable of determining which concentration was capable of inhibiting the respective bacterium’s growth. “Bacterial growth”, as such, was noted as the point in time when the OD595 was ≥10% of the OD595 of the positive control.
The minimum bactericidal concentration (MBC) is defined as the lowest concentration of an antimicrobial compound that is able to inactivate ≥99.9% of the initial bacterial concentration [62]. MBC determination was carried out in parallel to MIC determination. After the incubation of the test tubes, 100 µL of each one was spread out on MHA plates and incubated for 24 h at 37 °C. After the incubation time, colonies were counted, and CMB was determined. As in MIC determination, positive and negative controls were included.

3.4. Mutagenesis Frequency

We determined the mutagenesis frequency of each antimicrobial compound by calculating the rate of rifampicin-resistant mutants due to point mutation in the rpoB gene [65]. Overnight culture of E. coli MG1655 or S. Typhimurium LT2 was diluted 1:10,000 into flasks of 250 mL containing 50 mL of tryptone soya broth with 0.6% of yeast extract (Sigma-Aldrich, Germany; TSBYE) and incubated at 37 °C and 130 rpm for 3.5 h. The culture was then diluted 1:3 in flasks of 125 mL containing 25 mL of TSBYE with 0.5 × MIC of each antimicrobial compound and incubated at 37 °C and 130 rpm for 24 h. In order to obtain detectable and comparable mutant frequencies, we prepared three flasks (three replicates) for each antimicrobial compound. Subsequently, aliquots of the culture were serially diluted in phosphate-buffered saline (Sigma-Aldrich, Germany; PBS) and pour-plated on tryptone soya agar with 0.6% of yeast extract (Sigma-Aldrich, Germany; TSAYE) in the presence and absence of 100 mg/L rifampicin (Sigma-Aldrich, Steinheim, Westphalia, Germany). Plates were incubated at 37 °C for 24 h, and colonies were counted. Mutation rates were calculated by dividing the number of colonies in rifampicin plates (mutation events) by the number of colonies in plates without antibiotic [66].

3.5. Evolution Assays

The protocol we applied to obtain resistant E. coli MG1655 and S. Typhimurium LT2 strains was based on cycles of prolonged exposure to subinhibitory concentrations (0.5 × MIC) of the different antimicrobial compounds during bacterial growth. This protocol was adapted from Kohanski et al. [39] and Andersson and Hughes [67]. A single colony of E. coli MG1655 wild-type strain (EcWT) or S. Typhimurium LT2 wild-type strain (SeWT) was inoculated in 5 mL of MHB and incubated for 12 h at 37 °C and 130 rpm. This preculture was diluted 1:1000 into 10 mL of MHB and incubated for 3.5 h at 37 °C and 130 rpm in order to obtain an exponential phase culture. From that culture, test tubes with 5 mL of MHB and a subinhibitory concentration of each specific antimicrobial compound (0.5 × MIC) were inoculated at an initial concentration of 106 CFU/mL and incubated for 24 h at 37 °C and 130 rpm. After that, the culture was diluted (106 CFU/mL) in test tubes containing 5 mL of MHB and a subinhibitory concentration of each specific antimicrobial compound and incubated for 24 h at 37 °C and 130 rpm. This procedure was repeated 20 times. After the 10th and 20th cycles, an aliquot of the bacterial culture was diluted in PBS and spread on MHA plates (without AEN or COLIFIT). After the incubation, we randomly selected five colonies to assess the emergence of RVs, after which we performed further phenotypic and genotypic characterization of the RVs.

3.6. Phenotypic Characterization of Evolved Strains

Our phenotypic characterization relied on the determination of the MIC values of the different antimicrobial compounds against the evolved strains (i.e., strains selected after the evolution assays) and their subsequent comparison to the MIC values against the wild-type strains. This procedure allowed us to assess both direct and cross-resistance of the evolved strains against the antimicrobial compounds under study.

3.7. Genotypic Characterization

Genomic DNA (gDNA) of EcWT, SeWT, and RVs was extracted using a gDNA kit (DNeasy kit, Qiagen, Hilden, Germany). Illumina technology (NovaSeq 6000) was used to carry out whole-genome sequencing (WGS) of the different strains (Novogene, Cambridge, UK). After quality control analysis, we used the Burrows-Wheeler Alignment Tool (BWA) [68] to map the paired-end reads to the reference genomes: Escherichia coli str. K-12 substr. MG1655 (National Center for Biotechnology Information; NCBI accession: 511145) and Salmonella enterica subsp. enterica serovar Typhimurium LT2 (National Center for Biotechnology Information; NCBI accession: 99287) and to generate the BAM files. We then ran SAMtools software [69] to sort the BAM files and remove duplication reads, and we ran Picard software (Picard, version 2.18.9-2, http://broadinstitute.github.io/picard/) to merge BAM files of the same sample. Single nucleotide polymorphisms (SNPs) and short (≤50 bp) insertions and deletions (InDels) were detected using SAMtools software (SAMtools, version 1.8). Structural variants (SVs) (>50 bp) were detected using BreakDancer software (BreakDancer, version 1.4.4) [70]. Finally, ANNOVAR software (ANNOVAR, version 2015Mar22) [71] was used for the annotation step. Although mapping was carried out against the reference genome, SNPs, InDels, and SVs were identified between parental and RV strains to ascertain the kind of mutations that had occurred during the evolution treatments. Finally, we designed specific primers (Table S1) with the NCBI Primer Designing Tool to carry out PCR amplifications, as well as Sanger sequencings to verify the mutations detected by WGS. Sanger sequencing reads were aligned and compared using Bioedit software (Bioedit, version 7.2.5.0) (http://www.mbio.ncsu.edu/BioEdit/bioedit.html). The resulting genome sequences were deposited in the Sequence Read Archive (SRA) of NCBI (BioProject ID: PRJNA1017393). The accession numbers of the samples are SAMN37394921 (EcWT), SAMN37394922 (EcAEN10), SAMN37394923 (EcAEN20), SAMN37394924 (EcCOLIFIT10), SAMN37394925 (EcCOLIFIT20), SAMN37394926 (EcAmox20), SAMN37394927 (SeWT), SAMN37394928 (SeAmox10), SAMN37394929 (SeAmox20), SAMN37394930 (SeCol10), and SAMN37394931 (SeCol20).

3.8. Statistical Analysis

All results were obtained from at least three independent experiments carried out on different working days with different bacterial cultures. Mutagenesis frequency graphics are displayed as the mean ± standard deviation, using Prism software (GraphPad, version 4.03, San Diego, CA, USA). Data were analyzed and submitted to comparison of averages using analysis of variance (ANOVA) followed by post hoc Tukey test with Prism software, and differences were considered significant if p ≤ 0.05.

4. Conclusions

This study demonstrated that, unlike antibiotics, evolution assays with AEN and COLIFIT do not induce a relevant increase in the bacterial resistance of RVs despite the use of the same protocol. These commercial EOs thus offer a safer alternative to antibiotics in combating the emergence and dissemination of antimicrobial resistance within the agri-food system.
Genotypic characterization of the RVs provided insights into the mechanisms of bacterial resistance to the antimicrobial compounds examined in this study. Resistance to AEN and COLIFIT in E. coli appears to be associated with cellular protection against oxidative stress and redirection of energy toward efflux activity.
Regarding resistance to antibiotics, the mutation affecting EcAmox20 may be responsible for activating the SOS response within the cell. This mutation would explain both direct resistance against amoxicillin and cross-resistance against COLIFIT and cinnamaldehyde. In S. Typhimurium, resistance to amoxicillin and colistin seems to be linked to modifications in the antibiotics’ binding sites within the cell.
These findings provide valuable insights into the mechanisms of resistance associated with AEN, COLIFIT, and antibiotics. In-depth knowledge of these mechanisms is vital for the development of targeted approaches to mitigate the emergence and spread of antimicrobial resistance. Although prolonged exposure to EOs did not result in relevant resistance, close monitoring and further research remain crucial in order to ensure the continued effectiveness of EOs as antimicrobial agents against antimicrobial resistance. The utilization of AEN and COLIFIT as antimicrobial alternatives warrants further investigation and consideration.

Supplementary Materials

The following supporting information can be downloaded at https://0-www-mdpi-com.brum.beds.ac.uk/article/10.3390/ph16101443/s1. Table S1: Primers used for PCR amplification and Sanger sequencing to verify the mutations of evolved strains: EcAEN10, EcAEN20, EcCOLIFIT10, EcCOLIFIT20, EcAmox20, SeAmox10, SeAmox20, SeCol10, and SeCol20.

Author Contributions

Conceptualization, methodology, and formal analysis, N.M., C.G., S.K., R.P. and D.G.-G.; investigation, N.M., D.B., E.P. and E.S.; resources, R.P. and D.G.-G.; data curation, D.B.; writing—original draft preparation, N.M., D.B., E.P., E.S., R.P. and D.G.-G.; writing—review and editing, N.M., D.B., E.P., C.G., S.K., E.S., R.P. and D.G.-G.; supervision: R.P. and D.G.-G.; project administration and funding acquisition, C.G., S.K., R.P. and D.G.-G. All authors have read and agreed to the published version of the manuscript.

Funding

This research was supported by Grant PID2021-123404NB-I00 funded by MCIN/AEI/10.13039/501100011033 and by “ERDF A way of making Europe” and by the Government of Aragón (grant Grupo AESA). Department of Science, Technology, and University Education of the Government of Aragón (Spain) provided N. Merino and R. Campillo with grants to carry out this research. Grant FPU17/02441 funded by MCIN/AEI/10.13039/501100011033 and by “ESF Investing in your future” was awarded to E. Pagán to carry out this research.

Institutional Review Board Statement

Not applicable.

Informed Consent Statement

Not applicable.

Data Availability Statement

Data are contained within the article and Supplementary Material.

Acknowledgments

The authors thank S. Hanks for his collaboration on the English-language revision of this manuscript.

Conflicts of Interest

N.M., D.B., E.P., R.P. and D.G.-G. received AEN and COLIFIT products and partial funding from Phytosynthese. C.G. and S.K. are personnel from Phytosynthese. The remaining authors declare that the research was conducted in the absence of any commercial or financial relationships that could be construed as a potential conflict of interest.

References

  1. European Medicines Agency. Sales of Veterinary Antimicrobial Agents in 31 European Countries in 2021. Trends from 2010 to 2021. Twelfth ESVAC Report. 2022. Available online: https://data.europa.eu/doi/10.2809/39517 (accessed on 2 October 2023).
  2. European Food Safety Authority (EFSA); European Centre for Disease Prevention and Control (ECDC). The European Union summary report on antimicrobial resistance in zoonotic and indicator bacteria from humans, animals and food in 2020/2021. EFSA J. 2023, 21, e07867. [Google Scholar] [CrossRef]
  3. Williams-Nguyen, J.; Sallach, J.B.; Bartelt-Hunt, S.; Boxall, A.B.; Durso, L.M.; McLain, J.E.; Singer, R.S.; Snow, D.D.; Zilles, J.L. Antibiotics and antibiotic resistance in agroecosystems: State of the science. J. Environ. Qual. 2016, 45, 394–406. [Google Scholar] [CrossRef] [PubMed]
  4. Faleiro, M.L. The mode of antibacterial action of essential oils. In Science against Microbial Pathogens: Communicating Current Research and Technological Advances; Méndez-Vilas, A., Ed.; Formatex Research Center: Badajoz, Spain, 2011; Volume 2, pp. 1143–1156. [Google Scholar]
  5. Burt, S. Essential oils: Their antibacterial properties and potential applications in foods—A review. Int. J. Food Microbiol. 2004, 94, 223–253. [Google Scholar] [CrossRef]
  6. Stevanović, Z.D.; Bošnjak-Neumüller, J.; Pajić-Lijaković, I.; Raj, J.; Vasiljević, M. Essential oils as feed additives-future perspectives. Molecules 2018, 23, 1717. [Google Scholar] [CrossRef]
  7. Mittal, R.P.; Rana, A.; Jaitak, V. Essential oils: An impending substitute of synthetic antimicrobial agents to overcome antimicrobial resistance. Curr. Drug Targets 2019, 20, 605–624. [Google Scholar] [CrossRef]
  8. Yap, P.S.; Yiap, B.C.; Ping, H.C.; Lim, S.H. Essential oils, a new horizon in combating bacterial antibiotic resistance. Open Microbiol. J. 2014, 8, 6–14. [Google Scholar] [CrossRef]
  9. Berdejo, D.; Pagán, E.; Merino, N.; Pagán, R.; García-Gonzalo, D. Incubation with a complex orange essential oil leads to evolved mutants with increased resistance and tolerance. Pharmaceuticals 2020, 13, 239. [Google Scholar] [CrossRef]
  10. Berdejo, D.; Pagán, E.; Merino, N.; García-Gonzalo, D.; Pagán, R. Emerging mutant populations of Listeria monocytogenes EGD-e under selective pressure of Thymbra capitata essential oil question its use in food preservation. Food Res. Int. 2021, 145, 110403. [Google Scholar] [CrossRef]
  11. Berdejo, D.; Pagán, E.; Merino, N.; Botello-Morte, L.; Pagán, R.; García-Gonzalo, D. Salmonella enterica serovar Typhimurium genetic variants isolated after lethal treatment with Thymbra capitata essential oil (TCO) showed increased resistance to TCO in milk. Int. J. Food Microbiol. 2021, 360, 109443. [Google Scholar] [CrossRef]
  12. Chueca, B.; Berdejo, D.; Gomes-Neto, N.J.; Pagán, R.; García-Gonzalo, D. Emergence of hyper-resistant Escherichia coli MG1655 derivative strains after applying sub-inhibitory doses of individual constituents of essential oils. Front. Microbiol. 2016, 7, 273. [Google Scholar] [CrossRef]
  13. Chueca, B.; Renzoni, A.; Berdejo, D.; Pagán, R.; Kelley, W.L.; García-Gonzalo, D. Whole-genome sequencing and genetic analysis reveal novel stress responses to individual constituents of essential oils in Escherichia coli. AEM 2018, 84, e02538-17. [Google Scholar] [CrossRef] [PubMed]
  14. Berdejo, D.; Chueca, B.; Pagán, E.; Renzoni, A.; Kelley, W.L.; Pagán, R.; Garcia-Gonzalo, D. Sub-inhibitory doses of individual constituents of essential oils can select for Staphylococcus aureus resistant mutants. Molecules 2019, 24, 170. [Google Scholar] [CrossRef]
  15. Berdejo, D.; Merino, N.; Pagán, E.; García-Gonzalo, D.; Pagán, R. Genetic variants and phenotypic characteristics of Salmonella Typhimurium-resistant mutants after exposure to carvacrol. Microorganisms 2020, 8, 937. [Google Scholar] [CrossRef]
  16. Li, Y.; Tan, B.; Cen, Z.; Fu, Y.; Zhu, X.; He, H.; Kong, D.; Wu, H. The variation in essential oils composition, phenolic acids and flavonoids is correlated with changes in antioxidant activity during Cinnamomum loureirii bark growth. Arab. J. Chem. 2021, 14, 103249. [Google Scholar] [CrossRef]
  17. Valková, V.; Ďúranová, H.; Galovičová, L.; Vukovic, N.L.; Vukic, M.; Kowalczewski, P.Ł.; Kačániová, M. Application of three types of cinnamon essential oils as natural antifungal preservatives in wheat bread. Appl. Sci. 2022, 12, 10888. [Google Scholar] [CrossRef]
  18. Alizadeh Behbahani, B.; Falah, F.; Lavi Arab, F.; Vasiee, M.; Tabatabaee Yazdi, F. Chemical composition and antioxidant, antimicrobial, and antiproliferative activities of Cinnamomum zeylanicum bark essential oil. Evid. Based Complementary Altern. Med. 2020, 2020, 5190603. [Google Scholar] [CrossRef]
  19. Narayanankutty, A.; Kunnath, K.; Alfarhan, A.; Rajagopal, R.; Ramesh, V. Chemical composition of Cinnamomum verum leaf and flower essential oils and analysis of their antibacterial, insecticidal, and larvicidal properties. Molecules 2021, 26, 6303. [Google Scholar] [CrossRef]
  20. Mancini, E.; Senatore, F.; Del Monte, D.; De Martino, L.; Grulova, D.; Scognamiglio, M.; Snoussi, M.; De Feo, V. Studies on chemical composition, antimicrobial and antioxidant activities of five Thymus vulgaris L. essential oils. Molecules 2015, 20, 12016–12028. [Google Scholar] [CrossRef]
  21. Merino, N.; Berdejo, D.; Bento, R.; Salman, H.; Lanz, M.; Maggi, F.; Sánchez-Gómez, S.; García-Gonzalo, D.; Pagán, R. Antimicrobial efficacy of Thymbra capitata (L.) Cav. essential oil loaded in self-assembled zein nanoparticles in combination with heat. Ind. Crop. Prod. 2019, 133, 98–104. [Google Scholar] [CrossRef]
  22. van Den Dool, H.; Kratz, P.D. A generalization of the retention index system including linear temperature programmed gas—Liquid partition chromatography. J. Chromatogr. A 1963, 11, 463–471. [Google Scholar] [CrossRef]
  23. Adams, R. Identification of Essential Oil Components by Gas Chromatography/Quadrupole Mass Spectroscopy; Allured Publishing Corporation: Carol Stream, IL, USA, 2005; pp. 65–120. [Google Scholar]
  24. NIST. Mass Spectral Library (NIST/EPA/NIH); NIST: Gaithersburg, MD, USA, 2017.
  25. Mondello, L. Flavors and Fragrances of Natural and Synthetic Compounds; Wiley: Hoboken, NJ, USA, 2015. [Google Scholar]
  26. Manu, D.; Mendonca, A.F.; Daraba, A.; Dickson, J.S.; Sebranek, J.; Shaw, A.; Wang, F.; White, S. Antimicrobial efficacy of cinnamaldehyde against Escherichia coli O157:H7 and Salmonella enterica in carrot juice and mixed berry juice held at 4 °C and 12 °C. Foodborne Pathog. Dis. 2017, 14, 302–307. [Google Scholar] [CrossRef] [PubMed]
  27. García-Salinas, S.; Elizondo-Castillo, H.; Arruebo, M.; Mendoza, G.; Irusta, S. Evaluation of the antimicrobial activity and cytotoxicity of different components of natural origin present in essential oils. Molecules 2018, 23, 1399. [Google Scholar] [CrossRef]
  28. Devi, K.P.; Nisha, S.A.; Sakthivel, R.; Pandian, S.K. Eugenol (an essential oil of clove) acts as an antibacterial agent against Salmonella typhi by disrupting the cellular membrane. J. Ethnopharmacol. 2010, 130, 107–115. [Google Scholar] [CrossRef] [PubMed]
  29. Engel, J.B.; Heckler, C.; Tondo, E.C.; Daroit, D.J.; da Silva Malheiros, P. Antimicrobial activity of free and liposome-encapsulated thymol and carvacrol against Salmonella and Staphylococcus aureus adhered to stainless steel. Int. J. Food Microbiol. 2017, 252, 18–23. [Google Scholar] [CrossRef]
  30. Sepahvand, S.; Amiri, S.; Radi, M.; Akhavan, H.-R. Antimicrobial activity of thymol and thymol-nanoemulsion against three food-borne pathogens inoculated in a sausage model. Food Bioprocess Technol. 2021, 14, 1936–1945. [Google Scholar] [CrossRef]
  31. Jianu, C.; Pop, G.; Lukinich-Gruia, A.; Horhat, F. Chemical composition and antimicrobial activity of essential oils of lavender (Lavandula angustifolia) and lavandin (Lavandula x intermedia) grown in western Romania. Int. J. Agric. Biol. 2013, 15, 772–776. [Google Scholar]
  32. EUCAST. MIC and Zone Diameter Distributions and ECOFFs. Available online: http://www.eucast.org (accessed on 13 January 2023).
  33. Ait-Ouazzou, A.; Cherrat, L.; Espina, L.; Lorán, S.; Rota, C. The antimicrobial activity of hydrophobic essential oil constituents acting alone or in combined processes of food preservation. Innov. Food Sci. Emerg. Technol. 2011, 12, 320–329. [Google Scholar] [CrossRef]
  34. Dafale, N.A.; Semwal, U.P.; Rajput, R.K.; Singh, G.N. Selection of appropriate analytical tools to determine the potency and bioactivity of antibiotics and antibiotic resistance. J. Pharm. Anal. 2016, 6, 207–213. [Google Scholar] [CrossRef]
  35. Thi, T.D.; López, E.; Rodríguez-Rojas, A.; Rodríguez-Beltrán, J.; Couce, A.; Guelfo, J.R.; Castañeda-García, A.; Blázquez, J. Effect of recA inactivation on mutagenesis of Escherichia coli exposed to sublethal concentrations of antimicrobials. J. Antimicrob. Chemother. 2011, 66, 531–538. [Google Scholar] [CrossRef]
  36. Jara, L.M.; Cortés, P.; Bou, G.; Barbé, J.; Aranda, J. Differential roles of antimicrobials in the acquisition of drug resistance through activation of the SOS response in Acinetobacter baumannii. Antimicrob. Agents Chemother. 2015, 59, 4318–4320. [Google Scholar] [CrossRef]
  37. Tzeng, Y.L.; Berman, Z.; Toh, E.; Bazan, J.A.; Turner, A.N.; Retchless, A.C.; Wang, X.; Nelson, D.E.; Stephens, D.S. Heteroresistance to the model antimicrobial peptide polymyxin B in the emerging Neisseria meningitidis lineage 11.2 urethritis clade: Mutations in the pilMNOPQ operon. Mol. Microbiol. 2019, 111, 254–268. [Google Scholar] [CrossRef] [PubMed]
  38. Rodríguez-Rojas, A.; Makarova, O.; Müller, U.; Rolff, J. Cationic peptides facilitate iron-induced mutagenesis in bacteria. PLoS Genet. 2015, 11, e1005546. [Google Scholar] [CrossRef] [PubMed]
  39. Kohanski, M.A.; DePristo, M.A.; Collins, J.J. Sublethal antibiotic treatment leads to multidrug resistance via radical-induced mutagenesis. Mol. Cell 2010, 37, 311–320. [Google Scholar] [CrossRef] [PubMed]
  40. Hriouech, S.; Akhmouch, A.A.; Tanghort, M.; Chefchaou, H.; Mzabi, A.; Chami, N.; Remmal, A. In vitro and in vivo comparison of changes in antibiotics susceptibility of E. coli and chicken’s intestinal flora after exposure to amoxicillin or thymol. Vet. Med. Int. 2020, 2020, 8824008. [Google Scholar] [CrossRef]
  41. Lee, C.; Kim, I.; Lee, J.; Lee, K.L.; Min, B.; Park, C. Transcriptional activation of the aldehyde reductase YqhD by YqhC and its implication in glyoxal metabolism of Escherichia coli K-12. J. Bacteriol. 2010, 192, 4205–4214. [Google Scholar] [CrossRef]
  42. Pérez, J.M.; Arenas, F.A.; Pradenas, G.A.; Sandoval, J.M.; Vásquez, C.C. Escherichia coli YqhD exhibits aldehyde reductase activity and protects from the harmful effect of lipid peroxidation-derived aldehydes. J. Biol. Chem. 2008, 283, 7346–7353. [Google Scholar] [CrossRef]
  43. Merchel Piovesan Pereira, B.; Adil Salim, M.; Rai, N.; Tagkopoulos, I. Tolerance to glutaraldehyde in Escherichia coli mediated by overexpression of the aldehyde reductase YqhD by YqhC. Front. Microbiol. 2021, 12, 680553. [Google Scholar] [CrossRef]
  44. Visvalingam, J.; Hernandez-Doria, J.D.; Holley, R.A. Examination of the genome-wide transcriptional response of Escherichia coli O157:H7 to cinnamaldehyde exposure. AEM 2013, 79, 942–950. [Google Scholar] [CrossRef]
  45. Yuan, W.; Seng, Z.J.; Kohli, G.S.; Yang, L.; Yuk, H.-G. Stress resistance development and genome-wide transcriptional response of Escherichia coli O157: H7 adapted to sublethal thymol, carvacrol, and trans-cinnamaldehyde. AEM 2018, 84, 01616–01618. [Google Scholar] [CrossRef]
  46. Chueca, B.; Pagán, R.; García-Gonzalo, D. Oxygenated monoterpenes citral and carvacrol cause oxidative damage in Escherichia coli without the involvement of tricarboxylic acid cycle and Fenton reaction. Int. J. Food Microbiol. 2014, 189, 126–131. [Google Scholar] [CrossRef]
  47. Lyu, Z.; Yang, A.; Villanueva, P.; Singh, A.; Ling, J. Heterogeneous flagellar expression in single Salmonella cells promotes diversity in antibiotic tolerance. mBio 2021, 12, 02374-21. [Google Scholar] [CrossRef] [PubMed]
  48. Tirumalai, M.R.; Karouia, F.; Tran, Q.; Stepanov, V.G.; Bruce, R.J.; Ott, C.M.; Pierson, D.L.; Fox, G.E. Evaluation of acquired antibiotic resistance in Escherichia coli exposed to long-term low-shear modeled microgravity and background antibiotic exposure. mBio 2019, 10, 02637-18. [Google Scholar] [CrossRef] [PubMed]
  49. Forbes, S.; Morgan, N.; Humphreys, G.J.; Amézquita, A.; Mistry, H.; McBain, A.J. Loss of function in Escherichia coli exposed to environmentally relevant concentrations of benzalkonium chloride. AEM 2019, 85, 02417–02418. [Google Scholar] [CrossRef]
  50. Scheu, P.D.; Witan, J.; Rauschmeier, M.; Graf, S.; Liao, Y.F.; Ebert-Jung, A.; Basché, T.; Erker, W.; Unden, G. CitA/CitB two-component system regulating citrate fermentation in Escherichia coli and its relation to the DcuS/DcuR system in vivo. J. Bacteriol. 2012, 194, 636–645. [Google Scholar] [CrossRef] [PubMed]
  51. Miller, C.; Ingmer, H.; Thomsen, L.E.; Skarstad, K.; Cohen, S.N. DpiA binding to the replication origin of Escherichia coli plasmids and chromosomes destabilizes plasmid inheritance and induces the bacterial SOS response. J. Bacteriol. 2003, 185, 6025–6031. [Google Scholar] [CrossRef]
  52. Rycovska-Blume, A.; Lü, W.; Andrade, S.; Fendler, K.; Einsle, O. Structural and functional studies of NirC from Salmonella typhimurium. Methods Enzymol. 2015, 556, 475–497. [Google Scholar] [CrossRef]
  53. Adamowicz, E.M.; Muza, M.; Chacón, J.M.; Harcombe, W.R. Cross-feeding modulates the rate and mechanism of antibiotic resistance evolution in a model microbial community of Escherichia coli and Salmonella enterica. PLoS Pathog. 2020, 16, e1008700. [Google Scholar] [CrossRef]
  54. Sun, S.; Selmer, M.; Andersson, D.I. Resistance to β-lactam antibiotics conferred by point mutations in penicillin-binding proteins PBP3, PBP4 and PBP6 in Salmonella enterica. PLoS ONE 2014, 9, e97202. [Google Scholar] [CrossRef]
  55. Olaitan, A.O.; Morand, S.; Rolain, J.-M. Mechanisms of polymyxin resistance: Acquired and intrinsic resistance in bacteria. Front. Microbiol. 2014, 5, 643. [Google Scholar] [CrossRef]
  56. Lee, H.; Hsu, F.F.; Turk, J.; Groisman, E.A. The PmrA-regulated pmrC gene mediates phosphoethanolamine modification of lipid A and polymyxin resistance in Salmonella enterica. J. Bacteriol. 2004, 186, 4124–4133. [Google Scholar] [CrossRef]
  57. Zhou, Z.; Ribeiro, A.A.; Lin, S.; Cotter, R.J.; Miller, S.I.; Raetz, C.R. Lipid A modifications in polymyxin-resistant Salmonella typhimurium: PMRA-dependent 4-amino-4-deoxy-L-arabinose, and phosphoethanolamine incorporation. J. Biol. Chem. 2001, 276, 43111–43121. [Google Scholar] [CrossRef] [PubMed]
  58. Sun, S.; Negrea, A.; Rhen, M.; Andersson, D.I. Genetic analysis of colistin resistance in Salmonella enterica serovar Typhimurium. Antimicrob. Agents Chemother. 2009, 53, 2298–2305. [Google Scholar] [CrossRef] [PubMed]
  59. Ghasemian, A.; Shafiei, M.; Hasanvand, F.; Shokouhi Mostafavi, S.K. Carbapenem and colistin resistance in Enterobacteriaceae: Worldwide spread and future perspectives. Rev. Med. Microbiol. 2018, 29, 173–176. [Google Scholar] [CrossRef]
  60. Mahalakshmi, S.; Sunayana, M.R.; SaiSree, L.; Reddy, M. yciM is an essential gene required for regulation of lipopolysaccharide synthesis in Escherichia coli. Mol. Microbiol. 2014, 91, 145–157. [Google Scholar] [CrossRef]
  61. Yan, L.; Dong, H.; Li, H.; Liu, X.; Deng, Z.; Dong, C.; Zhang, Z. Uncovering lipopolysaccharide regulation in bacteria via the critical lipid binding tunnel of YciS/YciM. iScience 2022, 25, 104988. [Google Scholar] [CrossRef]
  62. Lallemand, E.A.; Lacroix, M.Z.; Toutain, P.-L.; Boullier, S.; Ferran, A.A.; Bousquet-Melou, A. In vitro degradation of antimicrobials during use of broth microdilution method can increase the measured minimal inhibitory and minimal bactericidal concentrations. Front. Microbiol. 2016, 7, 2051. [Google Scholar] [CrossRef]
  63. Clinical and Laboratory Standards Institute. Methods for Dilution Antimicrobial Susceptibility Tests for Bacteria That Grow Aerobically, 9th ed.; CLSI Document M07-A9; Clinical and Laboratory Standards Institute: Wayne, PA, USA, 2012; ISBN 1-56238-783-9 (Print), ISBN 1-56238-784-7 (Electronic). [Google Scholar]
  64. Friedman, M.; Henika, P.R.; Mandrell, R.E. Bactericidal activities of plant essential oils and some of their isolated constituents against Campylobacter jejuni, Escherichia coli, Listeria monocytogenes, and Salmonella enterica. J. Food Prot. 2002, 65, 1545–1560. [Google Scholar] [CrossRef] [PubMed]
  65. Gutierrez, A.; Laureti, L.; Crussard, S.; Abida, H.; Rodríguez-Rojas, A.; Blázquez, J.; Baharoglu, Z.; Mazel, D.; Darfeuille, F.; Vogel, J.; et al. β-Lactam antibiotics promote bacterial mutagenesis via an RpoS-mediated reduction in replication fidelity. Nat. Commun. 2013, 4, 1610. [Google Scholar] [CrossRef]
  66. Rosche, W.A.; Foster, P.L. Determining mutation rates in bacterial populations. Methods 2000, 20, 4–17. [Google Scholar] [CrossRef]
  67. Andersson, D.I.; Hughes, D. Microbiological effects of sublethal levels of antibiotics. Nat. Rev. Microbiol. 2014, 12, 465–478. [Google Scholar] [CrossRef]
  68. Li, H.; Durbin, R. Fast and accurate short read alignment with Burrows-Wheeler transform. Bioinformatics 2009, 25, 1754–1760. [Google Scholar] [CrossRef] [PubMed]
  69. Li, H.; Handsaker, B.; Wysoker, A.; Fennell, T.; Ruan, J.; Homer, N.; Marth, G.; Abecasis, G.; Durbin, R. The sequence alignment/map format and SAMtools. Bioinformatics 2009, 25, 2078–2079. [Google Scholar] [CrossRef] [PubMed]
  70. Chen, K.; Wallis, J.W.; McLellan, M.D.; Larson, D.E.; Kalicki, J.M.; Pohl, C.S.; McGrath, S.D.; Wendl, M.C.; Zhang, Q.; Locke, D.P.; et al. BreakDancer: An algorithm for high-resolution mapping of genomic structural variation. Nat. Methods 2009, 6, 677–681. [Google Scholar] [CrossRef] [PubMed]
  71. Wang, K.; Li, M.; Hakonarson, H. ANNOVAR: Functional annotation of genetic variants from high-throughput sequencing data. Nucleic Acids Res. 2010, 38, 164. [Google Scholar] [CrossRef]
Figure 1. (a) Mutation rate in Escherichia coli MG1655 (EcWT); (b) mutation rate in Salmonella enterica subsp. enterica serovar Typhimurium LT2 (SeWT) grown in MHB without (■) and with subinhibitory doses (0.5 × MIC) of AEN (), COLIFIT (), amoxicillin (), and colistin (). Mutagenesis frequency was expressed as the number of rifampicin-resistant cells in the total microbial population. Different letters represent statistically different values (p ≤ 0.05).
Pharmaceuticals 16 01443 g001
Figure 2. Genomic maps of Escherichia coli MG1655 RVs (EcAEN10, EcAEN20, EcCCOLIFIT10, EcCOLIFIT20, EcAmox20).
Pharmaceuticals 16 01443 g002
Figure 3. Genomic maps of Salmonella enterica subsp. enterica serovar Typhimurium LT2 RVs (SeAmox10, SeAmox20, SeCol10, and SeCol20).
Pharmaceuticals 16 01443 g003
Table 1. Chemical composition of AEN and COLIFIT.
AENCOLIFIT
NoComponent aRI bRI Lit c% d%ID e
1α-pinene933932-0.17 ± 0.0Std,RI,MS
2camphene948946-0.03 ± 0.0Std,RI,MS
3benzaldehyde959952-0.05 ± 0.0Std,RI,MS
4α-terpinene10171014-0.03 ± 0.0Std,RI,MS
5p-cymene10251020-1.30 ± 0.0Std,RI,MS
6limonene10291024-0.37 ± 0.0Std,RI,MS
7γ-terpinene10591054-0.72 ± 0.0Std,RI,MS
8diallyl disulphide10781079-0.13 ± 0.0RI,MS
9linalool11011095-0.05 ± 0.0Std,RI,MS
10citronellal11551148-1.98 ± 0.0Std,RI,MS
11terpinen-4-ol11771174-0.06 ± 0.0Std,RI,MS
12(Z)-cinnamaldehyde12191217-0.10 ± 0.0Std,RI,MS
13citronellol12301223-0.18 ± 0.0Std,RI,MS
14neral12421235-1.93 ± 0.0Std,RI,MS
15geraniol12561249-0.90 ± 0.0Std,RI,MS
16(E)-cinnamaldehyde1270126787.12 ± 0.243.93 ± 0.7Std,RI,MS
17geranial12721264-3.12 ± 0.7Std,RI,MS
18thymol12931289-29.83 ± 0.0Std,RI,MS
19carvacrol13021298-10.56 ± 0.1Std,RI,MS
20citronellyl acetate13561350-0.03 ± 0.0RI,MS
21eugenol1358135610.83 ± 0.22.99 ± 0.2 Std,RI,MS
22α-copaene13771374-0.04 ± 0.0Std,RI,MS
23geranyl acetate13861379-0.24 ± 0.0RI,MS
24(E)-caryophyllene142114171.40 ± 0.00.96 ± 0.0Std,RI,MS
25coumarin14351432-0.05 ± 0.0RI,MS
26δ-cadinene15261522-0.09 ± 0.0RI,MS
Total identified 99.35 ± 0.099.83 ± 0.0
Aldehydes -5.10 ± 0.7
Monoterpene hydrocarbons -1.32 ± 0.0
Monoterpenoids -43.54 ± 0.2
Phenylpropanoids 97.9647.02 ± 0.5
Sesquiterpene hydrocarbons 1.401.08 ± 0.0
Others -1.76 ± 0.0
a Components are listed according to their elution from an HP-5MS column. b Linear retention index calculated according to the Van den Dool and Kratz formula [22]. c Retention index from Adams library. d Relative percentage values represent the mean of two independent analyses. e Identification methods: Std, comparison with available analytical standard; RI, coherence of the calculated RI with those stored in the ADAMS [23] and NIST 17 [24] libraries; MS, mass spectrum matching with respect to ADAMS [23], FFNSC [25], and NIST 17 MS libraries.
Table 2. Minimum inhibitory concentration (MIC; μL/L) and minimum bactericidal concentration (MBC; μL/L) of AEN, COLIFIT, amoxicillin, and colistin for Escherichia coli MG1655 (EcWT) and Salmonella enterica subsp. enterica serovar Typhimurium LT2 (SeWT). Each value represents the result of at least 3 different experiments carried out with different bacterial cultures and on different working days.
Bacterial StrainAENCOLIFITAmoxicillinColistin
MICMBCMICMBCMICMBCMICMBC
EcWT2004003504508811
SeWT1503503503501124
Table 3. Minimum inhibitory concentration (MIC; μL/L) of AEN, COLIFIT, amoxicillin, colistin, thymol, and cinnamaldehyde for Escherichia coli MG1655 (EcWT) and RVs: EcAEN10 and EcAEN20 (selected after 10 or 20 cycles with prolonged sublethal doses of AEN); EcCOLIFIT10 and EcCOLIFIT20 (selected after 10 or 20 cycles with prolonged sublethal doses of COLIFIT); EcAmox20 (selected after 20 cycles with prolonged sublethal doses of amoxicillin). Each value represents the result of at least 3 experiments carried out with different bacterial cultures on different working days.
Bacterial StrainAENCOLIFITAmoxicillinColistinThymolCinnamaldehyde
EcWT20035081300200
EcAEN1025040081300250
EcAEN2025045081300250
EcCOLIFIT1025040081300250
EcCOLIFIT2025045081300250
EcAmox20200400161300250
Shading indicates an increase in MIC values.
Table 4. Minimum inhibitory concentration (MIC; μL/L) of AEN, COLIFIT, amoxicillin, colistin, thymol, and cinnamaldehyde for Salmonella enterica subsp. enterica serovar Typhimurium LT2 (SeWT) and RVs: SeAmox10 and SeAmox20 (selected after 10 or 20 cycles with prolonged sublethal doses of amoxicillin); SeCol10 and SeCol20 (selected after 10 or 20 cycles with prolonged sublethal doses of colistin). Each value represents the result of at least 3 experiments carried out with different bacterial cultures on different working days.
Bacterial
Strain
AENCOLIFITAmoxicillinColistinThymolCinnamaldehyde
SeWT15035012250150
SeAmox10ndnd2ndndnd
SeAmox2015035022250150
SeCol10ndndnd8ndnd
SeCol2015025018250150
Shading indicates an increase in MIC values. nd: non-determined.
Table 5. Genetic modifications of Escherichia coli MG1655 RVs strains: EcAEN10 and EcAEN20 (selected after 10 or 20 cycles with prolonged sublethal doses of AEN); EcCOLIFIT10 and EcCOLIFIT20 (selected after 10 or 20 cycles with prolonged sublethal doses of COLIFIT); EcAmox10 and EcAmox20 (selected after 10 or 20 cycles with prolonged sublethal doses of amoxicillin).
StrainGenetic ModificationPositionGene
EcAEN1022-bp deletion3,154,511–3,154,531yqhC
EcAEN205-kb deletion1,973,201–1,978,600cheW, cheA, motB, motA, motR, flhC, flhD
EcCOLIFIT10SNV3,156,163
G809A
Gly270Asp
yqhD
5-kb deletion1,973,663–1,978,501cheA, motB, motA, motR,
flhC, flhD
EcCOLIFIT20SNV3,156,163
G809A
Gly270Asp
yqhD
5-kb deletion1,973,663–1,978,501cheA, motB, motA, motR, flhC, flhD
EcAmox20Deletion652,049Intergenic region
(DpiA binding site)
Table 6. Genetic modifications of Salmonella enterica subsp. enterica serovar Typhimurium LT2 RVs strains: SeAmox10 and SeAmox20 (selected after 10 or 20 cycles with prolonged sublethal doses of amoxicillin); SeCol10 and SeCol20 (selected after 10 or 20 cycles with prolonged sublethal doses of colistin).
StrainGenetic ModificationPositionGene
SeAmox10SNV
A1988T
Gln663Leu
143,332ftsI
Insertion 107643,920fepA
SNV
T215C
Val72Ala
3,626,869nirC
SeAmox20SNV
A1988T
Gln663Leu
143,332ftsI
Insertion 107643,920fepA
SNV
T215C
Val72Ala
3,626,869nirC
SeCol10Insertion 107643,922fepA
SNV
A499C
Thr167Pro
695,332lipA
SNV
T215C
Val72Ala
3,626,869nirC
SNV
A274C
Thr92Pro
4,533,452basS
SeCol20Insertion 107643,922fepA
SNV
T128G
Val43Gly
1,802,551yciM
SNV
T215C
Val72Ala
3,626,869nirC
SNV
A274C
Thr92Pro
4.533.452basS
Disclaimer/Publisher’s Note: The statements, opinions and data contained in all publications are solely those of the individual author(s) and contributor(s) and not of MDPI and/or the editor(s). MDPI and/or the editor(s) disclaim responsibility for any injury to people or property resulting from any ideas, methods, instructions or products referred to in the content.

