Differences of Rainfall–Malaria Associations in Lowland and Highland in Western Kenya

 , ,
, , 
Abstract
:1. Introduction
2. Methods
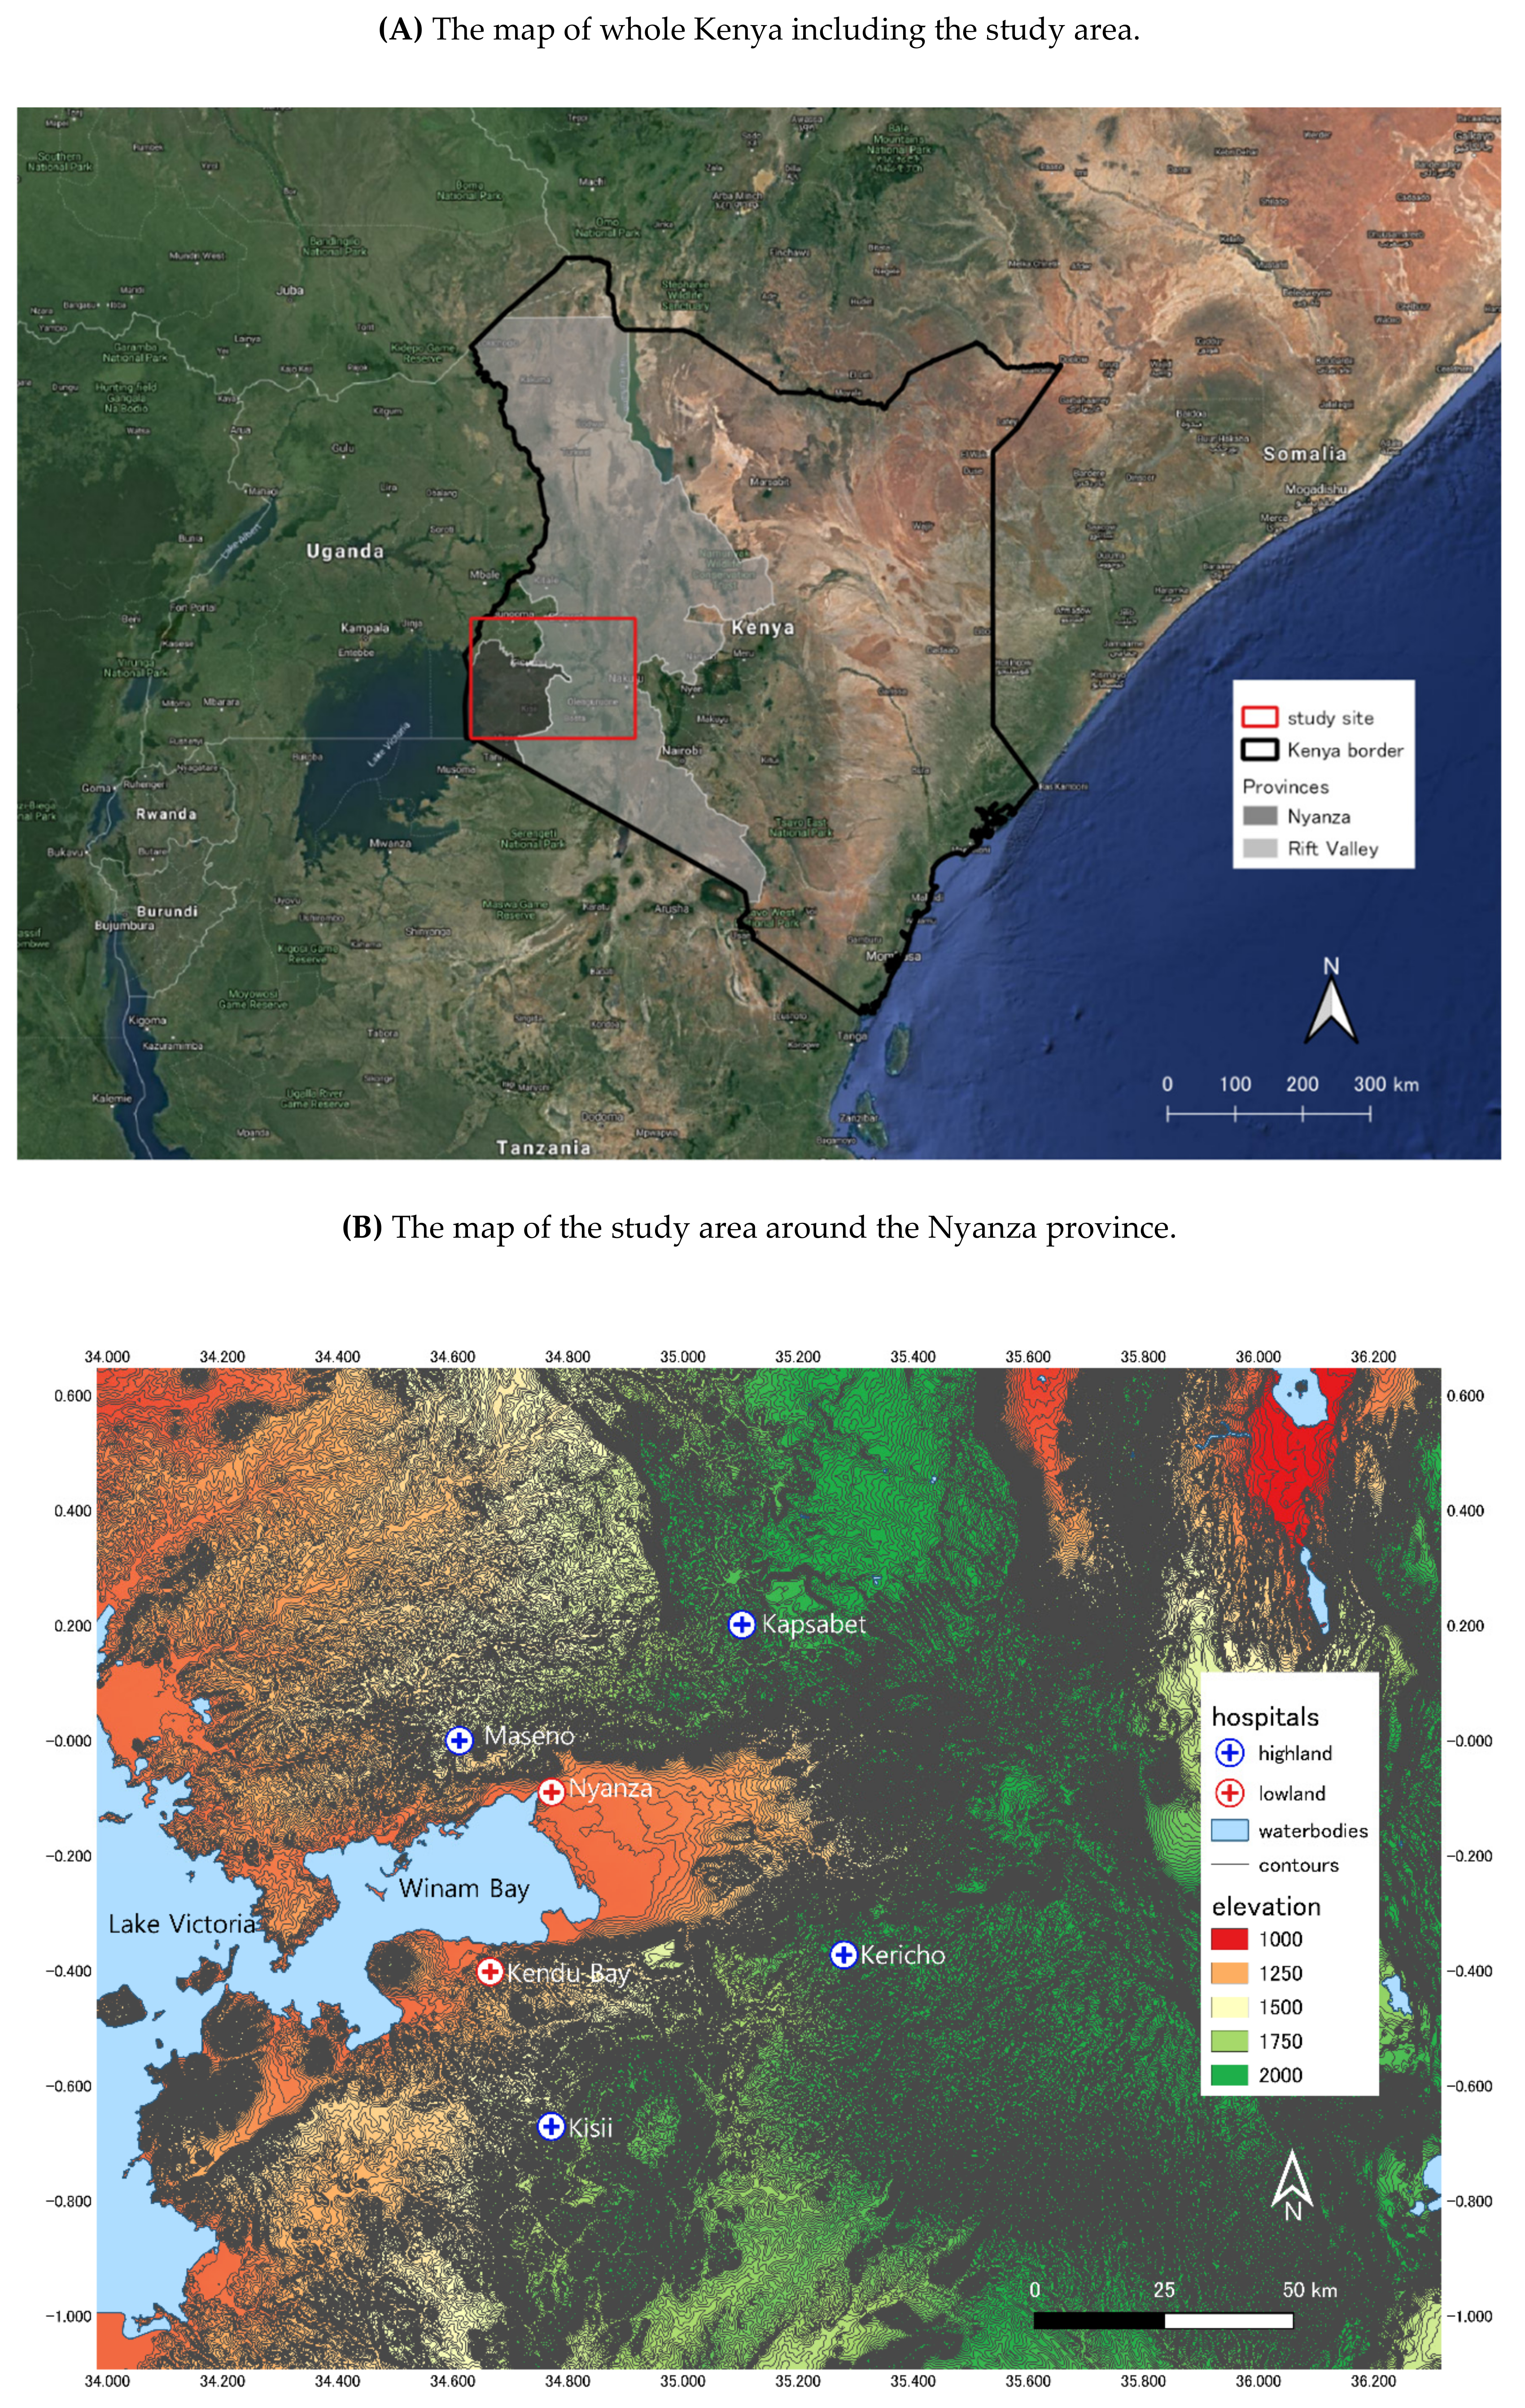
2.1. Study Area
2.2. Case Data
2.3. Environmental Data
2.4. Statistical Analysis
3. Results
4. Discussion
5. Conclusions
Supplementary Materials
Author Contributions
Funding
Acknowledgments
Conflicts of Interest
References
- World Health Organization. WHO Update, World Malaria Report 2018. Available online: https://www.who.int/malaria/publications/world-malaria-report-2018/report/en/ (accessed on 10 September 2019).
- Lindsay, S.W.; Martens, W.J. Malaria in the African highlands: Past, present and future. Bull. World Health Organ. 1998, 76, 33–45. [Google Scholar] [PubMed]
- Sewe, M.O.; Ahlm, C.; Rocklov, J. Remotely Sensed Environmental Conditions and Malaria Mortality in Three Malaria Endemic Regions in Western Kenya. PLoS ONE 2016, 11, e0154204. [Google Scholar] [CrossRef] [PubMed]
- Himeidan, Y.E.; Kweka, E.J. Malaria in East African highlands during the past 30 years: Impact of environmental changes. Front. Physiol. 2012, 3, 315. [Google Scholar] [CrossRef] [PubMed]
- Shanks, G.D.; Hay, S.I.; Omumbo, J.A.; Snow, R.W. Malaria in Kenya’s western highlands. Emerg. Infect. Dis. 2005, 11, 1425–1432. [Google Scholar] [CrossRef] [PubMed]
- Mutuku, F.M.; Bayoh, M.N.; Hightower, A.W.; Vulule, J.M.; Gimnig, J.E.; Mueke, J.M.; Amimo, F.A.; Walker, E.D. A supervised land cover classification of a western Kenya lowland endemic for human malaria: Associations of land cover with larval Anopheles habitats. Int. J. Health Geogr. 2009, 8, 19. [Google Scholar] [CrossRef] [PubMed]
- Colon-Gonzalez, F.J.; Tompkins, A.M.; Biondi, R.; Bizimana, J.P.; Namanya, D.B. Assessing the effects of air temperature and rainfall on malaria incidence: An epidemiological study across Rwanda and Uganda. Geospat. Health 2016, 11 (Suppl. 1), 379. [Google Scholar] [CrossRef]
- Kim, Y.M.; Park, J.W.; Cheong, H.K. Estimated effect of climatic variables on the transmission of Plasmodium vivax malaria in the Republic of Korea. Environ. Health Perspect. 2012, 120, 1314–1319. [Google Scholar] [CrossRef]
- Bi, Y.; Yu, W.; Hu, W.; Lin, H.; Guo, Y.; Zhou, X.N.; Tong, S. Impact of climate variability on Plasmodium vivax and Plasmodium falciparum malaria in Yunnan Province, China. Parasites Vectors 2013, 6, 357. [Google Scholar] [CrossRef]
- Wardrop, N.A.; Barnett, A.G.; Atkinson, J.A.; Clements, A.C. Plasmodium vivax malaria incidence over time and its association with temperature and rainfall in four counties of Yunnan Province, China. Malar. J. 2013, 12, 452. [Google Scholar] [CrossRef]
- Zhao, X.; Chen, F.; Feng, Z.; Li, X.; Zhou, X.H. The temporal lagged association between meteorological factors and malaria in 30 counties in south-west China: A multilevel distributed lag non-linear analysis. Malar. J. 2014, 13, 57. [Google Scholar] [CrossRef]
- Zhao, X.; Chen, F.; Feng, Z.; Li, X.; Zhou, X.H. Characterizing the effect of temperature fluctuation on the incidence of malaria: An epidemiological study in south-west China using the varying coefficient distributed lag non-linear model. Malar. J. 2014, 13, 192. [Google Scholar] [CrossRef] [PubMed]
- Sewe, M.; Rocklov, J.; Williamson, J.; Hamel, M.; Nyaguara, A.; Odhiambo, F.; Laserson, K. The association of weather variability and under five malaria mortality in KEMRI/CDC HDSS in Western Kenya 2003 to 2008: A time series analysis. Int. J. Environ. Res. Public Health 2015, 12, 1983–1997. [Google Scholar] [CrossRef] [PubMed]
- Sewe, M.O.; Tozan, Y.; Ahlm, C.; Rocklov, J. Using remote sensing environmental data to forecast malaria incidence at a rural district hospital in Western Kenya. Sci. Rep. 2017, 7, 2589. [Google Scholar] [CrossRef] [PubMed]
- Hundessa, S.; Williams, G.; Li, S.; Guo, J.; Zhang, W.; Guo, Y. The weekly associations between climatic factors and Plasmodium vivax and Plasmodium falciparum malaria in China, 2005–2014. Trans. R. Soc. Trop. Med. Hyg. 2017, 111, 211–219. [Google Scholar] [CrossRef]
- Zhang, Y.; Liu, Q.Y.; Luan, R.S.; Liu, X.B.; Zhou, G.C.; Jiang, J.Y.; Li, H.S.; Li, Z.F. Spatial-temporal analysis of malaria and the effect of environmental factors on its incidence in Yongcheng, China, 2006–2010. BMC Public Health 2012, 12, 544. [Google Scholar] [CrossRef] [PubMed]
- Jusot, J.F.; Alto, O. Short term effect of rainfall on suspected malaria episodes at Magaria, Niger: A time series study. Trans. R. Soc. Trop. Med. Hyg. 2011, 105, 637–643. [Google Scholar] [CrossRef] [PubMed]
- Krefis, A.C.; Schwarz, N.G.; Kruger, A.; Fobil, J.; Nkrumah, B.; Acquah, S.; Loag, W.; Sarpong, N.; Adu-Sarkodie, Y.; Ranft, U.; et al. Modeling the relationship between precipitation and malaria incidence in children from a holoendemic area in Ghana. Am. J. Trop. Med. Hyg. 2011, 84, 285–291. [Google Scholar] [CrossRef] [PubMed]
- Silal, S.P.; Barnes, K.I.; Kok, G.; Mabuza, A.; Little, F. Exploring the seasonality of reported treated malaria cases in Mpumalanga, South Africa. PLoS ONE 2013, 8, e76640. [Google Scholar] [CrossRef] [PubMed]
- Lowe, R.; Chirombo, J.; Tompkins, A.M. Relative importance of climatic, geographic and socio-economic determinants of malaria in Malawi. Malar. J. 2013, 12, 416. [Google Scholar] [CrossRef]
- Nygren, D.; Stoyanov, C.; Lewold, C.; Mansson, F.; Miller, J.; Kamanga, A.; Shiff, C.J. Remotely-sensed, nocturnal, dew point correlates with malaria transmission in Southern Province, Zambia: A time-series study. Malar. J. 2014, 13, 231. [Google Scholar] [CrossRef]
- Guo, C.; Yang, L.; Ou, C.Q.; Li, L.; Zhuang, Y.; Yang, J.; Zhou, Y.X.; Qian, J.; Chen, P.Y.; Liu, Q.Y. Malaria incidence from 2005–2013 and its associations with meteorological factors in Guangdong, China. Malar. J. 2015, 14, 116. [Google Scholar] [CrossRef] [PubMed]
- Teklehaimanot, H.D.; Lipsitch, M.; Teklehaimanot, A.; Schwartz, J. Weather-based prediction of Plasmodium falciparum malaria in epidemic-prone regions of Ethiopia I. Patterns of lagged weather effects reflect biological mechanisms. Malar. J. 2004, 3, 41. [Google Scholar] [CrossRef] [PubMed]
- Teklehaimanot, H.D.; Schwartz, J.; Teklehaimanot, A.; Lipsitch, M. Weather-based prediction of Plasmodium falciparum malaria in epidemic-prone regions of Ethiopia II. Weather-based prediction systems perform comparably to early detection systems in identifying times for interventions. Malar. J. 2004, 3, 44. [Google Scholar] [CrossRef] [PubMed]
- Hashizume, M.; Chaves, L.F.; Minakawa, N. Indian Ocean Dipole drives malaria resurgence in East African highlands. Sci. Rep. 2012, 2, 269. [Google Scholar] [CrossRef] [PubMed] [Green Version]
- Hashizume, M.; Terao, T.; Minakawa, N. The Indian Ocean Dipole and malaria risk in the highlands of western Kenya. Proc. Natl. Acad. Sci. USA 2009, 106, 1857–1862. [Google Scholar] [CrossRef] [PubMed] [Green Version]
- Zhou, G.; Minakawa, N.; Githeko, A.K.; Yan, G. Climate variability and malaria epidemics in the highlands of East Africa. Trends Parasitol. 2005, 21, 54–56. [Google Scholar] [CrossRef] [PubMed]
- Chaves, L.F.; Satake, A.; Hashizume, M.; Minakawa, N. Indian Ocean dipole and rainfall drive a Moran effect in East Africa malaria transmission. J. Infect. Dis. 2012, 205, 1885–1891. [Google Scholar] [CrossRef] [PubMed]
- Gasparrini, A.; Armstrong, B.; Kenward, M.G. Distributed lag non-linear models. Stat. Med. 2010, 29, 2224–2234. [Google Scholar] [CrossRef] [Green Version]
- Kenya National Bureau of Statistics, Census 2009 Summary of Results. Available online: https://www.knbs.or.ke/population/ (accessed on 10 September 2019).
- Japan Aerospace Exploration Agency (JAXA). Global Satellite Mapping of Precipitation (GSMaP). Available online: https://sharaku.eorc.jaxa.jp/GSMaP/index.htm (accessed on 10 September 2019).
- National Aeronautics and Space Administration (NASA). Moderate Resolution Imaging Spectroradiometer. Available online: https://modis.gsfc.nasa.gov/data/ (accessed on 10 September 2019).
- United States Department of Agriculture (USDA). Lake Victoria (0314) Height Variations from TOPEX/POSEIDON and Jason Series Altimetry. Available online: https://ipad.fas.usda.gov/cropexplorer/global_reservoir/gr_regional_chart.aspx?regionid=eafrica&reservoir_name=Victoria (accessed on 10 September 2019).
- Gasparrini, A.; Armstrong, B. Reducing and meta-analysing estimates from distributed lag non-linear models. BMC Med. Res. Methodol. 2013, 13, 1. [Google Scholar] [CrossRef]
- Reiter, P. Climate change and mosquito-borne disease. Environ. Health Perspect. 2001, 109 (Suppl. 1), 141–161. [Google Scholar]
- Paaijmans, K.P.; Wandago, M.O.; Githeko, A.K.; Takken, W. Unexpected high losses of Anopheles gambiae larvae due to rainfall. PLoS ONE 2007, 2, e1146. [Google Scholar] [CrossRef] [PubMed]
- Lindblade, K.A.; Walker, E.D.; Onapa, A.W.; Katungu, J.; Wilson, M.L. Land use change alters malaria transmission parameters by modifying temperature in a highland area of Uganda. Trop. Med. Int. Health TM IH 2000, 5, 263–274. [Google Scholar] [CrossRef] [PubMed]
- Amek, N.; Bayoh, N.; Hamel, M.; Lindblade, K.A.; Gimnig, J.E.; Odhiambo, F.; Laserson, K.F.; Slutsker, L.; Smith, T.; Vounatsou, P. Spatial and temporal dynamics of malaria transmission in rural Western Kenya. Parasites Vectors 2012, 5, 86. [Google Scholar] [CrossRef] [PubMed]
- Li, T.; Yang, Z.; Wang, M. Temperature, relative humidity and sunshine may be the effective predictors for occurrence of malaria in Guangzhou, southern China, 2006–2012. Parasites Vectors 2013, 6, 155. [Google Scholar] [CrossRef] [PubMed]
- Kirby, M.J.; Ameh, D.; Bottomley, C.; Green, C.; Jawara, M.; Milligan, P.J.; Snell, P.C.; Conway, D.J.; Lindsay, S.W. Effect of two different house screening interventions on exposure to malaria vectors and on anaemia in children in The Gambia: A randomised controlled trial. Lancet (Lond. Engl.) 2009, 374, 998–1009. [Google Scholar] [CrossRef]
- Hawley, W.A.; Phillips-Howard, P.A.; ter Kuile, F.O.; Terlouw, D.J.; Vulule, J.M.; Ombok, M.; Nahlen, B.L.; Gimnig, J.E.; Kariuki, S.K.; Kolczak, M.S.; et al. Community-wide effects of permethrin-treated bed nets on child mortality and malaria morbidity in western Kenya. Am. J. Trop. Med. Hyg. 2003, 68 (Suppl. 4), 121–127. [Google Scholar] [CrossRef]
- Phillips-Howard, P.A.; Nahlen, B.L.; Kolczak, M.S.; Hightower, A.W.; ter Kuile, F.O.; Alaii, J.A.; Gimnig, J.E.; Arudo, J.; Vulule, J.M.; Odhacha, A.; et al. Efficacy of permethrin-treated bed nets in the prevention of mortality in young children in an area of high perennial malaria transmission in western Kenya. Am. J. Trop. Med. Hyg. 2003, 68 (Suppl. 4), 23–29. [Google Scholar] [CrossRef]
- Ter Kuile, F.O.; Terlouw, D.J.; Kariuki, S.K.; Phillips-Howard, P.A.; Mirel, L.B.; Hawley, W.A.; Friedman, J.F.; Shi, Y.P.; Kolczak, M.S.; Lal, A.A.; et al. Impact of permethrin-treated bed nets on malaria, anemia, and growth in infants in an area of intense perennial malaria transmission in western Kenya. Am. J. Trop. Med. Hyg. 2003, 68 (Suppl. 4), 68–77. [Google Scholar] [CrossRef]


| Hospital | Elevation | Period | Total | Mean | Sd | Min | Max |
|---|---|---|---|---|---|---|---|
| Nyanza | 1189 m | 2000–2009 | 36098 | 305.92 | 118.03 | 84 | 574 |
| Kendu Bay | 1243 m | 2000–2009 | 6007 | 50.91 | 30.68 | 2 | 124 |
| Maseno | 1576 m | 2000–2009 | 3880 | 32.88 | 17.80 | 2 | 81 |
| Kisii | 1656 m | 2000–2013 | 244277 | 1471.55 | 528.54 | 407 | 3554 |
| Kericho | 1983 m | 2001–2013 | 166761 | 1068.98 | 498.08 | 420 | 4969 |
| Kapsabet | 1997 m | 2001–2010 | 157866 | 1315.55 | 691.20 | 387 | 3231 |
| Hospital | Mean | Sd | Min | Max |
|---|---|---|---|---|
| Nyanza | 119.21 | 78.77 | 0.60 | 403.28 |
| Kendu Bay | 127.01 | 81.90 | 1.29 | 445.25 |
| Maseno | 146.92 | 87.19 | 3.15 | 404.44 |
| Kisii | 136.25 | 82.40 | 7.05 | 485.60 |
| Kericho | 89.11 | 61.73 | 0.76 | 371.03 |
| Kapsabet | 82.31 | 61.83 | 1.13 | 315.25 |
| Hospital | Mean | Sd | Min | Max |
|---|---|---|---|---|
| Nyanza | 30.95 | 4.55 | 22.46 | 44.07 |
| Kendu Bay | 31.46 | 5.20 | 20.70 | 47.08 |
| Maseno | 28.21 | 4.41 | 20.25 | 41.75 |
| Kisii | 24.66 | 3.81 | 18.02 | 36.74 |
| Kericho | 23.37 | 4.08 | 9.43 | 37.01 |
| Kapsabet | 26.14 | 3.56 | 12.23 | 36.36 |
| Hospital | Mean | Sd | Min | Max |
|---|---|---|---|---|
| Nyanza | 0.57 | 0.07 | 0.39 | 0.70 |
| Kendu Bay | 0.55 | 0.08 | 0.35 | 0.67 |
| Maseno | 0.61 | 0.06 | 0.39 | 0.72 |
| Kisii | 0.65 | 0.06 | 0.49 | 0.77 |
| Kericho | 0.70 | 0.04 | 0.57 | 0.79 |
| Kapsabet | 0.67 | 0.06 | 0.47 | 0.77 |
| Mean | Sd | Min | Max |
|---|---|---|---|
| −0.42 | 0.35 | −1.33 | 0.33 |
© 2019 by the authors. Licensee MDPI, Basel, Switzerland. This article is an open access article distributed under the terms and conditions of the Creative Commons Attribution (CC BY) license (http://creativecommons.org/licenses/by/4.0/).
Share and Cite
Matsushita, N.; Kim, Y.; Ng, C.F.S.; Moriyama, M.; Igarashi, T.; Yamamoto, K.; Otieno, W.; Minakawa, N.; Hashizume, M. Differences of Rainfall–Malaria Associations in Lowland and Highland in Western Kenya. Int. J. Environ. Res. Public Health 2019, 16, 3693. https://0-doi-org.brum.beds.ac.uk/10.3390/ijerph16193693
Matsushita N, Kim Y, Ng CFS, Moriyama M, Igarashi T, Yamamoto K, Otieno W, Minakawa N, Hashizume M. Differences of Rainfall–Malaria Associations in Lowland and Highland in Western Kenya. International Journal of Environmental Research and Public Health. 2019; 16(19):3693. https://0-doi-org.brum.beds.ac.uk/10.3390/ijerph16193693
Chicago/Turabian StyleMatsushita, Naohiko, Yoonhee Kim, Chris Fook Sheng Ng, Masao Moriyama, Tamotsu Igarashi, Kazuhide Yamamoto, Wellington Otieno, Noboru Minakawa, and Masahiro Hashizume. 2019. "Differences of Rainfall–Malaria Associations in Lowland and Highland in Western Kenya" International Journal of Environmental Research and Public Health 16, no. 19: 3693. https://0-doi-org.brum.beds.ac.uk/10.3390/ijerph16193693