Distribution and Contamination Assessment of Soil Heavy Metals in the Jiulongjiang River Catchment, Southeast China


Abstract
:1. Introduction
2. Materials and Methods
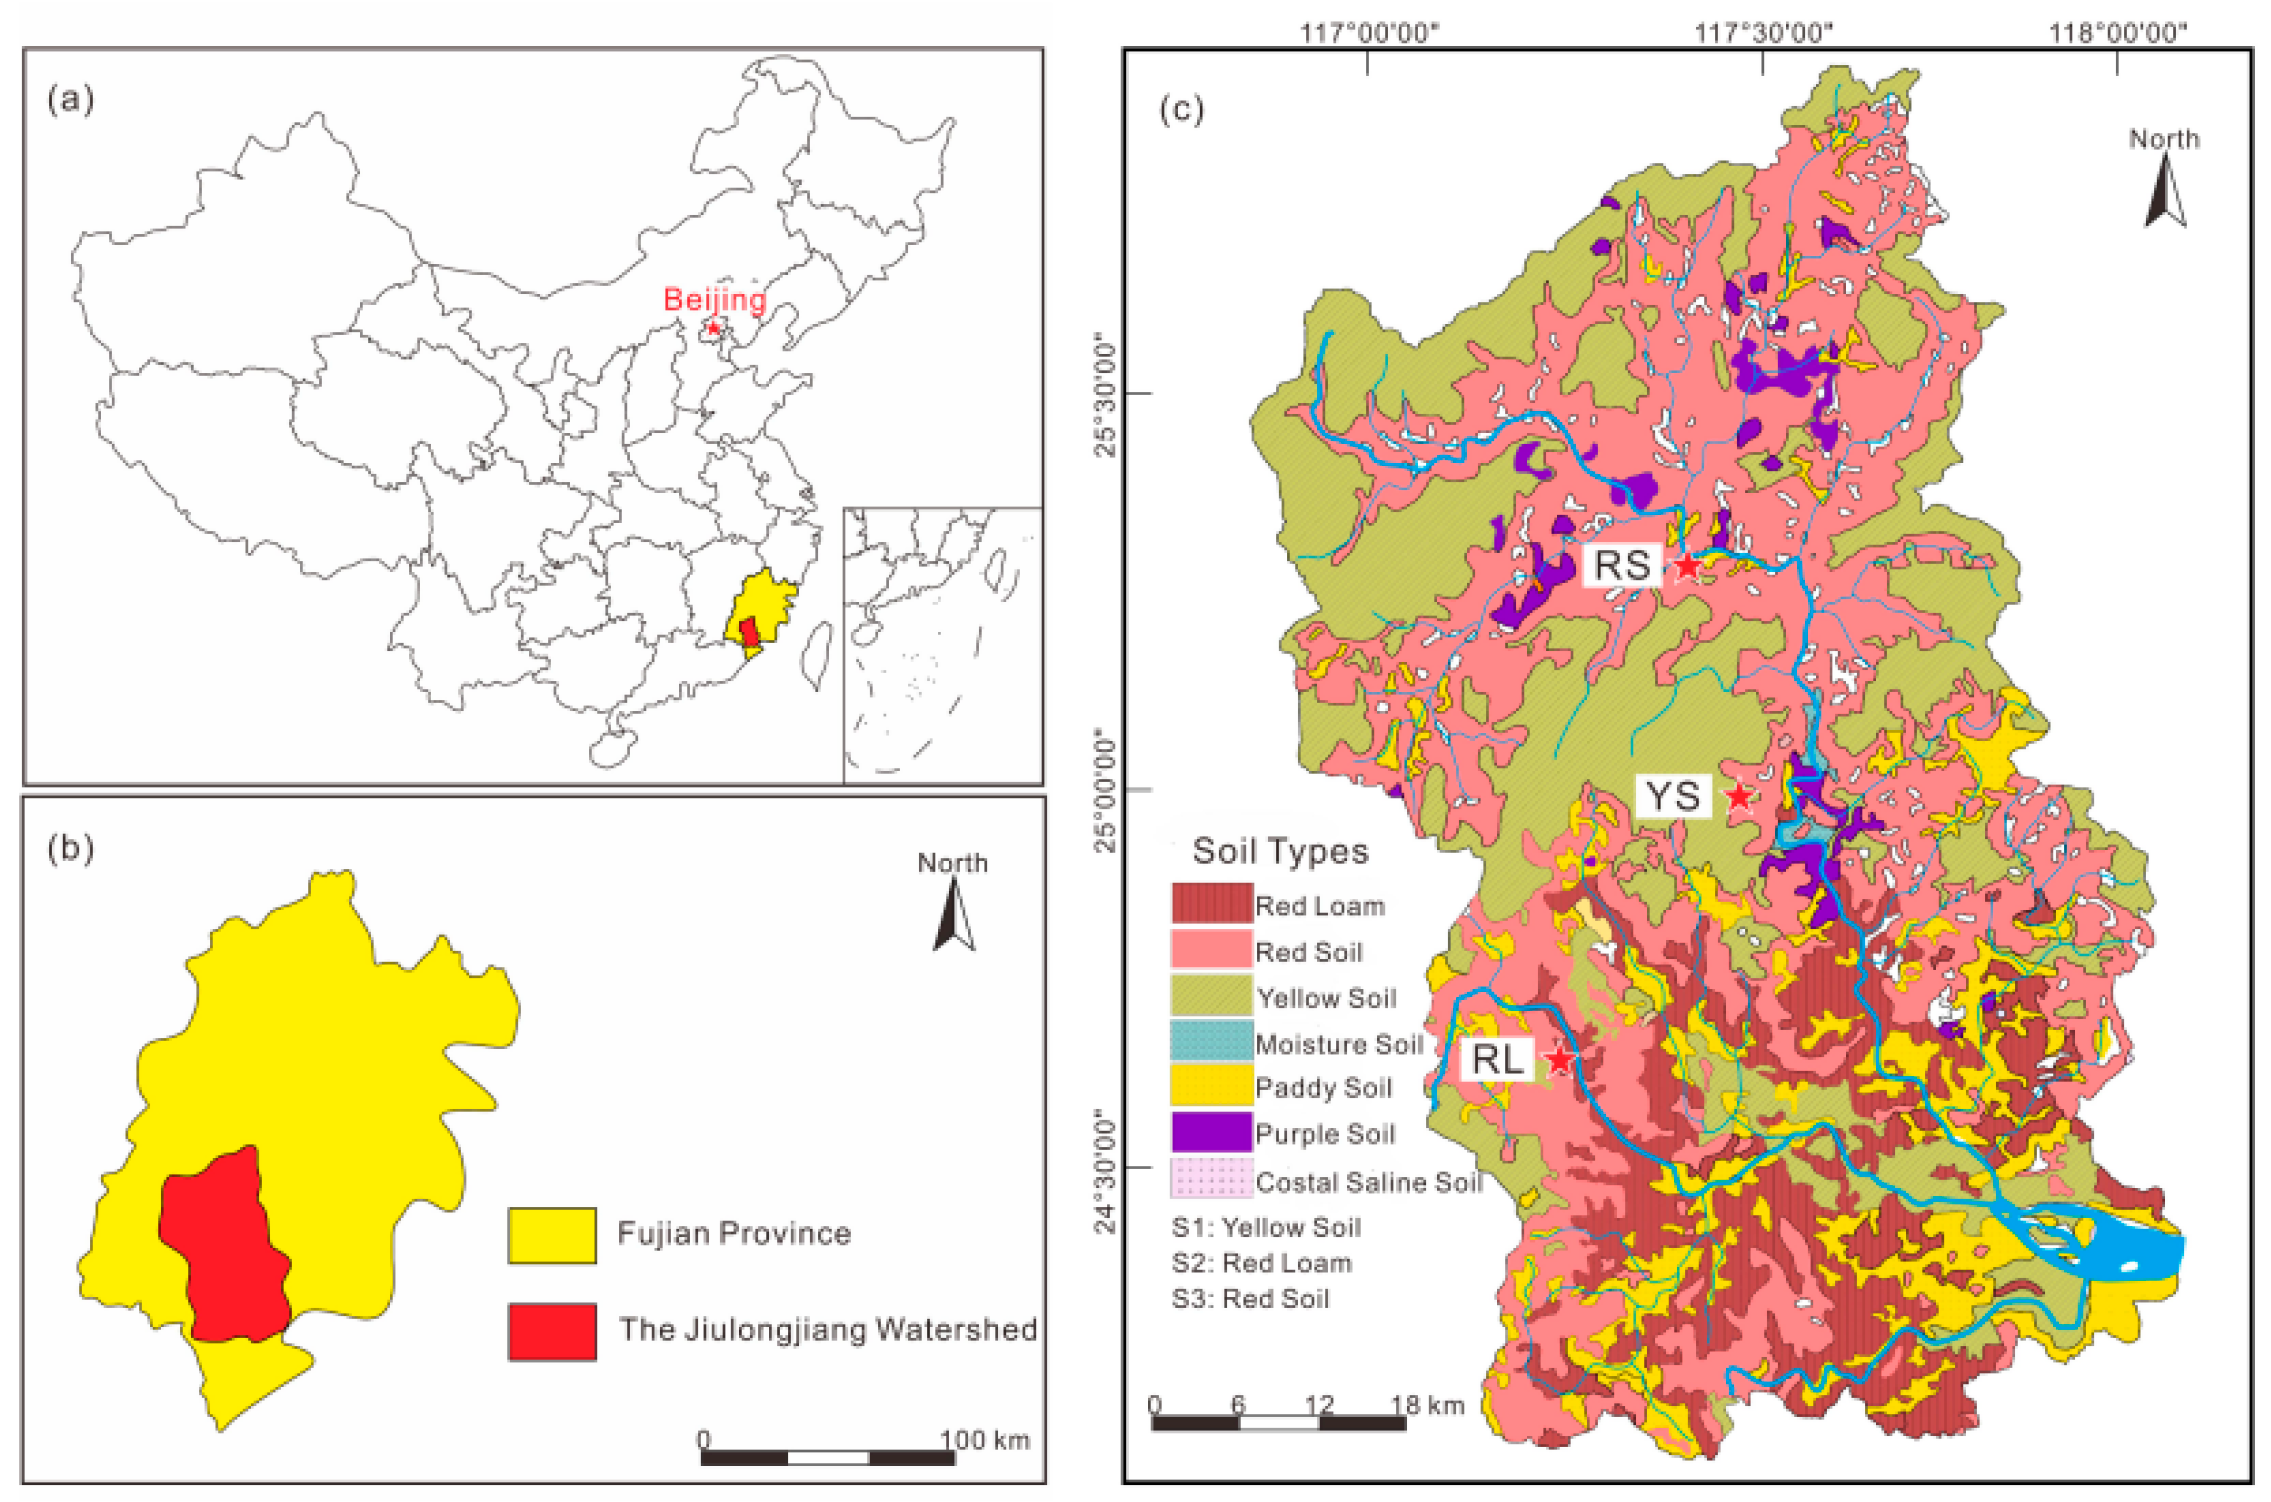
2.1. Study Area
2.2. Sampling and Analysis
2.3. Data Analysis
3. Results and Discussion
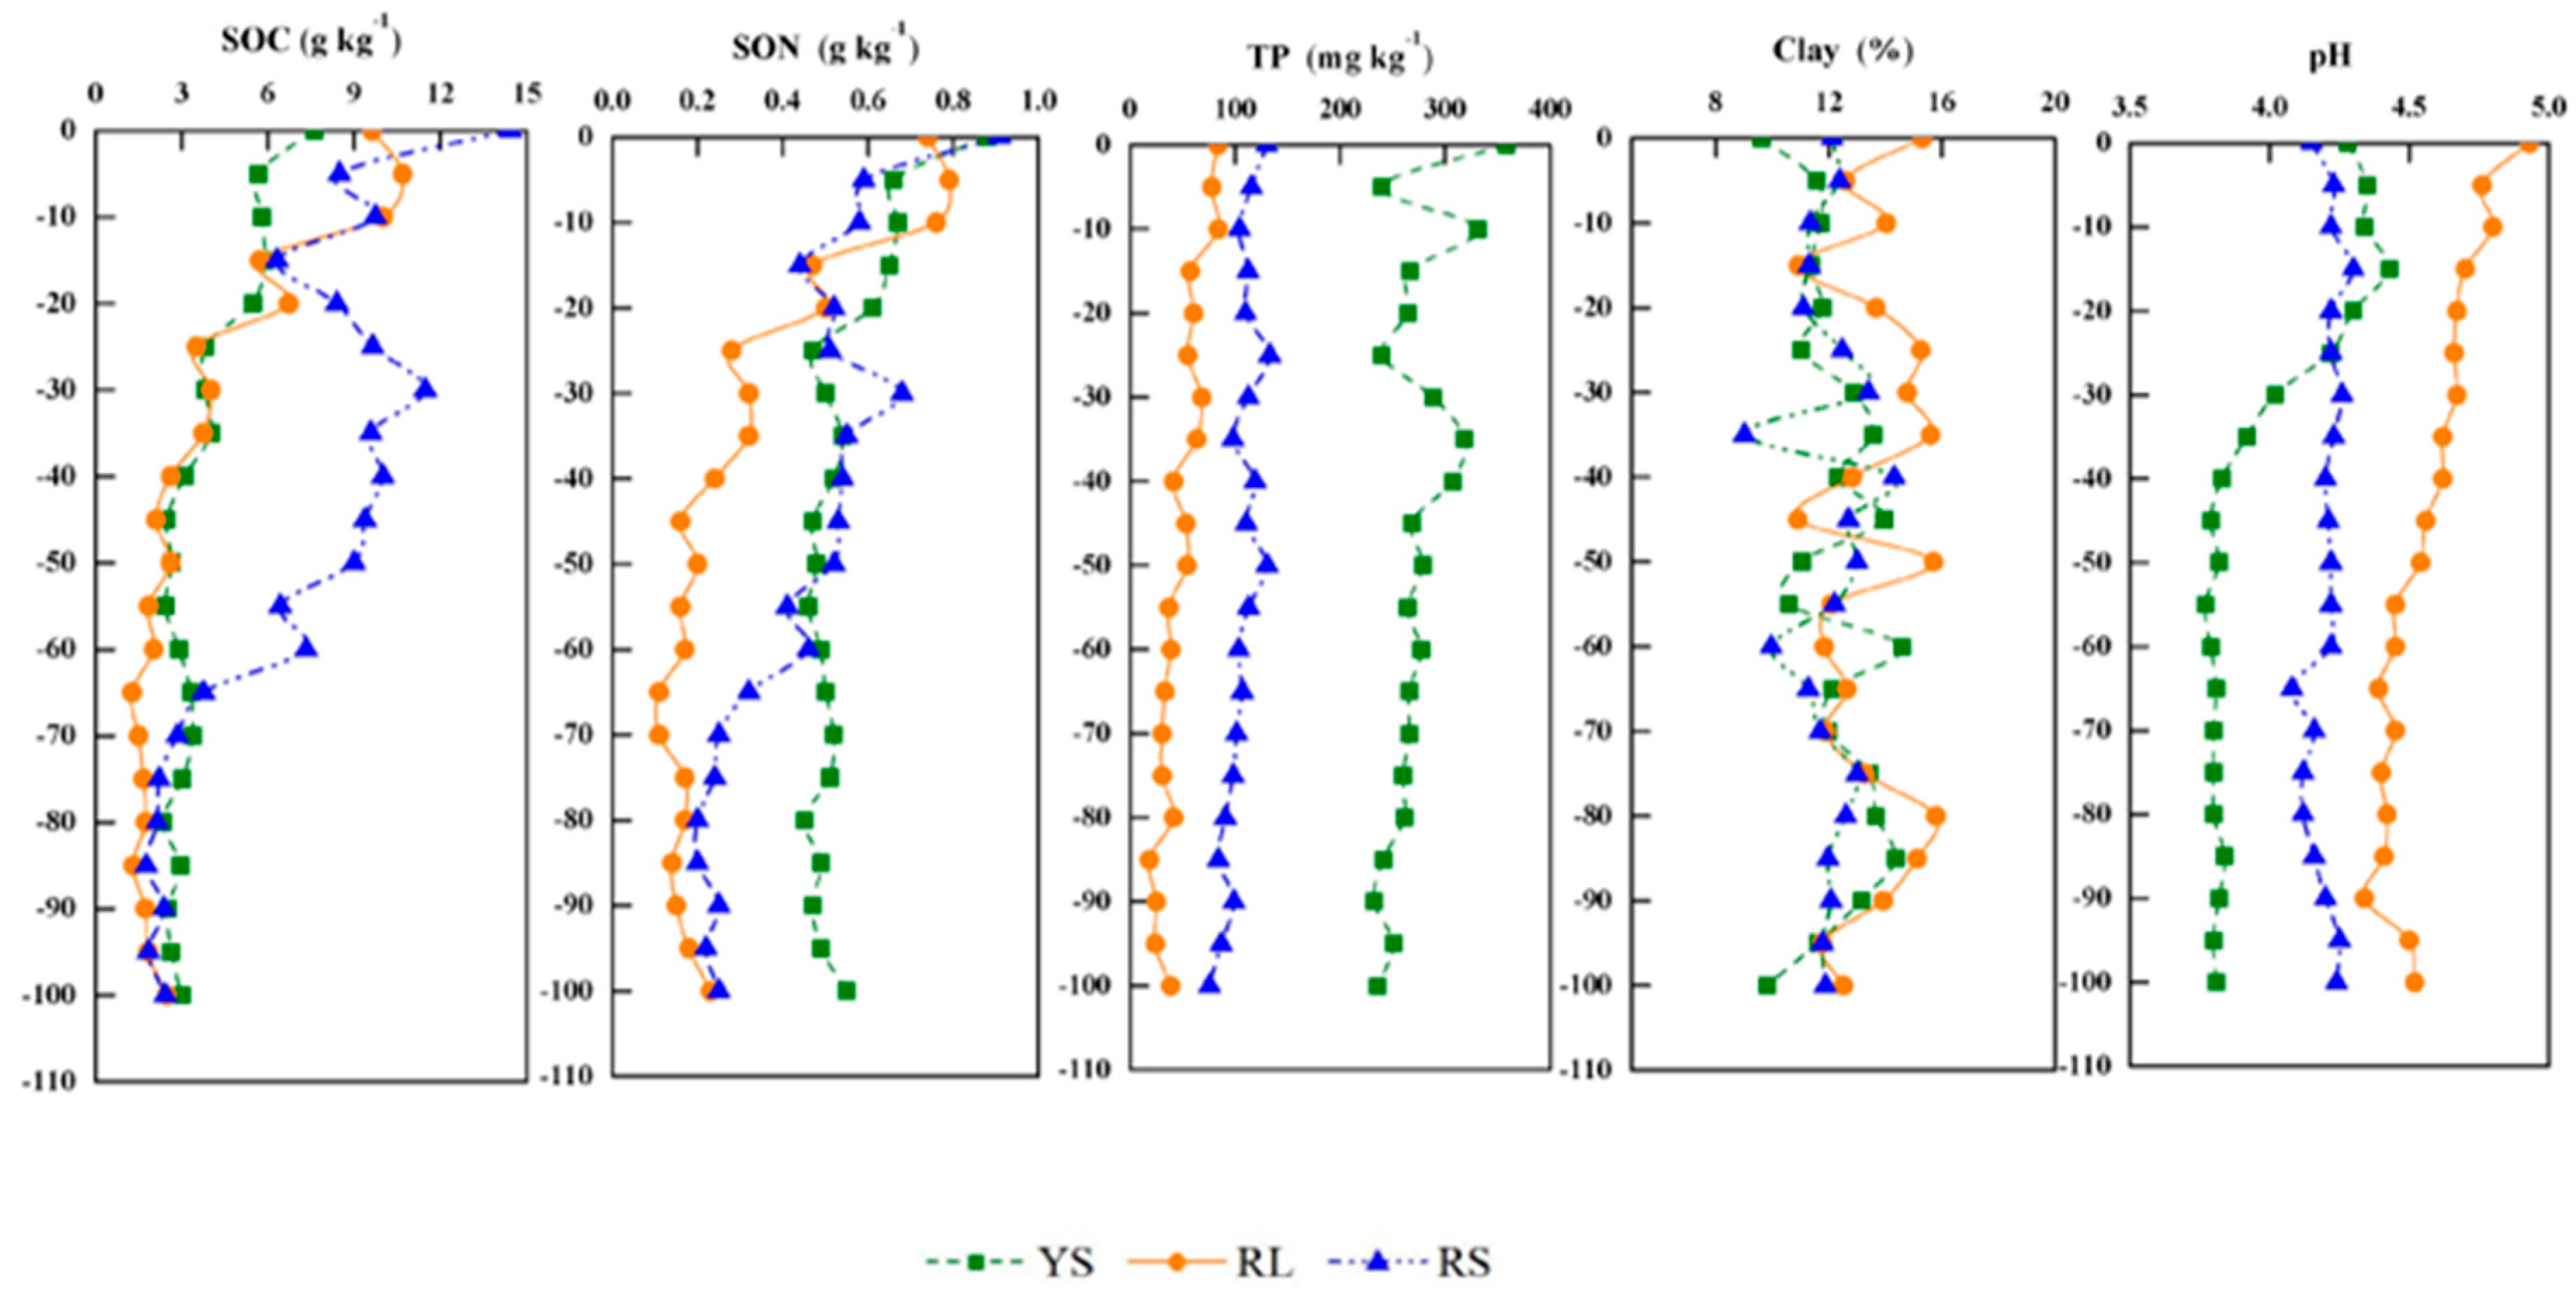
3.1. Soil Properties and Heavy Metal Concentrations
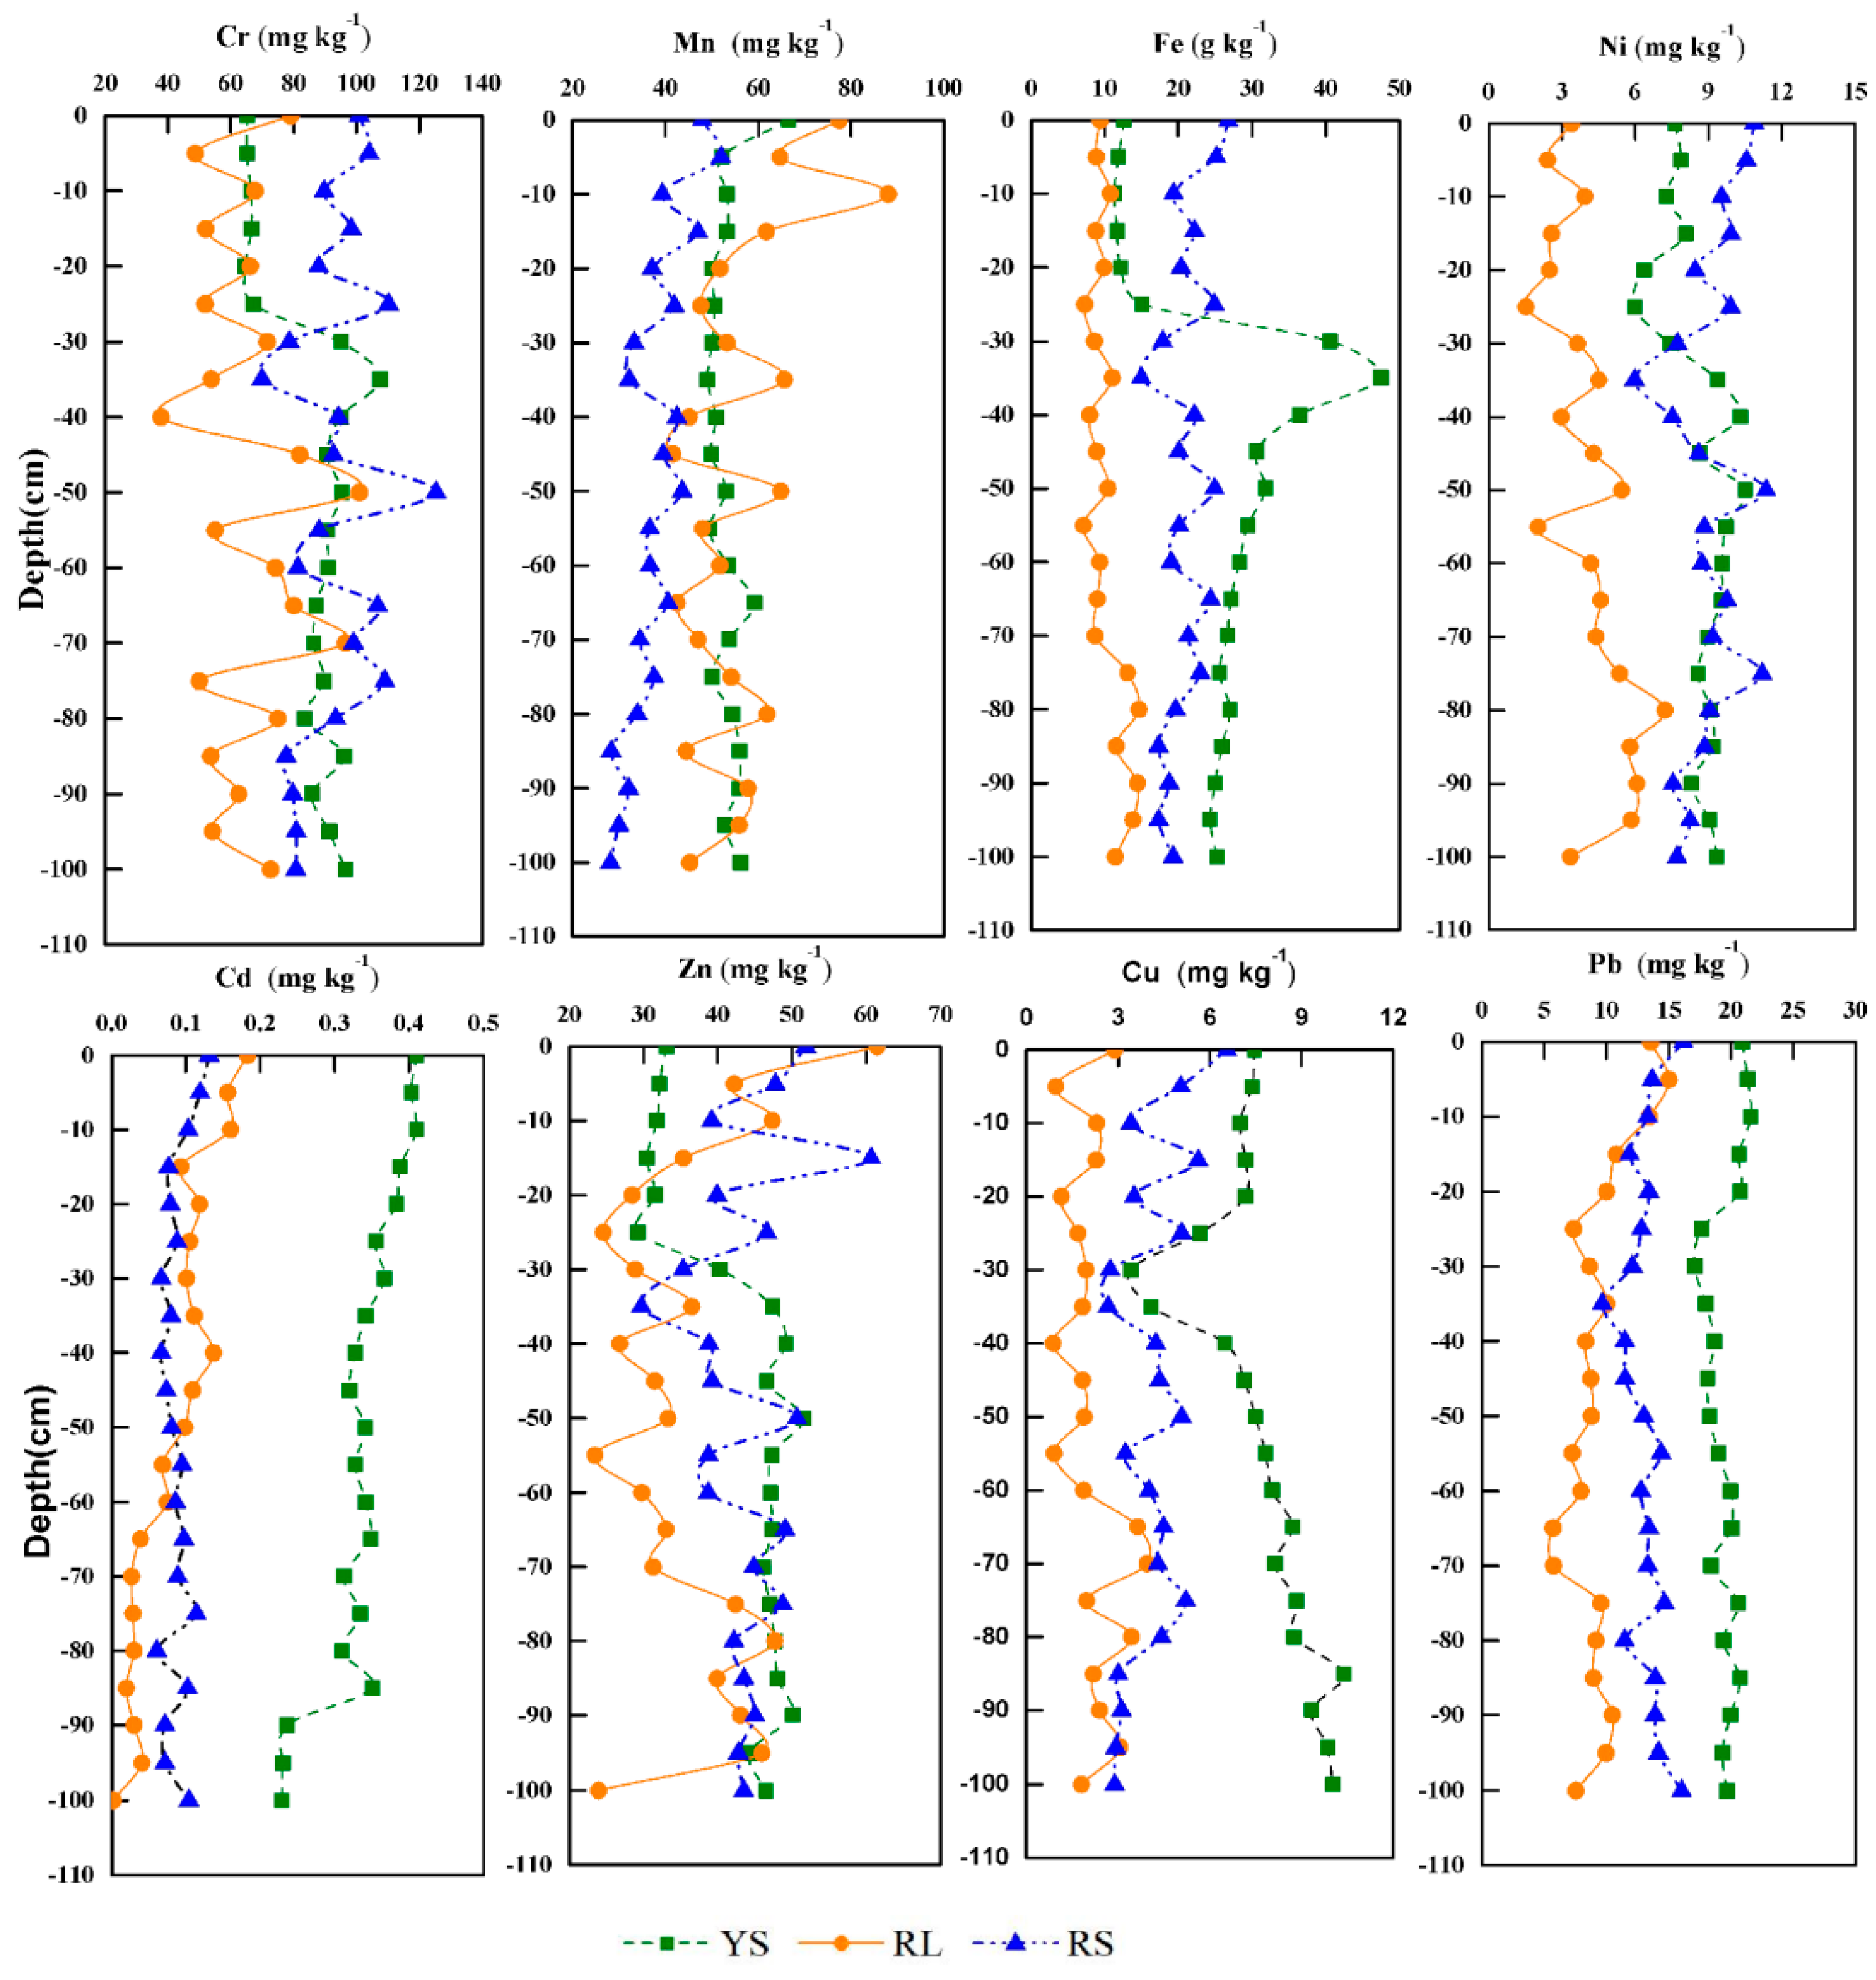
3.2. Vertical Profiles of Heavy Metals
3.3. Pearson Correlation Analysis
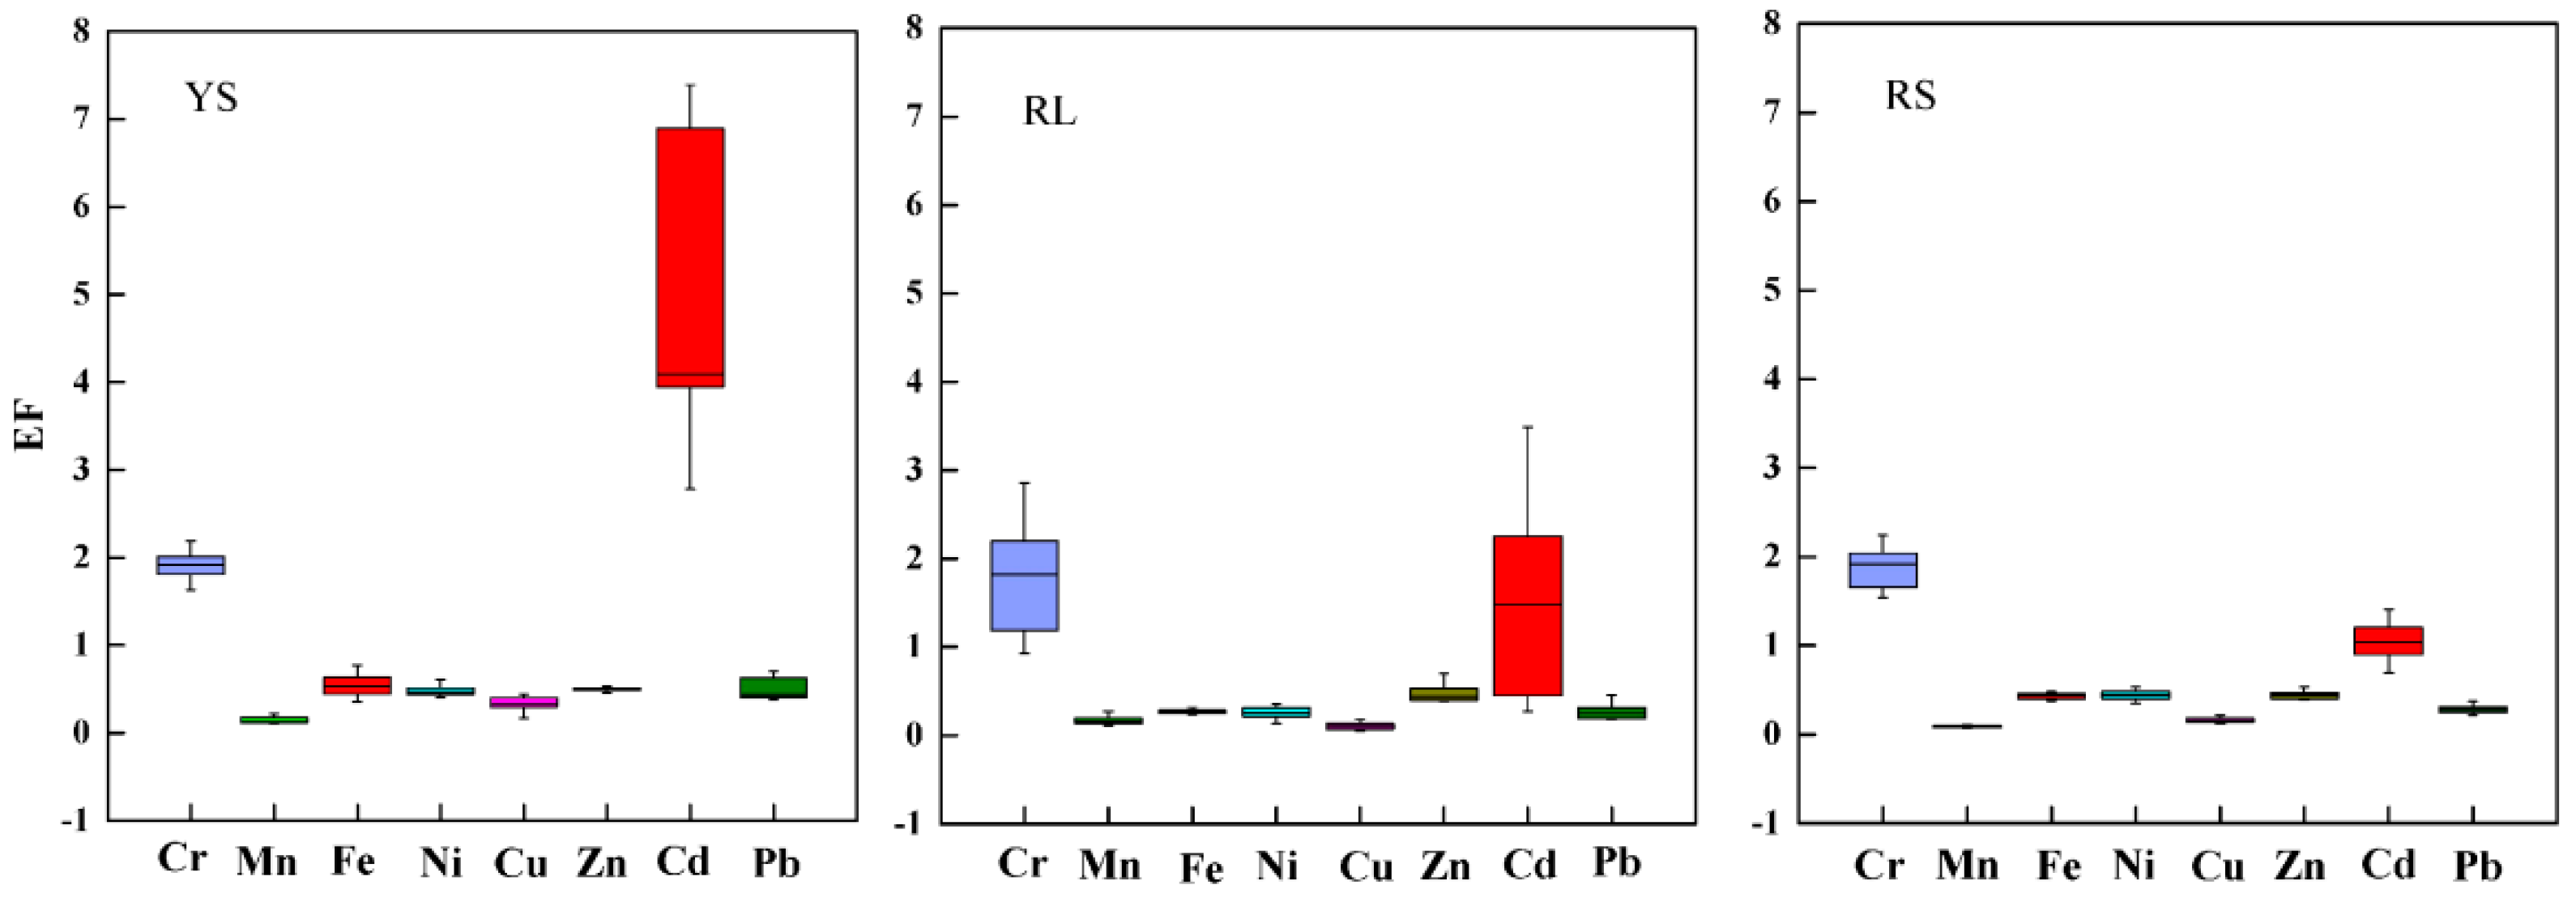
3.4. Contamination Assessment of Heavy Metals
3.5. Assessment of Potential Ecological Risk
4. Conclusions
- The contents of these eight HMs were much lower than local reference background values, whereas Cr and Cd were enriched. Cr enrichment in soils was mainly dependent on local bedrocks.
- The Cd, Pb and Cu were significantly correlated (p < 0.01), indicating similar geochemical behavior or input anthropogenic sources likely related to the use of pesticides and fertilizers. The Cr, Zn, Ni, and Fe displayed strongly positive correlation (p < 0.01) with each other, suggesting the common origin of HMs with a natural source. However, the statistical correlation between Cd and Cr was not found.
- EF and Igeo analysis indicated that soils were contaminated by Cd in abandoned agricultural land (YS), and pollution degree in abandoned agricultural land was more serious than that in forest lands (RL and RS).
- Potential ecological risk analysis indicated that Cd posed a considerable ecological risk in all profile soils at site YS, and posed a moderate ecological risk in topsoils under at RL and RS sites. Agricultural activities, including fertilization and pesticides, were the main input of Cd at YS site, and industrial activities, including mining and fossil fuel, were the contributors of Cd at RL and RS sites. Although soils in the Jiulongjiang River catchment were only contaminated by Cd, migration and enrichment of other metals should be controlled by arranging reasonable industrial and agricultural activities.
Author Contributions
Funding
Acknowledgments
Conflicts of Interest
Appendix A

| Sampling Site | Depth (cm) | Cr (mg kg−1) | Mn (mg kg−1) | Fe (g kg−1) | Cu (mg kg−1) | Zn (mg kg−1) | Cd (mg kg−1) | Pb (mg kg−1) | Ni (mg kg−1) |
|---|---|---|---|---|---|---|---|---|---|
| YS | 0 | 65.4 | 66.57 | 12.59 | 7.470 | 33.07 | 0.410 | 20.91 | 7.627 |
| 5 | 65.22 | 52.24 | 11.86 | 7.387 | 32.15 | 0.403 | 21.34 | 7.864 | |
| 10 | 66.52 | 53.3 | 11.31 | 7.002 | 31.84 | 0.410 | 21.60 | 7.275 | |
| 15 | 66.7 | 53.33 | 11.71 | 7.184 | 30.46 | 0.388 | 20.63 | 8.093 | |
| 20 | 64.82 | 50.17 | 12.13 | 7.177 | 31.55 | 0.383 | 20.72 | 6.368 | |
| 25 | 67.16 | 50.7 | 15.11 | 5.681 | 29.28 | 0.355 | 17.66 | 5.973 | |
| 30 | 95.08 | 50.12 | 40.6 | 3.418 | 40.31 | 0.367 | 17.10 | 7.401 | |
| 35 | 107.5 | 49.14 | 47.49 | 4.091 | 47.4 | 0.342 | 17.99 | 9.38 | |
| 40 | 95.02 | 50.96 | 36.4 | 6.511 | 49.25 | 0.328 | 18.68 | 10.30 | |
| 45 | 90.77 | 49.95 | 30.62 | 7.135 | 46.57 | 0.320 | 18.12 | 8.652 | |
| 50 | 95.45 | 53.15 | 31.89 | 7.505 | 51.54 | 0.341 | 18.33 | 10.50 | |
| 55 | 90.87 | 49.48 | 29.46 | 7.840 | 47.29 | 0.328 | 18.99 | 9.729 | |
| 60 | 91.13 | 53.63 | 28.34 | 8.055 | 47.14 | 0.342 | 19.99 | 9.561 | |
| 65 | 87.22 | 59.16 | 27.15 | 8.704 | 47.36 | 0.348 | 20.02 | 9.521 | |
| 70 | 86.45 | 53.78 | 26.64 | 8.139 | 46.19 | 0.313 | 18.41 | 8.995 | |
| 75 | 89.75 | 50.12 | 25.56 | 8.845 | 47.02 | 0.335 | 20.59 | 8.584 | |
| 80 | 83.47 | 54.47 | 27.03 | 8.751 | 47.69 | 0.310 | 19.40 | 9.103 | |
| 85 | 96.2 | 55.94 | 25.88 | 10.41 | 48.09 | 0.351 | 20.73 | 9.187 | |
| 90 | 85.88 | 55.89 | 24.97 | 9.333 | 50.11 | 0.236 | 19.98 | 8.319 | |
| 95 | 91.4 | 52.85 | 24.28 | 9.863 | 44.26 | 0.230 | 19.33 | 9.056 | |
| 100 | 96.52 | 56.27 | 25.22 | 10.04 | 46.48 | 0.229 | 19.68 | 9.346 | |
| RL | 0 | 78.98 | 77.47 | 9.368 | 2.892 | 61.49 | 0.183 | 13.53 | 3.4 |
| 5 | 48.66 | 64.72 | 8.855 | 0.9683 | 42.21 | 0.156 | 15.00 | 2.419 | |
| 10 | 67.8 | 88.06 | 10.75 | 2.302 | 47.34 | 0.160 | 13.44 | 3.927 | |
| 15 | 52.04 | 61.74 | 8.797 | 2.288 | 35.37 | 0.093 | 10.81 | 2.581 | |
| 20 | 66.32 | 51.85 | 9.893 | 1.145 | 28.46 | 0.118 | 10.01 | 2.499 | |
| 25 | 51.82 | 47.69 | 7.282 | 1.699 | 24.62 | 0.105 | 7.35 | 1.544 | |
| 30 | 71.72 | 53.3 | 8.612 | 1.959 | 28.9 | 0.101 | 8.63 | 3.637 | |
| 35 | 53.75 | 65.76 | 11.03 | 1.849 | 36.52 | 0.111 | 10.03 | 4.509 | |
| 40 | 37.85 | 45.14 | 7.986 | 0.8869 | 26.82 | 0.137 | 8.33 | 2.976 | |
| 45 | 81.9 | 41.65 | 8.871 | 1.85 | 31.51 | 0.109 | 8.74 | 4.305 | |
| 50 | 101 | 64.87 | 10.42 | 1.898 | 33.29 | 0.098 | 8.79 | 5.453 | |
| 55 | 55.04 | 48.05 | 7.115 | 0.912 | 23.46 | 0.069 | 7.25 | 2.034 | |
| 60 | 74.22 | 51.8 | 9.315 | 1.882 | 29.81 | 0.075 | 7.96 | 4.18 | |
| 65 | 80.03 | 42.56 | 8.99 | 3.64 | 32.99 | 0.039 | 5.71 | 4.582 | |
| 70 | 96.61 | 47.12 | 8.684 | 3.957 | 31.3 | 0.027 | 5.75 | 4.396 | |
| 75 | 49.93 | 54.23 | 13.09 | 1.982 | 42.42 | 0.029 | 9.54 | 5.376 | |
| 80 | 74.97 | 61.93 | 14.66 | 3.435 | 47.73 | 0.030 | 9.17 | 7.218 | |
| 85 | 53.59 | 44.52 | 11.56 | 2.196 | 39.97 | 0.020 | 8.95 | 5.798 | |
| 90 | 62.52 | 57.78 | 14.43 | 2.400 | 43.06 | 0.030 | 10.48 | 6.079 | |
| 95 | 54.22 | 55.91 | 13.8 | 3.062 | 45.95 | 0.041 | 9.96 | 5.835 | |
| 100 | 72.77 | 45.35 | 11.42 | 1.812 | 23.98 | 0.002 | 7.55 | 3.343 | |
| RS | 0 | 101 | 48.01 | 26.78 | 6.573 | 51.86 | 0.131 | 16.19 | 10.87 |
| 5 | 104 | 52.03 | 25.13 | 5.061 | 47.78 | 0.119 | 13.67 | 10.55 | |
| 10 | 89.82 | 39.33 | 19.37 | 3.417 | 39.2 | 0.103 | 13.30 | 9.547 | |
| 15 | 98.44 | 47.04 | 22.2 | 5.622 | 60.69 | 0.077 | 11.87 | 9.916 | |
| 20 | 88.02 | 37.13 | 20.39 | 3.525 | 39.92 | 0.079 | 13.41 | 8.464 | |
| 25 | 110.2 | 41.95 | 24.87 | 5.088 | 46.64 | 0.088 | 12.81 | 9.903 | |
| 30 | 78.65 | 33.33 | 17.9 | 2.743 | 35.33 | 0.067 | 12.08 | 7.725 | |
| 35 | 69.99 | 32.27 | 14.96 | 2.676 | 29.71 | 0.080 | 9.66 | 5.979 | |
| 40 | 94.35 | 42.52 | 22.16 | 4.245 | 38.88 | 0.067 | 11.49 | 7.512 | |
| 45 | 92.8 | 39.54 | 20.09 | 4.365 | 39.28 | 0.074 | 11.50 | 8.604 | |
| 50 | 125.4 | 43.62 | 24.9 | 5.084 | 50.69 | 0.081 | 13.00 | 11.35 | |
| 55 | 88.15 | 36.66 | 20.1 | 3.242 | 38.79 | 0.095 | 14.37 | 8.834 | |
| 60 | 81.32 | 36.68 | 19.02 | 4.025 | 38.74 | 0.086 | 12.78 | 8.746 | |
| 65 | 106.7 | 40.63 | 24.33 | 4.499 | 49.11 | 0.097 | 13.41 | 9.762 | |
| 70 | 99.08 | 34.57 | 21.34 | 4.311 | 44.82 | 0.089 | 13.32 | 9.176 | |
| 75 | 109 | 37.53 | 22.97 | 5.221 | 48.77 | 0.114 | 14.64 | 11.19 | |
| 80 | 93.45 | 33.93 | 19.66 | 4.434 | 42.18 | 0.061 | 11.48 | 9.055 | |
| 85 | 77.56 | 28.39 | 17.33 | 3.008 | 43.54 | 0.102 | 13.91 | 8.848 | |
| 90 | 79.63 | 32.14 | 18.79 | 3.111 | 44.99 | 0.072 | 13.90 | 7.541 | |
| 95 | 80.77 | 30.07 | 17.34 | 2.924 | 42.78 | 0.072 | 14.17 | 8.25 | |
| 100 | 80.69 | 28.22 | 19.32 | 2.884 | 43.5 | 0.104 | 16.04 | 7.71 | |
| Background value [41] | 14 | 391 | 42.4 | 22.8 | 96.1 | 0.074 | 41.3 | 18.2 |
References
- Zhang, T.; Xu, W.; Lin, X.; Yan, H.; Ma, M.; He, Z. Assessment of heavy metals pollution of soybean grains in North Anhui of China. Sci. Total Environ. 2019, 646, 914–922. [Google Scholar] [CrossRef]
- Islam, S.; Ahmed, K.; Habibullah, A.M.; Masunaga, S. Potential ecological risk of hazardous elements in different land-use urban soils of Bangladesh. Sci. Total Environ. 2015, 512, 94–102. [Google Scholar] [CrossRef] [PubMed]
- Zoeteman, B.C.J.; Greef, E.D.; Brinkmann, F.J.J. Persistency of organic contaminants in groundwater, lessons from soil pollution incidents in the Netherlands. Sci. Total Environ. 1981, 21, 187–202. [Google Scholar] [CrossRef]
- Tang, B.; Tong, P.; Xue, K.S.; Williams, P.L.; Wang, J.S.; Tang, L.L. High-throughput assessment of toxic effects of metal mixtures of cadmium (Cd), lead (Pb), and manganese (Mn) in nematode Caenorhabditis elegans. Chemosphere 2019, 234, 232–241. [Google Scholar] [CrossRef] [PubMed]
- Kobayashi, E.; Okubo, Y.; Suwazono, Y.; Kido, T.; Nishijo, M.; Nakagawa, H.; Nogawa, K. Association between total cadmium intake calculated from the cadmium concentration in household rice and mortality among inhabitants of the cadmium-polluted Jinzu River basin of Japan. Toxicol. Lett. 2002, 129, 85–91. [Google Scholar] [CrossRef]
- Antonio, M.T.; Corredor, L.; Leret, M.L. Study of the activity of several brain enzymes like markers of the neurotoxicity induced by perinatal exposure to lead and/or cadmium. Toxicol. Lett. 2003, 143, 331–340. [Google Scholar] [CrossRef]
- MEP of China (Ministry of Environmental Protection of China). National Soil Pollution Survey Bulletin. 2014. Available online: http://www.zhb.gov.cn/gkml/hbb/qt/201404/t20140417_270670.htm (accessed on 7 October 2019).
- Yang, Q.; Li, Z.; Lu, X.; Duan, Q.; Huang, L.; Bi, J. A review of soil heavy metal pollution from industrial and agricultural regions in China: Pollution and risk assessment. Sci. Total Environ. 2018, 642, 690–700. [Google Scholar] [CrossRef]
- Wu, W.; Wu, P.; Yang, F.; Sun, D.; Zhang, D.X.; Zhou, Y.K. Assessment of heavy metal pollution and human health risks in urban soils around an electronics manufacturing facility. Sci. Total Environ. 2018, 630, 53–61. [Google Scholar] [CrossRef]
- Liu, J.; Liu, Y.J.; Liu, Y.; Liu, Z.; Zhang, A. Quantitative contributions of the major sources of heavy metals in soils to ecosystem and human health risks: A case study of Yulin, China. Ecotoxicol. Environ. Saf. 2018, 164, 261–269. [Google Scholar] [CrossRef]
- Yadav, I.C.; Devi, N.L.; Singh, V.K.; Li, J.; Zhang, G. Spatial distribution, source analysis, and health risk assessment of heavy metals contamination in house dust and surface soil from four major cities of Nepal. Chemosphere 2019, 218, 1100–1113. [Google Scholar] [CrossRef]
- Huang, J.; Li, F.; Zeng, G.; Liu, W.; Huang, X.; Xiao, Z.; He, Y. Integrating hierarchical bioavailability and population distribution into potential eco-risk assessment of heavy metals in road dust: A case study in Xiandao District, Changsha city, China. Sci. Total Environ. 2016, 541, 969–976. [Google Scholar] [CrossRef] [PubMed]
- Rahman, M.S.; Khan, M.D.H.; Jolly, Y.N.; Kabir, J.; Akter, S.; Salam, A. Assessing risk to human health for heavy metal contamination through street dust in the Southeast Asian Megacity: Dhaka, Bangladesh. Sci. Total Environ. 2019, 660, 1610–1622. [Google Scholar] [CrossRef] [PubMed]
- Liu, J.; Liang, J.; Yuan, X.; Zeng, G.; Yuan, Y.; Wu, H.; Huang, X.; Liu, J.; Hua, S.; Li, F. An integrated model for assessing heavy metal exposure risk to migratory birds in wetland ecosystem: A case study in Dongting Lake Wetland, China. Chemosphere 2015, 135, 14–19. [Google Scholar] [CrossRef] [PubMed]
- Han, G.; Tang, Y.; Li, F. Organic matter impact on distribution of rare earth elements in soil under different land uses. Clean-Soil Air Water 2017, 45, 1600235. [Google Scholar] [CrossRef]
- Hu, Y.; Cheng, H. A method for apportionment of natural and anthropogenic contributions to heavy metal loadings in the surface soils across large-scale regions. Environ. Pollut. 2016, 214, 400–409. [Google Scholar] [CrossRef] [PubMed]
- Liang, J.; Feng, C.; Zeng, G.; Gao, X.; Zhong, M.; Li, X.; Li, X.; He, X.; Fang, Y. Spatial distribution and source identification of heavy metals in surface soils in a typical coal mine city, Lianyuan, China. Environ. Pollut. 2017, 225, 681–690. [Google Scholar] [CrossRef]
- Xiao, R.; Wang, S.; Li, R.; Wang, J.J.; Zhang, Z. Soil heavy metal contamination and health risks associated with artisanal gold mining in Tongguan, Shaanxi, China. Ecotoxicol. Environ. Saf. 2017, 141, 17–24. [Google Scholar] [CrossRef]
- Liang, X.; Song, J.; Duan, L.; Yuan, H.; Li, X.; Li, N.; Qu, B.; Wang, Q.; Xing, J. Source identification and risk assessment based on fractionation of heavy metals in surface sediments of Jiaozhou Bay, China. Mar. Pollut. Bull. 2018, 128, 548–556. [Google Scholar] [CrossRef]
- Yi, Y.; Yang, Z.; Zhang, S. Ecological risk assessment of heavy metals in sediment and human health risk assessment of heavy metals in fishes in the middle and lower reaches of the Yangtze River basin. Environ. Pollut. 2011, 159, 2575–2585. [Google Scholar] [CrossRef]
- Karim, Z.; Qureshi, B.A.; Mumtaz, M.; Qureshi, S. Heavy metal content in urban soils as an indicator of anthropogenic and natural influences on landscape of Karachi—A multivariate spatio-temporal analysis. Ecol. Indic. 2014, 42, 20–31. [Google Scholar] [CrossRef]
- Martín, J.A.R.; Gutiérrez, C.; Escuer, M.; García-González, M.T.; Campos-Herrera, R.; Águila, N. Effect of mine tailing on the spatial variability of soil nematodes from lead pollution in La Union (Spain). Sci. Total Environ. 2014, 473, 518–529. [Google Scholar] [CrossRef] [PubMed]
- Islam, M.S.; Anmed, M.K.; Almamun, M.H.; Islam, S.M.A. Sources and Ecological Risk of Heavy Metals in Soils of Different Land Uses in Bangladesh. Pedosphere 2019, 29, 665–675. [Google Scholar] [CrossRef]
- Vareda, J.P.; Valente, A.J.M.; Durães, L. Assessment of heavy metal pollution from anthropogenic activities and remediation strategies: A review. J. Environ. Manag. 2019, 246, 101–118. [Google Scholar] [CrossRef] [PubMed]
- Enya, O.; Lin, C.; Qin, J. Heavy metal contamination status in soil-plant system in the Upper Mersey Estuarine Floodplain, Northwest England. Mar. Pollut. Bull. 2019, 146, 292–304. [Google Scholar] [CrossRef] [PubMed]
- Lin, C.; Yu, R.; Hu, G.; Yang, Q.; Wang, X. Contamination and isotopic composition of Pb and Sr in offshore surface sediments from Jiulong River, Southeast China. Environ. Pollut. 2016, 218, 644–650. [Google Scholar] [CrossRef] [PubMed]
- Lin, C.; Hu, G.; Yu, R.; Yang, Q.; Yu, W. Pollution assessment and source analysis of heavy metals in offshore surface sediments from Jiulong River. China Environ. Sci. 2016, 36, 1218–1225. [Google Scholar]
- Liu, J.; Han, G.; Liu, X.; Yang, K.; Li, X.; Liu, M. Examining the Distribution and Variation of Dissolved Carbon Species and Seasonal Carbon Exports within the Jiulongjiang River Basin (Southeast China). J. Coast. Res. 2019, 35. [Google Scholar] [CrossRef]
- Wang, W.; Chen, H.; Chen, M.; Lin, W.; Lin, Q.; Ding, G.; Gong, J. Ecological Environment Analysis of Soil and Water Conservation in Jiulong River Watershed. Res. Soil Water Conserv. 2002, 9, 8–11. [Google Scholar]
- Li, X.; Han, G.; Liu, M.; Yang, K.; Liu, J. Hydro-geochemistry of the river water in the Jiulongjiang River basin, Southeast China: Implications of anthropogenic inputs and chemical weathering. Int. J. Environ. Res. Public Health 2019, 16, 440. [Google Scholar] [CrossRef]
- Liang, B.; Han, G.; Liu, M.; Yang, K.; Li, X.; Liu, J. Distribution, sources, and water quality assessment of dissolved heavy metals in the Jiulongjiang River water, Southeast China. Int. J. Environ. Res. Public Health 2018, 15, 2752. [Google Scholar] [CrossRef]
- Li, C.; Sun, G.; Wu, Z.; Zhong, H.; Wang, R.; Liu, X.; Guo, Z.; Cheng, J. Soil physiochemical properties and landscape patterns control trace metal contamination at the urban-rural interface in southern China. Environ. Pollut. 2019, 250, 537–545. [Google Scholar] [CrossRef] [PubMed]
- Yang, K.; Han, G.; Liu, M.; Li, X.; Liu, J.; Zhang, Q. Spatial and seasonal variation of O and H isotopes in the Jiulong River, Southeast China. Water 2018, 10, 1677. [Google Scholar] [CrossRef]
- Huang, J.; Li, Q.; Hong, H.; Lin, J.; Qu, M. Preliminary study on linking land use/landscape pattern and water quality in the Jiulong River watershed. Environ. Sci. 2011, 32, 64–72. [Google Scholar]
- Zhang, Q.; Han, G.; Liu, M.; Liang, T. Spatial distribution and controlling factors of heavy metals in soils from Puding Karst Critical Zone Observatory, southwest China. Environ. Earth Sci. 2019, 78, 279. [Google Scholar] [CrossRef]
- Liu, M.; Han, G.; Zhang, Q.; Song, Z. Variations and Indications of δ13CSOC and δ15NSON in Soil Profiles in Karst Critical Zone Observatory (CZO), Southwest China. Sustainability 2019, 11, 2144. [Google Scholar] [CrossRef] [Green Version]
- Liu, M.; Han, G.; Zhang, Q. Effects of agricultural abandonment on soil aggregation, soil organic carbon storage and stabilization: Results from observation in a small karst catchment, Southwest China. Agric. Ecosyst. Environ. 2020, 288, 106719. [Google Scholar] [CrossRef]
- Barbieri, M. The importance of enrichment factor (EF) and geoaccumulation index (Igeo) to evaluate the soil contamination. J. Geol. Geophys. 2016, 237, 1–4. [Google Scholar] [CrossRef]
- Müller, G. Index of geoaccumulation in sediments of the Rhine River. Geol. J. 1969, 2, 108–118. [Google Scholar]
- Hakanson, L. An ecological risk index for aquatic pollution control, a sediment-ecological approach. Water Res. 1980, 14, 975–1001. [Google Scholar] [CrossRef]
- China Environmental Monitoring Station: Background Value of Elements in Soils of China; China Environmental Science Press: Beijing, China, 1990; pp. 94–367.
- Zeng, F.; Ali, S.; Zhang, H.; Ouyang, Y.; Qiu, B.; Wu, F.; Zhang, G. The influence of pH and organic matter content in paddy soil on heavy metal availability and their uptake by rice plants. Environ. Pollut. 2011, 159, 84–91. [Google Scholar] [CrossRef]
- Lv, J.; Liu, Y.; Zhang, Z.; Dai, J.; Dai, B.; Zhu, Y. Identifying the origins and spatial distributions of heavy metals in soils of Ju country (Eastern China) using multivariate and geostatistical approach. J. Soil Sediments 2015, 15, 163–178. [Google Scholar] [CrossRef]
- Chen, T.; Liu, X.; Zhu, M.; Zhao, K.; Wu, J.; Xu, J.; Huang, P. Identification of trace element sources and associated risk assessment in vegetable soils of the urban–rural transitional area of Hangzhou, China. Environ. Pollut. 2008, 151, 67–78. [Google Scholar] [CrossRef] [PubMed]
- Dumat, C.; Quenea, K.; Bermond, A.; Toinen, S.; Benedetti, M.F. Study of the trace metal ion influence on the turnover of soil organic matter in cultivated contaminated soils. Environ. Pollut. 2006, 142, 521–529. [Google Scholar] [CrossRef] [PubMed]
- Wang, H. Advances of metal pollution study in soils. Environ. Chem. 1991, 10, 35–42. [Google Scholar]
- Li, F.; Huang, J.; Zeng, G.; Yuan, X.; Li, X.; Liang, J.; Wang, X.; Tang, X.; Bai, B. Spatial risk assessment and sources identification of heavy metals in surface sediments from the Dongting Lake, Middle China. J. Geochem. Explor. 2013, 132, 75–83. [Google Scholar] [CrossRef]
- Gray, C.W.; McLaren, R.G.; Roberts, A.H.C.; Condron, L.M. The effect of long-term phosphatic fertiliser applications on the amounts and forms of cadmium in soils under pasture in New Zealand. Nutr. Cycl. Agroecosyst. 1999, 54, 267–277. [Google Scholar] [CrossRef]
- Fu, C.; Guo, H.; Pan, J.; Qi, J.; Zhou, W. Potential ecological risk assessment of heavy metal pollution in sediments of the Yangtze River within the Wanzhou section, China. Biol. Trace Elem. Res. 2009, 129, 270–277. [Google Scholar] [CrossRef]


| Sampling Site | Depth (cm) | Land-Use Types | Soil Types | Visible Characteristics |
|---|---|---|---|---|
| YS | 100 | Abandoned agricultural land (tea plantation had been abandoned and covered by weed) | Yellow soil | 0–30 cm, gray humus layer, fine sand, loose 30–50 cm, gray mixed red, fine sand, loose 50–100 cm, yellow, clay-grained, tight |
| RL | 100 | Forest land | Red loam | 0–40 cm, dark brown humus layer, mixed coarse sand, loose 40–70 cm, gray, mixed coarse sand, loose 70–100 cm, red, mixed coarse sand, loose |
| RS | 100 | Forest land | Red soil | 0–65 cm, gray red humus layer, fine-grained, loose 65–100 cm, red, fine particles, loose |
| Sampling Site | Cr | Mn | Fe | Cu | Zn | Cd | Pb | |
|---|---|---|---|---|---|---|---|---|
| YS | TP | −0.081 | 0.269 | 0.105 | −0.492 * | −0.177 | 0.516 * | 0.030 |
| pH | −0.848 ** | 0.103 | −0.712 ** | −0.376 | −0.953 ** | 0.714 ** | 0.427 | |
| SON | −0.639 ** | 0.553 ** | −0.587 ** | −0.121 | −0.657 ** | 0.587 ** | 0.578 ** | |
| SOC | −0.747 ** | 0.375 | −0.624 ** | −0.318 | −0.830 ** | 0.731 ** | 0.502 * | |
| Clay | 0.422 | −0.330 | 0.450 * | −0.012 | 0.434 * | −0.075 | −0.104 | |
| RL | TP | 0.060 | 0.677 ** | −0.375 | −0.267 | 0.246 | 0.879 ** | 0.653 ** |
| pH | −0.101 | 0.603 ** | −0.420 | −0.267 | 0.274 | 0.886 ** | 0.662 ** | |
| SON | −0.204 | 0.738 ** | −0.184 | −0.286 | 0.448 * | 0.802 ** | 0.869 ** | |
| SOC | −0.121 | 0.726** | −0.232 | −0.240 | 0.428 | 0.803 ** | 0.842 ** | |
| Clay | 0.083 | 0.391 | 0.264 | 0.045 | 0.314 | 0.158 | 0.174 | |
| RS | TP | 0.630 ** | 0.790 ** | 0.701 ** | 0.627 ** | 0.273 | 0.088 | −0.123 |
| pH | −0.300 | 0.047 | −0.289 | −0.269 | −0.107 | −0.294 | −0.200 | |
| SON | 0.151 | 0.624 ** | 0.363 | 0.364 | −0.059 | 0.233 | −0.091 | |
| SOC | 0.153 | 0.583 ** | 0.312 | 0.307 | −0.152 | 0.110 | −0.220 | |
| Clay | 0.422 | 0.210 | 0.396 | 0.250 | 0.201 | −0.094 | 0.154 |
| Cr | Mn | Fe | Cu | Zn | Cd | Pb | Ni | |
|---|---|---|---|---|---|---|---|---|
| Cr | 1 | |||||||
| Mn | −0.267 * | 1 | ||||||
| Fe | 0.697 ** | −0.158 | 1 | |||||
| Cu | 0.436 ** | 0.130 | 0.555 ** | 1 | ||||
| Zn | 0.553 ** | 0.141 | 0.617 ** | 0.428 ** | 1 | |||
| Cd | 0.083 | 0.336 ** | 0.432 ** | 0.719 ** | 0.118 | 1 | ||
| Pb | 0.262 * | 0.164 | 0.565 ** | 0.833 ** | 0.390 ** | 0.877 ** | 1 | |
| Ni | 0.759 ** | −0.326 ** | 0.774 ** | 0.666 ** | 0.641 ** | 0.312 * | 0.593 ** | 1 |
| Sampling Site | Depth (cm) | Er | RI | |||||
|---|---|---|---|---|---|---|---|---|
| Cr | Cu | Zn | Cd | Pb | Ni | |||
| YS | 0 | 2.97 | 1.64 | 0.38 | 166.17 | 2.53 | 2.10 | 175.79 |
| 30 | 4.32 | 0.75 | 0.47 | 148.64 | 2.07 | 2.03 | 158.28 | |
| 60 | 4.14 | 1.77 | 0.55 | 138.55 | 2.42 | 2.63 | 150.05 | |
| 100 | 4.39 | 2.20 | 0.54 | 92.84 | 2.38 | 2.57 | 104.92 | |
| RL | 0 | 3.59 | 0.63 | 0.71 | 74.29 | 1.64 | 0.93 | 81.81 |
| 30 | 3.26 | 0.43 | 0.34 | 40.76 | 1.04 | 1.00 | 46.83 | |
| 60 | 3.37 | 0.41 | 0.35 | 30.42 | 0.96 | 1.15 | 36.66 | |
| 100 | 2.46 | 0.67 | 0.53 | 16.54 | 1.21 | 1.60 | 23.01 | |
| RS | 0 | 4.59 | 1.44 | 0.60 | 52.93 | 1.96 | 2.99 | 64.51 |
| 30 | 3.58 | 0.60 | 0.41 | 27.22 | 1.46 | 2.12 | 35.39 | |
| 60 | 3.70 | 0.88 | 0.45 | 34.95 | 1.55 | 2.40 | 43.93 | |
| 100 | 3.67 | 0.63 | 0.51 | 41.97 | 1.94 | 2.12 | 50.83 |
© 2019 by the authors. Licensee MDPI, Basel, Switzerland. This article is an open access article distributed under the terms and conditions of the Creative Commons Attribution (CC BY) license (http://creativecommons.org/licenses/by/4.0/).
Share and Cite
Zhang, Q.; Han, G.; Liu, M.; Li, X.; Wang, L.; Liang, B. Distribution and Contamination Assessment of Soil Heavy Metals in the Jiulongjiang River Catchment, Southeast China. Int. J. Environ. Res. Public Health 2019, 16, 4674. https://0-doi-org.brum.beds.ac.uk/10.3390/ijerph16234674
Zhang Q, Han G, Liu M, Li X, Wang L, Liang B. Distribution and Contamination Assessment of Soil Heavy Metals in the Jiulongjiang River Catchment, Southeast China. International Journal of Environmental Research and Public Health. 2019; 16(23):4674. https://0-doi-org.brum.beds.ac.uk/10.3390/ijerph16234674
Chicago/Turabian StyleZhang, Qian, Guilin Han, Man Liu, Xiaoqiang Li, Lingqing Wang, and Bin Liang. 2019. "Distribution and Contamination Assessment of Soil Heavy Metals in the Jiulongjiang River Catchment, Southeast China" International Journal of Environmental Research and Public Health 16, no. 23: 4674. https://0-doi-org.brum.beds.ac.uk/10.3390/ijerph16234674