A Machine Learning Ensemble Approach Based on Random Forest and Radial Basis Function Neural Network for Risk Evaluation of Regional Flood Disaster: A Case Study of the Yangtze River Delta, China


Abstract
:1. Introduction
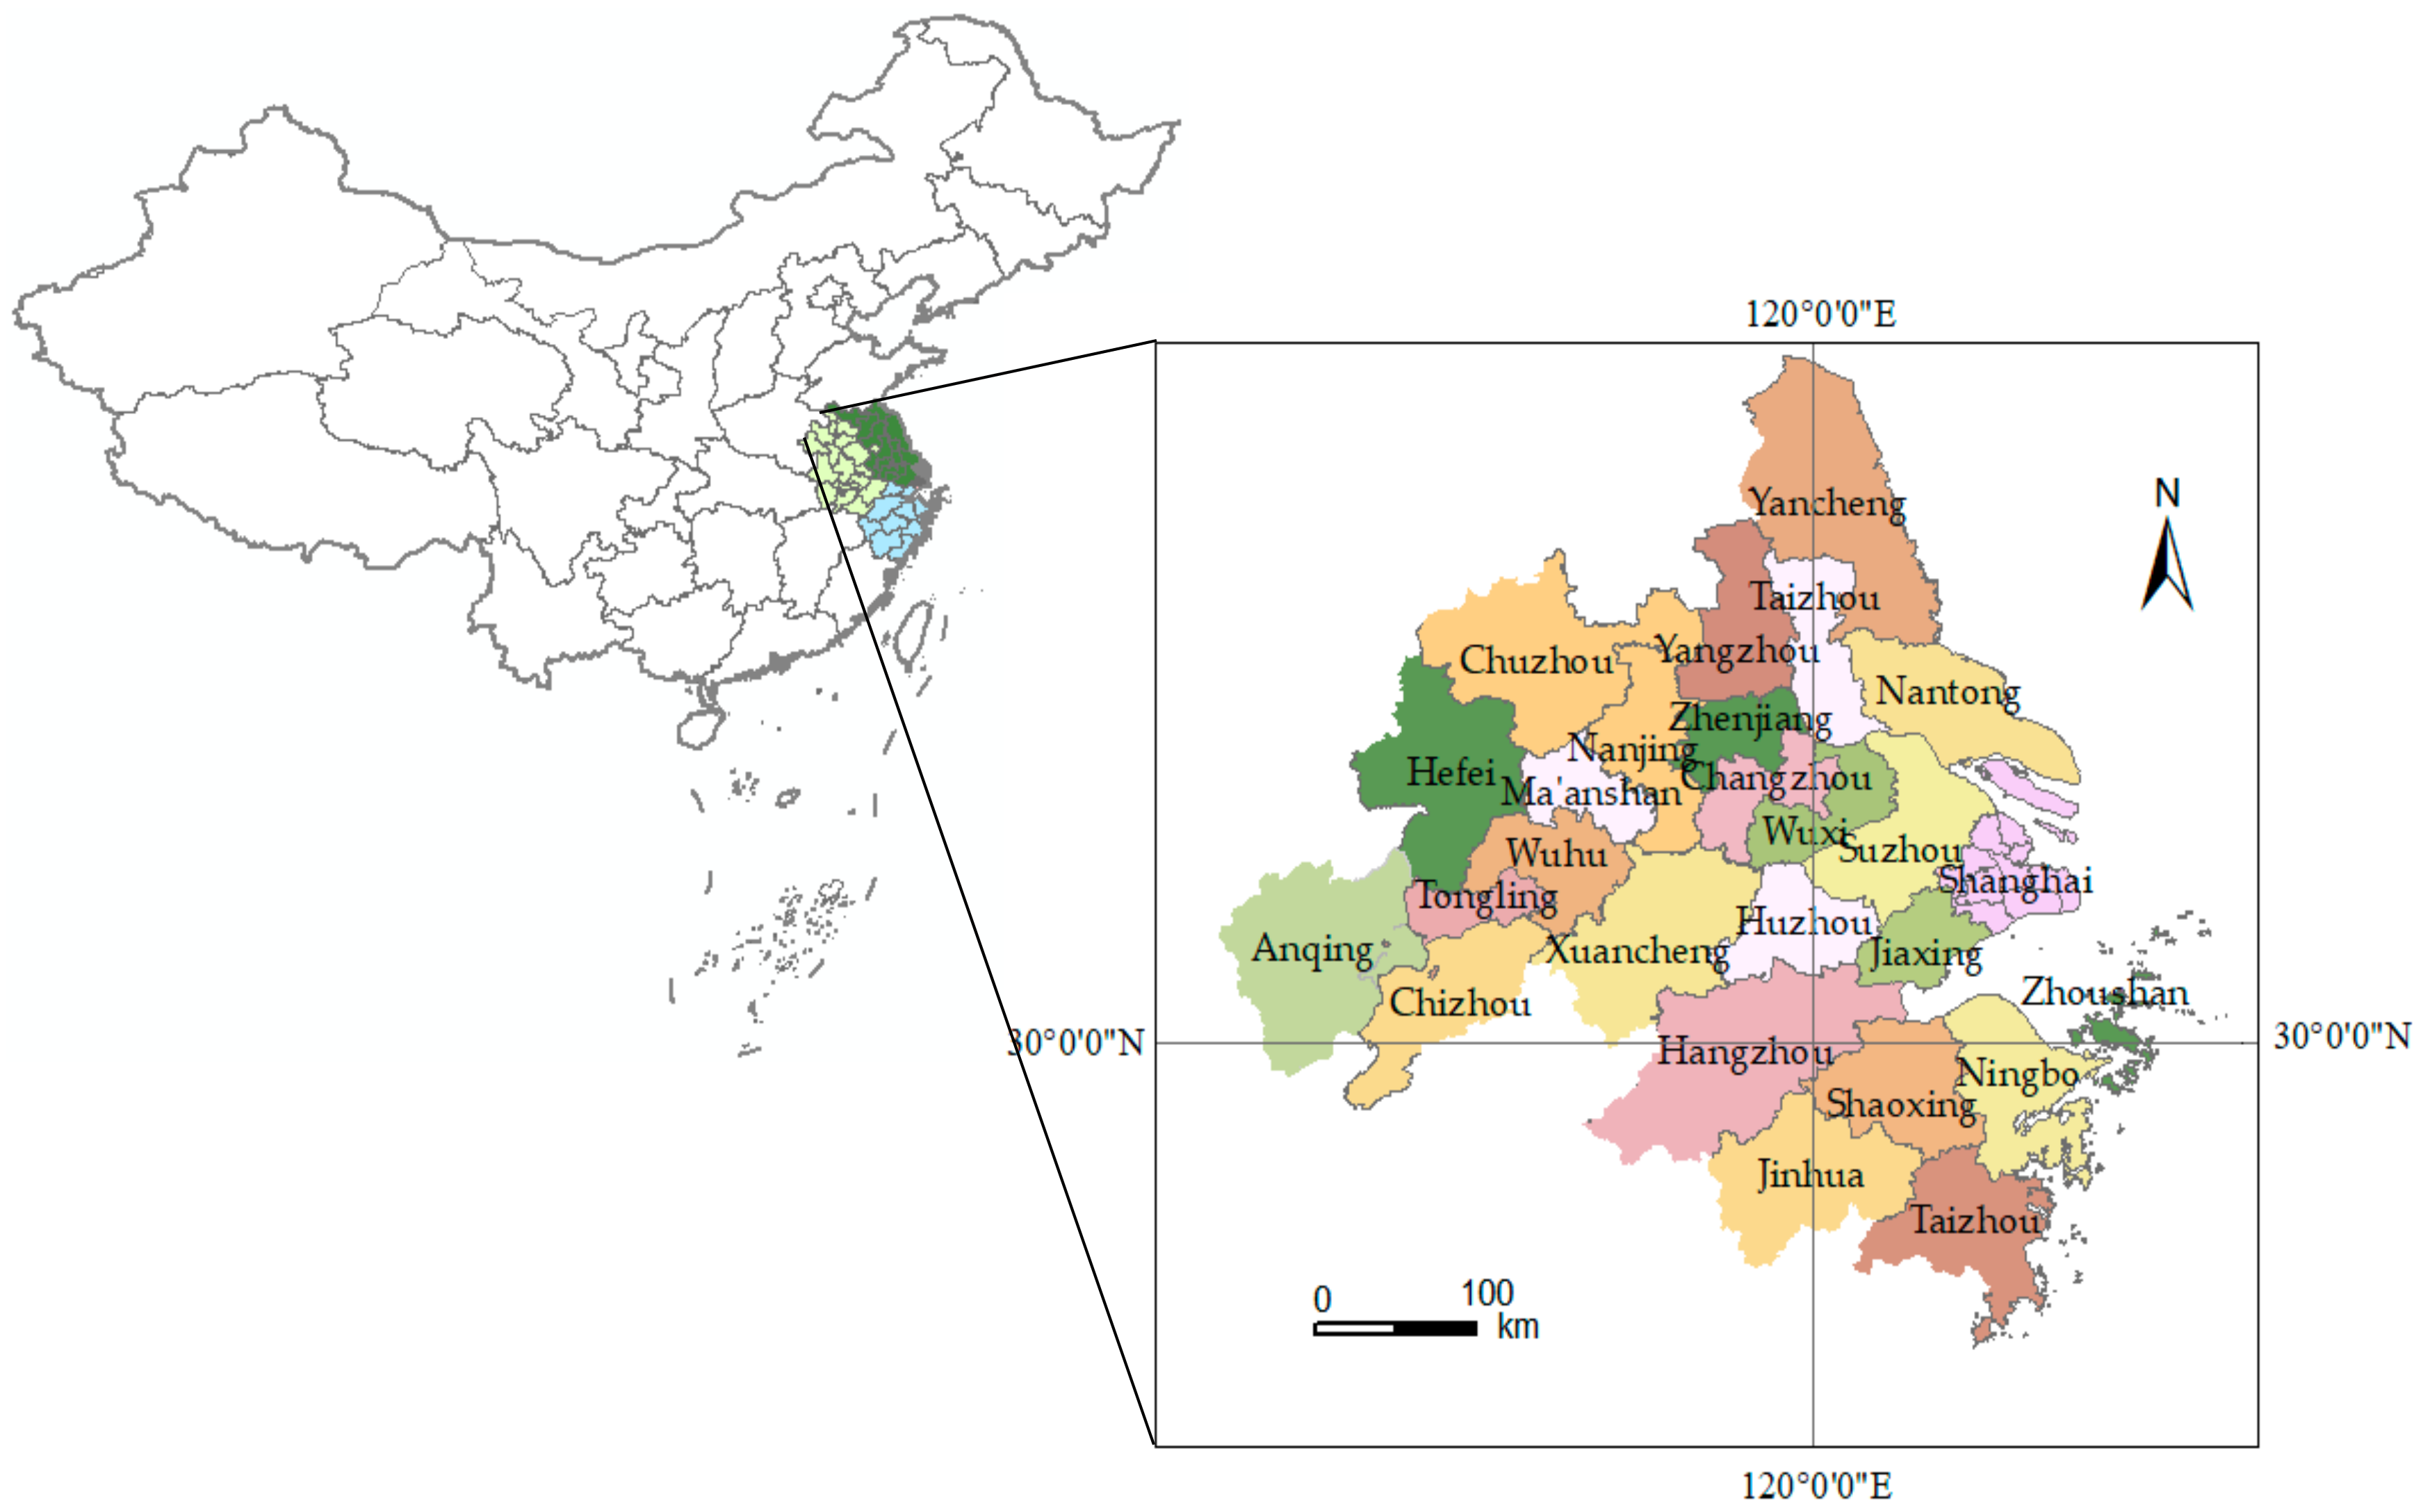
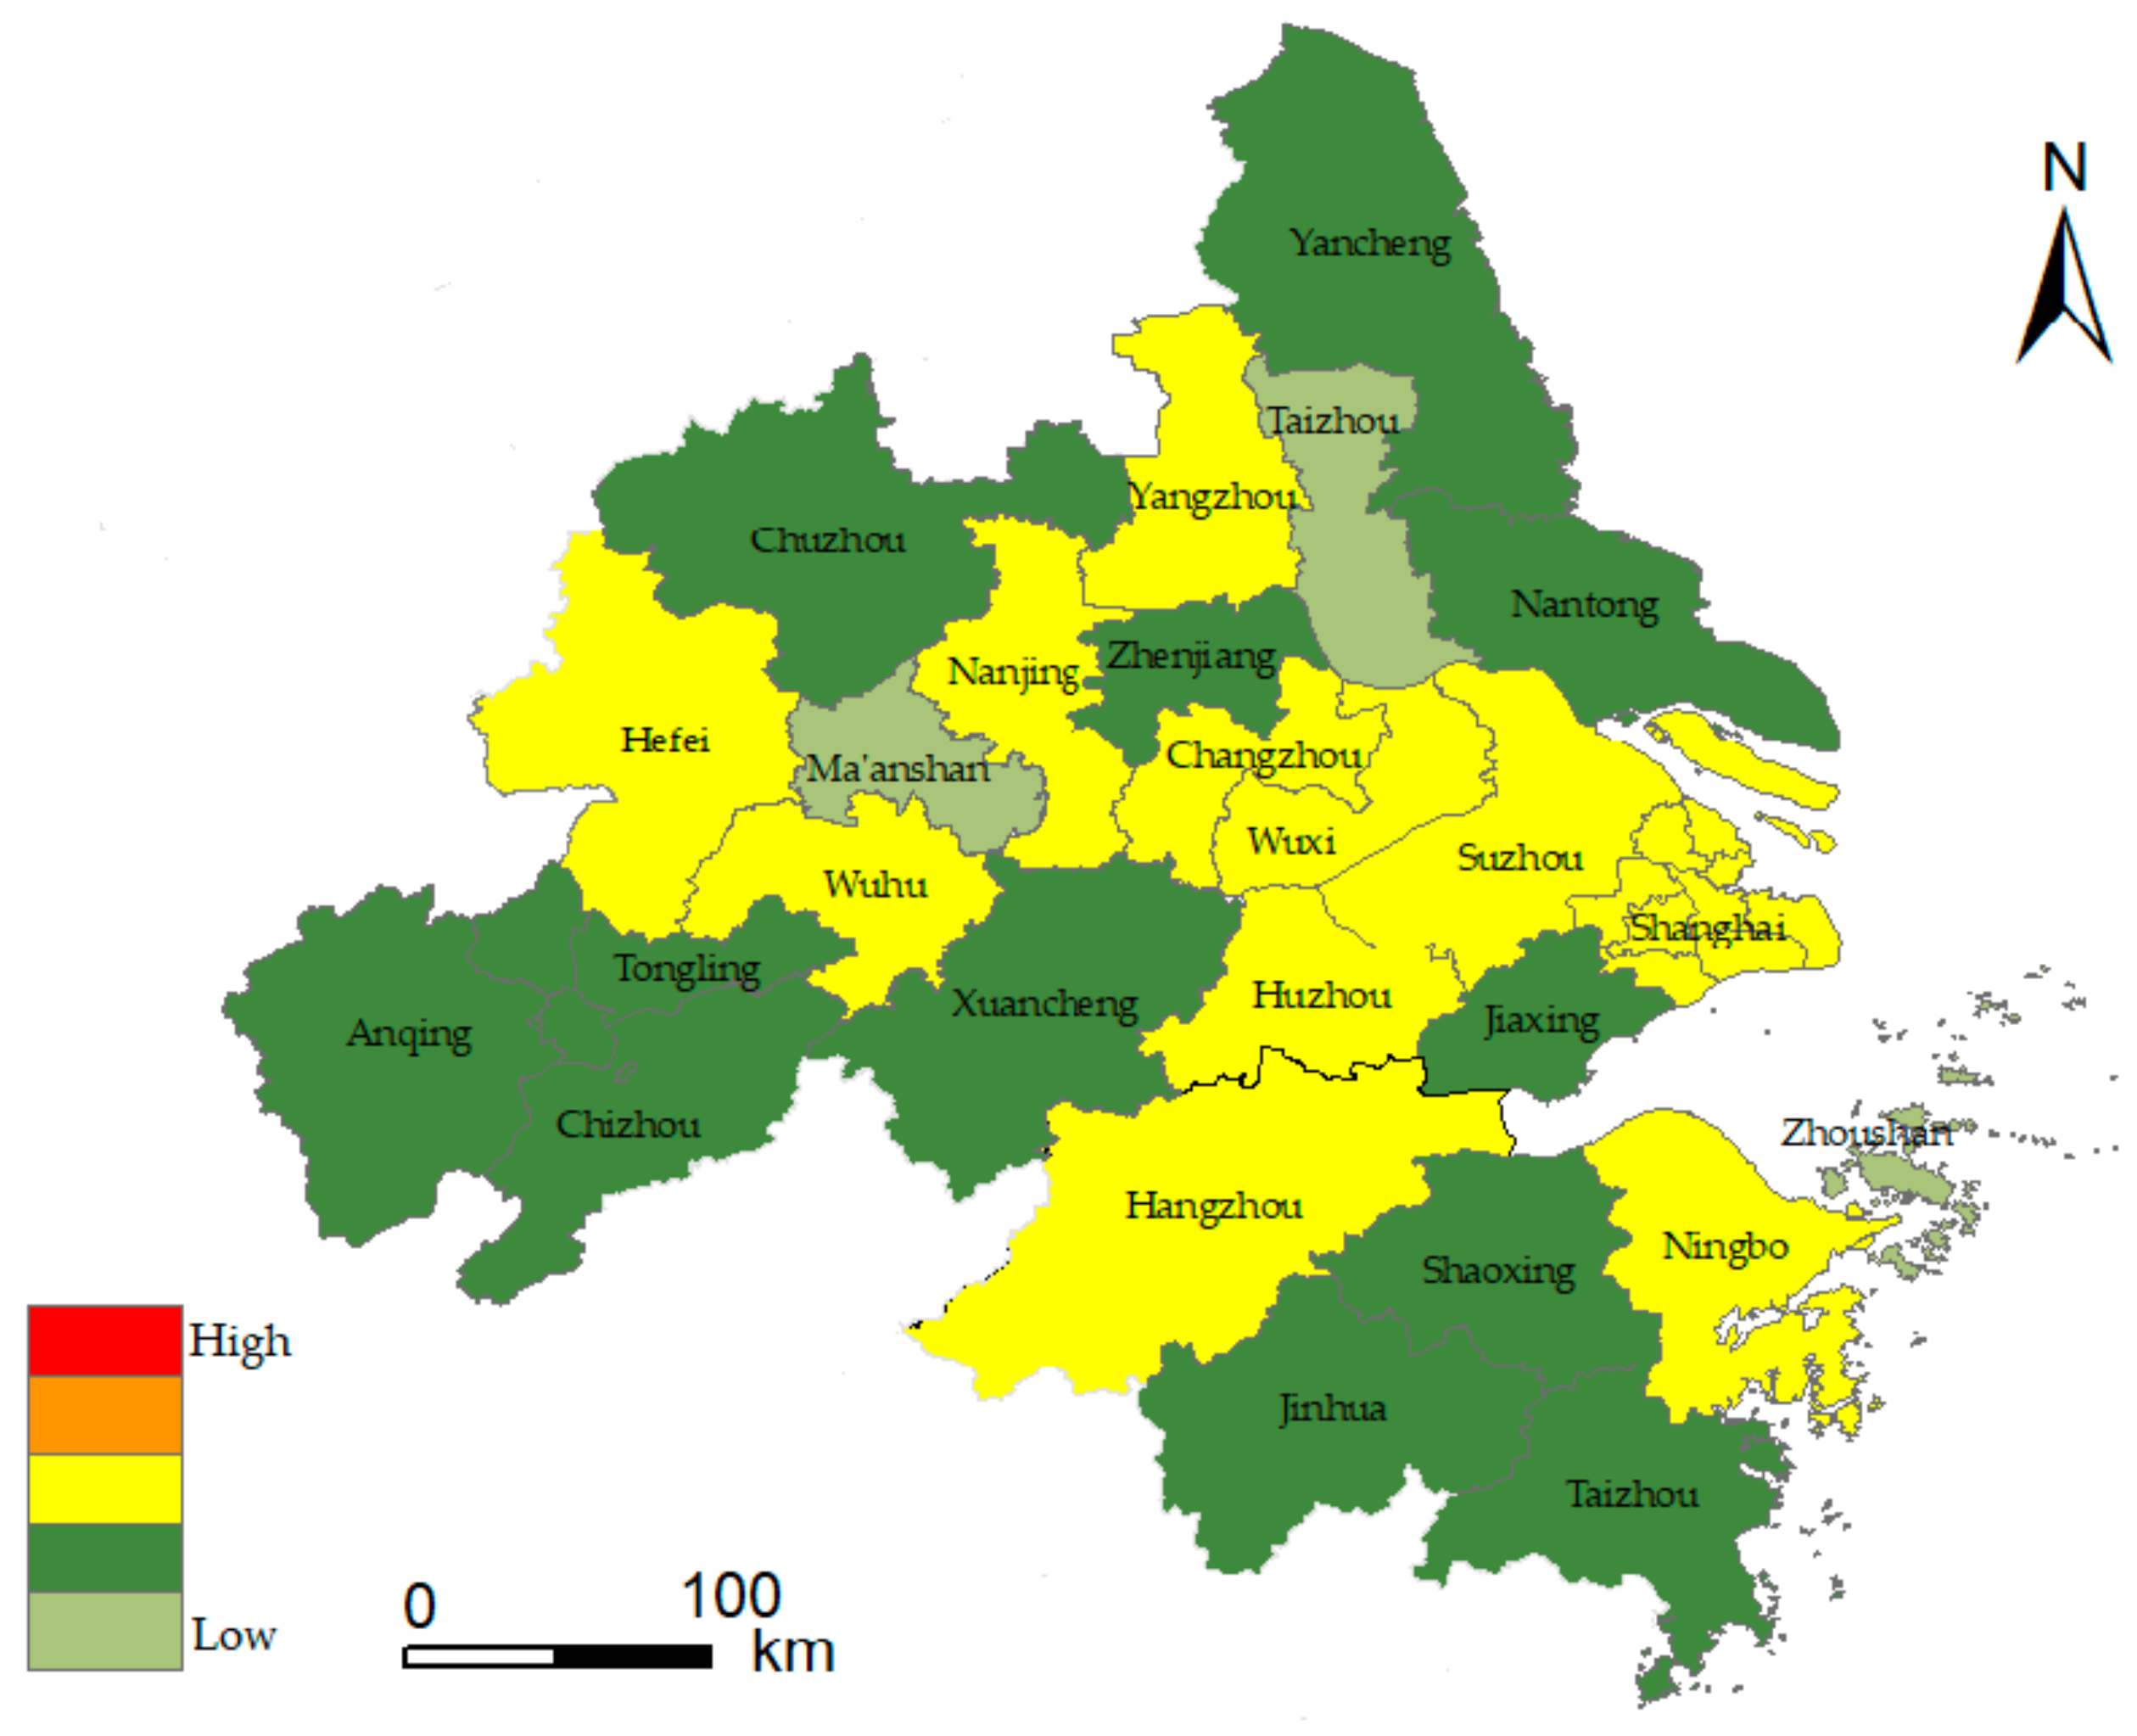
2. Study Area
3. Material and Methods
3.1. Data Sources
3.2. Research Methods
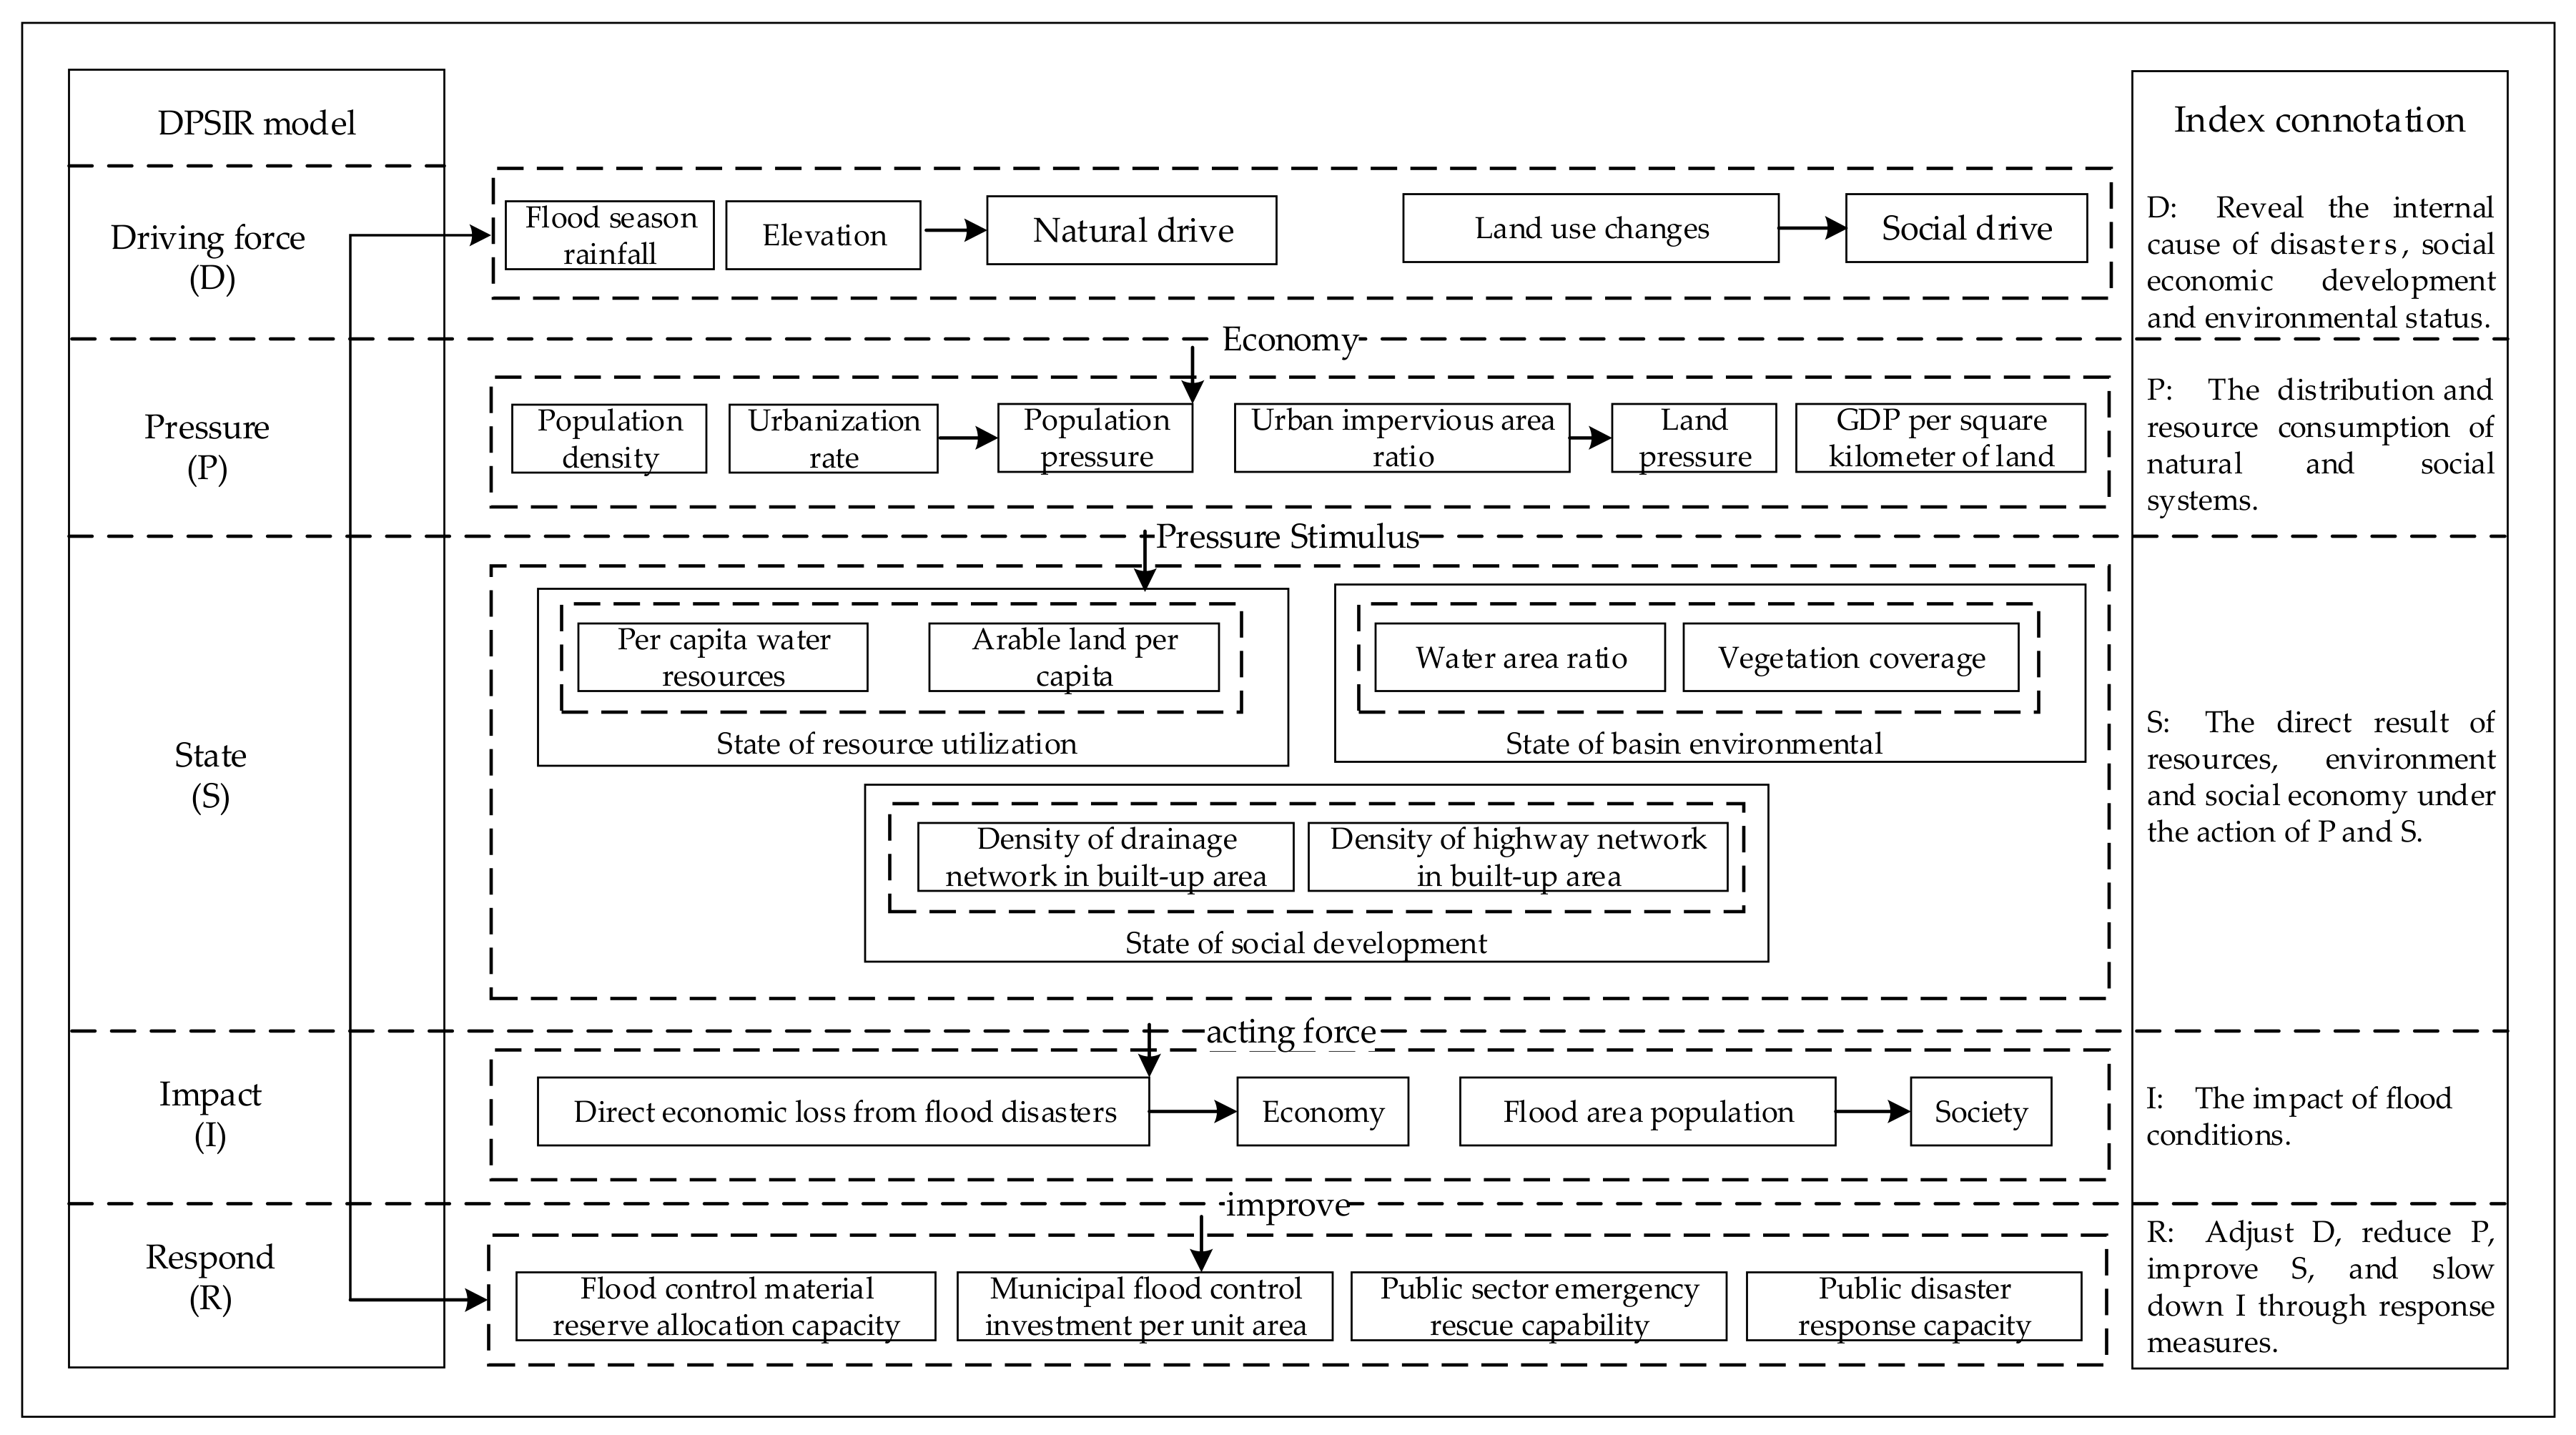
3.2.1. DPSIR Conceptual Framework
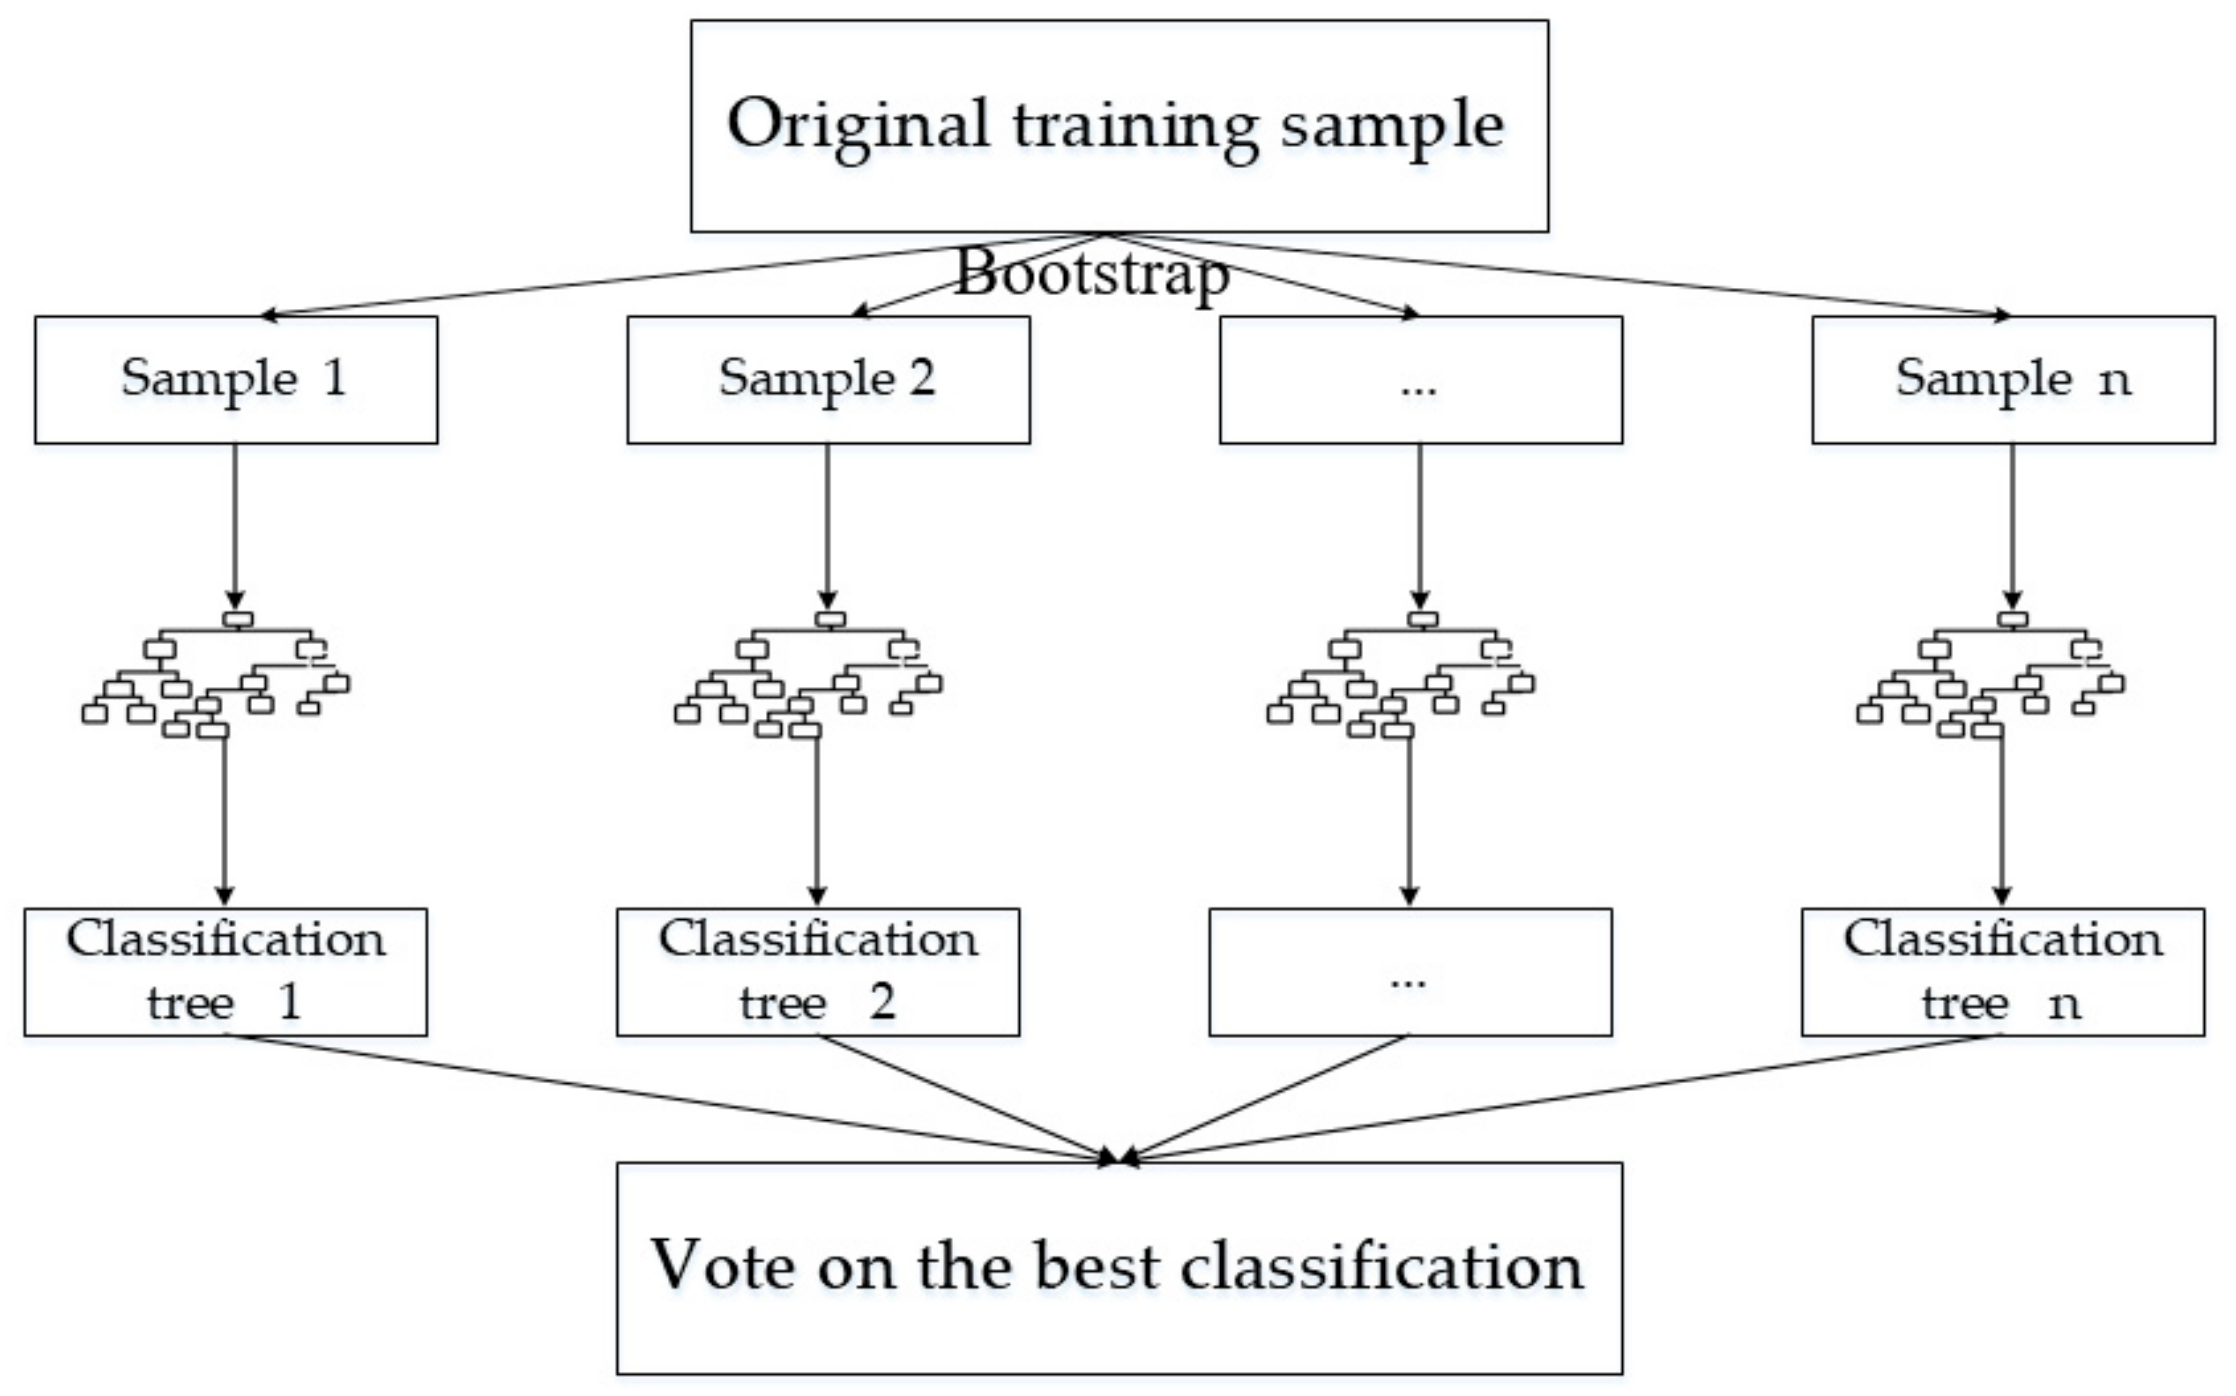
3.2.2. Random Forest
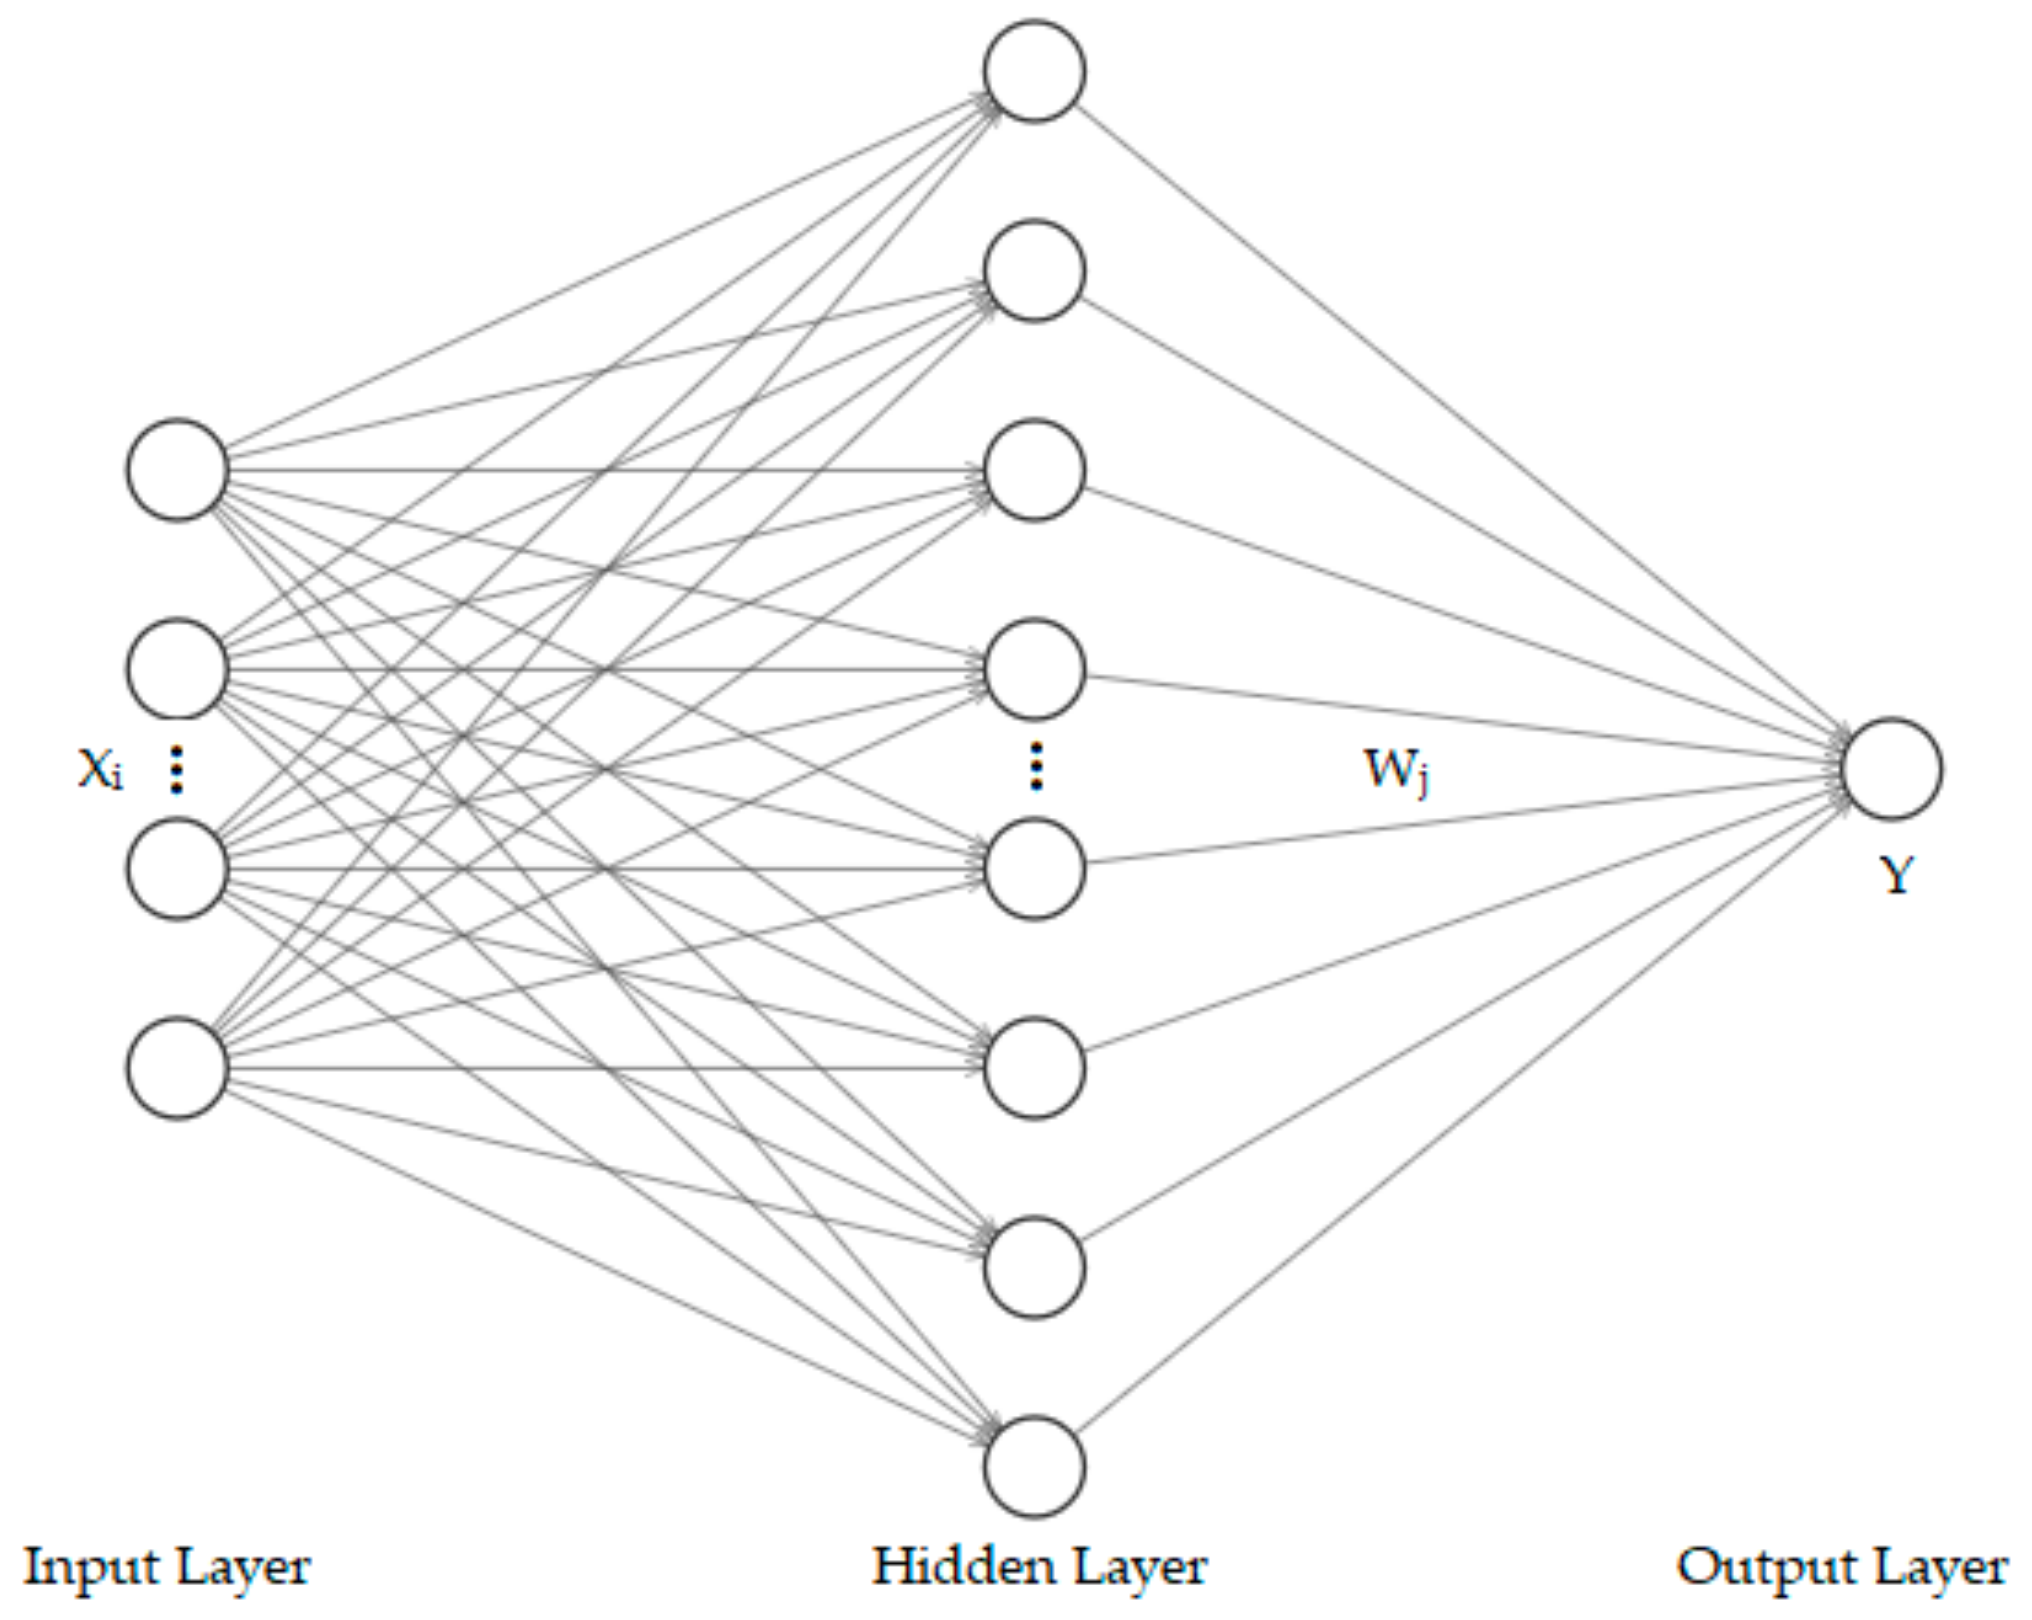
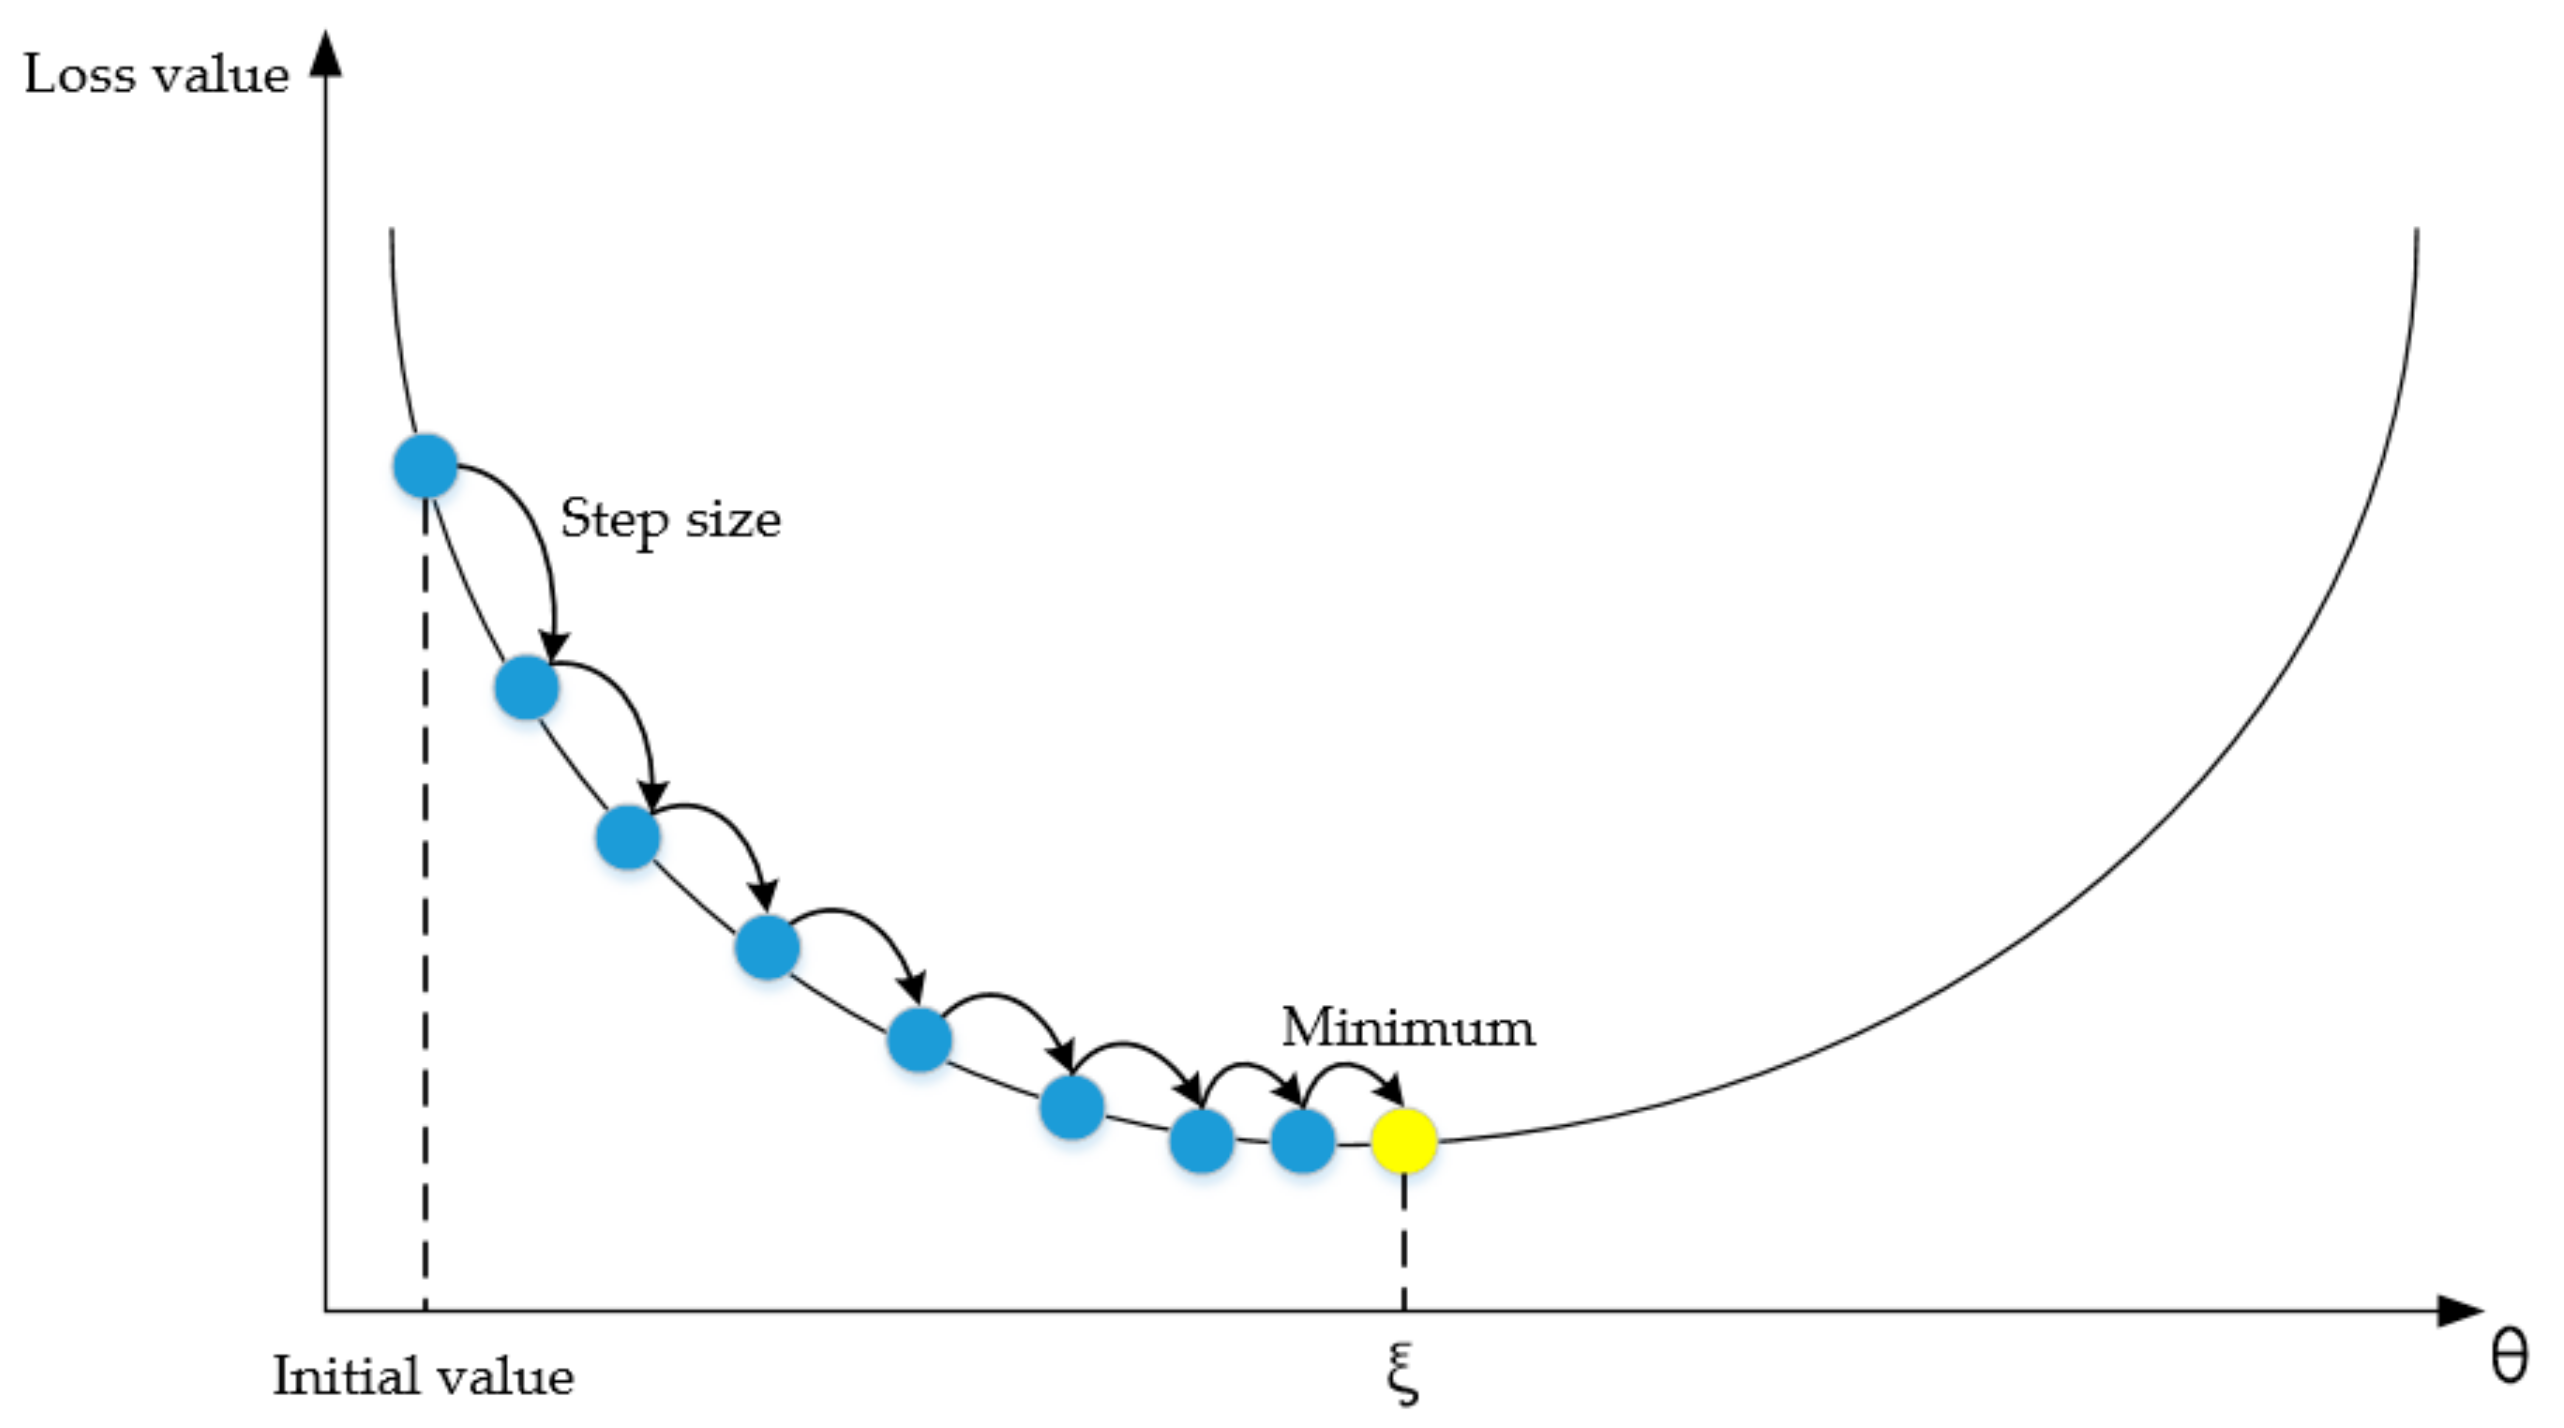
3.2.3. Radial Basis Function Neural Network
4. A Case Study in Yangtze River Delta (YRD)
4.1. System of Evaluation Index
4.2. Data Processing
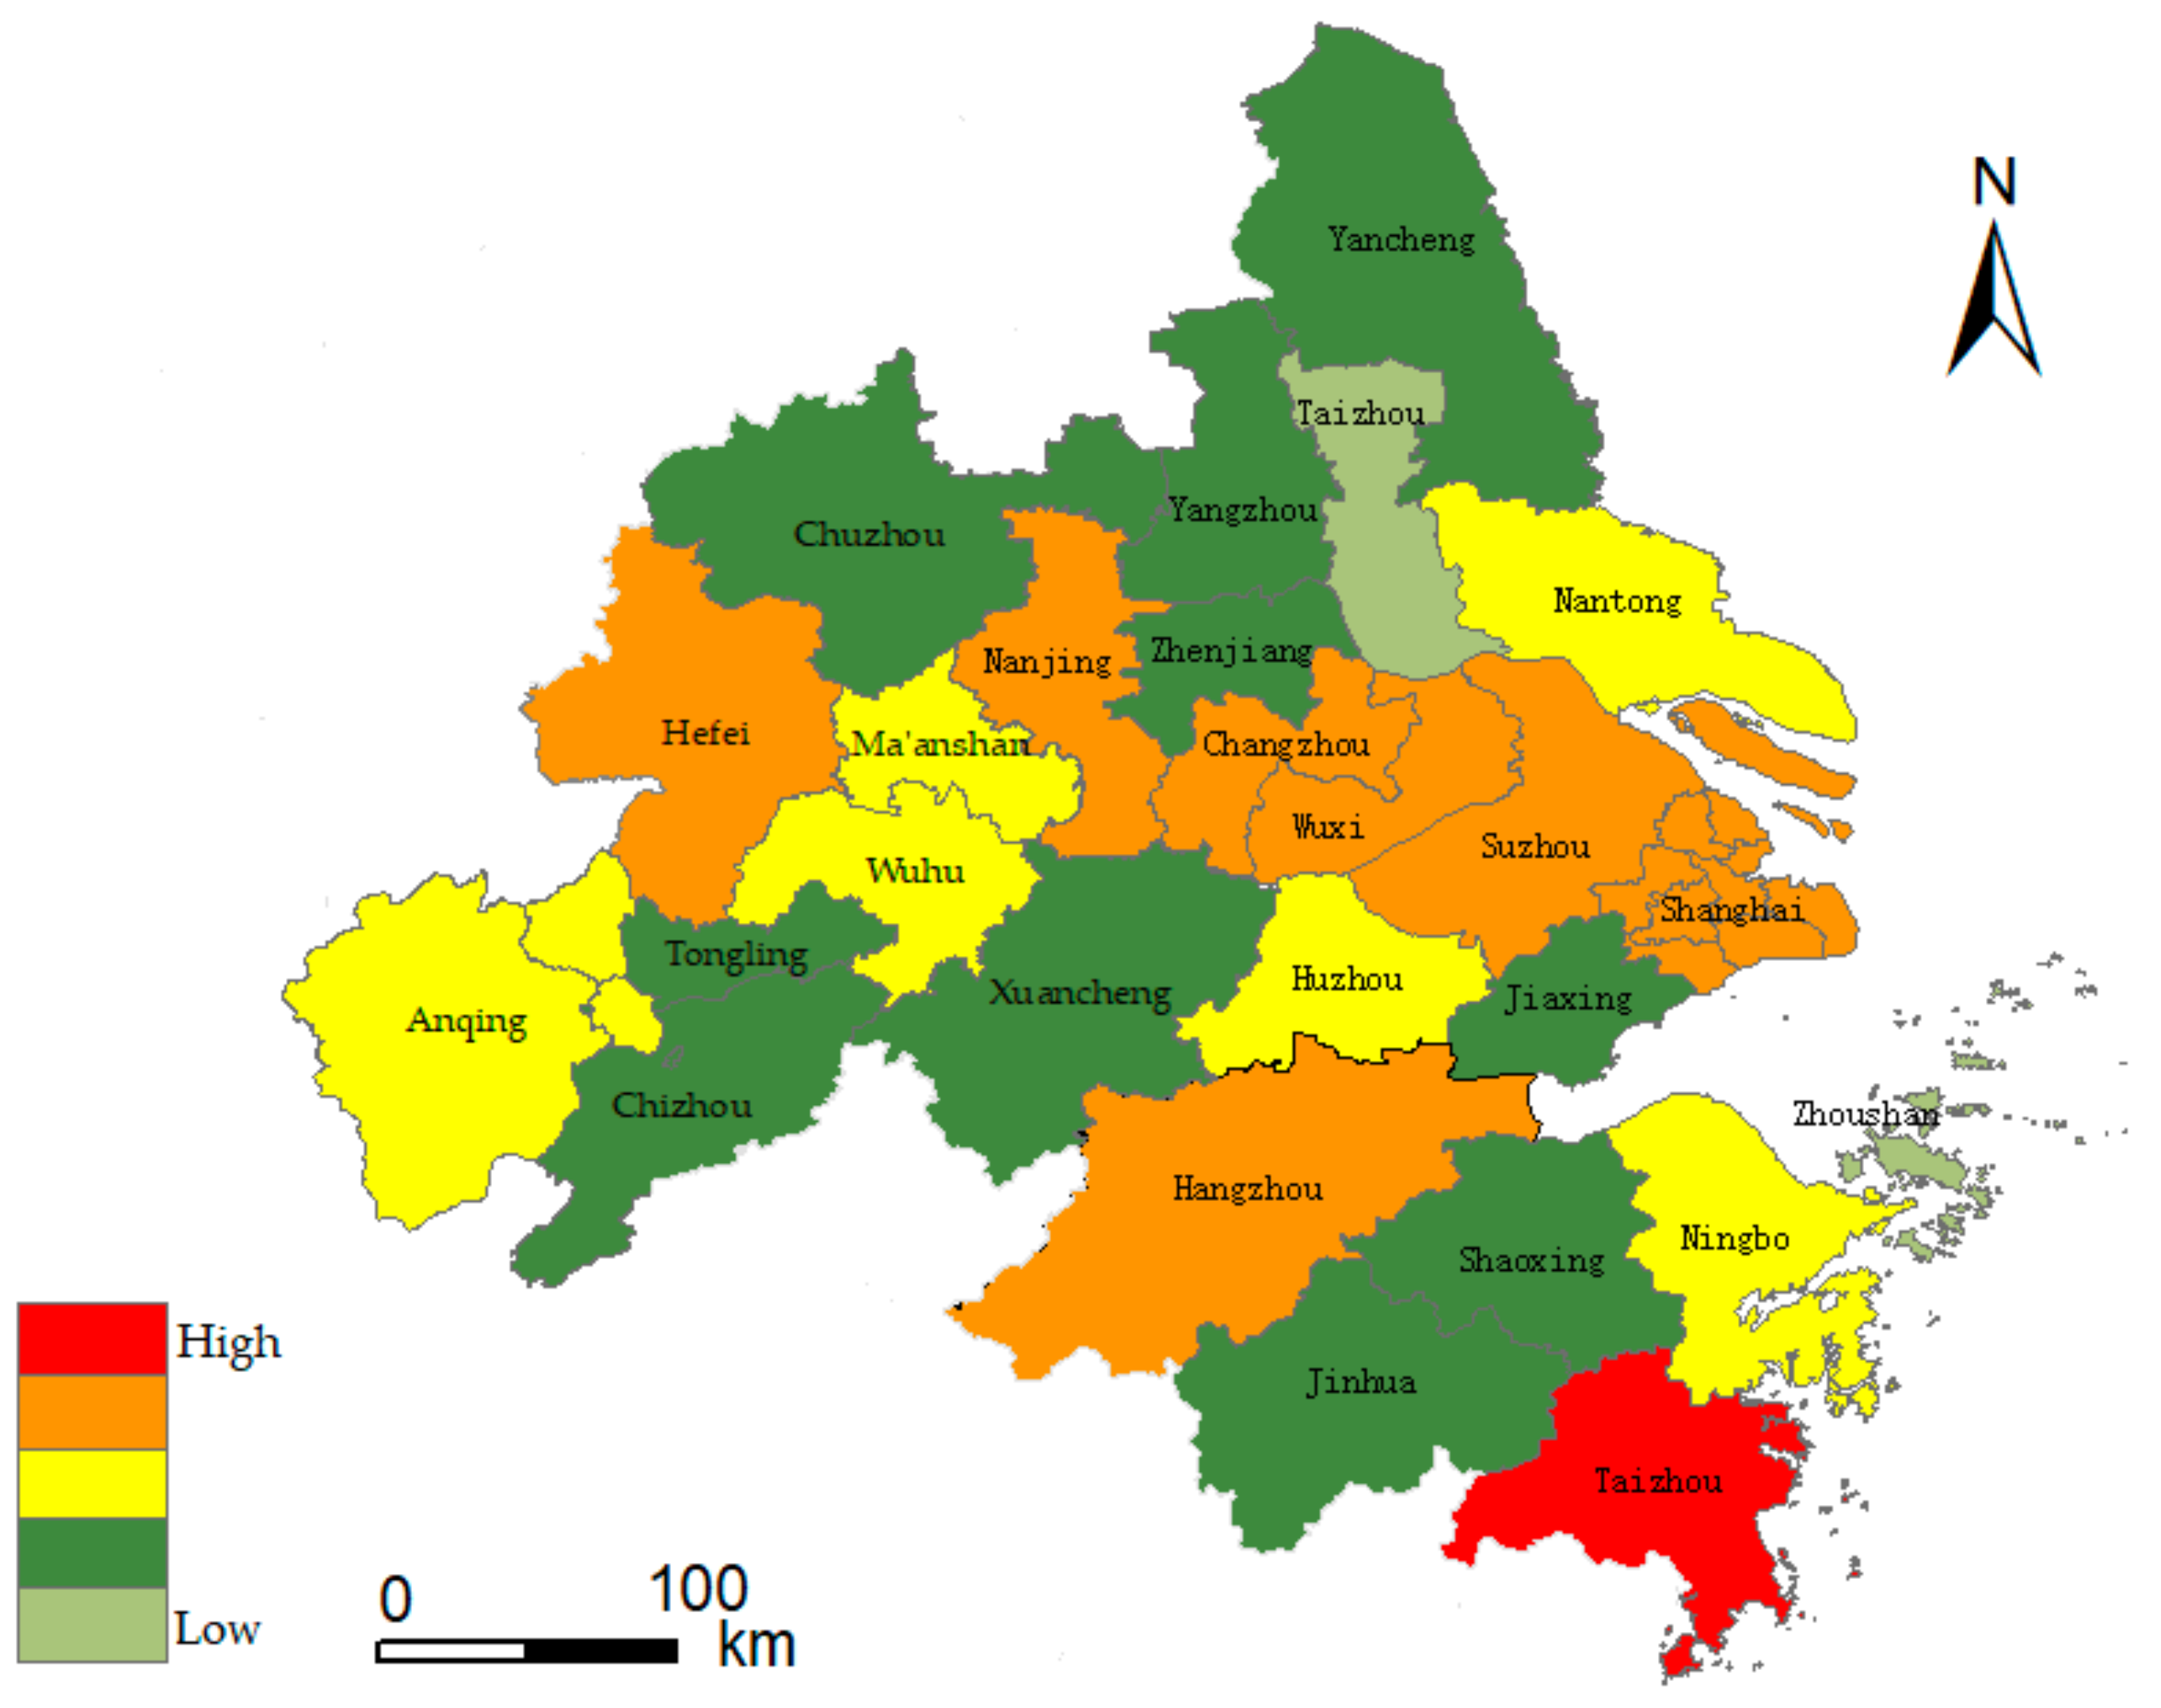
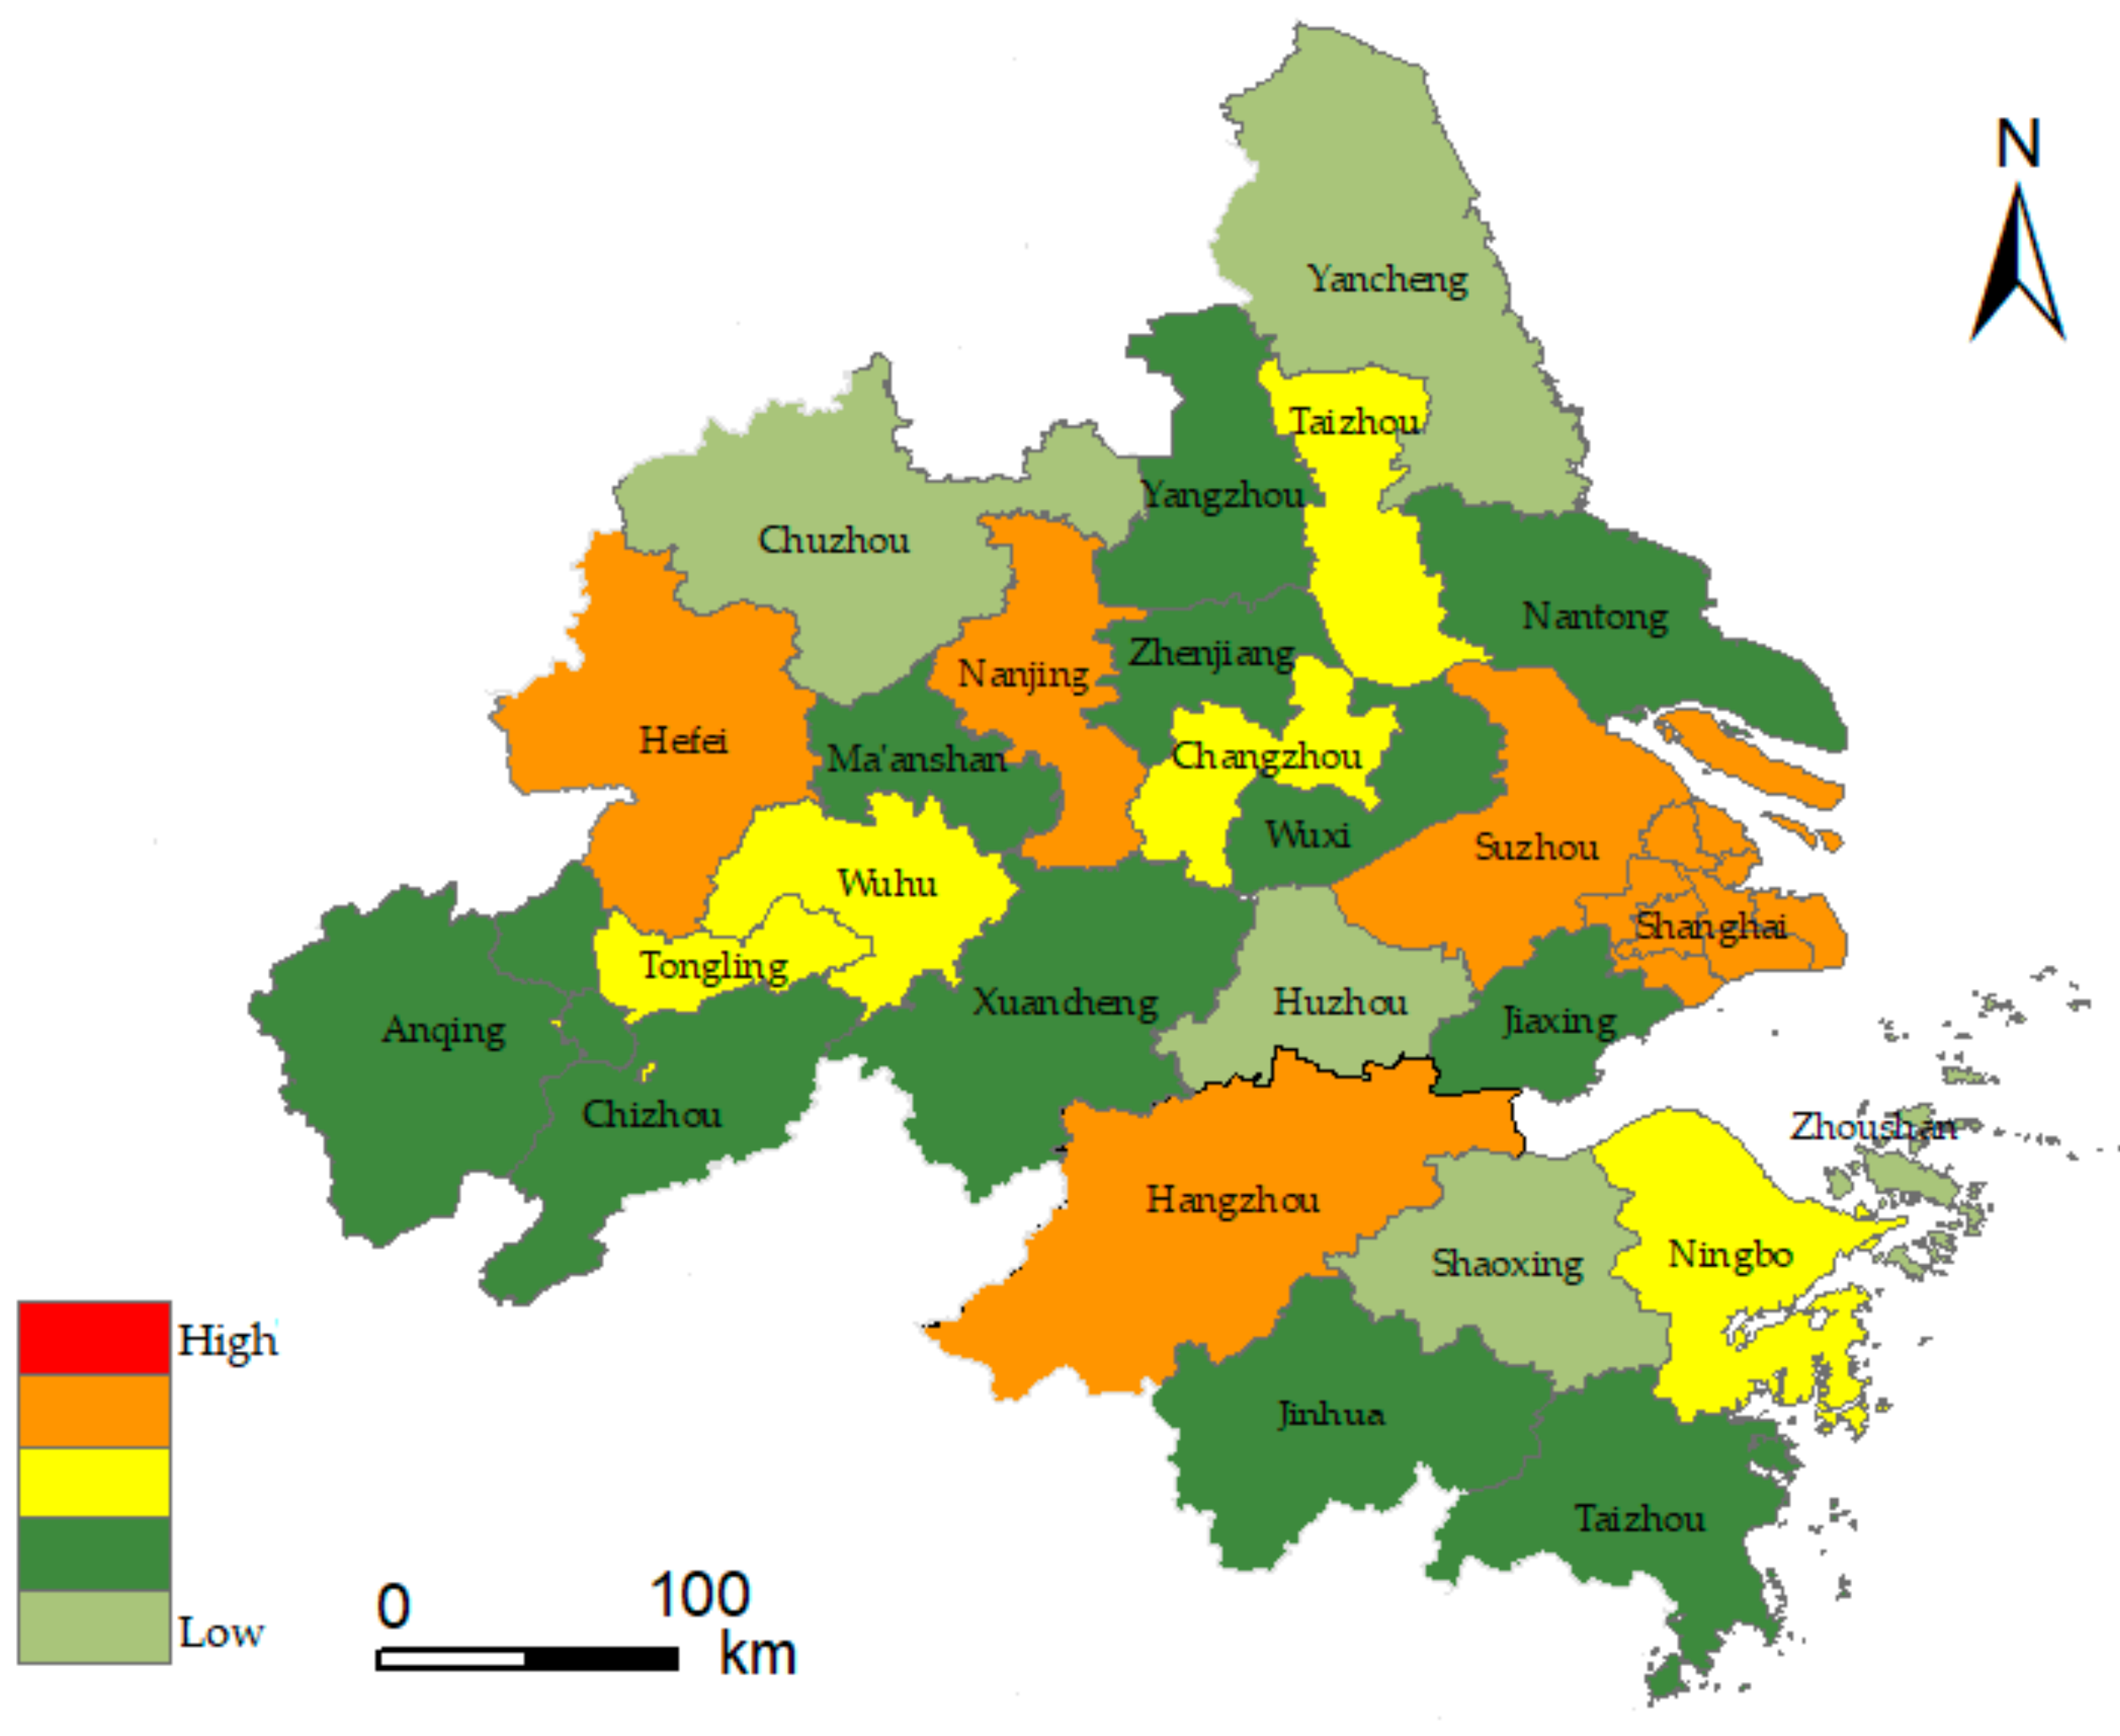
4.3. Research Results
5. Discussions
5.1. Results Analysis
5.2. Regulation Countermeasures
6. Conclusions
Author Contributions
Funding
Conflicts of Interest
References
- Ward, P.J.; Jongman, B.; Weiland, F.S.; Bouwman, A.; van Beek, R.; Bierkens, M.F.P.; Ligtvoet, W.; Winsemius, H.C. Assessing flood risk at the global scale: Model setup, results, and sensitivity. Environ. Res. Lett. 2013, 8. [Google Scholar] [CrossRef]
- Aerts, J.C.J.H.; Botzen, W.J.; Clarke, K.C.; Cutter, S.L.; Hall, J.W.; Merz, B.; Michel-Kerjan, E.; Mysiak, J.; Surminski, S.; Kunreuther, H. Integrating human behaviour dynamics into flood disaster risk assessment. Nat. Clim. Chang. 2018, 8, 193–199. [Google Scholar] [CrossRef] [Green Version]
- Khailani, D.K.; Perera, R. Mainstreaming disaster resilience attributes in local development plans for the adaptation to climate change induced flooding: A study based on the local plan of Shah Alam City, Malaysia. Land Use Policy 2013, 30, 615–627. [Google Scholar] [CrossRef]
- Chou, J.M.; Xian, T.; Dong, W.J.; Xu, Y. Regional Temporal and Spatial Trends in Drought and Flood Disasters in China and Assessment of Economic Losses in Recent Years. Sustainability 2019, 11, 55. [Google Scholar] [CrossRef] [Green Version]
- Yin, Y.X.; Chen, H.S.; Xu, C.Y.; Xu, W.C.; Chen, C.C.; Sun, S.L. Spatio-temporal characteristics of the extreme precipitation by L-moment-based index-flood method in the Yangtze River Delta region, China. Theor. Appl. Climatol. 2016, 124, 1005–1022. [Google Scholar] [CrossRef]
- Hirabayashi, Y.; Mahendran, R.; Koirala, S.; Konoshima, L.; Yamazaki, D.; Watanabe, S.; Kim, H.; Kanae, S. Global flood risk under climate change. Nat. Clim. Chang. 2013, 3, 816–821. [Google Scholar] [CrossRef]
- Vrijling, J.K.; Van Hengel, W.; Houben, R.J. A framework for risk evaluation. J. Hazard. Mater. 1995, 43, 245–261. [Google Scholar] [CrossRef]
- Ghosh, S.N. Flood Control and Drainage Engineering; CRC Press: Boca Raton, FL, USA, 1997. [Google Scholar]
- Needham, J.T.; Watkins, D.W., Jr.; Lund, J.R.; Nanda, S.K. Linear programming for flood control in the Iowa and Des Moines rivers. J. Water Resour. Plan. Manag. 2000, 126, 118–127. [Google Scholar] [CrossRef] [Green Version]
- Daanish, M. Structural causes of vulnerability to flood hazard in Pakistan. Econ. Geogr. 1998, 74, 289–305. [Google Scholar]
- Gro, H.B. Report of the World Commission on Environment and Development: Our Common Future; United Nations: New York, NY, USA, 1987. [Google Scholar]
- Pandey, R.; Bardsley, D.K. Social-ecological vulnerability to climate change in the Nepali Himalaya. Appl. Geogr. 2015, 64, 74–86. [Google Scholar] [CrossRef] [Green Version]
- Wang, J.; Wei, X.; Guo, Q. A three-dimensional evaluation model for regional carrying capacity of ecological environment to social economic development: Model development and a case study in China. Ecol. Indic. 2018, 89, 348–355. [Google Scholar] [CrossRef]
- Agrawala, S. Context and early origins of the Intergovernmental Panel on Climate Change. Clim. Chang. 1998, 39, 605–620. [Google Scholar] [CrossRef]
- Poortvliet, P.M.; Knotters, M.; Bergsma, P.; Verstoep, J.; van Wijk, J. On the communication of statistical information about uncertainty in flood risk management. Saf. Sci. 2019, 118, 194–204. [Google Scholar] [CrossRef]
- National Research Council. Flood Risk Management and the American River Basin: An Evaluation; National Academies Press: Washington, DC, USA, 1995. [Google Scholar]
- Enzel, Y.; Wells, S.G. Extracting Holocene paleohydrology and paleoclimatology information from modern extreme flood events: An example from southern California. Geomorphology 1997, 19, 203–226. [Google Scholar] [CrossRef]
- Bubeck, P.; Kreibich, H.; Penning-Rowsell, E.C.; Botzen, W.J.W.; de Moel, H.; Klijn, F. Explaining differences in flood management approaches in Europe and in the USA—A comparative analysis. J. Flood Risk Manag. 2017, 10, 436–445. [Google Scholar] [CrossRef]
- Criado, M.; Martínez-Graña, A.; San Román, J.; Santos-Francés, F. Flood risk evaluation in urban spaces: The study case of Tormes River (Salamanca, Spain). Int. J. Environ. Res. Public Health. 2019, 16, 5. [Google Scholar] [CrossRef] [Green Version]
- Hai, M.L.; Wen, J.S.; Shui, L.S.; Arul, A. Flood risk assessment in metro systems of mega-cities using a GIS-based modeling approach. Sci. Total Environ. 2018, 626, 1012–1025. [Google Scholar]
- Kotzee, I.; Reyers, B. Piloting a social-ecological index for measuring flood resilience: A composite index approach. Ecol. Indic. 2016, 60, 45–53. [Google Scholar] [CrossRef]
- Cuthbertson, J.; Rodriguez-Llanes, J.M.; Robertson, A.; Archer, F. Current and Emerging Disaster Risks Perceptions in Oceania: Key Stakeholders Recommendations for Disaster Management and Resilience Building. Int. J. Environ. Res. Public Health 2019, 16, 460. [Google Scholar] [CrossRef] [Green Version]
- Basheer, I.A.; Hajmeer, M. Artificial neural networks: Fundamentals, computing, design, and application. J. Microbiol. Methods 2001, 43, 3–31. [Google Scholar] [CrossRef]
- Mosavi, A.; Ozturk, P.; Chau, K.W. Flood prediction using machine learning models: Literature review. Water 2018, 10, 1536. [Google Scholar] [CrossRef] [Green Version]
- Xin, Y. Evolving artificial neural networks. Proc. IEEE 1999, 87, 1423–1447. [Google Scholar] [CrossRef] [Green Version]
- Huang, G.B.; Zhu, Q.Y.; Siew, C.K. Extreme learning machine: A new learning scheme of feedforward neural networks. Neural Netw. 2004, 2, 985–990. [Google Scholar]
- Zhang, J.R.; Zhang, J.; Lok, T.M.; Lyu, M.R. A hybrid particle swarm optimization–back-propagation algorithm for feedforward neural network training. Appl. Math. Comput. 2007, 185, 1026–1037. [Google Scholar] [CrossRef]
- Ding, S.F.; Su, C.Y.; Yu, J.Z. An optimizing BP neural network algorithm based on genetic algorithm. Artif. Intell. Rev. 2011, 36, 153–162. [Google Scholar] [CrossRef]
- Hsu, K.L.; Gupta, H.V.; Sorooshian, S. Artificial Neural Network Modeling of the Rainfall-Runoff Process. Water Resour. Res. 1995, 31, 2517–2530. [Google Scholar] [CrossRef]
- Ding, S.; Li, H.; Su, C.; Yu, J.; Jin, F. Evolutionary artificial neural networks: A review. Artif. Intell. Rev. 2013, 39, 251–260. [Google Scholar] [CrossRef]
- Yaseen, Z.M.; Sulaiman, S.O.; Deo, R.C.; Chau, K.W. An enhanced extreme learning machine model for river flow forecasting: State-of-the-art, practical applications in water resource engineering area and future research direction. J. Hydrol. 2018, 569, 387–408. [Google Scholar] [CrossRef]
- Chai, D.; Newsam, S.; Zhang, H.K.; Qiu, Y.; Huang, J. Cloud and cloud shadow detection in Landsat imagery based on deep convolutional neural networks. Remote Sens. Environ. 2019, 225, 307–316. [Google Scholar] [CrossRef]
- Mohamed, A.; Dahl, G.E.; Hinton, G. Acoustic modeling using deep belief networks. IEEE Trans. Audio Speech Lang. Process. 2011, 20, 14–22. [Google Scholar] [CrossRef]
- Moody, J.; Darken, C.J. Fast Learning in Networks of Locally-Tuned Processing Units. Neural Comput. 1989, 1, 281–294. [Google Scholar] [CrossRef]
- Alexandridis, A.; Chondrodima, E.; Sarimveis, H. Radial basis function network training using a nonsymmetric partition of the input space and particle swarm optimization. IEEE Trans. Neural Netw. Learn. Syst. 2012, 24, 219–230. [Google Scholar] [CrossRef] [PubMed]
- Dajun, D.; Kang, L.; Minrui, F. A fast multi-output RBF neural network construction method. Neurocomputing 2010, 73, 2196–2202. [Google Scholar]
- Lee, J.W.; Lee, J.B.; Park, M.; Song, S.H. An extensive comparison of recent classification tools applied to microarray data. Comput. Stat. Data Anal. 2005, 48, 869–885. [Google Scholar] [CrossRef]
- Pourghasemi, H.R.; Kerle, N. Random forests and evidential belief function-based landslide susceptibility assessment in Western Mazandaran Province, Iran. Environ. Earth Sci. 2016, 75, 185. [Google Scholar] [CrossRef]
- Youssef, A.M.; Pourghasemi, H.R.; Pourtaghi, Z.S.; Al-Katheeri, M.M. Landslide susceptibility mapping using random forest, boosted regression tree, classification and regression tree, and general linear models and comparison of their performance at Wadi Tayyah Basin, Asir Region, Saudi Arabia. Landslides 2016, 13, 839–856. [Google Scholar] [CrossRef]
- Li, G.F.; Tong, Y.Y.; Wang, H.M. Impact assessment of urbanization on flood risk in the Yangtze River Delta. Stoch. Environ. Res. Risk Assess. 2013, 27, 1683–1693. [Google Scholar] [CrossRef]
- Wan, H.; Zhong, Z.; Yang, X.; Li, X. Impact of city belt in Yangtze River Delta in China on a precipitation process in summer: A case study. Atmos. Res. 2013, 125, 63–75. [Google Scholar] [CrossRef]
- Wang, Z.; Lai, C.; Chen, X.; Zhao, S.; Bai, X. Flood hazard risk assessment model based on random forest. J. Hydrol. 2015, 527, 1130–1141. [Google Scholar] [CrossRef]
- Milly, P.C.D.; Wetherald, R.T.; Dunne, K.A.; Delworth, T.L. Increasing risk of great floods in a changing climate. Nature 2002, 415, 514–517. [Google Scholar] [CrossRef]
- Wang, Y.; Li, Z.; Tang, Z.; Zeng, G. A GIS-Based Spatial Multi-Criteria Approach for Flood Risk Assessment in the Dongting Lake Region, Hunan, Central China. Water Resour. Manag. 2011, 25, 3465–3484. [Google Scholar] [CrossRef]
- OECD. Environmental Indicators: A Preliminary Set; OECD: Paris, France, 1991. [Google Scholar]
- Berge, E. Air Pollution in Europe 1997; Jol, A., Kielland, G., Eds.; Office for Official Publications of the European Communities: Brussels, Belgium, 1997. [Google Scholar]
- Kazuva, E.; Zhang, J.Q.; Tong, Z.J.; Si, A.; Na, L. The DPSIR model for environmental risk assessment of municipal solid waste in dar es salaam city, Tanzania. Int. J. Environ. Res. Public Health 2018, 15, 1692. [Google Scholar] [CrossRef] [PubMed] [Green Version]
- Ness, B.; Anderberg, S.; Olsson, L. Structuring problems in sustainability science: The multi-level DPSIR framework. Geoforum 2010, 41, 479–488. [Google Scholar] [CrossRef]
- Speiser, J.L.; Miller, M.E.; Tooze, J.; Ip, E. A comparison of random forest variable selection methods for classification prediction modeling. Expert Syst. Appl. 2019, 134, 93–101. [Google Scholar] [CrossRef]
- Breiman, L. Random forests. Mach. Learn. 2001, 45, 5–32. [Google Scholar] [CrossRef] [Green Version]
- Robin, G.; Jean, M.P.; Malot, T.C. Variable selection using random forests. Pattern Recognit. Lett. 2010, 31, 2225–2236. [Google Scholar]
- Cootes, T.F.; Ionita, M.C.; Lindner, C.; Sauer, P. Robust and Accurate Shape Model Fitting Using Random Forest Regression Voting. IEEE Trans. Pattern Anal. Mach. Intell. 2015, 37, 1862–1874. [Google Scholar]
- Zhang, Y.; Yao, J.T. Gini objective functions for three-way classifications. Int. J. Approx. Reason. 2017, 81, 103–114. [Google Scholar] [CrossRef]
- Fotovatikhah, F.; Herrera, M.; Shamshirband, S.; Chau, K.W.; Ardabili, S.F.; Piran, M.J. Survey of computational intelligence as basis to big flood management: Challenges, research directions and future work. Eng. Appl. Comput. Fluid Mech. 2018, 12, 411–437. [Google Scholar] [CrossRef] [Green Version]
- Chen, S.; Chng, E.S.; Alkadhimi, K. Regularized orthogonal least squares algorithm for constructing radial basis function networks. Int. J. Control 1991, 64, 829–837. [Google Scholar] [CrossRef]
- Liu, C.Y.; Zheng, D.C.; Murray, A.; Liu, C.C. Modeling carotid and radial artery pulse pressure waveforms by curve fitting with Gaussian functions. Biomed. Signal Process. Control 2013, 8, 449–454. [Google Scholar] [CrossRef]
- Han, H.G.; Chen, Q.; Qiao, J.F. An efficient self-organizing RBF neural network for water quality prediction. Neural Netw. 2011, 24, 717–725. [Google Scholar] [CrossRef] [PubMed]
- Chen, S.Y.; Xue, Z.C.; Li, M.; Zhu, X.P. Variable sets method for urban flood vulnerability assessment. Sci. China Technol. Sci. 2013, 56, 3129–3136. [Google Scholar] [CrossRef]
- Chen, Y.B.; Zhou, H.L.; Zhang, H.; Du, G.M.; Zhou, J.H. Urban flood risk warning under rapid urbanization. Environ. Res. 2015, 139, 3–10. [Google Scholar] [CrossRef]
- Sikorska, A.E.; Viviroli, D.; Seibert, J. Flood-type classification in mountainous catchments using crisp and fuzzy decision trees. Water Resour. Res. 2015, 51, 7959–7976. [Google Scholar] [CrossRef]
- Shou, Y.C.; Zhi, C.X.; Min, L. Variable Sets principle and method for flood classification. Sci. China Technol. Sci. 2013, 56, 2343–2348. [Google Scholar]
- Cyrille, A.; Howard, B.; Allen, G.; Havelund, K.; Khurshid, S.; Lowry, M.; Pasareanue, C.; Roşu, G.; Sen, K.; Visser, W.; et al. Combining test case generation and runtime verification. Theor. Comput. Sci. 2005, 336, 209–234. [Google Scholar]
- Chau, K.W. Use of Meta-Heuristic Techniques in Rainfall-Runoff Modelling. Water 2017, 9, 186. [Google Scholar] [CrossRef]
- Ge, Y.; Xu, W.; Gu, Z.H.; Zhang, Y.C.; Chen, L. Risk perception and hazard mitigation in the Yangtze River Delta region, China. Nat. Hazards 2011, 56, 633–648. [Google Scholar] [CrossRef]
- Qiu, Y.; Liu, Y.; Liu, Y.; Chen, Y.Z.; Li, Y. An interval two-stage stochastic programming model for flood resources allocation under ecological benefits as a constraint combined with ecological compensation concept. Int. J. Environ. Res. Public Health 2019, 16, 1033. [Google Scholar] [CrossRef] [Green Version]
- Den Boer, J.; Dieperink, C.; Mukhtarov, F. Social learning in multilevel flood risk governance: Lessons from the Dutch Room for the River Program. Water 2019, 11, 2032. [Google Scholar] [CrossRef] [Green Version]
- Bonasia, R.; Lucatello, S. Linking Flood Susceptibility Mapping and Governance in Mexico for Flood Mitigation: A Participatory Approach Model. Atmosphere 2019, 10, 424. [Google Scholar] [CrossRef] [Green Version]
- Bertilsson, L.; Wiklund, K.; Tebaldi, I.D.; Rezende, O.M.; Verol, A.P.; Miguez, M.G. Urban flood resilience–A multi-criteria index to integrate flood resilience into urban planning. J. Hydrol. 2019, 573, 970–982. [Google Scholar] [CrossRef]
- Wang, W.C.; Chau, K.W.; Xu, D.M.; Qiu, L.; Liu, C.C. The annual maximum flood peak discharge forecasting using Hermite projection pursuit regression with SSO and LS method. Water Resour. Manag. 2017, 31, 461–477. [Google Scholar] [CrossRef]


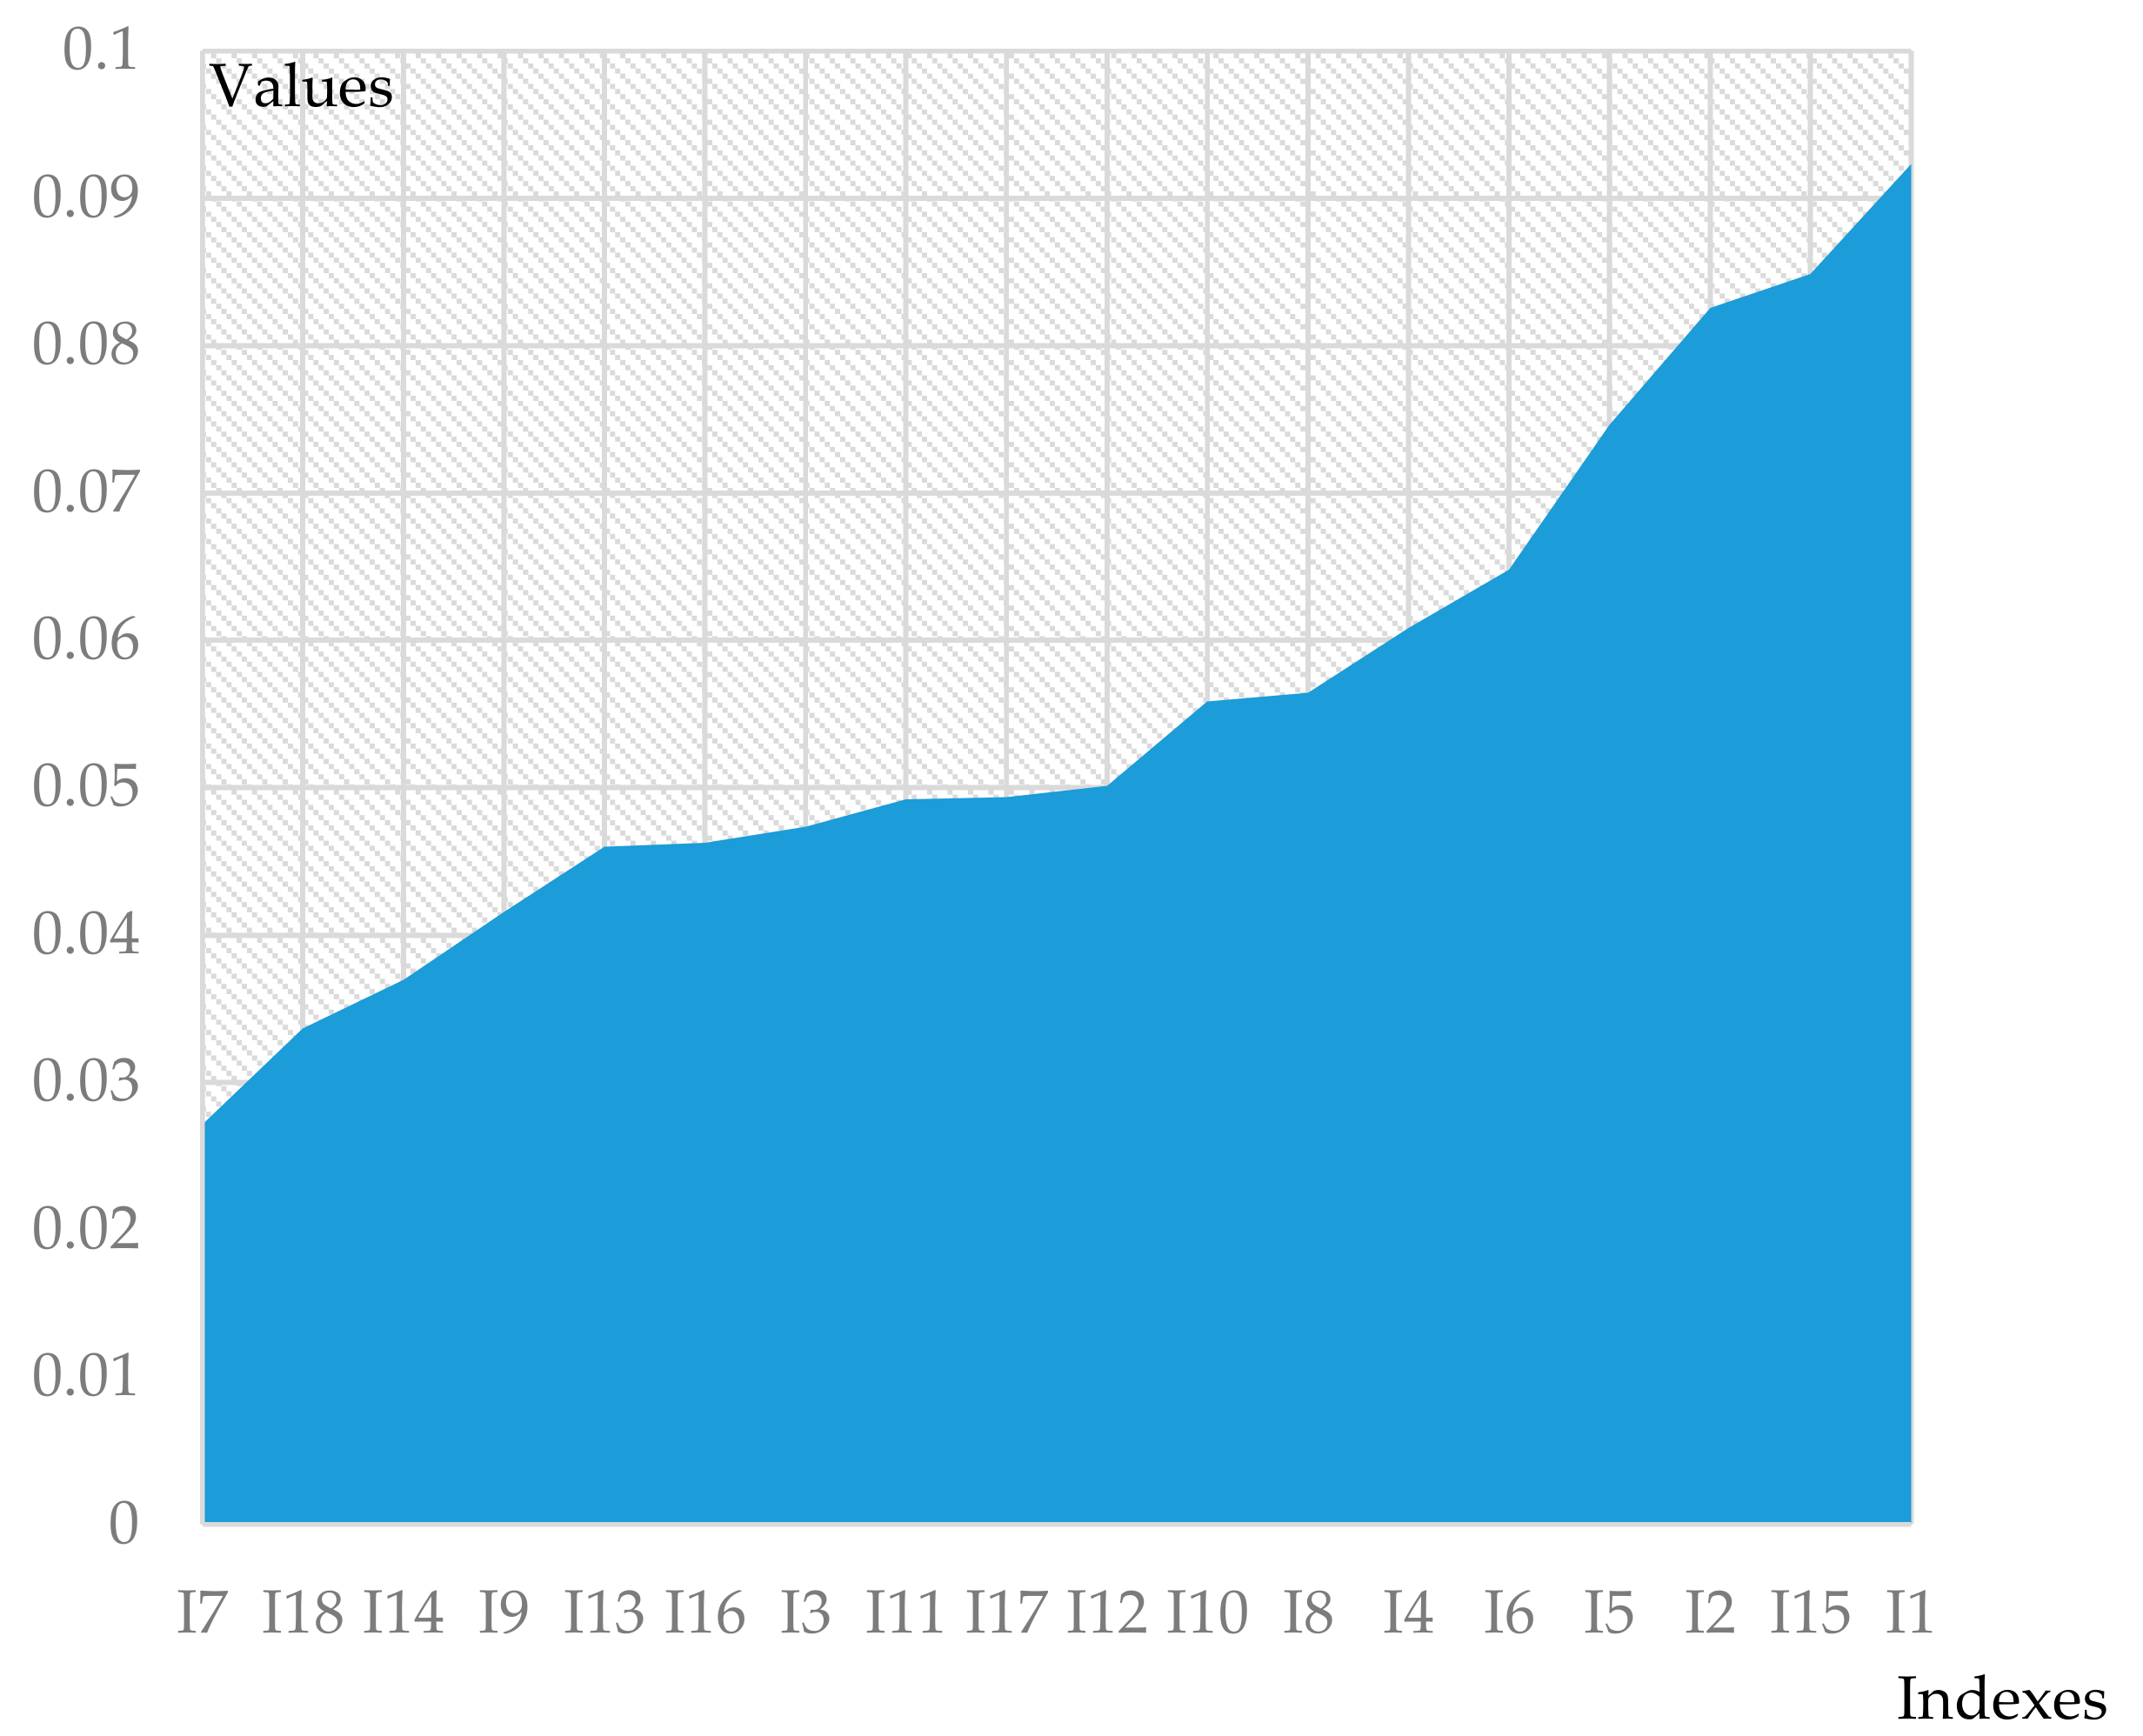
| Index Code | Index Name | Index Weight |
|---|---|---|
| I1 | Flood season rainfall (mm) | 0.0923 |
| I2 | Elevation (m) | 0.0826 |
| I3 | Urbanization rate (%) | 0.0473 |
| I4 | Population density (Person/km2) | 0.0608 |
| I5 | Urban impervious area ratio (%) | 0.0746 |
| I6 | GDP per square kilometer of land (¥0.1B/km2) | 0.0648 |
| I7 | Per capita water resources (L) | 0.0272 |
| I8 | Arable land per capita (10,000/km2) | 0.0564 |
| I9 | Water area ratio (%) | 0.0416 |
| I10 | Vegetation coverage (%) | 0.0559 |
| I11 | Density of highway network in built-up area (km/km2) | 0.0492 |
| I12 | Density of drainage network in built-up area (km/km2) | 0.0501 |
| I13 | Direct economic loss from flood disasters (¥0.1B) | 0.046 |
| I14 | Flood area population (10,000) | 0.037 |
| I15 | Municipal flood control investment per unit area (¥10,000) | 0.0849 |
| I16 | Public disaster response capacity | 0.0463 |
| I17 | Emergency rescue capacity of public administration departments | 0.0494 |
| I18 | Reserve and distribution capacity of flood control materials | 0.0337 |
| First-Class Indicator | Second-Class Indicator | I | II | III | IV | V |
|---|---|---|---|---|---|---|
| Driving factor | Flood season rainfall (mm) | 0–250 | 250–500 | 500–750 | 750–1000 | 1000–1250 |
| Elevation (m) | 100–20 | 20–15 | 15–10 | 10–5 | 5–0 | |
| Urbanization rate (%) | 0–0.4 | 0.4–0.5 | 0.5–0.6 | 0.6–0.7 | 0.7–1 | |
| Pressure factor | Population density (Persons/ km2) | 1000–1500 | 1500–2000 | 2000–2500 | 2500–3000 | 3000–5000 |
| Urban impervious area ratio (%) | 0–0.3 | 0.3–0.4 | 0.4–0.5 | 0.5–0.6 | 0.6–1 | |
| GDP per square kilometer of land (¥0.1B/km2) | 0–1 | 1–2 | 2–3 | 3–4 | 4–10 | |
| State factor | Arable land per capita (10,000/km2) | 0.5–0.2 | 0.2–0.15 | 0.15–0.1 | 0.1–0.05 | 0.05–0 |
| Water area ratio (%) | 0.5–0.2 | 0.2–0.15 | 0.15–0.1 | 0.1–0.05 | 0.05–0 | |
| Vegetation coverage (%) | 10–6 | 6–5 | 5–4 | 4–2 | 2–0 | |
| Density of highway network in built-up area (km/km2) | 0–5 | 5–6 | 6–7 | 7–8 | 8–9 | |
| Density of drainage network in built-up area (km/km2) | 35–20 | 20–15 | 15–10 | 10–5 | 5–0 | |
| Impact factor | Direct economic loss from flood disasters (¥0.1B) | 0–1.5 | 1.5–3 | 3–4.5 | 4.5–6 | 6–10 |
| Municipal flood control investment per unit area (¥10,000) | 30–12 | 12–9 | 9–6 | 6–3 | 3–0 | |
| Response factor | Public disaster response capacity | 100–85 | 85–80 | 80–75 | 75–70 | 70–0 |
| Emergency rescue capacity of public administration departments | 100–85 | 85–80 | 80–75 | 75–70 | 70–0 |
© 2019 by the authors. Licensee MDPI, Basel, Switzerland. This article is an open access article distributed under the terms and conditions of the Creative Commons Attribution (CC BY) license (http://creativecommons.org/licenses/by/4.0/).
Share and Cite
Chen, J.; Li, Q.; Wang, H.; Deng, M. A Machine Learning Ensemble Approach Based on Random Forest and Radial Basis Function Neural Network for Risk Evaluation of Regional Flood Disaster: A Case Study of the Yangtze River Delta, China. Int. J. Environ. Res. Public Health 2020, 17, 49. https://0-doi-org.brum.beds.ac.uk/10.3390/ijerph17010049
Chen J, Li Q, Wang H, Deng M. A Machine Learning Ensemble Approach Based on Random Forest and Radial Basis Function Neural Network for Risk Evaluation of Regional Flood Disaster: A Case Study of the Yangtze River Delta, China. International Journal of Environmental Research and Public Health. 2020; 17(1):49. https://0-doi-org.brum.beds.ac.uk/10.3390/ijerph17010049
Chicago/Turabian StyleChen, Junfei, Qian Li, Huimin Wang, and Menghua Deng. 2020. "A Machine Learning Ensemble Approach Based on Random Forest and Radial Basis Function Neural Network for Risk Evaluation of Regional Flood Disaster: A Case Study of the Yangtze River Delta, China" International Journal of Environmental Research and Public Health 17, no. 1: 49. https://0-doi-org.brum.beds.ac.uk/10.3390/ijerph17010049